")
Back to Journals » OncoTargets and Therapy » Volume 11
Prediction of tumor mutation burden in breast cancer based on the expression of ER, PR, HER-2, and Ki-67
Authors Xu J , Guo X, Jing M, Sun T
Received 14 December 2017
Accepted for publication 5 March 2018
Published 19 April 2018 Volume 2018:11 Pages 2269—2275
DOI https://doi.org/10.2147/OTT.S159830
Checked for plagiarism Yes
Review by Single anonymous peer review
Peer reviewer comments 4
Editor who approved publication: Dr Ingrid Espinoza
Junnan Xu,1,2 Xiangyu Guo,1 Mingxi Jing,1 Tao Sun1
1Department of Medical Oncology, Cancer Hospital of China Medical University, Liaoning Cancer Hospital and Institute, Shenyang, Liaoning, People’s Republic of China; 2Department of Medical Oncology, Key Laboratory of Liaoning Breast Cancer Research, Shenyang, Liaoning, People’s Republic of China
Objective: Cancer immunoediting is the process of eliminating highly immunogenic tumor cells by somatic evolution and protecting the host from tumor development in the host immune system. Frequencies of somatic mutations or tumor mutation burden (TMB) were associated with immunogenicity of breast cancer. This study aimed to predict the level of TMB in patients with breast cancer by the expression of estrogen (ER), progesterone (PR), HER-2, and Ki-67, thereby anticipating the prognosis of patients and the possible response to immunotherapy.
Patients and methods: In 53 patients with breast cancer, the 453 multigenes panel based on NGS was used to determine the TMB value of breast cancer in the patient’s primary tumor tissues. The predicted TMB value was divided into 4 groups: A (0–3.33), B (3.33–5.56), C (5.56–8.89), and D (>8.89), according to the quartile method, with group A as reference level. Logistic regression was used to analyze the risk ratio of each molecule type, and the prediction model was established. Survival probabilities by covariates were assessed using Kaplan–Meier estimator survival analysis and Cox’s proportional hazards models.
Results: In 53 patients, the TMB value measured by the NGS polygenic panel was between 0 and 14.4/Mb. TMB distribution in 53 cases of breast cancer tissue: 18 cases in A group, 22 cases in B group, 10 cases in C group, and 3 cases in D group. HER-2 expression positivity was significantly associated with TMB (HER-2 positive vs HER-2 negative, odds ratio [OR] =34.81, 95% confidence interval [CI]: 3.711–821.689, P=0.0065). Higher TMB was distributed in the patients who were Ki-67 expression positive (>14%) than those who were Ki-67 expression negative (≤14%) (OR =0.217, 95% CI: 0.054–0.806, P=0.0242). However, no significant differences of TMB were found between ER-positive group and ER-negative group (OR =3.133, 95% CI: 0.124–127.687, P=0.4954) and between PR-positive group and PR-negative group in terms of TMB (OR =1.702, 95% CI: 0.162–20.335, P=0.6492). The predicted model is TMB = -1.14×ER +0.53×PR +3.55×HER-2-1.53×Ki-67+ CONSTANT (INTERCEPT). Patients with low TMB had a better disease-free survival (DFS) than those with high TMB (83 vs 59 m, P=0.002). In a multivariate analysis, high TMB (>5.56) was an independent predictive factor for decreased DFS (adjusted hazard ratio [HR], 5.594; 95% CI: 1.694–18.473; P=0.005).
Conclusion: The preliminary results suggest that the level of TMB value in patients with breast cancer can be predicted based on the expression levels of ER, PR, HER-2, and Ki-67, which may indicate the prognostic and predictive value of immunotherapy in patients with breast cancer.
Keywords: breast cancer, tumor mutation burden, estrogen receptor, HER-2
Introduction
With the improvement of individual therapy and rapid precision medical, breast cancer was defined as a “chronic disease” with a favor survival. Comprehensive treatments are pivotal for the therapy of breast cancer, and these include surgery, chemotherapy, endocrine therapy, targeted therapy, and immunotherapy. Breast cancer is a heterogeneous disease1,2 and was traditionally classified based on the presence of the receptors for the steroid hormones estrogen (ER) and progesterone (PR), the epidermal growth factor receptor family member HER2, and proliferation index Ki-67.3 Many studies demonstrated that the immune system played a vital role in cancer, including in carcinogenesis, evading immunosurveillance, and inducing tumor tolerance. Cancer immunoediting is the process by which the immune system protects the host from tumor development. The catalog of somatic mutations found in each tumor type is indicative of the likelihood of the formation of antigens that differentiate cancer cells from their nontransformed counterparts.4 Tumor immunological checkpoint inhibitor therapy represents a completely different antitumor mechanism compared to tumor-targeted drug therapy that targets specific gene mutations. Immunotherapy has become a new promising treatment in the field of cancer therapy for its long effective duration and significant effect in specific patients. Also, the anti-PD-1 and PD-L1 inhibitors have been gradually entering into the clinical trial phase and approved in some tumors.5 How to choose the suitable patients with breast cancer for receiving immunotherapy is a crucial hot topic of clinical immunotherapy.
Recently, tumor mutation burden (TMB) has been suggested as a new biomarker with good prospect to predict the efficacy of tumor immunotherapy.6 From the evidence provided by the approved indications and pivotal clinical trials, controversy exist whether PD-L1 expression can guide clinical medication and determine those who will benefit. At present, there is no uniform standard of testing of PD-L1 expression. The potential biomarkers that are widely investigated mainly focused on TMB, microsatellite instability-high (MSI-H), and mismatch-deficiency (MMR). Aberrant MMR and MSI were defined as evaluable biomarkers to determine the suitable patients treated with immunotherapy.7 However, the ratio of aberrant MMR and MSI was lower in breast cancer than in lung cancer in clinical. A retrospective study, using TMB as a marker on the Phase III clinical trial of CheckMate 026, suggested that TMB was superior to PD-L1 as a biomarker to distinguish between those who would benefit from Opdivo in non-small-cell lung cancer.8 However, fewer reports of TMB are present in breast cancer. TMB value may be relatively high in triple-negative breast cancer (TNBC) with increasing pathogenic germline mutations in high- and moderate-risk breast cancer genes, but the mechanism is still unclear. This study aims to explore the predictive value of TMB base on ER, PR, HER-2, and Ki-67 in breast cancer patients, thereby enabling the prediction of the prognosis and the sensitivity of immunotherapy.
Patients and methods
Patients
Fifty-three female patients with breast cancer were enrolled from March 2011 to October 2016 in Liaoning Cancer Hospital & Institute. The patients were enrolled according to the following criteria: female patients with diagnosis of breast cancer and adequate samples (tissue sections containing >30% tumor cells were selected) for analysis. This study was approved by the Liaoning Cancer Hospital and Institute ethical committee (approval number: 20150903). All samples were obtained with the patient’s written informed consent. Among study participants, 53 patients (medium age, 49 years; age range, 26–79 years) were included in this study. All the tumors were histopathologically identified as invasive ductal type. ER, PR, HER-2, and Ki-67 expression were assessed by immunohistochemistry in a central laboratory. ER and PR staining were scored according to the Allred method as previously described.9
Tissue samples and blood
Formalin-fixed paraffin-embedded slices from primary tumor tissue (5 pieces, 5 μm in thickness) and 8 mL whole blood (using EDTA vacuum anticoagulation tube) were collected from each patient. Plasma and blood cells were centrifuged (temperature of 4°C at 1,800× g for 10 minutes) within 2 hours after sampling. Blood cell DNA was used as a high-throughput sequencing negative control sample. Negative control DNA was extracted from plasma samples and blood cell samples according to method provided in the QIAGEN DNA Extraction Kit (Qiagen, Hilden, Germany) and was purified by sonication.
Sequence data processing
Base calling was performed on bcl2fastq v2.16.0.10 (Illumina, Inc., San Diego, CA, USA) to generate sequence reads in FASTQ format (Illumina 1.8+ encoding). Quality control was performed with Trimmomatic. High-quality reads were mapped to the human genome (hg19, GRCh37 Genome Reference Consortium Human Reference 37) using the BWA aligner v0.7.12 with BWA-MEM algorithm and default parameters. The Genome Analysis Toolkit (GATK, version 3.4-0, Broad Institute, Cambridge, MA, USA) was used to locally realign the BAMs files at intervals with indel mismatches and recalibrate base quality scores of reads in BAM files.
Somatic mutation detection and calculation of TMB
VarScan (2.3.7) was employed for detection of somatic variants (somatic P-value =0.1, minimum quality score =15 and otherwise default parameters) using BAM files from both normal control and tumor samples. We further filtered candidate somatic variants based on various criteria: 1) not present in a segmental duplication region or a region with mapping score <2; 2) at least 3 distinct reads with different mapping positions (reads with the same mapping positions are more likely duplicates) supporting variant alleles; and 3) reads supporting variant alleles should be located on both strands. Annotation was performed using ANNOVAR (Qiagen Bioinformatics, Redwood City, CA, USA) using the hg19 reference genome and 2016 versions of standard databases and functional prediction programs. TMB was defined as the number of somatic, nonsilent, base substitution, and indel mutations per megabase of the genome examined.
Statistical analysis
All data were analyzed with SPSS 20.0 software (IBM Corporation, Armonk, NY, USA). The predicted TMB value was divided into 4 groups: A (0–3.33), B (3.33–5.56), C (5.56–8.89), and D (>8.89), according to the quartile method, with group A as reference level. Logistic regression was used to analyze the risk ratio of each molecule, and the prediction model was established. Disease-free survival (DFS) was defined as the time from the date of surgery to the date of first relapse, second primary malignancy, or death resulting from any cause. The probability of postoperative DFS was derived from a Kaplan–Meier estimate, and the differences between the survival curves were compared using the log-rank test. The effects of TMB and other possible risk factors on DFS were assessed by a Cox proportional hazards regression using a univariate or multivariate analysis with adjusted hazard ratios (HRs) and associated 95% confidence intervals (95% CI). Statistical significance was set at P<0.05. All reported P-values are 2-sided.
Results
TMB distribution in breast cancer patients
As shown in Table 1, a total of 53 patients were available in this study. Median age of the patients was 46 (range from 31 to 70). In this cohort, the majority presented with ER-positive (71.7%), PR-positive (66.04%), and HER2-negative (83.02%) disease. 27 cases (50.94%) were postmenopausal; 20 cases (37.74%) had a tumor size <2 cm; 39 cases (54.72%) had lymph node-positive disease; 31 cases (58.49%) were Ki-67 positive. In 53 patients, the TMB value measured by the NGS polygenic panel was between 0 and 14.4/Mb. TMB distribution in the 53 cases of breast cancer were as follows: 18 cases in A group, 22 cases in B group, 10 cases in C group, and 3 cases in D group.
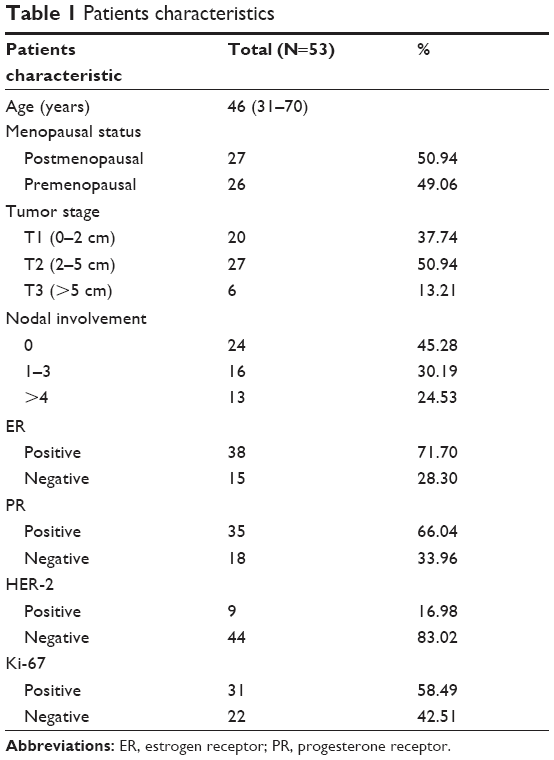 | Table 1 Patients characteristics |
Quartile groups distribution of TMB in ER/PR/HER2/Ki-67
The mutation value of TMB is presented for one case in Figure 1. A 56-year-old female patient was diagnosed with breast cancer in December 2012. She underwent modified radical mastectomy and the pathologic review documented ER (70%+), PR (20%+), HER-2++, and Ki-67 (35%). After a long DFS of 38 months, she was diagnosed with bone metastases. The TMB value from primary tissue was 1.1 by NGS. The TMB of this case was relatively small in the group distribution. Table 2 shows the distribution of ER/PR/HER2/Ki-67 of the studied patients in the 4 TMB groups. Significant differences were observed between ER positivity and ER negativity in TMB A group (24.53% and 9.43%, P=0.032), TMB B group (28.30% and 13.21%, P=0.038), and TMB C group (15.09% and 3.77%, P=0.026). However, there was no significant difference between ER positivity and ER negativity in TMB D group (3.77% and 1.89%, P=0.432). The other distributions and classifications of PR, HER2, and Ki-67 are shown in Table 2. Among them, the majority was distributed in the group B, and these patients tended to be ER positive, PR positive, HER-2 negative, and Ki-67 positive.
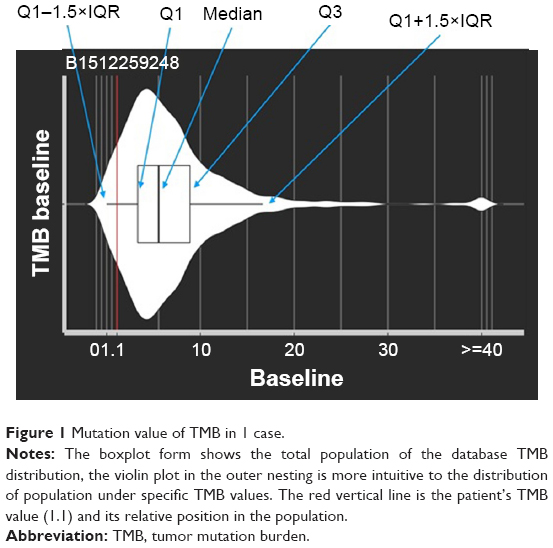 | Figure 1 Mutation value of TMB in 1 case. |
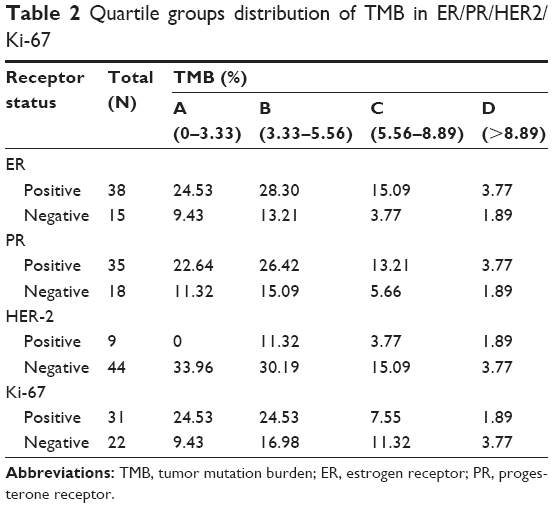 | Table 2 Quartile groups distribution of TMB in ER/PR/HER2/Ki-67 |
OR values of TMB distribution in ER/PR/HER2/Ki-67
The results of univariate analyses demonstrated that HER-2 expression positivity was significantly associated with TMB (HER-2 positive vs HER-2 negative, odds ratio [OR] =34.81, 95% CI: 3.711–821.689, P=0.0065). Higher TMB was distributed in the patients with Ki-67 expression positivity (>14%) than those with Ki-67 expression negativity (≤14%) (OR =0.217, 95% CI: 0.054–0.806, P=0.0242). However, no significant differences of TMB were found in ER-positive and ER-negative group (OR =3.133, 95% CI: 0.124–127.687, P=0.4954), and the distribution of TMB value between PR-positive group and PR-negative group was similar (OR =1.702, 95% CI: 0.162–20.335, P=0.6492), as shown in Figure 2.
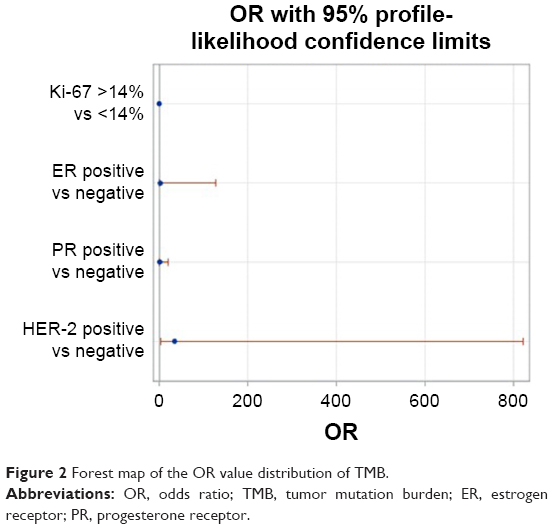 | Figure 2 Forest map of the OR value distribution of TMB. |
Establish a prediction model based on ER/PR/HER2/Ki-67
The prediction model was established using the cumulative logistic regression model, and the influence of each factor on the classification of different TMB grades was the same. The P-value of the hypothesis test was 0.90, OR (TMB = D vs TMB < D) = OR (TMB = C vs TMB < C) = OR (TMB ≥ B vs TMB = A). The R2 and Max-rescaled R2 methods were used to evaluate the prediction model (R2 =0.2483, Max-rescaled R2 =0.2726, P=0.8951), all ORs were in parallel. The predicted model is TMB = −1.14×ER +0.53×PR +3.55×HER-2–1.53×Ki-67+ CONSTANT (INTERCEPT). Log [P (TMB = D)/P (TMB < D)] = −1.14×ER +0.53×PR +3.55×HER-2–1.53×Ki-67–4.10. The results represent the probability of the sample classification to the TMB = D and the probability ratio of the sample classification to TMB = A, B, and C. Log [P (TMB ≥ C)/P (TMB < C)] = −1.14×ER +0.53×PR +3.55×HER-2–1.53×Ki-67–2.31. The results indicate that the probability of sample classification to TMB = C, D and the probability ratio of sample classification to TMB = A, B. Log [P (TMB ≥ B)/P (TMB = A)] = –1.14×ER +0.53×PR +3.55×HER-2–1.53×Ki-67–0.11. The results show that the probability of sample classification to TMB = B, C, D and the probability ratio of sample classification to TMB = A.
Elevated TMB was associated with poor DFS and was an independent predictive factor for reduced DFS
Using the log-rank test, significant differences were observed in the DFS curve in terms of TMB (Figure 3). Patients with high TMB (>5.56) had a poor DFS than those with low TMB (83 vs 59 m, P=0.005). A univariate analysis of the relationships between tumor characteristics and patient outcome indicated that lymph node status and level of TMB were significantly associated with DFS (P<0.05), whereas no significant prognostic values (P>0.05) were found with menopausal status, tumor size, and ER, PR, HER-2, and Ki-67, as listed in Table 3. A Cox proportional hazard regression model was used to determine factors that were independent or joint predictors of DFS. The multivariate analysis indicated that TMB level was an independent risk factor for DFS (adjusted HR, 5.594; 95% CI: 1.694–18.473; P=0.005); lymph node status was also significantly correlated with poor DFS (adjusted HR, 5.538; 95% CI: 1.482–20.696; P=0.011).
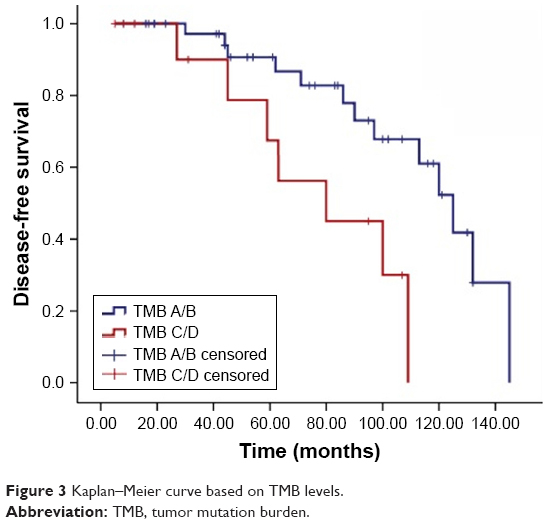 | Figure 3 Kaplan–Meier curve based on TMB levels. |
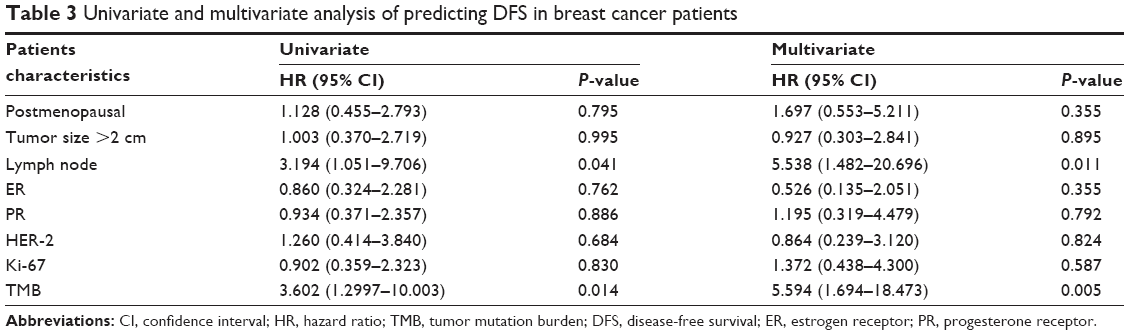 | Table 3 Univariate and multivariate analysis of predicting DFS in breast cancer patients |
Discussion
Breast cancer is a heterogeneous disease and was traditionally classified based on the presence of the receptors for the steroid hormones ER and PR, the epidermal growth factor receptor family member HER2, and proliferation index Ki-67.3 In addition to histological heterogeneity, breast cancer molecularly with transcriptional profiles defining five intrinsic molecular subtypes.10 Many studies demonstrated that the immune system played a vital role in cancer, including in carcinogenesis, evading immunosurveillance, and inducing tumor tolerance. Cancer immunoediting is the process by which the immune system protects the host from tumor development. The catalog of somatic mutations found in each tumor type is indicative of the likelihood of the formation of antigens that differentiate cancer cells from their nontransformed counterparts.4 These neoantigens are often products of mutated cellular genes, aberrantly expressed normal genes, or genes encoding viral proteins.11 The prevalence of somatic mutations in breast tumors is comparable to many other tumors of solid origin (ranging 33–66 per tumor) but much lower compared to the highly immunogenic and highly mutated tumors such as melanoma or lung cancer that display about 200 nonsynonymous mutations per tumor.12–14 In our study, the TMB value measured by the NGS polygenic panel was between 0 and 14.4/Mb. TMB that was by sequencing and Targeted DNA sequencing was lower than those calculated with whole-genome sequencing and whole-exome sequencing. However, TMB trend from targeted DNA sequencing was consistent with TMB from whole-genome sequencing. The mutation rate was lowest in luminal A molecular subtype and highest in the basal-like and HER2 subtypes.15 Similarly, our observation results suggested that the majority of tumors was ER positive, PR positive, HER-2 negative, and Ki-67 positive and distributed in the TMB B group (3.33–5.56). Breast cancers have low expression of MHC I antigens and relatively low state of immunogenicity to escape from immune recognition.16–18 However, breast cancers with high TMB value were indicative of potentially more neoantigens and elicited an appropriate adaptive immune response with immunotherapy. In support of this, a retrospective study using TMB as a marker in the Phase III clinical trial of CheckMate 026 showed that TMB was superior to PD-L1 expression as a biomarker to distinguish those who would benefit from Opdivo in non-small-cell lung cancer. The study found that ORR was significantly higher in the patients with high TMB value (Opdivo vs chemotherapy, 47% vs 28%).8 Moreover, fewer reports regarding TMB in breast cancer exist. The incidence of breast cancer is not significantly higher in therapeutically immunosuppressed populations.19
Even though cancer-associated immunogens are not highly common in breast cancer, the literature provides clear examples of neoantigen recognition and the generation of an immune response. In a small patient cohort with HER2+ breast cancer, the results demonstrated CD4+ helper/inducer T-cell immunity and antibody-mediated immunity to HER-2/neu protein.20 A lower level of HER2 T-cell immunity has been proposed as a prognostic marker of increased risk of treatment failure in invasive breast cancer patients.21 The results of univariate analyses demonstrated that HER-2 expression positivity was significantly associated with TMB (HER-2 positive vs HER-2 negative, OR =34.81, 95% CI: 3.711–821.689, P=0.0065). In another study (data from TCGA), the results confirmed that HER2− tumors have a marginally significant (P=0.02, Wilcox rank-sum test) lower TMB than HER2+ tumors (data not shown). The median TMB is 38 and 46 for HER2− and HER2+ patients, respectively. Interesting, lower TMB was distributed in the patients with Ki-67 expression positivity (>14%) than those with Ki-67 expression negativity (≤14%) (OR =0.217, 95% CI: 0.054–0.806, P=0.0242). Normally, Ki-67 expression positivity was correlated with HER2-positive or TNBC; however, lower TMB was inclined to Ki-67 positive, especially in TMB A group. We will further confirm this with improvement of study condition and augmentation of sample size. However, no significant differences of TMB were found between the ER-positive and ER-negative group (OR =3.133, 95% CI: 0.124–127.687, P=0.4954), and the distribution of TMB value between PR-positive group and PR-negative group was similar (OR =1.702, 95% CI: 0.162–20.335, P=0.6492). TMB value may be relatively high in TNBC, but it cannot be predicted through clinical features for now. Our results suggested that immunotherapy may be considered in patients with HER-2 positive breast cancer, not just TNBC. According to the preliminary results, the TMB prediction model of breast cancer was TMB = −1.14×ER +0.53×PR +3.55×HER-2–1.53×Ki-67+ CONSTANT (INTERCEPT). The intensity of the tumor–immune interaction varies in each breast cancer subtype. Gene expression analysis has identified breast tumors that present with elevated levels of immunomodulatory gene activation.22 These signatures are prognostic, particularly in the triple-negative (ER−, PR−, and Her2−) and HER2+/ER− breast cancer subtypes.23 In luminal breast cancer, a high B cell/plasma cell signature was found to be prognostic in patients with more highly proliferative ER+ breast cancer who received tamoxifen treatment, but had no prognostic value in patients with low-proliferative ER+ cancer.24 In general, patients having tumors with a Th1 CTL cytokine profile have a better prognosis than those with a Th2 profile or a pattern of tumor-associated macrophages infiltration via CSF1 recruitment.25 Recently, marker gene expression was used to analyze infiltration of various immune cell types. In another study, we analyzed 4 major immune cell types, including CD4+ T cells, CD8+ T cells, B cells, and NK cells. We compared the expression levels of marker gene-sets for each cell type between different BC subtypes. We found significantly (P<0.001, Wilcox rank-sum test) higher expression levels of each immune marker gene in HR− patients compared to HR+ patients. In contrast, HER2+ patients showed significantly (P<0.001, Wilcox rank-sum test) increased expression of most immune marker genes compared to HER2− patients (data not shown).
We further investigated whether TMB was associated with DFS in early breast cancer. Our results revealed that patients with high TMB had poor DFS (83 vs 59 m, P=0.005). A univariate and multivariate analysis of the relationships between tumor characteristics and patient outcome indicated that lymph node status was significantly associated with DFS (P<0.05), which is consistent with previous study.26 The level of TMB appeared to be associated with poor DFS rates and was an independent risk factor for DFS.
Some limitations of the current study should be acknowledged. First, the interaction between TMB level and immunotherapy efficacy was not evaluated in our study. In our cohort, no patient received immunotherapy agents, such anti-PD-1 and anti-PD-L1 agents. Second, short follow-up time in our study may make the survival data inaccurate. Third, the relatively small sample size may be result in susceptibility to false-positive conclusions. In addition, TMB level can be inaccurate if the breast cancer tissue was stored for several years.
Conclusion
The TMB value in patients with breast cancer can be predicted based on the expression levels of ER, PR, HER-2, and Ki-67 and may indicate the prognostic and predictive value of immunotherapy in patients with breast cancer.
Acknowledgment
The present study was supported by the Liaoning Province Doctor Startup Fund Program (grant no 201501108), National Nature Science Foundation (grant no 81502188), National Natural Science Foundation of Liaoning (grant no 2015020251), Central Guidance for Special Funds (2016007011), and the Clinical Capability Construction Project for Liaoning Provincial Hospitals (grant no LNCCC-C05-2015).
Disclosure
The authors report no conflicts of interest in this work.
References
Caswell DR, Swanton C. The role of tumor heterogeneity and clonal cooperativity in metastasis, immune evasion and clinical outcome. BMC Med. 2017;15(1):133. | ||
Polyak K. Heterogeneity in breast cancer. J Clin Invest. 2011;121(10):3786–3788. | ||
Osako T, Iwase T, Ushijima M, Yonekura R, Ohno S, Akiyama F. A new molecular-based lymph node staging classification determines the prognosis of breast cancer patients. Br J Cancer. 2017;117(10):1470–1477. | ||
Schumacher TN, Schreiber RD. Neoantigens in cancer immunotherapy. Science. 2015;348(6230):69–74. | ||
Chen L, Han X. Anti-PD-1/PD-L1 therapy of human cancer: past, present, and future. J Clin Invest. 2015;125(9):3384–3391. | ||
García-Saenz JA, Ayllón P, Laig M, et al. Tumor burden monitoring using cell-free tumor DNA could be limited by tumor heterogeneity in advanced breast cancer and should be evaluated together with radiographic imaging. BMC Cancer. 2017;17(1):210. | ||
Bupathi M, Wu C. Biomarkers for immune therapy in colorectal cancer: mismatch-repair deficiency and others. J Gastrointest Oncol. 2016;7(5):713–720. | ||
Carbone DP, Reck M, Paz-Ares L, et al. First-line nivolumab in stage IV or recurrent non-small-cell lung cancer. N Engl J Med. 2017;376(25):2415–2426. | ||
Martín M, Rodríguez-Lescure A, Ruiz A, et al. Molecular predictors of efficacy of adjuvant weekly paclitaxel in early breast cancer. Breast Cancer Res Treat. 2010;123(1):149–157. | ||
Prat A, Parker JS, Karginova O, et al. Phenotypic and molecular characterization of the claudin-low intrinsic subtype of breast cancer. Breast Cancer Res. 2010;12(5):R68. | ||
Turajlic S, Litchfield K, Xu H, et al. Insertion-and-deletion-derived tumor-specific neoantigens and the immunogenic phenotype: a pan-cancer analysis. Lancet Oncol. 2017;18(8):1009–1021. | ||
Winther-Larsen A, Demuth C, Fledelius J, et al. Correlation between circulating mutant DNA and metabolic tumor burden in advanced non-small cell lung cancer patients. Br J Cancer. 2017;117(5):704–709. | ||
Alexandrov LB, Nik-Zainal S, Wedge DC, et al. Signatures of mutational processes in human cancer. Nature. 2013;500(7463):415–421. | ||
Vogelstein B, Papadopoulos N, Velculescu VE, Zhou S, Diaz LA Jr, Kinzler KW. Cancer genome landscapes. Science. 2013;339(6127):1546–1558. | ||
Koboldt DC, Fulton RS, McLellan MD, et al; Cancer Genome Atlas Network. Comprehensive molecular portraits of human breast tumors. Nature. 2012;490(7418):61–70. | ||
Ross JS, Gay LM. Comprehensive genomic sequencing and the molecular profiles of clinically advanced breast cancer. Pathology. 2017;49(2):120–132. | ||
Shaw JA, Guttery DS, Hills A, et al. Mutation analysis of cell-free DNA and single circulating tumor cells in metastatic breast cancer patients with high circulating tumor cell counts. Clin Cancer Res. 2017;23(1):88–96. | ||
Rizvi W, Truong P, Truong Q. Metastatic breast cancer with BRCA mutation discovered by next-generation sequencing responding to olaparib. Cureus. 2017;9(6):e1337. | ||
Gallagher MP, Kelly PJ, Jardine M, et al. Long-term cancer risk of immunosuppressive regimens after kidney transplantation. J Am Soc Nephrol. 2010;21(5):852–858. | ||
Disis ML, Calenoff E, McLaughlin G, et al. Existent T-cell and antibody immunity to HER-2/neu protein in patients with breast cancer. Cancer Res. 1994;54(1):16–20. | ||
Datta J, Fracol M, McMillan MT, et al. Association of depressed anti-HER2 T-helper type 1 response with recurrence in patients with completely treated HER2-positive breast cancer: role for immune monitoring. JAMA Oncol. 2016;2(2):242–246. | ||
Yau C, Esserman L, Moore DH, Waldman F, Sninsky J, Benz CC. A multigene predictor of metastatic outcome in early stage hormone receptor-negative and triple-negative breast cancer. Breast Cancer Res. 2010;12(5):R85. | ||
Desmedt C, Haibe-Kains B, Wirapati P, et al. Biological processes associated with breast cancer clinical outcome depend on the molecular subtypes. Clin Cancer Res. 2008;14(16):5158–5165. | ||
Bianchini G, Qi Y, Alvarez RH, et al. Molecular anatomy of breast cancer stroma and its prognostic value in estrogen receptor-positive and -negative cancers. J Clin Oncol. 2010;28(28):4316–4323. | ||
DeNardo DG, Brennan DJ, Rexhepaj E, et al. Leukocyte complexity predicts breast cancer survival and functionally regulates response to chemotherapy. Cancer Discov. 2011;1(1):54–67. | ||
Habraken V, van Nijnatten TJ, de Munck L, et al. Dose the TNM classification of solitary internal mammary lymph node metastases in breast cancer still apply? Breast Cancer Res Treat. 2017;161(3):483–489. |
 © 2018 The Author(s). This work is published and licensed by Dove Medical Press Limited. The full terms of this license are available at https://www.dovepress.com/terms.php and incorporate the Creative Commons Attribution - Non Commercial (unported, v3.0) License.
By accessing the work you hereby accept the Terms. Non-commercial uses of the work are permitted without any further permission from Dove Medical Press Limited, provided the work is properly attributed. For permission for commercial use of this work, please see paragraphs 4.2 and 5 of our Terms.
© 2018 The Author(s). This work is published and licensed by Dove Medical Press Limited. The full terms of this license are available at https://www.dovepress.com/terms.php and incorporate the Creative Commons Attribution - Non Commercial (unported, v3.0) License.
By accessing the work you hereby accept the Terms. Non-commercial uses of the work are permitted without any further permission from Dove Medical Press Limited, provided the work is properly attributed. For permission for commercial use of this work, please see paragraphs 4.2 and 5 of our Terms.