")
Back to Journals » International Journal of General Medicine » Volume 15
Prediction Models for Prognosis of Femoral Neck–Fracture Patients 6 Months after Total Hip Arthroplasty
Authors Zheng X, Xiao C, Xie Z, Liu L, Chen Y
Received 21 December 2021
Accepted for publication 2 March 2022
Published 21 April 2022 Volume 2022:15 Pages 4339—4356
DOI https://doi.org/10.2147/IJGM.S347425
Checked for plagiarism Yes
Review by Single anonymous peer review
Peer reviewer comments 2
Editor who approved publication: Dr Scott Fraser
Xiaofeng Zheng,1,* Cong Xiao,1,* Zhuocheng Xie,2 Lijuan Liu,1 Yinhua Chen1
1Department of Orthopedics, Third Hospital of Mianyang Sichuan Mental Health Center, Mianyang, Sichuan, 621000, People’s Republic of China; 2Department of Orthopedics, Sichuan Science City Hospital, Mianyang, Sichuan, 621000, People’s Republic of China
*These authors contributed equally to this work
Correspondence: Yinhua Chen, Department of Orthopedics, Third Hospital of Mianyang Sichuan Mental Health Center, 190 East Jiannan Road, Youxian, Mianyang, Sichuan, 621000, People’s Republic of China, Tel +86-139-9014-7729, Email [email protected]
Purpose: To establish prediction models for 6-month prognosis in femoral neck–fracture patients receiving total hip arthroplasty (THA).
Patients and Methods: In total, 182 computed tomography image pairs from 85 patients were collected and divided into a training set (n=127) and testing set (n=55). Least absolute shrinkage–selection operator regression was used for selecting optimal predictors. A random-forest algorithm was used to establish the prediction models, which were evaluated for accuracy, sensitivity, specificity, positive predictive value (PPV), negative predictive value (NPV), and area under the curve (AUC).
Results: The best model in this study was constructed based on demographic data, preoperative laboratory indicators, and three preoperative radiomic features. In the random-forest model, activated partial thromboplastin time, a preoperative radiomic feature (maximum diameter), and fibrinogen were important variables correlating with patient outcomes. The AUC, sensitivity, specificity, PPV, NPV, and accuracy in the training set were 0.986 (95% CI 0.971– 1), 0.925 (95% CI 0.862– 0.988), 0.983 (95% CI 0.951– 1.016), 0.984 (95% CI 0.953– 1.014), 0.922 (95% CI 0.856– 0.988), and 0.953 (95% CI 0.916– 0.990), respectively. The AUC, sensitivity, specificity, PPV, NPV, and accuracy in the testing set were 0.949 (95% CI 0.885– 1), 0.767 (95% CI 0.615– 0.918), 1 (95% CI 1– 1), 1 (95% CI 1– 1), 0.781 (95% CI 0.638– 0.924), and 0.873 (95% CI 0.785– 0.961), respectively.
Conclusion: The model based on demographic, preoperative clinical, and preoperative radiomic data showed the best predictive ability for 6-month prognosis in the femoral neck–fracture patients receiving THA.
Keywords: prediction model, total hip arthroplasty, computed tomography, prognosis, femoral neck fracture
Introduction
Fractures of the femoral neck low-energy injuries associated with decreased quality of life and increased mortality.1 Currently, nearly 70% of patients with femoral neck fractures are treated with arthroplasty, which has been reported to be superior than the traditional open reduction and internal fixation.2 In recent years, total hip arthroplasty (THA) has been more frequently used.3 THA is reported to be associated with less pain, higher functional scores, and a lower risk of reoperation.4 Some patients receiving THA may have poor prognoses. A high risk of dislocation has been identified in patients receiving THA.5 Some patients are unable to regain their preinjury level of function after THA.6 Deficits in lower-limb strength, balance, and gait may persist for months to years after surgery.7,8 Predicting the prognosis of these patients undergoing THA is still of great importance to provide timely interventions for those at high risk of poor outcomes after THA treatment and improve their prognoses.
Prognosis of THA patients has been reported to be influenced by age, body-mass index (BMI), comorbidities,9 and time to operation.10 Maceroli et al reported that the health status of femoral neck–fracture patients was a critical factor influencing outcomes following THA.11 Hematocrit (Hct) and coagulation function–associated biomarkers, including prothrombin time (PT) and activated partial thromboplastin time (APTT) are also important predictors of surgical site infection or coagulation and reduction of bleeding, which further affects outcomes.12,13 At present, there is no prediction model for predicting THA-patient prognosis.
Radiomics is a way comprehensive mining of quantitative standard-of-care medical image features to capture disease characteristics that are difficult to identify by vision alone.14 Using radiomics can help improve diagnostic and/or predictive performance in the clinic.15 Computed tomography (CT) is a diagnosis tool for femoral neck fractures and provides preoperative evaluation for helping to choose the best treatment and provide better surgical and clinical outcomes.16,17 Quantitative analysis of bone-texture features from CT scans has been actively applied to evaluate the status, quality, or microarchitecture of bones.18 Park et al demonstrated the value of CT in prediction of avascular necrosis after femoral neck fracture.19 Therefore, radiomic mining information from CT scans in femoral neck–fracture patients might also be a vital predictor of prognosis in patients undergoing THA. This study was aimed at establishing several prediction models for the Harris Hip Scale (HHS) scores 6 months post-THA based on preoperative clinical characteristics, postoperative clinical characteristics, perioperative clinical characteristics, and CT characteristics based on the data of 85 patients who received THA in the Third People’s Hospital of Mianyang. The predictive performances of these prediction models were compared to identify the best model for predicting the prognosis of femoral neck–fracture patients receiving THA.
Methods
Study Population
Data on 85 femoral neck–fracture patients receiving THA treatment and hospitalized in the Department of Orthopedics, Third People’s Hospital of Mianyang from May 2018 to July 2020 were collected. Patients diagnosed with femoral neck fractures via X-ray and CT and receiving THA were included. Patients were able to live independently and move freely before the injury, and it was their first time undergoing THA. Patients with pathological fractures or intolerant to surgery were excluded. Patients with infected wound or nerve and blood vessel damage were also excluded. CTs before and after surgery were collected. Some patients had had more than one CT before or after surgery. Finally, 182 paired CT scans (before and after surgery) were analyzed. This study was conducted in compliance with the Declaration of Helsinki.
Potential Predictors
Potential predictors included age, left vs right femur neck fracture, sex, surgery location (posterior upper, posterior lateral, or anterior lateral), BMI, preoperative data (APTT, fibrinogen [Fib], international normalized ratio [INR], Hct, plateletcrit [Pct], PT, and antithrombin [AT]), perioperative data (intraoperative blood loss and incision length), and postoperative data (Hct, PT, APTT, Fib, AT, and thrombin time [TT]).
Outcome Variables
The HHS at 6 months postoperatively was used for evaluating hip function in patients. The HHS has a maximum of 100 points. Pain receives 44 points, function 47 points, range of motion 5 points, and deformity 4 points. Function is further divided into activities of daily living (14 points) and gait (33 points). A higher HHS score indicates less dysfunction of the hip. A total score of <70 is considered a poor result, 70–80 fair, 80–90 good, and 90–100 excellent.20 In this study, we classified patients into HHS score ≥90 (patients with excellent prognosis) and <90 points (patients with referred to poor prognosis).21
Radiomic-Feature Extraction
Preoperative and postoperative CTs were obtained 48 hours before and after THA surgery using a dual-headed gamma camera (Infinia Hawkeye 4; GE Healthcare, Milwaukee, WI, USA) equipped with low-energy, high-resolution collimators. CT acquisition was performed at 140 kVp and 2.5 mA using a 512×12 matrix and 5 mm slice thickness (pitch 10, interval 2.95 mm). Then, a critical gray value of 60 was selected to remove irrelevant information, and the corresponding mask was made. The Python package Pyradiomics was used for feature extraction of the pretreated CT pictures and mask.14 Radiomic features were extracted: 18 first-order features, ten two-dimensional features, 75 textural features, 24 gray-level co-occurrence matrix features, 16 gray-level run-length matrix features, 16 gray-level size-zone matrix features, five neighboring gray tone–difference matrix features, and 14 gray-level dependence matrix features. Definitions and names of radiomic features were in accordance with the Imaging Biomarker Standardization Initiative.22 Details of the feature-extraction process are shown in Figure 1.
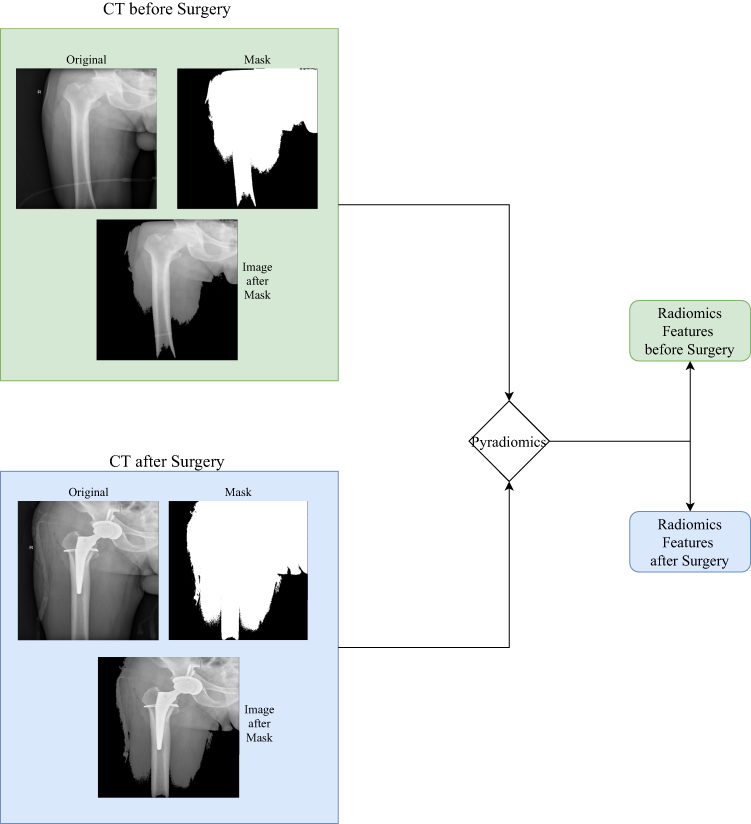 |
Figure 1 Feature-extraction process used in this study. |
THA Procedure
THA surgery was performed by an experienced joint surgeon. General anesthesia or epidural anesthesia was used according to the patient’s physical condition. After successful anesthesia, patients were placed in a standard lateral decubitus position with the affected hip upward. Then, a 7–12 cm–long incision was cut and the tendon space between the tensor fascia lata and gluteus medius explored by high-frequency electrosurgical hemostasis. After confirmation of the clearance, blunt dissection was performed to expose and incise the joint capsule, and the first osteotomy was cut below the femoral head. A wedge-shaped osteotomy at about 1 cm above the lesser trochanter was sawn and the femoral head obtained. The cancellous bone of the femoral head was also collected for future use. Acetabular retractors were placed on the anterior and posterior walls of the acetabulum to fully expose the acetabulum, and an acetabular file was used to grind the bottom of the acetabulum until it oozed evenly.
An appropriate acetabular test model was placed. When the test model matched the shape of the acetabulum, spare autologous spongy bone was implanted on the acetabular side and proximal end of the femur, and the matching acetabular prosthesis was placed. A bone hammer was struck until the acetabular prosthesis was firmly attached to the bottom of the acetabulum, and the matching lining was placed and covered with wet gauze. The leg was externally supinated, extended rearward, or adducted below the operating table to expose the proximal femur. The inner edge of the greater trochanter was applied to open the proximal femur to confirm the femoral marrow cavity. The pulp was expanded incrementally, and then the prosthesis was placed for model reduction. When the hip joint was found to be stable, the test model was taken out and the corresponding prosthetic stem and femoral head prosthesis placed. The hip joint was then restored. After confirming the tightness and stability of the prosthesis and equal length to the contralateral lower limb, the joint capsule, deep fascia, gluteus maximus, and subcutaneous tissue and skin were sutured.
Statistical Analysis
The Shapiro–Wilk test was used to evaluate the normality of the measurement data. Continuous variables with normal distribution are expressed as means ± SD, and t tests were used for comparisons between groups. Measurement data for abnormal distribution were represented by M (Q1, Q3), and comparisons between groups were made using the Mann–Whitney U test. Enumeration data are displayed as n (%), and χ2 tests or Fisher’s exact-probability method were employed for comparisons between groups. Missing data were manipulated via multiple interpolation, and then sensitivity analyses were conducted. All samples were randomly divided into a training set (n=127) and testing set (n=55) at a ratio of 7:3 according to random seeding. Least absolute shrinkage–selection operator regression was used for feature selection to select optimal predictors for the model. A random-forest algorithm was used to establish the prediction model, which was evaluated by accuracy, sensitivity, specificity, positive predictive value (PPV), negative predictive value (NPV), and area under the curve (AUC; Figure 2). SAS 9.4 and Python were used for statistical analysis. All statistical tests were two-sided, and P<0.05 was considered statistically significant.
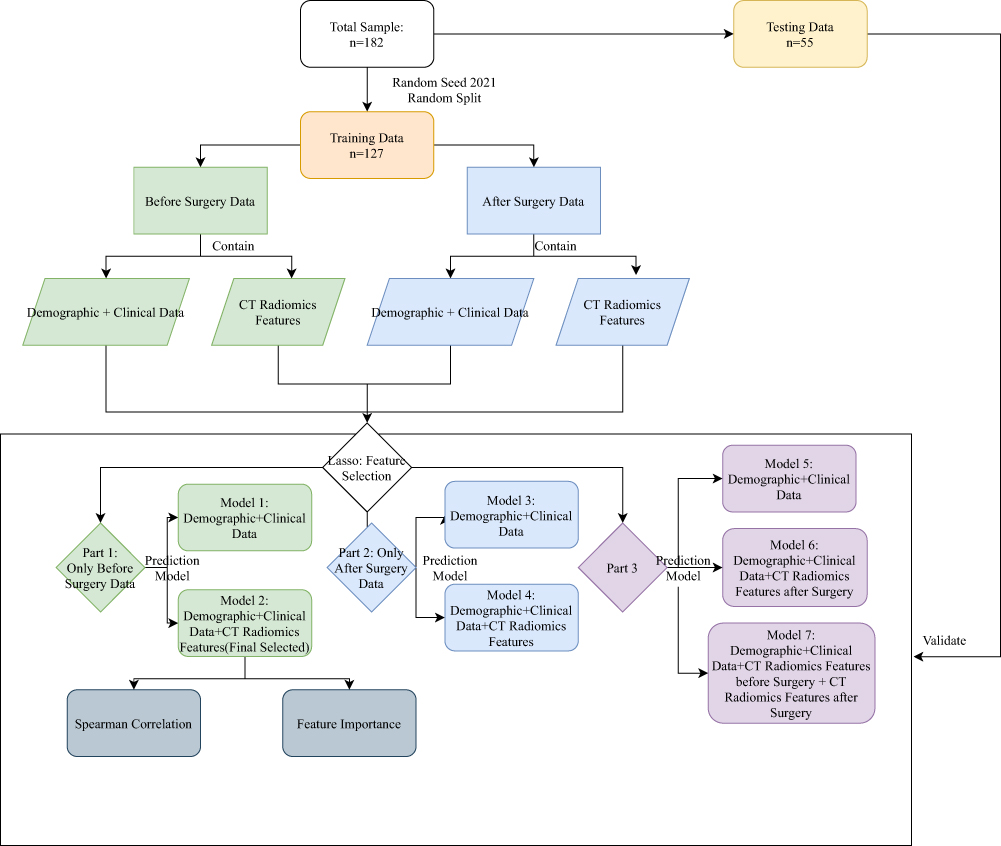 |
Figure 2 Flowchart of study process. |
Results
Sensitivity Analysis of Missing Data
Two patients had data on blood loss during the operation missing, accounting for 1.1%. Multiple interpolation was applied for manipulation of the missing data. Difference in variables before and after filling was not statistically significant (all P>0.05), indicating the results after manipulation were reliable (Supplementary Table 1).
Equilibrium Tests and Characteristics of Participants
The mean age of the patients was 68.65 years. Im sum, 99 had left femoral neck fractures and 83 right femoral neck fractures. Among all subjects, 97 (53.3%) had HHS scores ≥90 and 85 HHS scores <90 at 6 months after THA. Equilibrium tests revealed that there were no statistical differences between the data in the training set and the testing set (all P>0.05; Table 1).
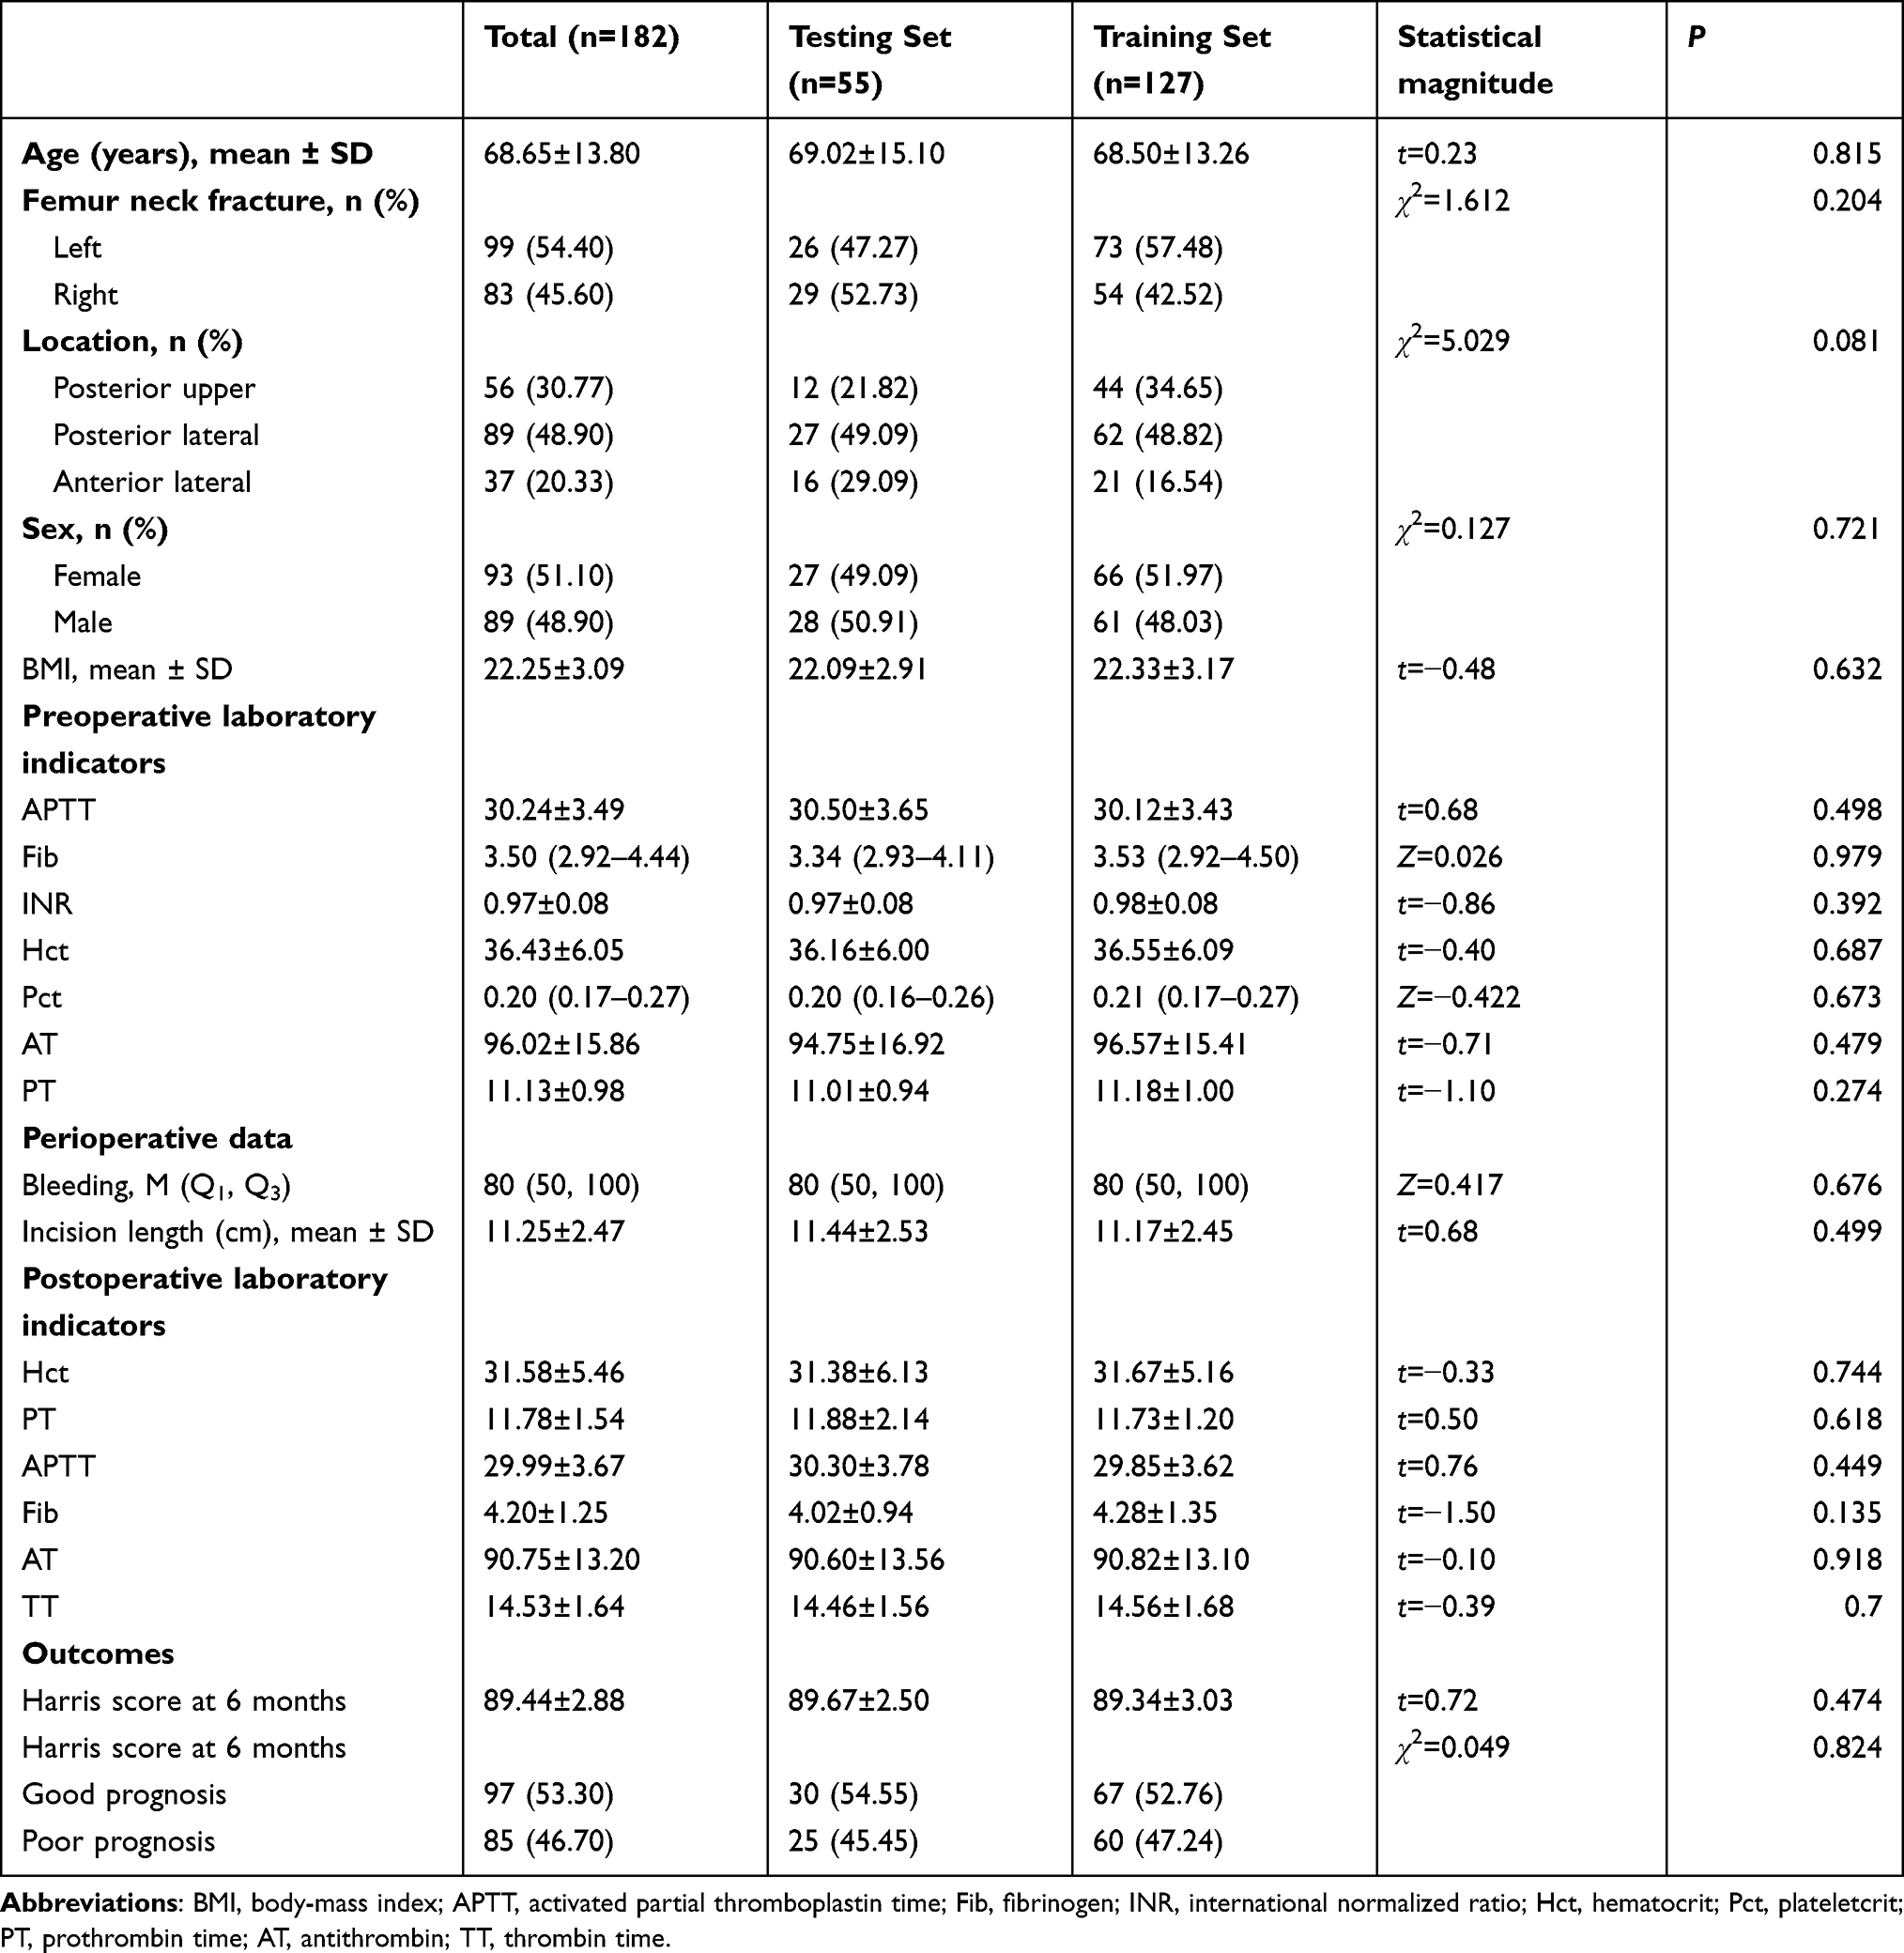 |
Table 1 Equilibrium tests |
Construction of Prediction Models Based on Preoperative Data
Models 1 and 2 were constructed based on demographic and preoperative data. Model 1 was established based on age, left vs right femur neck fracture, sex, surgery location, BMI, and preoperative APTT, Fib, INR, Hct, Pct, PT, and AT. Model 2 was constructed based on age, left vs right femur neck fracture, sex, surgery location, BMI, preoperative APTT, Fib, INR, Hct, Pct, PT, and AT, and preoperative radiomic features of maximum diameter, elongation, and sphericity. The AUC for Model 1 in the training set was 0.925 (95% CI 0.880–0.969, Figure 3), sensitivity 0.836 (95% CI 0.747–0.925), specificity 0.917 (95% CI 0.847–0.987), PPV 0.918 (95% CI 0.849–0.986), NPV 0.833 (95% CI 0.743–0.923), and accuracy 0.874 (95% CI 0.816–0.932; Table 2). The AUC for Model 1 in the testing set was 0.816 (95% CI 0.702–0.930), sensitivity 0.767 (95% CI 0.615–0.918), specificity 0.800 (95% CI 0.643–0.957), PPV 0.821 (95% CI 0.680–0.942), NPV 0.741 (95% CI 0.575–0.906), and accuracy 0.782 (95% CI 0.673–0.891; Figure 3, Table 2). In Model 2, AUC, sensitivity, specificity, PPV, NPV, and accuracy in the training set were 0.986 (95% CI 0.971–1), 0.925 (95% CI 0.862–0.988), 0.983 (95% CI 0.951–1.016), 0.984 (95% CI 0.953–1.014), 0.922 (95% CI 0.856–0.988), and 0.953 (95% CI 0.916–0.990), respectively, while in the testing set the AUC, sensitivity, specificity, PPV, NPV, and accuracy were 0.949 (95% CI 0.885–1), 0.767 (95% CI 0.615–0.918), 1 (95% CI 1–1), 1 (95% CI 1–1), 0.781 (95% CI 0.638–0.924), and 0.873 (95% CI 0.785–0.961), respectively (Table 2). The confusion matrix of each model is shown in Figure 3.
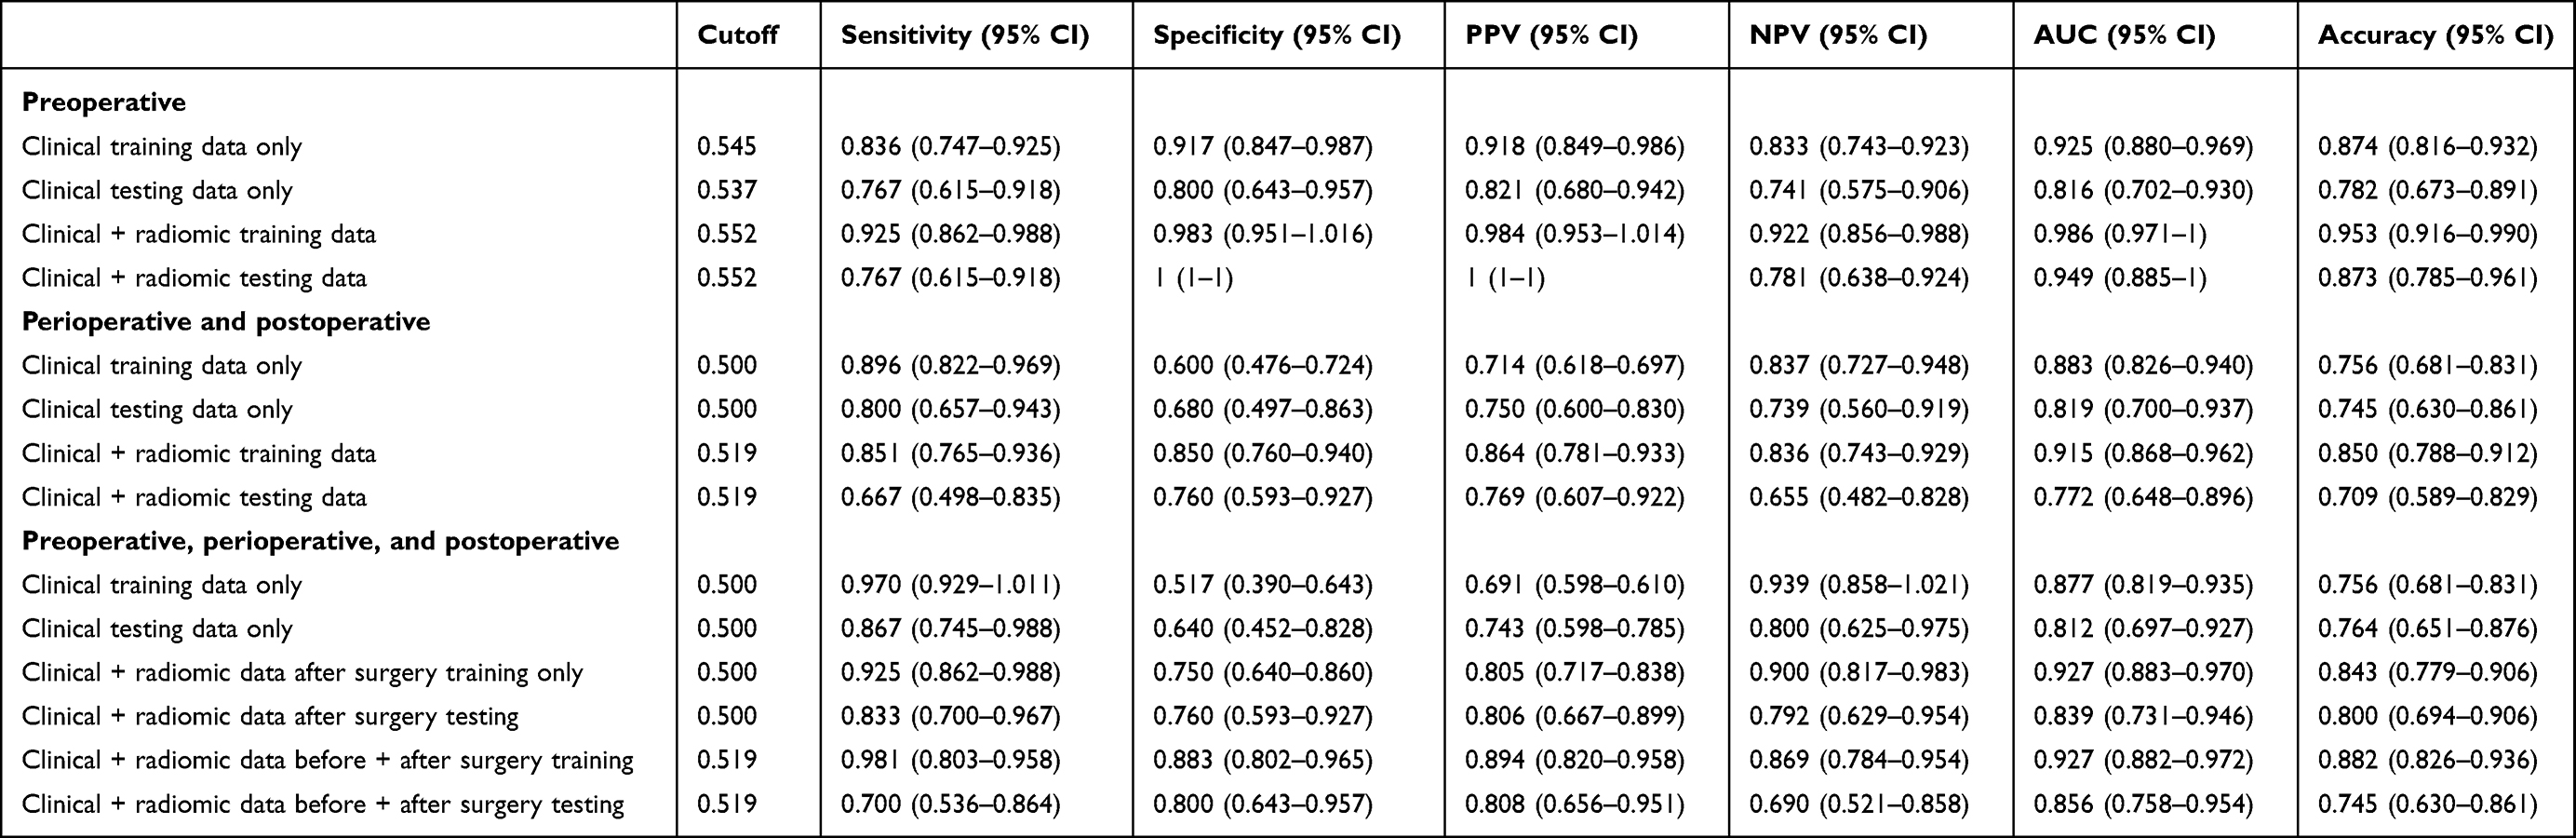 |
Table 2 Predictive value of prediction model |
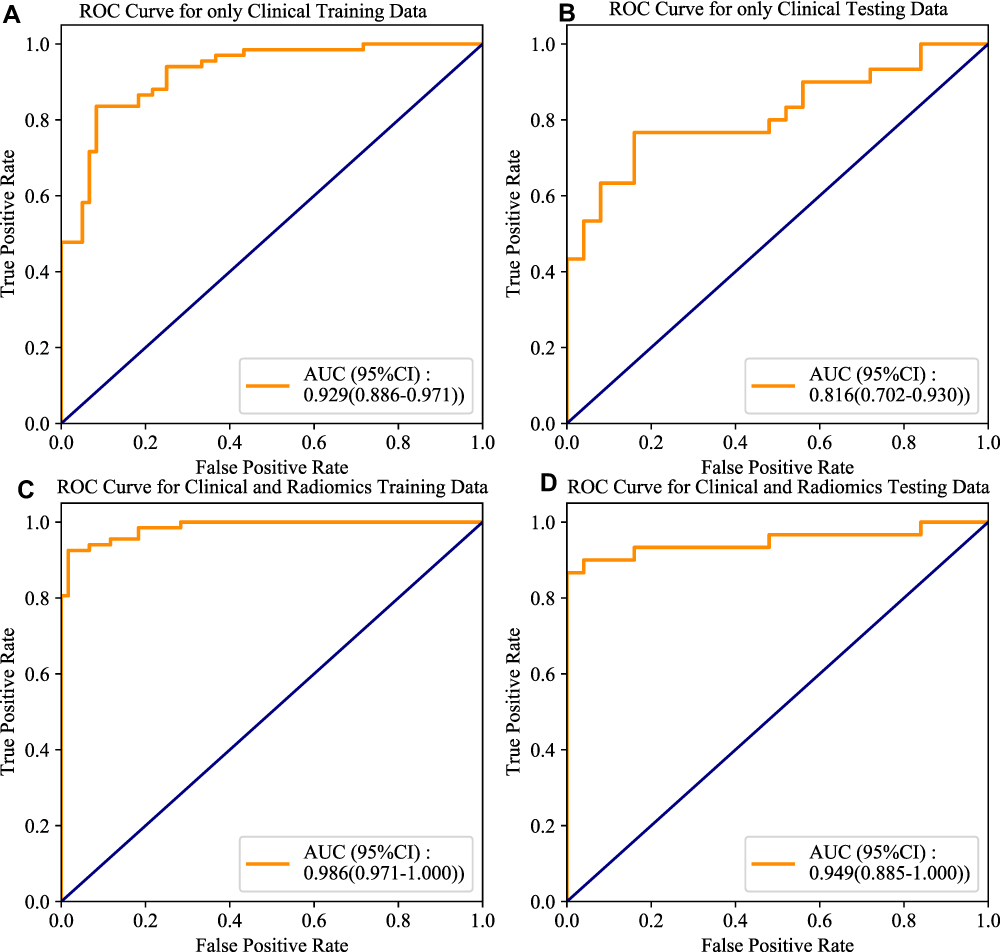 |
Figure 3 Continued. |
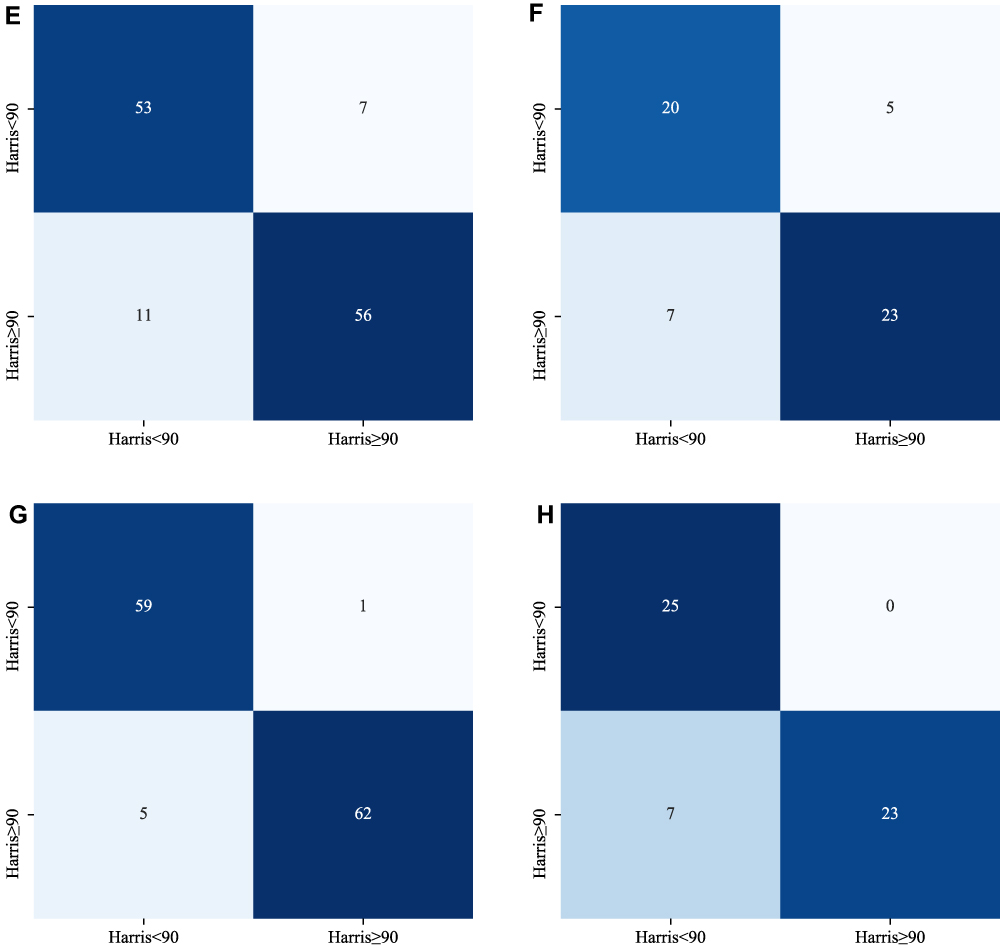 |
Figure 3 ROC curves for (A) the training set in Model 1, (B) testing set in Model 1, (C) training set in Model 2, and (D) testing set in Model 2. Confusion matrices for (E) the training set in Model 1, (F) testing set in Model 1, (G) training set in Model 2, and (H) testing set in Model 2. |
Construction of Prediction Models Based on Perioperative and Postoperative Data
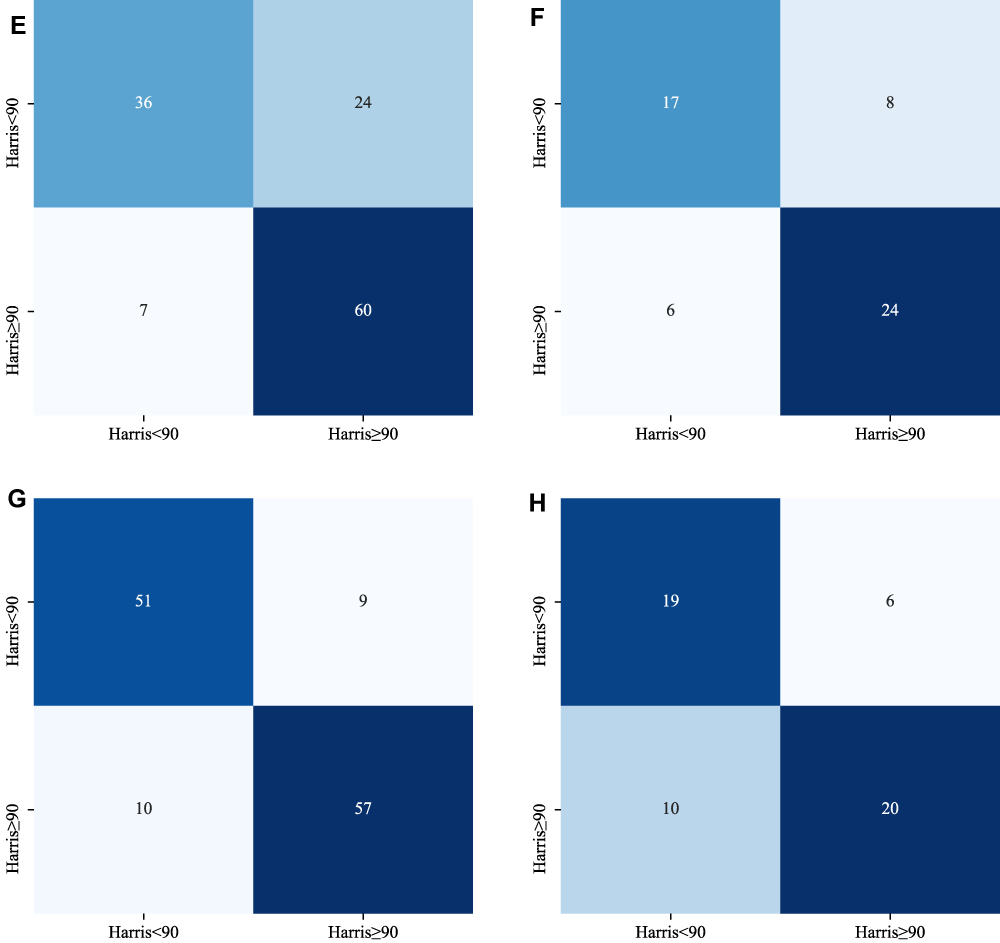
Models 3 and 4 were established using demographic, perioperative, and postoperative data. Model 3 was built using age, left vs right femur neck fracture, sex, surgery location, BMI, intraoperative blood loss and incision length, and postoperative Hct, PT, APTT, Fib, AT, and TT. Model 4 was constructed using age, left vs right femur neck fracture, sex, surgery location, BMI, intraoperative blood loss and incision length, postoperative Hct, PT, APTT, Fib, AT, and TT, and the postoperative radiomic feature mask-volume number. The AUC for Model 3 in the training set was 0.883 (95% CI 0.826–0.940, Figure 4), sensitivity 0.896 (95% CI 0.822–0.969), specificity 0.600 (95% CI 0.476–0.724), PPV 0.714 (95% CI 0.618–0.697), NPV 0.837 (95% CI 0.727–0.948), and accuracy 0.756 (95% CI 0.681–0.831; Table 2). The AUC for Model 3 in the testing set was 0.819 (95% CI 0.700–0.937, Figure 4), sensitivity 0.800 (95% CI 0.657–0.943), specificity 0.680 (95% CI 0.497–0.863), PPV 0.750 (95% CI 0.600–0.830), NPV 0.739 (95% CI 0.560–0.919), and accuracy 0.745 (95% CI 0.630–0.861; Table 2). In Model 4, the AUC was 0.915 (95% CI 0.868–0.962), sensitivity 0.851 (95% CI 0.765–0.936), specificity 0.850 (95% CI 0.760–0.940), PPV 0.864 (95% CI 0.781–0.933), NPV 0.836 (95% CI 0.743–0.929), and accuracy 0.850 (95% CI 0.788–0.912) in the training set, while in the testing set the AUC was 0.772 (95% CI 0.648–0.896), sensitivity 0.667 (95% CI 0.498–0.835), specificity 0.760 (95% CI 0.593–0.927), PPV 0.769 (95% CI 0.607–0.922), NPV 0.655 (95% CI 0.482–0.828), and accuracy 0.709 (95% CI 0.589–0.829; Table 2). The confusion matrix of each model is shown in Figure 4. Figure 4 Continued. Figure 4 ROC curves for (A) the training set in Model 3, (B) testing set in Model 3, (C) training set in Model 4, and (D) testing set in Model 4. Confusion matrices for (E) the training set in Model 3, (F) testing set in Model 3, (G) training set in Model 4, and (H) testing set in Model 4.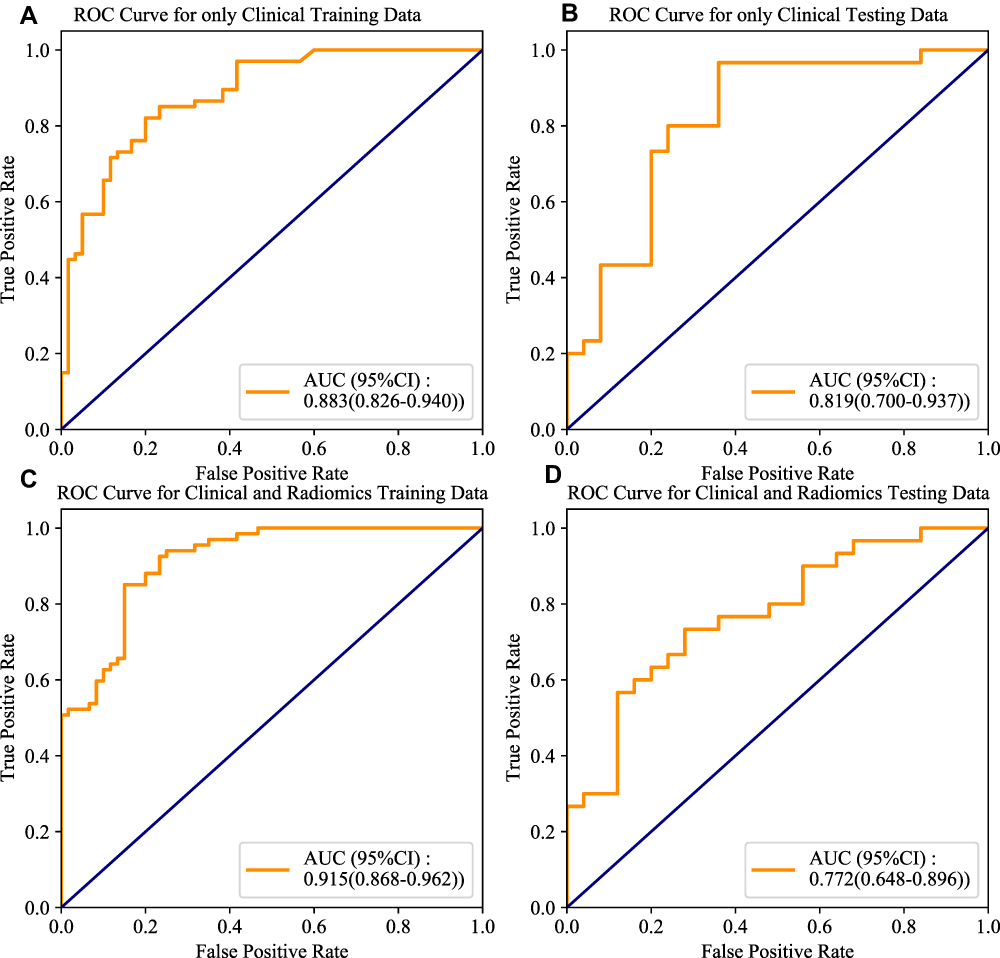
Construction of Prediction Models Based on Preoperative, Perioperative, and Postoperative Data
Models 5–7 were constructed based on preoperative, perioperative, and postoperative data. Model 5 was established using age, left vs right femur neck fracture, sex, surgery location, BMI, preoperative APTT, Fib, INR, Hct, Pct, PT, and AT, intraoperative blood loss and incision length, and postoperative Hct, PT, APTT, Fib, AT, and TT. Model 6 was constructed based on age, left vs right femur neck fracture, sex, surgery location, BMI, preoperative APTT, Fib, INR, Hct, Pct, PT, and AT, intraoperative blood loss and incision length, postoperative Hct, PT, APTT, Fib, AT, and TT, and the postoperative radiomic feature mask-volume number. Model 7 was built based on age, left vs right femur neck fracture, sex, surgery location, BMI, preoperative APTT, Fib, INR, Hct, Pct, PT, and AT, intraoperative blood loss and incision length, postoperative Hct, PT, APTT, Fib, AT, and TT, preoperative radiomic features of maximum diameter, elongation, and sphericity, and the postoperative radiomic feature mask-volume number.
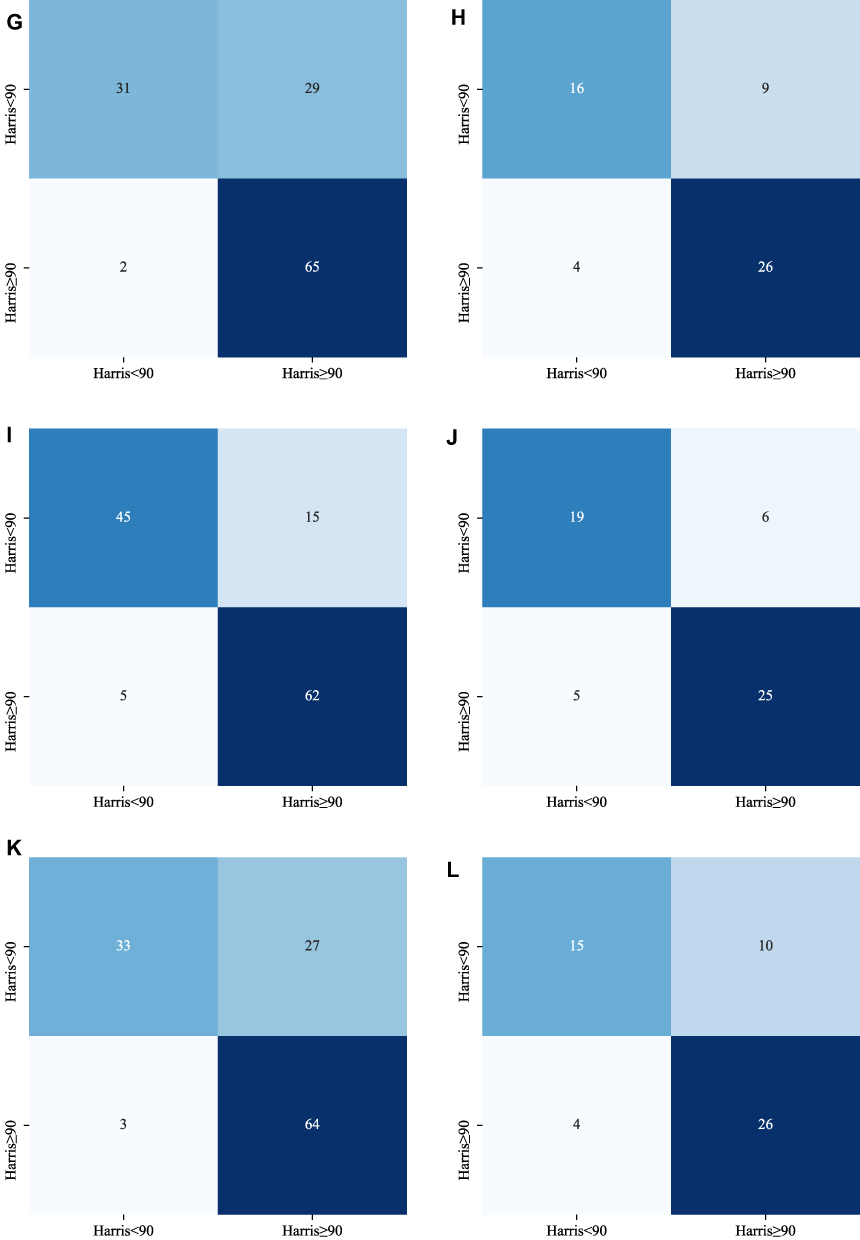
In Model 5, the AUC was 0.877 (95% CI 0.819–0.935), sensitivity 0.970 (95% CI 0.929–1.011), specificity 0.517 (95% CI 0.390–0.643), PPV 0.691 (95% CI 0.598–0.610), NPV 0.939 (95% CI 0.858–1.021), and accuracy 0.756 (95% CI 0.681–0.831) in the training set. In the testing set, the AUC was 0.812 (95% CI 0.697–0.927), sensitivity 0.867 (95% CI 0.745–0.988), specificity 0.640 (95% CI 0.452–0.828), PPV 0.743 (95% CI 0.598–0.785), NPV 0.800 (95% CI 0.625–0.975), and accuracy 0.764 (95% CI 0.651–0.876; Figure 5, Table 2). In Model 6, the AUC was 0.927 (95% CI 0.883–0.970), sensitivity 0.925 (95% CI 0.862–0.988), specificity 0.750 (95% CI 0.640–0.860), PPV 0.805 (95% CI 0.717–0.838), NPV 0.900 (95% CI 0.817–0.983), and accuracy 0.843 (95% CI 0.779–0.906) in the training set, while in the testing set the AUC was 0.839 (95% CI 0.731–0.946), sensitivity 0.833 (95% CI 0.700–0.967), specificity 0.760 (95% CI 0.593–0.927), PPV 0.806 (95% CI 0.667–0.899), NPV 0.792 (95% CI 0.629–0.954), and accuracy 0.800 (95% CI 0.694–0.906; Figure 5, Table 2). In Model 7, the AUC was 0.927 (95% CI 0.882–0.972), sensitivity 0.981 (95% CI 0.803–0.958), specificity 0.883 (95% CI 0.802–0.965), PPV 0.894 (95% CI 0.820–0.958), NPV 0.869 (95% CI 0.784–0.954), and accuracy 0.882 (95% CI 0.826–0.936) in the training set. In the testing set, the AUC was 0.856 (95% CI 0.758–0.954), sensitivity 0.700 (95% CI 0.536–0.864), specificity 0.800 (95% CI 0.643–0.957), PPV 0.808 (95% CI 0.656–0.951), NPV 0.690 (95% CI 0.521–0.858), and accuracy 0.745 (95% CI 0.630–0.861; Table 2). The confusion matrix of each model is shown in Figure 5. Figure 5 Continued. Figure 5 ROC curves for (A) the training set in Model 5, (B) testing set in Model 5, (C) training set in Model 6, (D) testing set in Model 6, (E) training set in Model 7, (F) and testing set in Model 7. (G) the confusion matrix of the training set in Model 5. Confusion matrices for (H) the testing set in Model 5, (I) training set in Model 6, (J) testing set in Model 6, (K) training set in Model 7, (L) and testing set in Model 7.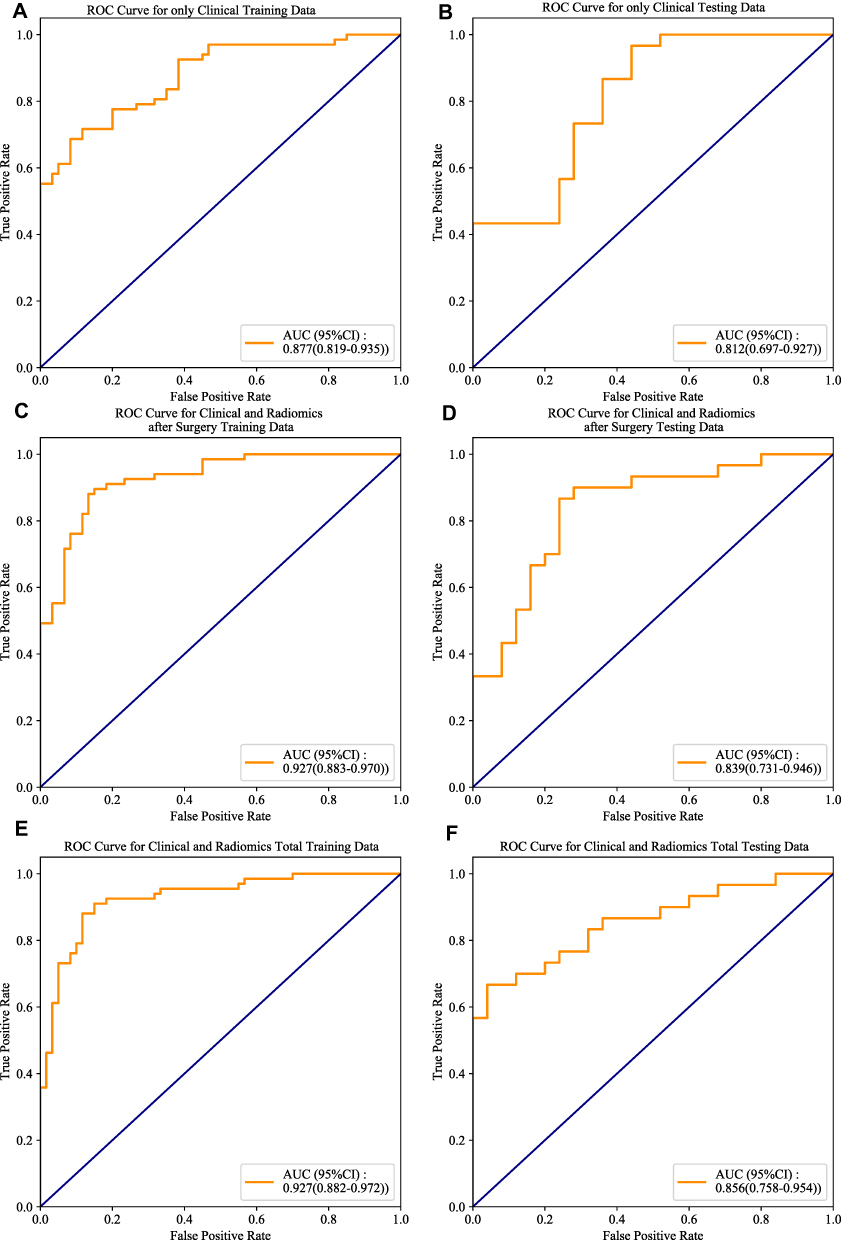
Selection of Final Predictive Model
The AUC in Model 2 was significantly higher than Model 1 (P=0.041), Model 4 (P=0.011), and Model 5 (P=0.036). Although the AUC in Model 2 was not significantly higher than Model 3 (P=0.053), Model 6 (P=0.077), or Model 7 (P=0.109), specificity in Model 2 was significantly higher than Model 3 (P=0.005), Model 6 (P=0.005), and Model 7 (P=0.013). Model 2 was chosen as the final prediction model. As shown in Supplementary Figure 1, the learning curve showed that the model had good fitting ability. Spearman correlation analysis between clinical indicators and preoperative radiomic features showed that the preoperative radiomic features were closely associated with the inflammatory index Hct, as well as the coagulation indices Fib and Pct (Figure 6). As shown in the random-forest variable-importance diagram, APTT was the most important variable correlated with the outcomes of femoral neck–fracture patients receiving THA, followed by preoperative radiomic feature (maximum diameter) and Fib (Figure 7).
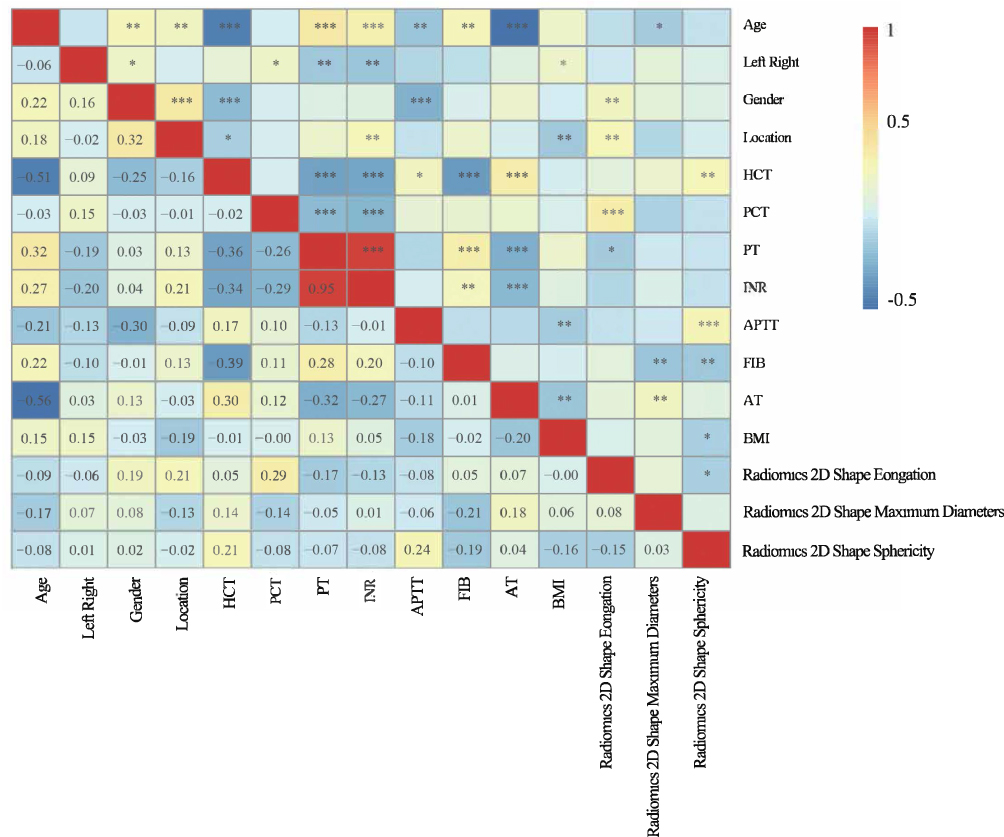 |
Figure 6 Thermal diagram of correlations between preoperative radiomic features and clinical indices. *P<0.1; **P<0.05; ***P<0.01. |
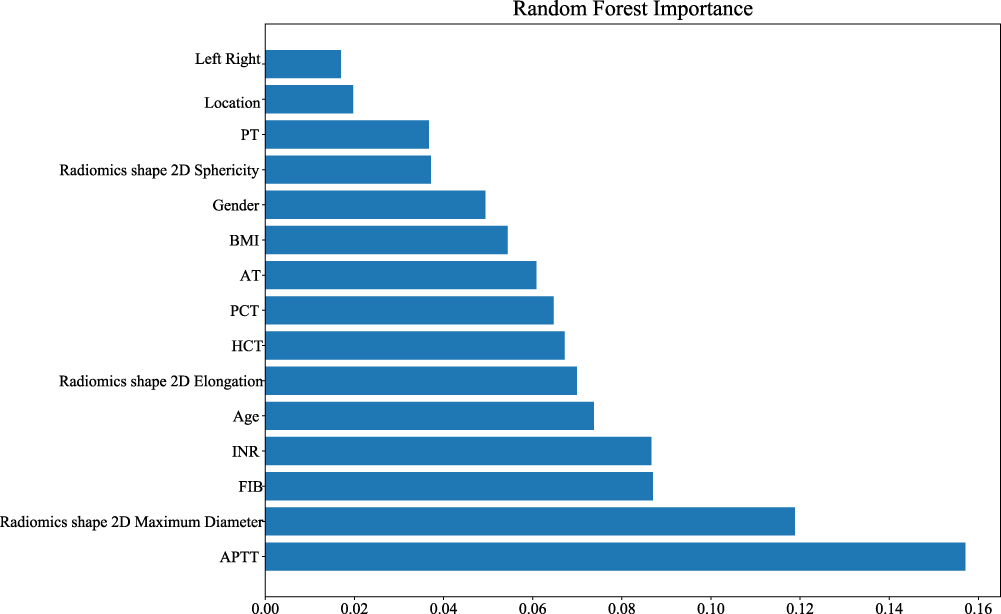 |
Figure 7 Variable-importance diagram of the selected random-forest model. |
Discussion
The results showed that APTT, a preoperative radiomic feature (maximum diameter), and Fib were the most important variables correlating with the outcomes of femoral neck fractures. Model 2 displayed the best predictive value. Our findings might help identify patients at high risk of poor prognosis at 6 months after THA surgery and provide timely interventions to improve this. Research has indicated that uncontrolled bleeding is correlated with poor prognosis and mortality in patients undergoing hemiarthroplasty.23 Bleeding, transfusion, and postoperative anemia have been reported to increase the risk of poor prognosis in hip-fracture patients receiving hemiarthroplasty.24 APTT, Fib, PT, and AT levels reflect coagulation functions in patients, and are vital biomarkers of bleeding during the operation.25 The preoperative level of ATTP is an index for hypercoagulability, which may be implicated in development of thrombus.26 Different levels of ATTP affect medication use during operations, and individualized anticoagulant therapies, such as preoperative administration of rivaroxaban, may be associated with the prognosis of patients.27,28 Fib has been reported to be involved in activating and mediating the inflammation process, and may serve as a predictor for persistent periprosthetic hip infection before reimplantation in two-stage exchange arthroplasty.29 In addition, Changjun et al identified that reduction in Fib in THA may be associated with recovery after surgery.30 These support our findings of APTT and Fib being important predictors of 6-month outcomes in femoral neck–fracture patients undergoing THA. Extra caution should be applied to patients with abnormal levels of ATTP or Fib, and appropriate procoagulant measures should be taken.
In the clinic, CT is widely applied in femoral neck–fracture patients to determine the size of the medullary cavity and acetabulum accurately before surgery. It improves accuracy in fracture classification, which helps in selecting the best treatment for patients with fractures.16 CT can scan the transverse and longitudinal sections, which is more conducive to discovering fractures and helps in diagnosing occult femoral neck fracture or microfractures to avoid missed diagnosis or the wrong choice of surgical procedure.31,32 A better understanding of the status of femoral neck fractures is essential for preoperative evaluation and is associated with a better surgical and clinical outcome.33 Exploring detailed information from CTs through mathematical analysis of the distribution of pixels in the images can reveal a series of quantitative texture parameters unable to be picked up by sight alone.34 These findings align with the results in the current study, showing that preoperative radiomic features were important factors influencing the prognosis of THA patients. Prediction models incorporating preoperative radiomic features improved predictive ability. In addition, Spearman correlation analysis demonstrated that preoperative radiomic features had close associations with the inflammatory index Hct and the coagulation indices Fib and Pct. Several studies have identified that CT radiomic parameters are associated with inflammation states and pathological grading in some diseases, including cancers and anterior mediastinal lesions.35–37 Bone radiomic score has been used as a predictor of hip fracture in older women.38 This might provide backing for our results.
In the current study, the prediction models were constructed based on preoperative or postoperative data in the femoral neck–fracture patients receiving THA. Predictive performances were compared and the best model elected. The model constructed based on age, left vs right femur neck fracture, sex, surgery location, BMI, preoperative APTT, Fib, INR, Hct, Pct, PT, and AT, and the preoperative radiomic features of maximum diameter, elongation, and sphericity displayed the best predictive value, with high AUC, sensitivity, specificity, PPV, NPV, and accuracy in both the training set and the testing set, indicating good predictive ability. Kunze et al constructed five prediction models and compared their performance for outcomes of patients undergoing primary THA for end-stage degenerative osteoarthritis of the hip.39 The models were constructed according to patient-reported health state. Although the predictive value was very good (AUC 0.87–0.97), the patient-reported health state can be inaccurate and cause bias. Our model was established based on preoperative data and radiomic features, which more objectively reflected the health status of patients. Radiomic data were different between preoperative and postoperative CT. Preoperative data could identify patients with poor prognosis before surgery and might help clinicians to make timely changes before surgery to prevent the occurrence of poor prognosis.
Radiomic features provide more quantitative information than visual analysis to expert radiologists for better understanding of disease states.40 Texture analysis based on CT images can provide numerous pixel-level texture parameters and more objectively depict lesions via mathematical algorithms, which reflect more stable patient information.19,41 Accuracy, sensitivity, specificity, PPV, and NPV were measured to comprehensively evaluate the performance of the model, and were all good in our selected model. This indicated that a radiomic-based approach for CT scan femoral neck images with machine-learning algorithms can help mine valuable texture features related to femoral neck fracture, suggesting the potential utility and extensibility of a radiomic-based approach for predicting the prognosis of femoral neck–fracture patients receiving THA. However, poor data reproducibility, particularly regarding segmentation, high dimensionality (more features than observations) leading to overfitting, and strong correlation among features are challenges in the radiomic modeling process.42 The prediction model in this study might be a useful method for clinicians to make more targeted surgery plans for patients at high risk of a poor prognosis as early as possible. This model was uploaded to GitHub with free access for everyone (https://github.com/zxfgit1/THAclinicalefficiancy). We welcome more clinicians to use our model to validate the results of our study.
The strengths of this study were that the missing data were managed and no bias was obtained, which increases the reliability of our results. Internal validation was also performed to verify the results. There were several limitations. Firstly, the sample was small and collected from a single center, which might decrease statistical power. Secondly, external validation of the findings was not conducted. Thirdly, the patients were followed up for only 6 months. Follow-up will continue for these patients for further analysis. Fourthly, preoperative HHS scores were not evaluated, which might affect patient outcomes. In future, well-designed studies with large samples from multiple centers and external validation will be required to validate the results of this study.
Conclusion
In the current study, several random forest-prediction models were constructed based on preoperative or postoperative data in femoral neck–fractures patients receiving THA. The model based on demographic, preoperative clinical, and preoperative radiomic data showed the best predictive ability for 6-month prognosis. This model might help to identify femoral neck–fracture patients receiving THA who are at high risk of poor prognosis and offer appropriate interventions to prevent these.
Ethics Approval and Informed Consent
This study was approved by the ethics committee of the Third Hospital of Mianyang Sichuan Mental Health Center. Written informed consent was obtained from all participants.
Acknowledgments
Xiaofeng Zheng and Cong Xiao are co–first authors for this study and contributed equally to this work. Zhuocheng Xie and Lijuan Liu are co–second authors for this study.
Author Contributions
All authors made a significant contribution to the work reported, whether in conception, study design, execution, acquisition of data, analysis and interpretation, or all these areas, took part in drafting, revising, or critically reviewing the article, gave final approval to the version to be published, have agreed on the journal to which the article has been submitted, and agree to be accountable for all aspects of the work.
Funding
There is no funding to report.
Disclosure
The authors report no conflicts of interest in this work.
References
1. Bhandari M, Swiontkowski M. Management of acute hip fracture. N Engl J Med. 2017;377(21):2053–2062. doi:10.1056/NEJMcp1611090
2. Ju DG, Rajaee SS, Mirocha J, Lin CA, Moon CN. Nationwide analysis of femoral neck fractures in elderly patients: a receding tide. J Bone Joint Surg Am. 2017;99(22):1932–1940. doi:10.2106/JBJS.16.01247
3. Bhandari M, Einhorn TA, Guyatt G, et al. Total hip arthroplasty or hemiarthroplasty for hip fracture. N Engl J Med. 2019;381(23):2199–2208.
4. Wilkin GP, Poitras S, Clohisy J, et al. Periacetabular osteotomy with or without arthroscopic management in patients with hip dysplasia: study protocol for a multicenter randomized controlled trial. Trials. 2020;21(1):725. doi:10.1186/s13063-020-04592-9
5. Kim SS, Kim HJ, Shim CH. Relationships between femoral offset change and clinical score following bipolar hip arthroplasty in femoral neck fractures. Hip Pelvis. 2021;33(2):78–86. doi:10.5371/hp.2021.33.2.78
6. Ochieng SR, Kingori J, Awori KO, Ating’a JEO. Recovery of pre-injury functional state following operative treatment of displaced femoral neck fractures; a prospective cohort study. Ann Med Surg. 2012;69:102682. doi:10.1016/j.amsu.2021.102682
7. Chiung-Jui Su D, Yuan KS, Weng SF, et al. Can early rehabilitation after total hip arthroplasty reduce its major complications and medical expenses? Report from a nationally representative cohort. Biomed Res Int. 2015;2015:641958. doi:10.1155/2015/641958
8. Hunter SW, Bobos P, Somerville L, Howard J, Vasarhelyi E, Lanting B. Comparison of functional and patient-reported outcomes between direct anterior and lateral surgical approach one-year after total hip arthroplasty in a Canadian population: a cross-sectional study. J Orthop. 2020;19:36–40. doi:10.1016/j.jor.2019.11.004
9. Ford S. Outcome differences after elective or emergency hip operations. Anaesthesia. 2014;69(6):643. doi:10.1111/anae.12722
10. Hip Fracture Accelerated Surgical Treatment and Care Track (HIP ATTACK) Investigators. Accelerated care versus standard care among patients with hip fracture: the HIP ATTACK pilot trial. Can Med Assoc J. 2014;186(1):E52–60. doi:10.1503/cmaj.130901
11. Maceroli M, Nikkel LE, Mahmood B, et al. Total hip arthroplasty for femoral neck fractures: improved outcomes with higher hospital volumes. J Orthop Trauma. 2016;30(11):597–604. doi:10.1097/BOT.0000000000000662
12. Du P, Zhu Y, Guo J, et al. Incidence and risk factors associated with surgical site infection after surgically treated hip fractures in older adults: a retrospective cohort study. Aging Clin Exp Res. 2021. doi:10.1007/s40520-021-02027-2
13. Zhang YM, Jiang X, Sun YS. Effect of rivaroxaban on preventing deep vein thrombosis in aged diabetics with femoral neck fractures after hip replacement. Biosci Rep. 2017;37(3). doi:10.1042/BSR20170289
14. van Griethuysen JJM, Fedorov A, Parmar C, et al. Computational radiomics system to decode the radiographic phenotype. Cancer Res. 2017;77(21):e104–e107. doi:10.1158/0008-5472.CAN-17-0339
15. LeCun Y, Bengio Y, Hinton G. Deep learning. Nature. 2015;521(7553):436–444. doi:10.1038/nature14539
16. Zamora T, Klaber I, Ananias J, et al. The influence of the CT scan in the evaluation and treatment of nondisplaced femoral neck fractures in the elderly. J Orthop Surg. 2019;27(2):2309499019836160. doi:10.1177/2309499019836160
17. Park YC, Song HK, Yang KH. Prevention of unplanned surgery due to delayed diagnosis of occult ipsilateral femoral neck fractures associated with femoral shaft fractures: a study of the CT capsular sign with lipohemarthrosis. J Bone Joint Surg Am. 2021;103(15):1431–1437. doi:10.2106/JBJS.20.02033
18. Genant HK, Jiang Y. Advanced imaging assessment of bone quality. Ann N Y Acad Sci. 2006;1068:410–428. doi:10.1196/annals.1346.038
19. Park SJ, Ko BS, Moon KH, Lee M. Prediction value of SPECT/CT in avascular necrosis of femoral head after femur neck fracture. Geriatr Orthop Surg Rehabil. 2019;10:2151459319872943. doi:10.1177/2151459319872943
20. Weick JW, Bullard J, Green JH, Gagnier JJ. Measures of hip function and symptoms. Arthritis Care Res. 2020;72(Suppl 10):200–218. doi:10.1002/acr.24231
21. Mahomed NN, Arndt DC, McGrory BJ, Harris WH. The Harris hip score: comparison of patient self-report with surgeon assessment. J Arthroplasty. 2001;16(5):575–580. doi:10.1054/arth.2001.23716
22. Shu J, Tang Y, Cui J, et al. Clear cell renal cell carcinoma: CT-based radiomics features for the prediction of Fuhrman grade. Eur J Radiol. 2018;109:8–12. doi:10.1016/j.ejrad.2018.10.005
23. Qiu M, Zhang X, Cai H, Xu Z, Lin H. The impact of hemocoagulase for improvement of coagulation and reduction of bleeding in fracture-related hip hemiarthroplasty geriatric patients: a prospective, single-blinded, randomized, controlled study. Injury. 2017;48(4):914–919. doi:10.1016/j.injury.2016.11.028
24. Brauer CA, Coca-Perraillon M, Cutler DM, Rosen AB. Incidence and mortality of hip fractures in the United States. JAMA. 2009;302(14):1573–1579. doi:10.1001/jama.2009.1462
25. Qin N, Wei LW. [Effect of xuebijing injection on perioperative coagulation function and inflammatory reaction in senile patients receiving total hip arthroplasty]. Zhongguo Zhong Yao Za Zhi. 2014;34(10):1202–1206. Chinese.
26. Zhu S, Song Y, Chen X, Qian W. Traditional Chinese and western medicine for the prevention of deep venous thrombosis after lower extremity orthopedic surgery: a meta-analysis of randomized controlled trials. J Orthop Surg Res. 2018;13(1):79. doi:10.1186/s13018-018-0785-2
27. Wang C, Liu Q, Sun L, Dai G. Application of thrombelastography in primary total knee and total hip replacement: a prospective 87 patients study. Blood Coagul Fibrinolysis. 2019;30(6):281–290. doi:10.1097/MBC.0000000000000839
28. Wagner J, Langlois F, Lim DST, McCartney S, Fleseriu M. Hypercoagulability and risk of venous thromboembolic events in endogenous cushing’s syndrome: a systematic meta-analysis. Front Endocrinol. 2018;9:805. doi:10.3389/fendo.2018.00805
29. Xu C, Qu PF, Chai W, Li R, Chen JY. Plasma fibrinogen may predict persistent infection before reimplantation in two-stage exchange arthroplasty for periprosthetic hip infection. J Orthop Surg Res. 2019;14(1):133. doi:10.1186/s13018-019-1179-9
30. Changjun C, Xin Z, Yue L, et al. Tranexamic acid attenuates early post-operative systemic inflammatory response and nutritional loss and avoids reduction of fibrinogen in total hip arthroplasty within an enhanced recovery after surgery pathway. Int Orthop. 2021;45(11):2811–2818. doi:10.1007/s00264-021-05182-3
31. Rogers NB, Karam WN, Kumaravel M, Warner SJ, Gary JL. Dual-energy CT to diagnose occult femoral neck fracture in MRI-contraindicated patient: a case report. JBJS Case Connect. 2021;11(4). doi:10.2106/JBJS.CC.21.00404
32. Chu K, Zhang X, Lu X, Chen X. [Risk of micro-fracture in femoral head after removal of cannulated screws for femoral neck fracture]. Zhongguo Xiu Fu Chong Jian Wai Ke Za Zhi. 2020;34(9):1091–1095. Chinese. doi:10.7507/1002-1892.202001076
33. Jakubietz MG, Mages L, Zahn RK, Kenn W, Jakubietz RG, Meffert RH. The role of CT scan in postoperative evaluation of distal radius fractures: retrospective analysis in regard to complications and revision rates. J Orthop Sci. 2017;22(3):434–437. doi:10.1016/j.jos.2016.12.024
34. Ollivier M, Le Corroller T, Blanc G, et al. Radiographic bone texture analysis is correlated with 3D microarchitecture in the femoral head, and improves the estimation of the femoral neck fracture risk when combined with bone mineral density. Eur J Radiol. 2013;82(9):1494–1498. doi:10.1016/j.ejrad.2013.04.042
35. Bektas CT, Kocak B, Yardimci AH, et al. Clear cell renal cell carcinoma: machine learning-based quantitative computed tomography texture analysis for prediction of Fuhrman nuclear grade. Eur Radiol. 2019;29(3):1153–1163. doi:10.1007/s00330-018-5698-2
36. Feng Z, Shen Q, Li Y, Hu Z. CT texture analysis: a potential tool for predicting the Fuhrman grade of clear-cell renal carcinoma. Cancer Imaging. 2019;19(1):6. doi:10.1186/s40644-019-0195-7
37. Sui H, Liu L, Li X, Zuo P, Cui J, Mo Z. CT-based radiomics features analysis for predicting the risk of anterior mediastinal lesions. J Thorac Dis. 2019;11(5):1809–1818. doi:10.21037/jtd.2019.05.32
38. Hong N, Park H, Kim CO, et al. Bone radiomics score derived from DXA hip images enhances hip fracture prediction in older women. J Bone Miner Res. 2021;36(9):1708–1716. doi:10.1002/jbmr.4342
39. Kunze KN, Karhade AV, Sadauskas AJ, Schwab JH, Levine BR. Development of machine learning algorithms to predict clinically meaningful improvement for the patient-reported health state after total hip arthroplasty. J Arthroplasty. 2020;35(8):2119–2123. doi:10.1016/j.arth.2020.03.019
40. Forghani R, Chatterjee A, Reinhold C, et al. Head and neck squamous cell carcinoma: prediction of cervical lymph node metastasis by dual-energy CT texture analysis with machine learning. Eur Radiol. 2019;29(11):6172–6181. doi:10.1007/s00330-019-06159-y
41. Chee CG, Yoon MA, Kim KW, et al. Combined radiomics-clinical model to predict malignancy of vertebral compression fractures on CT. Eur Radiol. 2021;31(9):6825–6834. doi:10.1007/s00330-021-07832-x
42. Park JE, Park SY, Kim HJ, Kim HS. Reproducibility and generalizability in radiomics modeling: possible strategies in radiologic and statistical perspectives. Korean J Radiol. 2019;20(7):1124–1137. doi:10.3348/kjr.2018.0070
 © 2022 The Author(s). This work is published and licensed by Dove Medical Press Limited. The full terms of this license are available at https://www.dovepress.com/terms.php and incorporate the Creative Commons Attribution - Non Commercial (unported, v3.0) License.
By accessing the work you hereby accept the Terms. Non-commercial uses of the work are permitted without any further permission from Dove Medical Press Limited, provided the work is properly attributed. For permission for commercial use of this work, please see paragraphs 4.2 and 5 of our Terms.
© 2022 The Author(s). This work is published and licensed by Dove Medical Press Limited. The full terms of this license are available at https://www.dovepress.com/terms.php and incorporate the Creative Commons Attribution - Non Commercial (unported, v3.0) License.
By accessing the work you hereby accept the Terms. Non-commercial uses of the work are permitted without any further permission from Dove Medical Press Limited, provided the work is properly attributed. For permission for commercial use of this work, please see paragraphs 4.2 and 5 of our Terms.