")
Back to Journals » Neuropsychiatric Disease and Treatment » Volume 10
Predicting the clinical outcome of stimulant medication in pediatric attention-deficit/hyperactivity disorder: data from quantitative electroencephalography, event-related potentials, and a go/no-go test
Authors Ogrim G , Kropotov J, Brunner JF, Candrian G, Sandvik L, Hestad KA
Received 25 October 2013
Accepted for publication 16 December 2013
Published 3 February 2014 Volume 2014:10 Pages 231—242
DOI https://doi.org/10.2147/NDT.S56600
Checked for plagiarism Yes
Review by Single anonymous peer review
Peer reviewer comments 3
Geir Ogrim,1–3 Juri Kropotov,3–5 Jan Ferenc Brunner,3,6,7 Gian Candrian,8 Leiv Sandvik,9 Knut A Hestad3,10
1Neuropsychiatric Unit, Østfold Hospital Trust, Fredrikstad, Norway; 2National Resource Center for ADHD, Tourette's Syndrome, and Narcolepsy, Oslo, Norway; 3Institute of Psychology, Norwegian University of Science and Technology, Trondheim, Norway; 4Institute of the Human Brain, Russian Academy of Sciences, Saint Petersburg, Russia; 5Department of Neuropsychology, Andrzej Frycz Modrzewski Krakow University, Krakow, Poland; 6Department of Physical Medicine and Rehabilitation, St Olav's Hospital, Trondheim, Norway; 7Department of Neuroscience, Norwegian University of Science and Technology, Trondheim, Norway; 8Brain and Trauma Foundation, Chur, Switzerland; 9Oslo University Hospital, Department of Biostatistics, Epidemiology, and Health Economy, Oslo, Norway; 10Division of Mental Health, Innlandet Hospital Trust, Brumunddal, Norway
Background: We searched for predictors of the clinical outcome of stimulant medication in pediatric attention-deficit/hyperactivity disorder (ADHD), emphasizing variables from quantitative electroencephalography, event-related potentials (ERPs), and behavioral data from a visual go/no-go test.
Methods: Nineteen-channel electroencephalography (EEG) was recorded during the resting state in eyes-open and eyes-closed conditions and during performance of the cued go/no-go task in 98 medication-naïve ADHD patients aged 7–17 years and in 90 controls with the same age and sex distribution as the patients. For patients, the recording was followed by a systematic trial on stimulant medication lasting at least 4 weeks. Based on data from rating scales and interviews, two psychologists who were blind to the electrophysiological results independently rated the patients as responders (REs) (N=74) or non-responders (non-REs) (N=24). Using a logistic regression model, comparisons were made between REs and non-REs on the EEG spectra, ERPs (cue P3, contingent negative variation, and P3 no-go of the ERP waves and independent components [ICs] extracted from these waves), reaction time, reaction time variability, number of commission and omission errors, intelligence quotient, age, sex, ADHD subtype, and comorbidities.
Results: The two groups differed significantly on eight of the variables, with effect sizes (Cohen's d) ranging from 0.49 to 0.76. In the multivariate logistic regression analysis, only three of these variables were significantly associated with clinical outcome. The amplitude of the IC cue P3, which has a parietal–occipital distribution, was normal in REs but significantly smaller in non-REs, whereas the centrally distributed IC P3 no-go early was smaller in REs than in non-REs and controls. In addition, the REs had more power in the EEG theta band. A quartile-based index was calculated using these three variables. The group with the lowest scores comprised only 36% REs; response rates in the three other groups were 83%, 86%, and 89%.
Conclusion: The clinical outcome of stimulant medication was best predicted by electrophysiological parameters. The brain dysfunctions of the REs appear to be primarily associated with prefrontal lobe hypoactivation. The non-REs were deviant from the controls in parietal–occipital functions.
Keywords: ADHD, stimulants, predictions, clinical outcome, QEEG, ERP, go/no-go test
Introduction
Attention-deficit/hyperactivity disorder (ADHD)1,2 has a prevalence of approximately 3%–6% in school-aged children, relatively consistent across class, culture, and race.3,4 According to the Diagnostic and Statistical Manual of Mental Disorders, fourth edition (DSM-IV)2 (and DSM-55), the combined subtype (ADHD-C) is characterized by six or more symptoms of hyperactivity/impulsivity and six or more symptoms of inattention. The predominantly inattentive subtype (ADHD-I) requires six or more symptoms of inattention only, and the hyperactive/impulsive subtype (ADHD-H) requires six or more symptoms of hyperactivity/impulsivity. In the DSM-5, this subtyping is kept, although it is pointed out that a change of subtype throughout the lifespan of the disorder is not uncommon. Symptoms have to be present in more than one setting, start in childhood, and should not be better explained by other psychiatric conditions. In the DSM-5, ADHD has been moved from the category of disruptive behavior disorders to neurodevelopmental disorders. Comorbid conditions, such as behavioral disorders, anxiety, and learning disabilities, are seen in the majority of cases.6 Although ADHD is considered a brain-based disorder, no neuropsychological or neurophysiological test results are necessary to make the diagnosis.
Psychosocial interventions are commonly supplemented by psychostimulants like methylphenidate (MPH), dextroamphetamine (DEX), and the nonstimulant atomoxetine (ATX). Therapeutic effects and side effects of psychostimulants are described in several studies.7–13 MPH has shown a therapeutic response in approximately 70% of patients.14 A shift to DEX or ATX for non-responders (non-REs) increases therapeutic effects to 80%.4 Therapeutic response to MPH may vary from patient to patient. Numerous studies have generally implicated the fronto-subcortical networks of the brain as a prime candidate for the source of the underlying dysfunction, including hypofunctioning dopamine and norepinephrine systems.15 The influence of genetic factors is well documented.4,16
Behavior ratings from parents and teachers are generally used as outcome measures. Because these scales are vulnerable to placebo and source effects, the inclusion of such objective measures as continuous performance tests (CPTs) has been recommended by several authors.17 There is no consensus on what constitutes a meaningful clinical response. Improvement of at least 0.5 standard deviations (SDs) on an ADHD rating scale or at least a 25% reduction in raw scores is often used. Doses for optimal cognitive improvement seem to be lower than for behavioral improvement.18 Sangal and Sangal19 argue that a suboptimal clinical response is too often accepted. If response is defined more strictly, allowing for a return to normal, the usual quoted 70% response will drop to 40%. The authors also argue that the reduction in symptom raw scores should be at least 50%, in order to control for placebo effects.
The literature on electroencephalography (EEG) and event-related potentials (ERPs) in ADHD is extensive. Some studies relate to biomarkers or endophenotypes, searching for objective characteristics in EEGs and ERPs that may be helpful in a differential diagnosis. Others focus on changes in EEGs and ERPs resulting from treatment, particularly medication and neurofeedback. Using a quantitative EEG (QEEG), many studies find excess power in the theta band (4–7 Hz) and/or an increased theta:beta ratio (ie, 4–7:13–21 Hz) in ADHD, in agreement with theories of cortical hypoactivation.20 More recent studies have found, however, that the excessive theta:beta ratio characterizes only a subgroup of ADHD. We recently found this pattern in 26% of pediatric ADHD patients, compared with 2.5% in healthy controls.20–22 In addition to excess theta, other EEG-based subtypes of ADHD have been reported: excess beta, excess alpha, low alpha peak frequency, and hypercoherence.20,23–28
Several researchers have examined changes in EEG parameters resulting from stimulant medication and EEG predictors of clinical response. Most – but not all of them – report that stimulants induce changes toward normalization, like reduction in theta and, to some extent, increases in beta frontally.29–40 Power in the alpha and low beta band seems to increase in patients and controls.41,42 In a review of the clinical utility of EEG in ADHD, it was concluded that good responders (REs) to stimulants have an excess of slow wave activity (theta), and that stimulant medication results in increased beta, reduced theta, and improvements in deviant ERP measures.29 One study reported that stimulants increased beta in medication REs and reduced beta in non-REs.43 The beta excess found in the beta subtype of ADHD does not reflect hyperactivation, because it was reduced by stimulants.44 In a study comparing children with ADHD and controls, significant deviances in ERP components N1, P2, and N2 were not present after administration of MPH to the patients.45 Hermens et al15 classified ADHD patients as REs or non-REs on the basis of behavioral measures in an oddball task and a working memory task. ERPs were also extracted from these tasks. Correct classifications based on ERPs were reported for 85%–90% of the cases. In a study using an oddball paradigm, it was found that the ratio of right fronto-central to parietal P300 ERP component predicted robust clinical response to stimulants.46 Recent reviews of the literature on EEG in ADHD provide further details.20,22,27
ERPs are electrophysiological expressions of information processes that appear as curves with characteristic peaks and troughs when the background EEG has been cancelled out. ERPs are characterized by latencies in milliseconds (ms), amplitudes in microvolt (μV), and topography. ERP waves are associated with underlying stages of sensory-related and action-related information flow in various cortical areas. Deviances in ADHD have been reported for several ERP components. The P3b wave (peaking 300–500 ms after stimulus presentation) can be found in paradigms like oddball and go/no-go in which action is involved.47 The amplitude of the component is said to reflect the allocation of attention resources, and latency reflects classification speed.48 Cue P3 with a parietal/occipital location occurs as a response to target-relevant information.49,50 The contingent negative variation (CNV) is a low potential evoked in cued paradigms (go/no-go, signal stop) when an individual prepares for action.51-53 ERP waves are regarded as the sum of multiple sources generated in different locations and associated with different neural processes.54 In a recent study,55 we describe how these multiple sources comprising the ERP waves can be decomposed into reliable independent components (ICs) with different functional meanings.55,56
Many studies have reported P3 waves (go and no-go) to be deviant in ADHD.49,50, 57–60 In a recent longitudinal study,61 CNV was found to be the only ERP component with significantly smaller amplitude in ADHD patients of all ages, compared with controls. There was no evidence of normalization with increasing age.50 A number of studies have examined changes in P3, CNV, and other ERP components resulting from stimulant medication.62–66 The most consistent finding is an increase of amplitude in P3 components. Interestingly, one study found an increase in P3 amplitude when correct responses were rewarded.67 The CNV can be seen as a dopaminergic biomarker, as the amplitude of this component was shown to increase following an intake of stimulant medication in a group of healthy young adults.68,69 Kratz et al70 report that MPH administered to a group of children with ADHD resulted in reduced reaction time variability accompanied by an increase in CNV.
Predicting clinical responses to stimulants is complicated for several reasons. Some attention-enhancing effects of stimulants have been reported even for control subjects,69,71 although smaller than those seen in ADHD medication REs. As mentioned, there is no consensus about the definition of an adequate medication response or the measures that should be included. When informants evaluate effects, the presence of side effects may influence their opinion. We recently found a significant negative correlation of −0.38 between clinical effects and side effects.72 Hale et al18 found that patients with adequate baseline performances on tests for “cool” and “hot” executive function did not show robust clinical effects of stimulants. Children with ADHD-I may respond more poorly to stimulants than do children with ADHD-C, and comorbidities related to anxiety and autism spectrum disorders may increase the risk of a poor response.18,73,74
Based on the ADHD literature, we hypothesized that good REs to stimulant treatment – compared with non-REs – belong to the ADHD-C subtype; are characterized by a lack of comorbid anxiety, learning, and autism spectrum disorders; and have more impaired behavioral results on the go/no-go test. We also hypothesized that REs, compared with non-REs, would not have excess beta, would have more power in the theta band, a higher alpha peak frequency, and smaller amplitudes in ERPs – all of which have been found in several studies to be deviant in ADHD (cue P3, CNV, P3 no-go) compared with non-REs.
Methods
Participants
Ninety-eight consecutive clinical cases aged 7–17 years diagnosed with ADHD were included in the study, along with 90 controls drawn from the HBi normative database (http://www.hbimed.com), with the same age and sex distributions, mean ages, SDs, and maximum and minimum ages. The controls were typically developing children without psychiatric, neurological, developmental, or learning disorders. The test equipment (QEEG, go/no-go task) was identical for patients and controls. The HBi database for cases aged 7–17 years contains 300 subjects. After positive screening for ADHD by the GP, the school psychology service, or the local child psychiatry outpatient clinic, the 98 patients were referred to our study with the neuropsychiatric team in the county of Østfold, Norway, for further diagnostic assessment and treatment. They were all diagnosed with either ADHD-C or ADHD-I. The majority had comorbid diagnoses (Table 1). All diagnostic conclusions were in accordance with the DSM-IV and based on clinical interviews with parents (Kiddie Schedule for Affective Disorders and Schizophrenia or Development and Well-Being Assessment);75,76 developmental and medical histories; rating scales from parents, teachers, and, in some cases, self-reports; and intelligence testing (the Wechsler Intelligence Scale for Children III/IV or the abbreviated form, the Wechsler Adult Intelligence Scale). These data were supplemented with neuropsychological assessment, reports from the school psychology service and GP, and, in some cases, more informal meetings with parents and teachers. In most cases, the parent and teacher forms of both Conners’ Rating Scale – Revised (CRS-R),77 and the Behavior Rating Inventory of Executive Function (BRIEF)78 were administered. Reports from the schools and the school psychology service included information regarding social functioning, behavior, learning disorders, and the need for special education. Learning disorders represented a mixed group of general learning disabilities (an intelligence quotient [IQ] below 80 with significant learning problems in several school subjects requiring special education) or specific learning disabilities (including dyslexia and dyscalculia with an IQ above 80). Another category, “other disorders,” included Tourette’s syndrome and reactive attachment disorder. Diagnostic conclusions were discussed in the team, which comprised two specialists in neuropsychology, a pediatrician, and a specialist in school psychology. The project was approved by the Regional Committee for Medical Research Ethics.
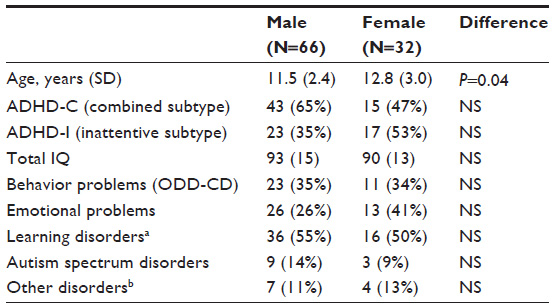 | Table 1 Demographics of the ADHD sample by sex |
After diagnostic conclusions were drawn, all 98 patients were offered a systematic trial on stimulant medication lasting at least 4 weeks. All testing used in predictions was carried out before onset of medication. The standard procedure consisted of the administration of single tablets of MPH during the trial period, titrated from 5 mg × 1 per day up to a maximum of 20 mg × 3 per day – lower if side effects occurred or if significant clinical effects were observed on lower doses. Seven of the patients, who were also participating in another study, underwent a similar procedure on DEX, based on test results in that study. (A χ2 test showed no difference in clinical effects for the two medications [P=0.64]).
Parents and teachers completed daily ratings of ADHD symptoms before the trial period started and during the 4-week period. Children aged over 9 years were asked to complete daily self-ratings. Some of the parents and teachers filled in four-point ratings consisting of the 18 ADHD symptoms in the DSM-IV. In other cases, abbreviated forms were used, asking for comparisons with the period before onset of medication (better, as usual, or worse). Similarly, the children were asked to evaluate their attention, behavior, and feelings as better, worse, or the same, comparing with the period before onset of medication. The parents were invited to contact us with any questions they might have during this period, and after 4 weeks we arranged a meeting with those involved. Parents, teachers, and the majority of patients aged over 12 years accepted the invitation. Parents, teachers, and children were asked informally to tell us about the last 4 weeks. Was there anything new, anything positive, or anything negative to report? Did they perceive that the medication had produced any changes? What were the effects of increased doses? We also asked them to describe any side effects compared with the weeks before medication started. The rating scales were examined, and a conclusion was usually drawn about further medication. This decision was followed by telephone contacts and meetings, as needed, before the case was referred back to the outpatient clinic.
The forms used to evaluate therapeutic effects and side effects were not the same in all cases, and some key information conveyed in meetings and phone calls did not show up in the rating scales. We therefore used the following method to evaluate clinical effects. In accordance with clinical routines, all the information acquired from meetings, phone calls, rating scales, and testing was registered in the patient journals. This information, which did not include data from QEEG/ERP testing, was independently evaluated by the first author and a psychologist from the team. The following criteria regarding clinical effects were used. We started with a 2–1–0 scale (2= significant positive changes; 1= moderate positive changes, or seen only at school or at home; 0= small/insignificant or negative clinical changes). The team’s two psychologists also rated the effects on a 1–0 basis, splitting the “mid-group” into REs and non-REs, which resulted in a “responder” classification for most patients. Agreement on the 2–1–0 scale was 80% before discussions and higher on the 1–0 scale that was used in the statistical analyses. The parents gave written consent for their children to participate, and the children were informed.
Assessment of QEEG and ERP
All assessments were completed before onset of medication tryout. The time interval was between 2 weeks and 5 weeks, with very few exceptions, and no difference between the RE and non-RE groups. EEGs were recorded using a Mitsar 201 (Mitsar Co, Ltd, Saint Petersburg, Russia) (http://www.mitsar-medical.com), a PC-controlled, 19-channel electroencephalographic system. The input signals referenced to the linked ears were filtered between 0.5 Hz and 50 Hz and digitized at a sampling rate of 250 Hz. Impedance was kept below 5 kOhm for all electrodes. An electrode cap with tin electrodes based on the International 10–20 system (Electro-cap International, Eaton, OH, USA) was used. Quantitative data were obtained from WinEEG software (Mitsar Co, Ltd) common reference montage prior to data processing.79 Eye-blink artifacts were corrected by zeroing the activation curves of individual independent component analysis components corresponding to eye blinks.80 In addition, epochs of the filtered electroencephalogram with excessive amplitude (>100 μV) and/or presented with excessively fast (>35 μV in 20–35 Hz band) and slow (>50 μV in 0–1 Hz band) frequency activities were automatically marked and excluded from further analysis. Finally, the EEG was manually inspected to verify artifact removal. All 98 patients and 90 controls were tested in eyes-closed, eyes-open, and task conditions in the cued go/no-go task comprising 400 pairs of pictures and lasting 20 minutes. The pictures were presented for 100 ms. In each pair the interstimulus interval was 1,000 ms. The time interval between pairs was 1,800 ms. The instruction was to press the button only when the two pictures in a pair were animals (A-A: go) – not “animal-plant” (A-P: no-go), “plant-human,” or “plant-plant” (100 pairs of pictures in each category). ERPs were recorded during a visual continuous performance task (VCPT). See Mueller et al79 for a more detailed description of the task. Correct responses had to occur within a time window from 200 ms to 1,000 ms after stimulus presentation.
The ERPs for each individual are based on averaging the trials of the respective task conditions after artifact correction. ERPs based on fewer than 20 trials may not be valid. This was true for one person in each group. The mean number of trials (and SDs) for REs and non-REs in go and no-go conditions were REs go: 60 (23), no-go: 66 (21); and non-REs go: 70 (19), no-go: 70 (22) (P=0.054). Although the number of trials was lower in REs compared with non-REs, the number of valid trials was still high in both groups, and the group means were not influenced by the difference.
Variables in the model
Differences between the two groups before medication were checked on 13 continuous and ten categorical/dichotomous variables.
Demographic variables: sex, age, IQ
- Diagnostic variables: subtype of ADHD (ADHD-C or ADHD-I); comorbidity (behavior problems [oppositional defiant disorder–conduct disorder], emotional problems [anxiety/depression], learning disorders, and autism spectrum disorders).
- Behavioral variables from the go/no-go test: omission errors, commission errors, reaction time, and reaction time variability.
- Variables from EEG spectra: grand average spectra curves in the task condition for the RE and non-RE groups were computed in WinEEG. Subtracting the non-RE curve from the RE curve highlights possible significant differences in spectra between the groups. This information was used as a guideline for exporting individual data to the SPSS statistical program (IBM Corporation, Armonk, NY, USA) for further analysis. The mean theta sums at sites P3, P4, Pz, T5, T6, T3, and T4 were exported.
In addition, each patient was individually compared with the HBi database and classified as deviant or not deviant in the theta, alpha, and beta bands. For a person to be judged as deviant, the statistical deviance had to be seen in at least two of the three conditions eyes closed, eyes opened, or go/no-go task, and the pattern had to be confirmed in relative power. Statistical significance was set at 0.05. Alpha peak frequency, defined as the frequency with maximal reduction in alpha power from the eyes-closed to the eyes-open condition, was included in the analysis because it has been reported to be lower in non-REs.31
ERP variables
ERPs in the cued go/no-go task were selected on the basis of the literature on ADHD showing that cue P3, CNV, and P3 no-go are particularly sensitive to ADHD.49,57,59 The selected ERP waves were decomposed into ICs, as described in our earlier studies.55,56,81 In the present study, the spatial filters for extracting ICs from the individual ERPs were based on 102 controls, as we describe in detail in Brunner et al.55 The amplitudes of these ICs were exported to SPSS for further analysis. The amplitude of the back-projected IC cue P3 was measured at Pz as peak amplitude in the 220–400 ms time window after presentation of the first stimulus. The amplitude of the back-projected IC CNV late was measured at Cz as averaged amplitude in time interval 900–1,100 ms after the first stimulus presentation. The amplitude of the back-projected IC P3 no-go early was measured at Cz as peak amplitude in the 250–470 ms time window after presentation of the second stimulus.
Statistical methods
Logistic regression was used to identify factors associated with clinical effects of stimulant medication. In step 1, all 23 variables were checked for significant differences between the groups based on t-tests (13 continuous variables) and χ2 tests (ten categorical variables). A correlation was run on all the variables. Because we found no correlations >0.70 or <−0.70, no variables were excluded from the model. Significant variables in step 1 were used in logistic regression, applying forward variable selection (Wald). Statistical analyses were performed in SPSS Vol 18 (http://www.spss.com), and the significance level was set at 5%.
Results
Demographics of REs and non-REs are shown in Table 2. An overview of the positive medication effects reported for the group of 74 medication REs at least 4 weeks after the onset of medication tryout is shown in Table 3. The eight categories (emotion, social, attention, executive function, impulsivity, hyperactivity, alert, other) are partly overlapping.
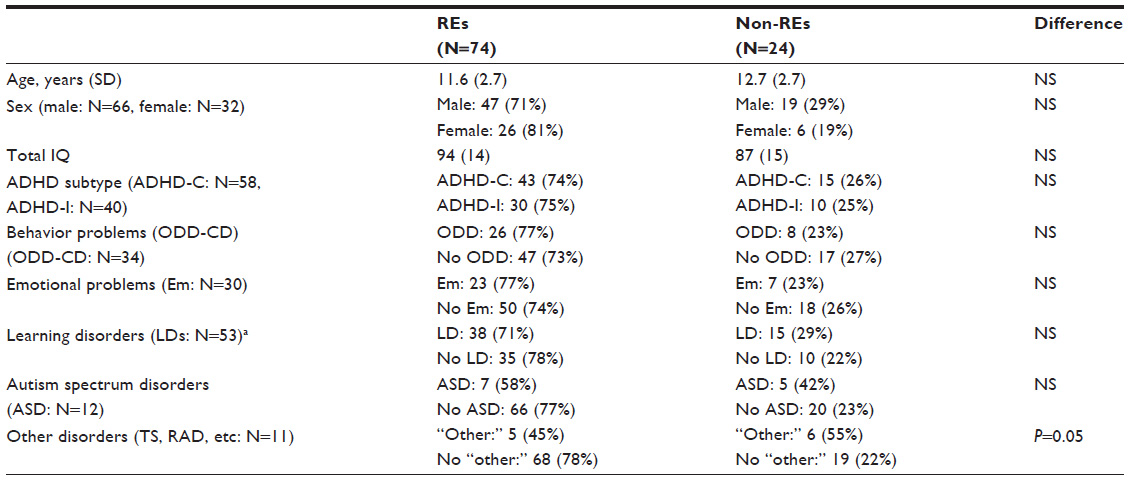 | Table 2 Demographics in responder (RE) and nonresponder (non-RE) groups |
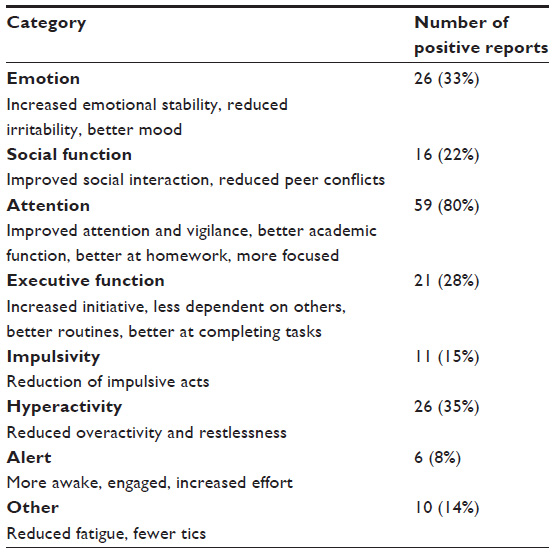 | Table 3 Positive effects of medication reported for respondersa |
Eight of the 13 continuous variables and two of the ten categorical variables that were checked were significantly different in the RE and non-RE groups. The categorical variables that were significantly different in the RE and non-RE groups were excess theta (P=0.011) (the RE group had significantly more power in the theta band) and excess alpha (P=0.038) (the non-RE group had significantly more posterior alpha). The significant continuous variables are shown in Table 4. There was no significant difference between the two groups in five of the continuous variables (age, verbal IQ, total IQ, commission errors, and alpha peak frequency) and four of the categorical variables (sex, subtype of ADHD, comorbid disorders [behavioral, emotional, learning, autism spectrum]) and two of the deviances in spectra (excess beta, excess mu). The categorical variables that were significantly different in the RE and non-RE groups were excess theta (P=0.011) (the RE group had significantly more power in the theta band) and excess alpha (P=0.038) (the non-RE group had significantly more posterior alpha).
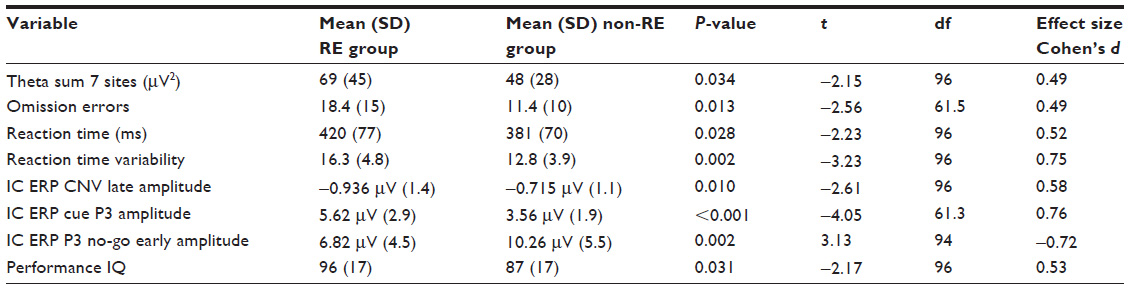 | Table 4 Independent samples t-tests showing continuous variables with significant differences between the responder (RE) group and the nonresponder (non-RE) groupa |
Three of the significant variables were amplitudes of ERP components: IC CNV late, IC no-go early, and IC cue P3 (Table 4). The RE group had significantly more power in the theta band, whereas the non-RE group had more posterior alpha. The finding of excess theta in the RE group (task condition) was confirmed when the means of theta values at all 19 sites were compared: RE: 9.4 μV2 (2.6), non-RE: 7.3 μV2 (1.6), P=0.007, effect size; Cohen’s d=0.92. Comparing grand average spectra in the RE and non-RE groups, we found that the amplitude of the mean alpha peaks at sites O1 and O2 were 1.86 μV2 for REs and 2.50 μV2 for non-REs (controls: 1.63 μV2), supporting the alpha finding based on categorical classifications. We also found that the RE group had a significantly slower reaction time and significantly higher reaction time variability in the VCPT than did the non-RE group.
Logistic regression, forward variable selection (Wald), was performed to assess the impact of the ten significant variables on clinical effects of stimulant medication. Three of the variables were statistically significant in the multivariate logistic regression model (IC cue P3, IC no-go early, and excess theta in EEG spectra; individually scored, compared with age norms). Results for IC cue P3 and IC no-go early are shown in Figures 1 and 2. The figures also include the results of the 90 controls from the HBi database, with the same age and sex distributions as the patients. IC cue P3, which has a parietal/occipital distribution, was close to normal in the RE group but significantly lower in amplitude in the non-RE group. The opposite was true for IC P3 no-go early, which has a frontal distribution; the amplitude of the component was lower in the RE group, whereas the non-RE group was close to normal controls. These two continuous IC ERP variables were transformed into quartiles. For both variables, low scores (after inversion of IC P3 no-go early) were associated with a lack of clinical response. The 25% of children with the lowest scores on the scale were given a score of 1, the next 25% group a score of 2, and so on. The scores for the categorical variable “excess theta” were 1 (normal) or 3 (significantly deviant from norms). These scores were summed for each patient, resulting in scores from 3 to 11. This 9-point scale was later transformed to an approximation of a quartile scale (the number of patients in each group: quartile 1=22, quartile 2=18, quartile 3=21, quartile 4=35 [missing data for one RE and one non-RE]). As Figure 3 shows, there were only 36% REs in quartile 1, compared with 83%, 86%, and 89% REs in quartiles 2, 3, and 4, respectively.
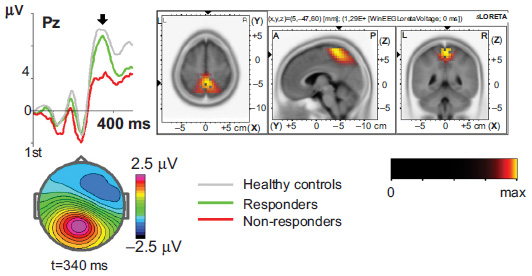 | Figure 1 The independent component cue P3 is decreased in non-responders (non-REs). |
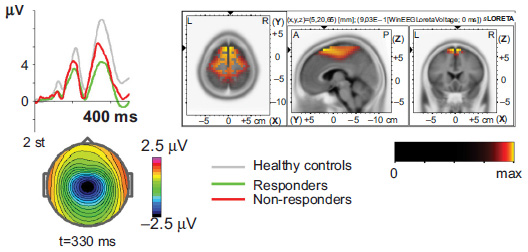 | Figure 2 The independent component no-go early is decreased in the responder (RE) group. Left: the independent component for the group of REs (green) and non-REs (red) in comparison with the group of healthy controls (grey). X-axis – time after the onset of the second stimulus in ms. Y-axis – amplitude of the component back-projected and measured at Cz. Right: the standardized low-resolution brain electromagnetic tomography (sLORETA) image of the cortical generators of the component. The scale is shown below. Bottom: the map of the difference REs minus non-REs. The scale is shown on the right. |
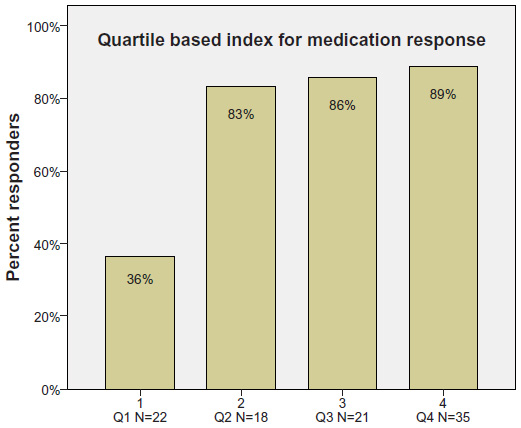 | Figure 3 Based on scores combining the three significant variables, patients were placed in four (quartile [Q]) groups. Only 36% in the first group were responders. In quartile groups 2, 3, and 4, 83%, 86%, and 89% were responders. |
Comparisons with controls
The two ERP components that differed significantly between the RE and non-RE groups were also computed for the 90 controls. As Figures 1 and 2 show, the RE group was close to normal on the IC cue P3 variable, whereas the non-RE group had a much smaller component. On IC P3 no-go early, controls had the strongest component, 9.01 μV compared with 4.30 μV for the RE group. The amplitude for the non-RE group was 6.38 μV.
Compared with the 90 controls, the reaction time of the RE group was close to normal (420 ms vs 450 ms in controls; non-RE =381 ms). Regarding reaction time variability, both clinical groups had higher scores than controls had, the non-RE group being closest to the controls (RE =16.3, non-RE =12.8, controls =11.7).
Discussion
From 23 parameters describing demographic and diagnostic factors, IQ, behavioral parameters in the go/no-go task, EEG spectra, and ERP parameters, three parameters contributed independently to the prediction of clinical response to stimulant medication. They were all associated with brain electrophysiology; two were amplitudes of ERP components and one was the power of EEG spectra in the theta band. As confirmed in this study, excess power in the theta band is typical for a relatively large subgroup of ADHD20–22 and a predictor of clinical response to stimulants.32,40,42,43,82 The amplitude of IC cue P3 was smaller among non-REs than among REs. The REs did not differ from controls on this variable. The cue P3 wave has a parietal distribution and appears to reflect processes of orienting to relevant information.49,50,83 The decrease of the cue P3 wave in ADHD was reported in a previous study.49 In our study, decreased IC cue P3 was present primarily in the non-RE group. If we consider the distribution of receptors for major mediator systems, the parietal orienting network is primarily innervated by noradrenergic pathways.84,85 On the basis of these data, we can speculate that the non-RE group may respond to ATX as an inhibitor of noradrenalin receptors, which has been reported in another study.4 An opposite pattern was shown for the amplitude of IC P3 no-go early in our study. It was smaller in the RE group than in the non-RE group. In several previous studies, the amplitude of the P3 no-go wave was shown to decrease in the ADHD population.59 IC P3 no-go early is part of the P3 no-go wave, and our results seem to be in agreement with that previous research. According to sLORETA (standardized low-resolution brain electromagnetic tomography, http://www.uzh.ch/keyinst/loreta.htm), this component is generated in the supplementary motor area of the prefrontal cortex,56 an area that receives high-density inputs for the dopaminergic system.86 We therefore suggest that members of the RE group are demonstrating frontal lobe dysfunction and are responsive to medication directed to the dopaminergic system.
Excess theta in the central–frontal electrodes has been found in many studies on ADHD.20,22 In the Introduction section of this paper, we refer to studies showing that ADHD patients with this EEG pattern respond favorably to stimulant medication. Our data support these studies. In our group of REs, however, the excess of theta was more widely distributed, including in the posterior regions of the cortex. Our non-RE group showed more posterior alpha activity than the RE group did. The posterior alpha is considered as an idling rhythm because it increases in the eyes-closed condition.87 Posterior brain regions in the non-RE group may be idling to a greater extent than is seen in the RE group and in controls, corresponding to the reduced amplitude of IC cue P3 in non-REs. In addition, we found that the non-RE group had a significantly lower performance IQ than the RE group (Table 4). Reduced-IC cue P3 and reduced-performance IQ correlated significantly (r=0.22), but the correlation with verbal IQ was not significant (0.09). Taken together, these data suggest that the non-RE group is characterized by a parietal/posterior dysfunction.
Our hypotheses regarding theta and ERPs were confirmed. We did not find a relationship between alpha peak frequency and medication effects, however, as reported by Arns et al,31 who found that ADHD patients with low alpha peak frequencies, mimicking excess theta, showed suboptimal medication responses. Our study and the Arns et al31 study both found a relationship between excess posterior alpha and nonresponse to stimulants, however. The subgroup of ADHD patients with excess power in the beta band has been seen as cortically hyperaroused and not expected to be stimulant REs. This view was not supported in a study by Clarke et al44 reporting positive medication response for this subgroup. In a recent study, the same authors concluded that the beta subtype of ADHD is not hyperaroused.88 The data from our study agree with the findings of Clarke et al.
We hypothesized that comorbid learning disabilities, anxiety disorders, and autism/Asperger’s syndrome predict nonresponse. These hypotheses were not confirmed. In our previous study on side effects,72 comorbid learning disabilities and anxiety (measured by indexes in ERP) increased the risk of adverse effects. It may be that the widely accepted notion that comorbidity reduces medication effects is partly related to side effects.
We also predicted that patients with the most deviant behavioral results in VCPT would turn out to be REs. This was found to be the case for omission errors and reaction time variability, and confirms research showing that such deviances are common in ADHD and improve with medication.20 It is also a reasonable hypothesis that patients with the most pronounced difficulties have the most to gain from treatment. In a previous study,72 we found that a fast reaction time was associated with side effects. In this study we found the same association with non-RE. Both findings are in accordance with studies showing that choice reaction time is associated with frontal lobe function.89
Limitations
Based on all available information from rating scales and interviews, medication effects were independently evaluated by two psychologists, one of them being the first author. Although he was blind to all data involved in predictions, it can be claimed that a key author who is responsible for interpretations of data should not be involved in such subjective decisions. A scale with scores of 2–1–0 was later converted into a 1–0 scale (see Methods section). An outcome measure that included a rating scale of ADHD symptoms might have resulted in more details. On the other hand, the key question in the clinic is whether or not there is an effect. We report effects on optimal dose after 4 weeks. We have no data relating effects to dose. Although this could be seen as a limitation, we would argue that our procedures are close to clinical reality. The sample size (N=98) in this study is relatively low for a logistic regression analysis with many parameters, and some key predictors found to be nonsignificant might have been significant with a larger sample size.
Clinical implications
A large number of children and adolescents with ADHD worldwide are treated with stimulants. About 20%–30% are non-REs, requiring close follow-up, careful titration, changes in medication, or reliance on other treatment options. Knowing who is at risk for nonresponse before the onset of treatment is clinically relevant. To draw the line between REs and non-REs can be difficult, as some attention-enhancing effects of stimulant medication are seen even in non-ADHD controls. In other cases, positive effects can be overshadowed by comorbid problems. Access to data predicting the probability of clinical response can be useful in such cases. As new medications for ADHD are developed, the question of “what works for whom” will be even more impelling. We argue that the non-RE group, characterized by parietal and not primarily frontal dysfunctions, may constitute a meaningful subgroup for research. Combining the results of this study with our findings on side effects72 will increase the clinical utility of the methods described.
Conclusion
Three variables in this study contributed significantly to the prediction of clinical effects of stimulant medication in pediatric ADHD: power in the QEEG theta band (excessive in REs in comparison with norms); ERP component IC cue P3, reflecting processing of target relevant information (normal in REs); and ERP component IC P3 no-go early related to inhibition of motor response (lower in REs). According to sLORETA, the IC P3 no-go early component was localized in the supplementary motor cortex (BA 6), and the IC cue P3 component was localized in the parietal cortex (BA 5). It should be stressed here that we did not find that excess beta, a low alpha peak frequency, or comorbid diagnoses predicted the negative outcome that has been reported in previous studies. We argue that the brain deviances of REs are related to dopaminergic frontal systems, whereas the deviances of non-REs are related to temporal/parietal systems that are not considered dopaminergic.
Acknowledgments
This study was financially supported by Østfold Hospital Trust, Fredrikstad, Norway. Professionally, the project is connected to the Institute of Psychology, Norwegian University of Science and Technology (NTNU), Trondheim, Norway. The statistical consultant was Professor in Statistics Leiv Sandvik, Oslo University Hospital. Access to healthy controls in the HBi database was given by Dr Andreas Müller, CEO of the Brain and Trauma Foundation, Chur, Switzerland.
Disclosure
The authors report no conflicts of interest in this work.
References
American Academy of Pediatrics. Clinical practice guideline: diagnosis and evaluation of the child with attention-deficit/hyperactivity disorder. Pediatrics. 2000;105:1158. | |
American Psychiatric Association. Diagnostic and Statistical Manual of Mental Disorders. 4th ed. Washington, DC: American Psychiatric Association; 1994. | |
Polanczyk G, Jensen P. Epidemiologic considerations in attention deficit hyperactivity disorder: a review and update. Child Adolesc Psychiatr Clin N Am. 2008;17(2):245–260. | |
Barkley RA, editor. Attention-Deficit Hyperactivity Disorder A Handbook for Diagnosis and Treatment. 3rd ed. New York: The Guilford Press; 2006. | |
American Psychiatric Association. Diagnostic and Statistical Manual of Mental Disorders: DSM-5. 5th ed. Washington, DC: American Psychiatric Association; 2013. | |
Gillberg C, Gillberg IC, Rasmussen P, et al. Co-existing disorders in ADHD: implications for diagnosis and intervention. Eur Child Adolesc Psychiatry. 2004;13 Suppl 1:I80–I92. | |
Zeiner P, Bryhn G, Bjercke C, Truyen K, Strand G. Response to methylphenidate in boys with attention-deficit hyperactivity disorder. Acta Paediatr. 1999;88(3):298–303. | |
Tannock R, Schachar RJ, Carr RP, Chajczyk D, Logan GD. Effects of methylphenidate on inhibitory control in hyperactive children. J Abnorm Child Psychol. 1989;17(5):473–491. | |
Schweitzer JB, Lee DO, Hanford RB, et al. Effect of methylphenidate on executive functioning in adults with attention-deficit/hyperactivity disorder: normalization of behavior but not related brain activity. Biol Psychiatry. 2004;56(8):597–606. | |
Pietrzak RH, Mollica CM, Maruff P, Snyder PJ. Cognitive effects of immediate-release methylphenidate in children with attention-deficit/hyperactivity disorder. Neurosci Biobehav Rev. 2006;30(8):1225–1245. doi: 10.1016/j.neubiorev.2006.10.002. | |
Lee J, Grizenko N, Bhat V, Sengupta S, Polotskaia A, Joober R. Relation between therapeutic response and side effects induced by methylphenidate as observed by parents and teachers of children with ADHD. BMC Psychiatry. 2011;11:70. | |
Solanto MV. Dopamine dysfunction in AD/HD: integrating clinical and basic neuroscience research. Behav Brain Res. 2002;130(1–2):65–71. | |
Berridge CW, Devilbiss DM, Andrzejewski ME, et al. Methylphenidate preferentially increases catecholamine neurotransmission within the prefrontal cortex at low doses that enhance cognitive function. Biol Psychiatry. 2006;60(10):1111–1120. | |
Spencer T, Biederman J, Wilens T, Harding M, O’Donnell D, Griffin S. Pharmacotherapy of attention-deficit hyperactivity disorder across the life cycle. J Am Acad Child Adolesc Psychiatry. 1996;35(4):409–432. | |
Hermens DF, Cooper NJ, Kohn M, Clarke S, Gordon E. Predicting stimulant medication response in ADHD: evidence from an integrated profile of neuropsychological, psychophysiological and clinical factors. J Integr Neurosci. 2005;4(1):107–121. | |
Nigg JT. Neuropsychologic theory and findings in attention-deficit/hyperactivity disorder: the state of the field and salient challenges for the coming decade. Biol Psychiatry. 2005;57(11):1424–1435. | |
Ramtvedt BE, Roinas E, Aabech HS, Sundet KS. Clinical gains from including both dextroamphetamine and methylphenidate in stimulant trials. J Child Adolesc Psychopharmacol. 2013;23(9):597–604. | |
Hale JB, Reddy LA, Semrud-Clikeman M, et al. Executive impairment determines ADHD medication response: implications for academic achievement. J Learn Disabil. 2011;44(2):196–212. | |
Sangal RB, Sangal JM. Attention-deficit/hyperactivity disorder: use of cognitive evoked potential (P300) to predict treatment response. Clin Neurophysiol. 2006;117(9):1996–2006. | |
Loo SK, Makeig S. Clinical utility of EEG in attention-deficit/hyperactivity disorder: a research update. Neurotherapeutics. 2012;9(3):569–587. | |
Ogrim G, Kropotov J, Hestad K. The quantitative EEG theta/beta ratio in attention deficit/hyperactivity disorder and normal controls: sensitivity, specificity, and behavioral correlates. Psychiatry Res. 2012;198(3):482–488. | |
Arns M, Conners CK, Kraemer HC. A decade of EEG theta/beta ratio research in ADHD: a meta-analysis. J Atten Disord. 2013;17(5):374–383. | |
Barry RJ, Clarke AR, Johnstone SJ. A review of electrophysiology in attention-deficit/hyperactivity disorder: I. qualitative and quantitative electroencephalography. Clin Neurophysiol. 2003;114(2):171–183. | |
Clarke AR, Barry RJ, McCarthy R, Selikowitz M. EEG-defined subtypes of children with attention-deficit/hyperactivity disorder. Clin Neurophysiol. 2001;112(11):2098–2105. | |
Clarke AR, Barry RJ, McCarthy R, Selikowitz M. Excess beta activity in children with attention-deficit/hyperactivity disorder: an atypical electrophysiological group. Psychiatry Res. 2001;103(2–3):205–218. | |
Dupuy FE, Clarke AR, Barry RJ, McCarthy R, Selikowitz M. EEG coherence in girls with attention-deficit/hyperactivity disorder: stimulant effects in good responders. Int J Psychophysiol. 2008;70(3):151–157. | |
Liechti MD, Valko L, Muller UC, et al. Diagnostic value of resting electroencephalogram in attention-deficit/hyperactivity disorder across the lifespan. Brain Topogr. 2012;26(1):135–151. | |
Chabot RJ, Serfontein G. Quantitative electroencephalographic profiles of children with attention deficit disorder. Biol Psychiatry. 1996;40(10):951–963. | |
Loo SK, Barkley RA. Clinical utility of EEG in attention deficit hyperactivity disorder. Appl Neuropsychol. 2005;12(2):64–76. | |
Bresnahan SM, Barry RJ, Clarke AR, Johnstone SJ. Quantitative EEG analysis in dexamphetamine-responsive adults with attention-deficit/hyperactivity disorder. Psychiatry Res. 2006;141(2):151–159. | |
Arns M, Gunkelman J, Breteler M, Spronk D. EEG phenotypes predict treatment outcome to stimulants in children with ADHD. J Integr Neurosci. 2008;7(3):421–438. | |
Clarke AR, Barry RJ, Bond D, McCarthy R, Selikowitz M. Effects of stimulant medications on the EEG of children with attention-deficit/hyperactivity disorder. Psychopharmacology (Berl). 2002;164(3):277–284. | |
Clarke AR, Barry RJ, McCarthy R, Selikowitz M, Brown CR, Croft RJ. Effects of stimulant medications on the EEG of children with attention-deficit/hyperactivity disorder predominantly inattentive type. Int J Psychophysiol. 2003;47(2):129–137. | |
Clarke AR, Barry RJ, McCarthy R, Selikowitz M, Johnstone SJ. Effects of stimulant medications on the EEG of girls with attention-deficit/hyperactivity disorder. Clin Neurophysiol. 2007;118(12):2700–2708. | |
Clarke AR, Barry RJ, McCarthy R, et al. Effects of methylphenidate on EEG coherence in attention-deficit/hyperactivity disorder. Int J Psychophysiol. 2005;58(1):4–11. | |
Chabot RJ, Orgill AA, Crawford G, Harris MJ, Serfontein G. Behavioral and electrophysiologic predictors of treatment response to stimulants in children with attention disorders. J Child Neurol. 1999;14(6):343–351. | |
Lubar JF, White JN Jr, Swartwood MO, Swartwood JN. Methylphenidate effects on global and complex measures of EEG. Pediatr Neurol. 1999;21(3):633–637. | |
Song DH, Shin DW, Jon DI, Ha EH. Effects of methylphenidate on quantitative EEG of boys with attention-deficit hyperactivity disorder in continuous performance test. Yonsei Med J. 2005;46(1):34–41. | |
Suffin SC, Emory WH. Neurometric subgroups in attentional and affective disorders and their association with pharmacotherapeutic outcome. Clin Electroencephalogr. 1995;26(2):76–83. | |
Clarke AR, Barry RJ, McCarthy R, Selikowitz M, Croft RJ. EEG differences between good and poor responders to methylphenidate in boys with the inattentive type of attention-deficit/hyperactivity disorder. Clin Neurophysiol. 2002;113(8):1191–1198. | |
Saletu B, Anderer P, Saletu-Zyhlarz GM. EEG topography and tomography (LORETA) in the classification and evaluation of the pharmacodynamics of psychotropic drugs. Clin EEG Neurosci. 2006;37(2):66–80. | |
Mucci A, Volpe U, Merlotti E, Bucci P, Galderisi S. Pharmaco-EEG in psychiatry. Clin EEG Neurosci. 2006;37(2):81–98. | |
Loo SK, Hopfer C, Teale PD, Reite ML. EEG correlates of methylphenidate response in ADHD: association with cognitive and behavioral measures. J Clin Neurophysiol. 2004;21(6):457–464. | |
Clarke AR, Barry RJ, McCarthy R, Selikowitz M, Clarke DC, Croft RJ. Effects of stimulant medications on children with attention-deficit/hyperactivity disorder and excessive beta activity in their EEG. Clin Neurophysiol. 2003;114(9):1729–1737. | |
Broyd SJ, Johnstone SJ, Barry RJ, et al. The effect of methylphenidate on response inhibition and the event-related potential of children with attention deficit/hyperactivity disorder. Int J Psychophysiol. 2005;58(1):47–58. | |
Sangal RB, Sangal JM. Attention-deficit/hyperactivity disorder: cognitive evoked potential (P300) topography predicts treatment response to methylphenidate. Clin Neurophysiol. 2004;115(1):188–193. | |
Falkenstein M, Hoormann J, Hohnsbein J. ERP components in go/nogo tasks and their relation to inhibition. Acta Psychol (Amst). 1999;101(2–3):267–291. | |
Polich J. Neuropsychology of P300. In: Luck SJ, Kappenmann E, editors. The Oxford Handbook of Event-Related Potentials Components. 1st ed. Oxford, UK: Oxford University Press; 2012:159–187. | |
Spronk M, Jonkman LM, Kemner C. Response inhibition and attention processing in 5- to 7-year-old children with and without symptoms of ADHD: an ERP study. Clin Neurophysiol. 2008;119(12):2738–2752. | |
Doehnert M, Brandeis D, Imhof K, Drechsler R, Steinhausen HC. Mapping attention-deficit/hyperactivity disorder from childhood to adolescence: no neurophysiologic evidence for a developmental lag of attention but some for inhibition. Biol Psychiatry. 2010;67(7):608–616. | |
van Rijn H, Kononowicz TW, Meck WH, Ng KK, Penney TB. Contingent negative variation and its relation to time estimation: a theoretical evaluation. Front Integr Neurosci. 2011;5:91. | |
Brunia CHM, van Boxtel GJM, Böcker KBE. Negative slow waves as indices of anticipation. In: Luck SJ, Kappermann ES, editors. The Oxford Handbook of Event-Related Potentional Components. 1st ed. Oxford, UK: Oxford University Press; 2012:189–208. | |
Ansari TL, Derakshan N. The neural correlates of cognitive effort in anxiety: effects on processing efficiency. Biol Psychol. 2011;86(3):337–348. | |
Kappenman ES, Luck SJ. ERP components: the ups and downs of brainwave recordings. In: Luck SJ, Kappenman ES, editors. The Oxford Handbook of Event-Related Potential Components. 1st ed. Oxford, UK: Oxford University Press; 2012:3–29. | |
Brunner JF, Hansen TI, Olsen A, Skandsen T, Håberg A, Kropotov J. Long-term test-retest reliability of the P3 NoGo wave and two independent components decomposed from the P3 NoGo wave in a visual Go/NoGo task. Int J Psychophysiol. 2013;89(1):106–114. | |
Kropotov JD, Ponomarev VA, Hollup S, Mueller A. Dissociating action inhibition, conflict monitoring and sensory mismatch into independent components of event related potentials in GO/NOGO task. Neuroimage. 2011;57(2):565–575. | |
Brandeis D, Banaschewski T, Baving L, et al. Multicenter P300 brain mapping of impaired attention to cues in hyperkinetic children. J Am Acad Child Adolesc Psychiatry. 2002;41(8):990–998. | |
Wiersema JR, Roeyers H. ERP correlates of effortful control in children with varying levels of ADHD symptoms. J Abnorm Child Psychol. 2009;37(3):327–336. | |
Johnstone SJ, Barry RJ, Clarke AR. Ten years on: a follow-up review of ERP research in attention-deficit/hyperactivity disorder. Clin Neurophysiol. 2013;124(4):644–657. | |
Mueller A, Candrian G, Kropotov JD, Ponomarev VA, Baschera GM. Classification of ADHD patients on the basis of independent ERP components using a machine learning system. Nonlinear Biomed Phys. 2010;4 Suppl 1:S1. | |
Doehnert M, Brandeis D, Schneider G, Drechsler R, Steinhausen HC. A neurophysiological marker of impaired preparation in an 11-year follow-up study of attention-deficit/hyperactivity disorder (ADHD). J Child Psychol Psychiatry. 2013;54(3):260–270. | |
Sawada M, Iida J, Ota T, et al. Effects of osmotic-release methylphenidate in attention-deficit/hyperactivity disorder as measured by event-related potentials. Psychiatry Clin Neurosci. 2010;64(5):491–498. | |
Sangal RB, Sangal JM. Attention-deficit/hyperactivity disorder: using P300 topography to choose optimal treatment. Expert Rev Neurother. 2006;6(10):1429–1437. | |
Idiazabal-Alecha MA, Rodriguez-Vazquez S, Guerrero-Gallo D, Vicent-Sardinero X. The value of cognitive evoked potentials in assessing the effectiveness of methylphenidate treatment in children with attention deficit hyperactivity disorder. Rev Neurol. 2005;40 Suppl 1: S37–S42. | |
Sunohara GA, Voros JG, Malone MA, Taylor MJ. Effects of methylphenidate in children with attention deficit hyperactivity disorder: a comparison of event-related potentials between medication responders and non-responders. Int J Psychophysiol. 1997;27(1):9–14. | |
Sunohara GA, Malone MA, Rovet J, Humphries T, Roberts W, Taylor MJ. Effect of methylphenidate on attention in children with attention deficit hyperactivity disorder (ADHD): ERP evidence. Neuropsychopharmacology. 1999;21(2):218–228. | |
Groom MJ, Scerif G, Liddle PF, et al. Effects of motivation and medication on electrophysiological markers of response inhibition in children with attention-deficit/hyperactivity disorder. Biol Psychiatry. 2010;67(7):624–631. | |
Linssen AM, Vuurman EF, Sambeth A, et al. Contingent negative variation as a dopaminergic biomarker: evidence from dose-related effects of methylphenidate. Psychopharmacology (Berl). 2011;218(3):533–542. | |
Linssen AMW. Cognitive and Electrophysiological Responses to Dopaminergic Manipulations. Maastricht, The Netherlands: Maastricht University Department of Psychology and Neuroscience; 2012. | |
Kratz O, Studer P, Baack J, et al. Differential effects of methylphenidate and atomoxetine on attentional processes in children with ADHD: an event-related potential study using the attention network test. Prog Neuropsychopharmacol Biol Psychiatry. 2012;37(1):81–89. | |
Linssen AM, Vuurman EF, Sambeth A, Riedel WJ. Methylphenidate produces selective enhancement of declarative memory consolidation in healthy volunteers. Psychopharmacology (Berl). 2012;221(4):611–619. | |
Ogrim G, Hestad KA, Brunner JF, Kropotov J. Predicting acute side effects of stimulant medication in pediatric attention deficit/hyperactivity disorder: data from quantitative electroencephalography, event-related potentials, and a continuous-performance test. Neuropsychiatr Dis Treat. 2013;9:1301–1309. | |
Barkley RA, DuPaul GJ, McMurray MB. Attention deficit disorder with and without hyperactivity: clinical response to three dose levels of methylphenidate. Pediatrics. 1991;87(4):519–531. | |
Tannock R, Ickowicz A, Schachar R. Differential effects of methylphenidate on working memory in ADHD children with and without comorbid anxiety. J Am Acad Child Adolesc Psychiatry. 1995;34(7):886–896. | |
Kaufman J, Birmaher B, Brent D, et al. Kiddie-SADS (PL) Schedule for Affective Disorders and Schizophrenia - Present-Life Version for School Aged Children (6–18 Years). J Am Accad Child Adolec Psychiatry. 1997;36:980–988. | |
Goodman R, Ford T, Richards H, Gatward R, Meltzer H. The development and well-being assessment: description and initial validation of an integrated assessment of child and adolescent psychopathology. J Child Psychol Psychiatry. 2000;41(5):645–655. | |
Conners CK, Sitarenios G, Parker JD, Epstein JN. The revised Conners’ Parent Rating Scale (CPRS-R): factor structure, reliability, and criterion validity. J Abnorm Child Psychol. 1998;26(4):257–268. | |
Gioia GA, Isquith PK. BRIEF behavior rating inventory of executive function. Psychological Assessment Resources Inc. 2000. | |
Mueller A, Candrian G, Kropotov JD, Ponomarev VA, Baschera GM. Classification of ADHD patients on the basis of independent ERP components using a machine learning system. Nonlinear Biomed Phys. 2010;4 Suppl 1:S1. | |
Mueller A, Candrian G, Grane VA, Kropotov JD, Ponomarev VA, Baschera GM. Discriminating between ADHD adults and controls using independent ERP components and a support vector machine: a validation study. Nonlinear Biomed Phys. 2011;5:5. | |
Kropotov JD, Ponomarev VA. Decomposing N2 NOGO wave of event-related potentials into independent components. Neuroreport. 2009;20(18):1592–1596. | |
Clarke AR, Barry RJ, Heaven PC, McCarthy R, Selikowitz M, Byrne MK. EEG coherence in adults with attention-deficit/hyperactivity disorder. Int J Psychophysiol. 2008;67(1):35–40. | |
Brandeis D, van LeeuwenTH, Steger J, Imhof K, Steinhausen HC. Mapping brain functions of ADHD children. International Congress Series. 2002;1232:649–654. | |
Coull JT, Frith CD, Dolan RJ, Frackowiak RS, Grasby PM. The neural correlates of the noradrenergic modulation of human attention, arousal and learning. Eur J Neurosci. 1997;9(3):589–598. | |
Coull JT, Buchel C, Friston KJ, Frith CD. Noradrenergically mediated plasticity in a human attentional neuronal network. Neuroimage. 1999;10(6):705–715. | |
Beste C, Willemssen R, Saft C, Falkenstein M. Response inhibition subprocesses and dopaminergic pathways: basal ganglia disease effects. Neuropsychologia. 2010;48(2):366–373. | |
Kropotov JD. Quantitative EEG Event-Related Potentials and Neurotherapy. Amsterdam, The Netherlands: Elsevier AP; 2009. | |
Clarke AR, Barry RJ, Dupuy FE, McCarthy R, Selikowitz M, Johnstone SJ. Excess beta activity in the EEG of children with attention-deficit/hyperactivity disorder: a disorder of arousal?. Int J Psychophysiol. 2013;89(3):314–319. | |
Stuss DT, Alexander MP, Shallice T, et al. Multiple frontal systems controlling response speed. Neuropsychologia. 2005;43(3):396–417. |
 © 2014 The Author(s). This work is published and licensed by Dove Medical Press Limited. The full terms of this license are available at https://www.dovepress.com/terms.php and incorporate the Creative Commons Attribution - Non Commercial (unported, v3.0) License.
By accessing the work you hereby accept the Terms. Non-commercial uses of the work are permitted without any further permission from Dove Medical Press Limited, provided the work is properly attributed. For permission for commercial use of this work, please see paragraphs 4.2 and 5 of our Terms.
© 2014 The Author(s). This work is published and licensed by Dove Medical Press Limited. The full terms of this license are available at https://www.dovepress.com/terms.php and incorporate the Creative Commons Attribution - Non Commercial (unported, v3.0) License.
By accessing the work you hereby accept the Terms. Non-commercial uses of the work are permitted without any further permission from Dove Medical Press Limited, provided the work is properly attributed. For permission for commercial use of this work, please see paragraphs 4.2 and 5 of our Terms.