")
Back to Journals » Diabetes, Metabolic Syndrome and Obesity » Volume 13
Predicting Metabolic Syndrome by Visceral Adiposity Index, Body Roundness Index and a Body Shape Index in Adults: A Cross-Sectional Study from the Iranian RaNCD Cohort Data
Authors Baveicy K, Mostafaei S , Darbandi M, Hamzeh B, Najafi F , Pasdar Y
Received 11 November 2019
Accepted for publication 9 March 2020
Published 24 March 2020 Volume 2020:13 Pages 879—887
DOI https://doi.org/10.2147/DMSO.S238153
Checked for plagiarism Yes
Review by Single anonymous peer review
Peer reviewer comments 2
Editor who approved publication: Prof. Dr. Antonio Brunetti
Kamran Baveicy,1 Shayan Mostafaei,2,3 Mitra Darbandi,4 Behrooz Hamzeh,4,5 Farid Najafi,4,6 Yahya Pasdar4,5
1Student Research Committee, School of Health, Kermanshah University of Medical Sciences, Kermanshah, Iran; 2Medical Biology Research Center, Health Technology Institute, Kermanshah University of Medical Sciences, Kermanshah, Iran; 3Epidemiology and Biostatistics Unit, Rheumatology Research Center, Tehran University of Medical Sciences, Tehran, Iran; 4Research Center for Environmental Determinants of Health (RCEDH), Health Institute, School of Health, Kermanshah University of Medical Sciences, Kermanshah, Iran; 5Social Development and Health Promotion Research Center, Kermanshah University of Medical Sciences, Kermanshah, Iran; 6Cardiovascular Research Center, Kermanshah University of Medical Sciences, Kermanshah, Iran
Correspondence: Yahya Pasdar Tel +98 83 38262005
Fax +98 83 38263048
Email [email protected]
Background: The use of anthropometric indices is one of the new and low-cost diagnostic methods of metabolic syndrome (MetS). The present study aimed to determine optimal cutoff points for the visceral adiposity index (VAI), body roundness index (BRI), and a body shape index (ABSI) in the prediction of MetS.
Methods: This cross-sectional study was performed on 10,000 individuals aged from 35 to 65 years, recruited in Ravansar Non-Communicable Diseases (RaNCD) cohort study, in the west region of Iran, in 2019. MetS was defined according to International Diabetes Federation (IDF) criteria. The receiver operating characteristic (ROC) curve analysis was used to assess predictive anthropometric indices and determine optimal cutoff values.
Results: The optimal cutoff points for VAI were 4.11 (AUC: 0.82; 95% CI: 0.81– 0.84) in men and 4.28 (AUC: 0.86; 95% CI: 0.85– 0.87) in women to prediction of MetS. The optimal cutoff points for BRI were 4.75 (AUC: 0.75; 95% CI: 0.74– 0.77) in men and 6.17 (AUC: 0.62; 95% CI: 0.61– 0.64) in women to prediction of MetS. The optimal cutoff points for ABSI were 0.12 (AUC: 0.49; 95% CI: 0.47– 0.51) in men and 0.13 (AUC: 0.49; 95% CI: 0.47– 0.51) in women to prediction of MetS. The risk of MetS in men and women with a VAI higher than the optimal cutoff point was, respectively, 9.82 and 11.44 times higher than that in those with a VAI lower than the cutoff point.
Conclusion: Although VAI might not be very cost-beneficial compared to IDF, our study showed VAI is a better predictor of MetS than BRI in adults. ABSI was not a suitable predictor for MetS.
Keywords: metabolic syndrome, body shape index, body roundness index, visceral adiposity index, ROC curve analysis
Introduction
Metabolic syndrome (MetS) is a complex metabolic disorder that imposes huge social and economic costs on societies and has become an epidemic worldwide.1 A study in US (2009) reported patients with the MetS are at twice the risk of developing cardiovascular disease (CVD) over the next 5 to 10 years as individuals without the MetS, also the MetS confers a 5-fold increase in risk for type 2 diabetes.2 Besides, this doubles the mortality rate due to cardiac arrest and myocardial infarction.3 According to a systematic review conducted in 2014, the prevalence of MetS according to International Diabetes Federation (IDF) criteria is that 30.7% and 34.2% for men and women in Iran.4
Obesity can be the main factor in the occurrence of MetS. Anthropometric indices, which indirectly indicate body fat and obesity, can be one of the low-cost and accessible ways to predict MetS.5,6 Old and routine indicators such as body mass index (BMI) and waist circumference (WC) have some limitations. For example, WC is used to diagnose abdominal obesity, but it is highly correlated with BMI and is affected by body size (weight and height).7
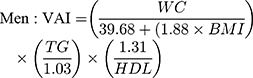
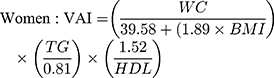
A body shape index (ABSI) is one of the anthropometric indicators that recently considered. Krakauer et al (2012) showed that ABSI is an independent index of height, weight, and BMI that predicts premature mortality better than BMI.8 Based on a study in China, ABSI is the best anthropometric index in men for predicting CVD.9 Another indicator is body roundness index (BRI), which is based on WC and height. Thomas et al (2013) showed that BRI is a good indicator of body fat.10 A study in China found that BRI as a new anthropometric index amongst Chinese women could perform better for detecting a set of cardio-metabolic abnormalities than BMI and waist-to-height ratio (WHtR).11 Another recently introduced index for the expression of visceral fat is the visceral adiposity index (VAI), which is based on two anthropometric indices (WC and BMI) and two biochemical factors (triglyceride and high-density lipoprotein) and has a separate formula for men and women.12
Previous studies reported some differences in cut points among different ethnicities.13–15 The western regions of Iran are chiefly populated by Kurdish ethnic groups. These are regions where the Ravansar Non-Communicable Disease (RaNCD) cohort study ongoing since 2014 and it shows that the prevalence of obesity and overweight is higher than in other regions of Iran especially in women.15,16 Accordingly, it is important to determine a cutoff point for predicting risk of non-communicable diseases and offering appropriate preventive interventions in the regions. This study aims to identify the optimal cutoff points for ABSI, BRI, and VAI indices for predicting the risk of MetS and examine the association between these indices and MetS, in adults.
Method
Study Population
In this cross-sectional study, we used the data from recruitment phase of RaNCD cohort study in west of Iran in 2019. The RaNCD study is part of a prospective epidemiological research study in Iran (PERSIAN). Ravansar is a district with urban and rural areas, located in the west of Iran in the province of Kermanshah with a population of about 50,000 people, mainly from Iranian Kurdish ethnicity. It is one of 21 centers in the PERSIAN cohort study. Baseline data were collected in October 2014 forwards, and 10,000 adults between the ages of 35 and 65 (both men and women), who were registered as permanent residents of Ravansar were included in this cohort. Details for rational and design of study have been published before.17,18 All the participants that met the inclusion criteria were provided oral and written informed consent. The study in accordance with the Declaration of Helsinki. This study was registered with the Department of Research and Technology (No. 98018) and approved by the Ethics Committee of Kermanshah University of Medical Sciences (IR.KUMS.REC.1398.158).
Inclusion and Exclusion Criteria
Participants included all individual from the first phase of the cohort study. Exclusion criteria for the RaNCD cohort study were unwillingness to attend the study, living in Ravansar under nine months in a year, being a new inhabitant (under one year), being unable to attend the cohort center or to communicate with interviewer’s (due to mental or physical disability or any acute psychological disorder, blindness, deafness, and dumbness).
For the present study, the exclusion criteria were as follows: pregnant women (n = 135), hormone and steroid drug users (n = 871), patients with cancers (n = 93), people with renal failure (n = 101) and people with incomplete information (n = 69). Finally, out of 10,059 participants in the cohort study, 8790 (4591 men and 4199 women) were included in the study.
Data Collection
In the present study, basic demographic data, anthropometric indices, biochemical parameters, blood pressure, and nutritional assessment of the participants in the RaNCD cohort study were provided. This information was collected by a trained expert at the study site in Ravansar as follows:
Socio-demographic characteristics such as age, sex, place of residency (rural\urban) and marital status (Married\single\Widow, divorced) were collected using digital questionnaires which were filled by an expert interviewer. A self-completed questionnaire was used to assess the smoking status and alcohol drinking. Participants were classified based on the smoking status as current smokers, former smokers and never smokers. A question with two options (yes\no) was used for drinking alcohol. The PERSIAN Cohort standard physical activity questionnaire was used to assess participants’ physical activity. The questionnaire consisted of 22 questions about the different activities of the person during the day, and finally based on activity intensity, physical activity was divided into three groups (light, moderate, high).
Measurements
Anthropometry Measurements
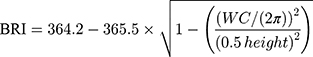
Weight was measured using Inbody 770 (Inbody Co, Seoul, Korea) with a precision of 0.5 kg. The height of the subjects was measured with BSM 370 (Biospace Co, Seoul, Korea). The precision of the measurements was 0.1 cm. WC was measured with a flexible measuring tape at a level midway between the lower rib margin and the iliac crest to the nearest 0.5 cm. The other anthropometric indexes were measured by the following formulas:


Biochemical Factors
According to our protocol for collection of the blood sample, after 8–12 hrs of fasting, blood samples were collected from the ante-brachial vein. Serum and plasma samples were centrifuged and stored in aliquots in cryotubes at −80°C until analyzed. Serum concentrations of FBS and lipid profiles were measured using commercially available kits according to the manufacturer’s protocol.
Blood Pressure
Using a manometer (Reister) cuff and stethoscope (Reister) in the seated position and after 10 mins of rest, we checked blood pressure from both right and left arm for two times from each side with an interval of 5 mins. An average of both systolic and diastolic blood pressure was calculated.
Definition of Metabolic Syndrome
According to the IDF definition, MetS is defined if there are three or more of the following abnormalities: (1) central obesity (WC ≥ 94 cm for men and ≥80 cm for women), (2) Triglyceride level of ≥150 mg/dl or receipt of specific treatment for this lipid abnormality; (3) high-density lipoprotein (HDL) level of ≤40 mg/dl in men and ≤50 mg/dl in women or receipt of specific treatment for this lipid abnormality; (4) blood pressure of ≥130/85 mmHg or receipt of treatment of previously diagnosed hypertension; (5) FBS> 100 mg/dl or drug use for treating diabetes.2,19
Statistical Methods
Continuous variables are presented as mean ± standard deviation, and categorical variables are presented as N (%). Chi-square/or Fisher exact test was performed for assessing the associations of the categorical predictor variables and risk of MetS. The normality test was checked using the Kolmogorov–Smirnov test for the continuous variables. For comparing the central tendency (eg, mean for normal and median for non-normal variables) between two groups, two-independent samples t-test or Mann–Whitney non-parametric test. Univariate logistic regression analysis was performed to assess the effects of ABSI, BRI and VAI on the occurrence of MetS. Odds ratio and 95% confidence interval were reported as effect size in logistic regression models. The goodness of fit (GOF) of the logistic models and performance of the classification were assessed using Hosmer and Lemeshow test and area under the ROC curve (AUC), sensitivity, specificity, and Youden J-index were calculated for the classification accuracy. All of the statistical analyses were analyzed using STATA software versions 15. The significance level was set at level of 0.05.
Results
After applying the exclusion criteria was conducted on 8790 participants aged 48.14 ± 8.25 years, comprising 4591 (52.23%) men, 5220 (59.38%) residents of the urban (Table 1). The mean BMI in women was 28.62 ± 4.85, and in men 26.34 ± 4.05 kg/m2 (P <0.001). The mean BRI in men was 4.74 ± 1.23, and in women 6.25 ± 1.72 (P <0.001). The mean VAI was 5.19 ± 4.19 in men and 5.70 ± 4.56 in women (P <0.001). Mean triglycerides in men and women were 145.82 ± 89.45 and 130.94± 80.70 mg/dl, respectively (P <0.001). The prevalence of obesity and overweight was 63% in men and 77.01% in women.
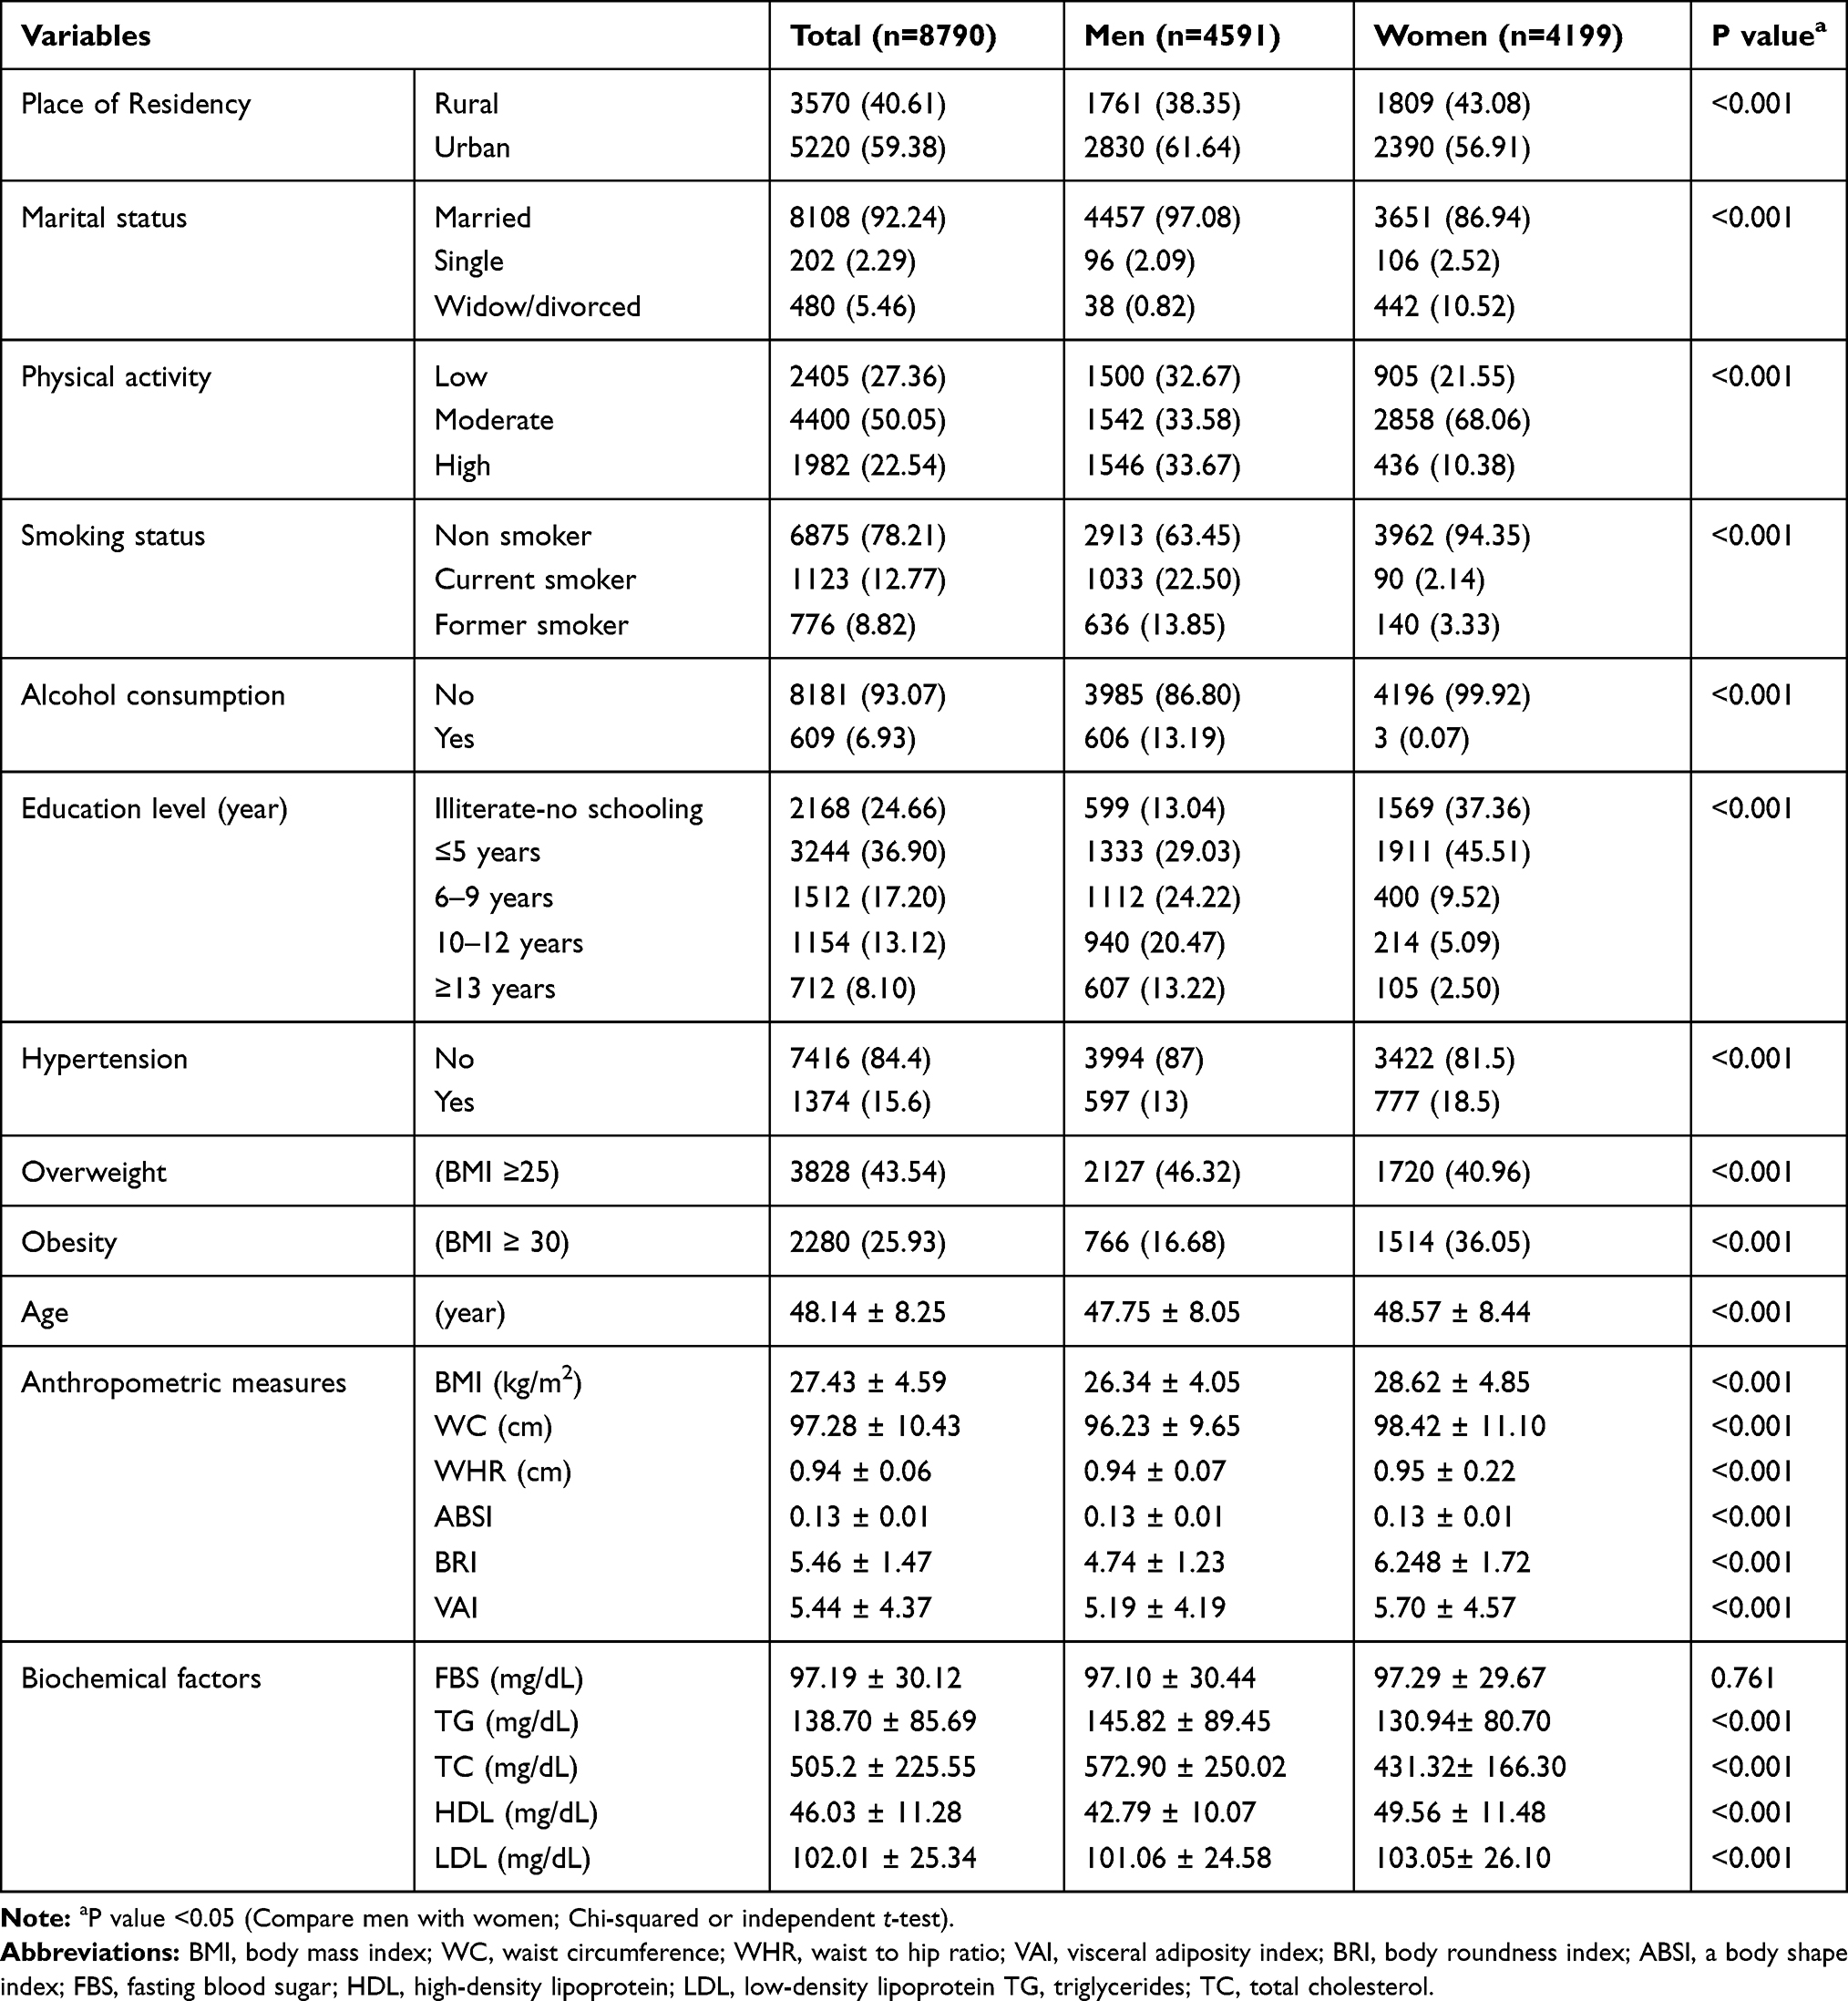 |
Table 1 Demographic and MetS Factors of the Included Participants in This Study |
The optimal cutoff points for VAI were 4.11 (sensitivity 80.08, specificity 70, Yuden index 51.2) in men and 4.28 (sensitivity 83.1, specificity 70, and Yuden index 58) in women to the prediction of MetS. The optimal cut-off point for BRI was 4.75 in men and 6.17 in women.
Of the three indices examined, the highest AUC was related to VAI, which was 0.86 in women (95% CI: 0.85–0.87) and 0.82 in men (95% CI: 0.81–0.83). In women, VAI also had the greatest predictive power for MetS with a significant difference from other indicators. The lowest area under the curve in both sexes belonged to ABSI with the area under the curve 0.49. Therefore, the cutoff point identified for ABSI in men and women did not have an acceptable AUC to predict MetS (Table 2).
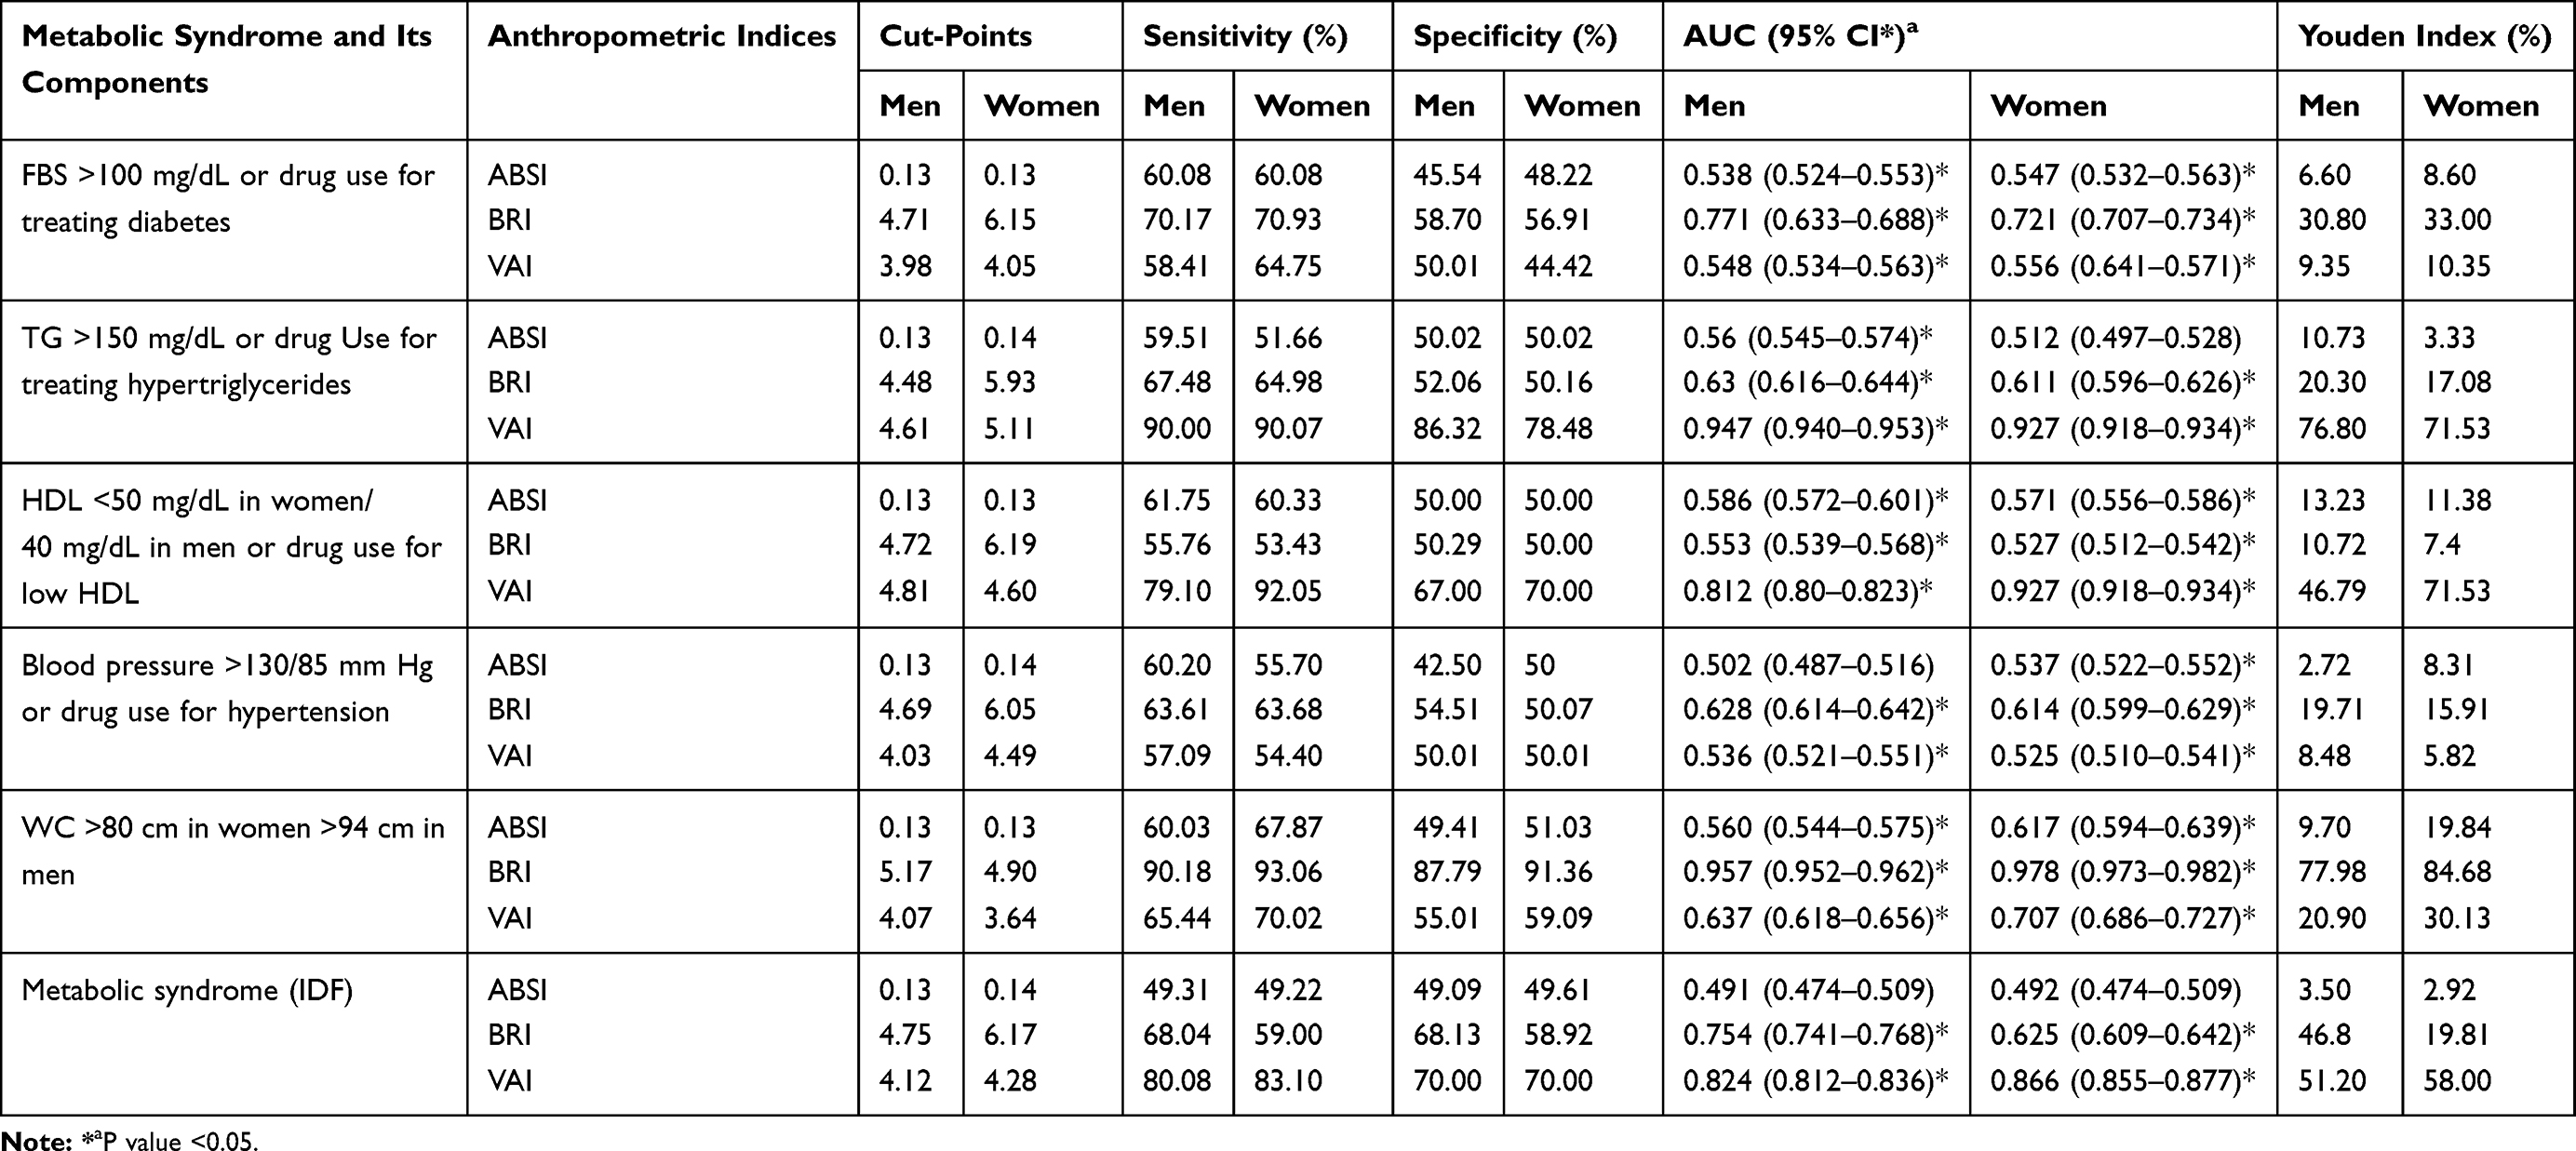 |
Table 2 Sensitivity, Specificity, and Area Under the ROC Curve to Identify MetS (IDF) According to ABSI, BR, and VAI Cut-Points Among Participating in the RaNCD Study |
The optimal cut-off point was determined to identify components of the MetS. The optimal cutoff point for detecting triglycerides greater than 150 mg/dl or taking lipid-lowering drugs for ABSI in men was 0.13 and 0.14 in women. The optimal cutoff point for identifying high blood pressure for VAI was 4.03 in men and 4.49 in women. As for the MetS components, like the MetS itself, ABSI was the weakest predictor (Table 2).
In Figures 1 and 2, the optimal cut-off points identified by the anthropometric indices for predicting MetS in the study population are shown by the ROC curve.
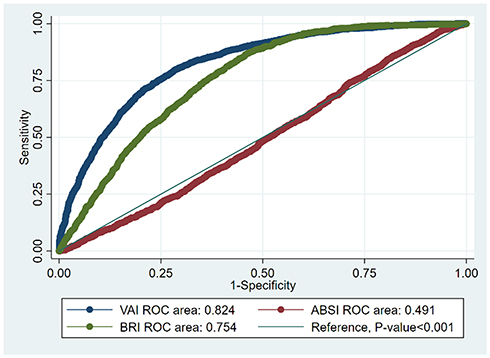 |
Figure 1 Receiver-operating characteristic (ROC) analysis of ABSI, BRI, and VAI vs reference line for prediction metabolic syndrome in men. |
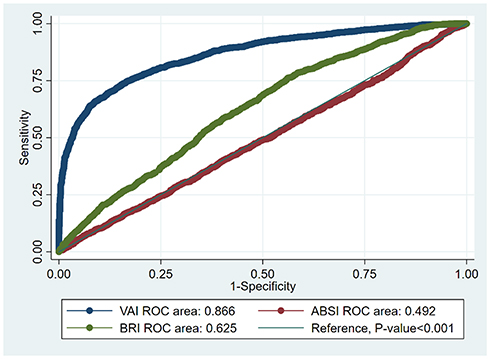 |
Figure 2 Receiver-operating characteristic (ROC) analysis of ABSI, BRI, and VAI versus vs reference line for prediction metabolic syndrome in women. |
By adjusting for confounding factors in the logistic regression model, the highest odds ratio (OR) for MetS in men and women for the amount higher than the cut-off points was related to VAI, which were 9.82 (8.50–11.34) and 11.44 (9.84–13.30) respectively (P <0.001). The OR for MetS in men and women with BRI was 4.55 (4.04–5.17) and 2.06 (1.82–2.33) times higher than a cut-off point, respectively (P <0.001). The odds of FBS> 100 mg/dl or drug use for treating diabetes with VAI higher the cutoff point were 1.44 (CI 95%: 1.25–1.67) in men and 1.43 (CI 95%: 1.23–1.66, respectively) in women (Table 3).
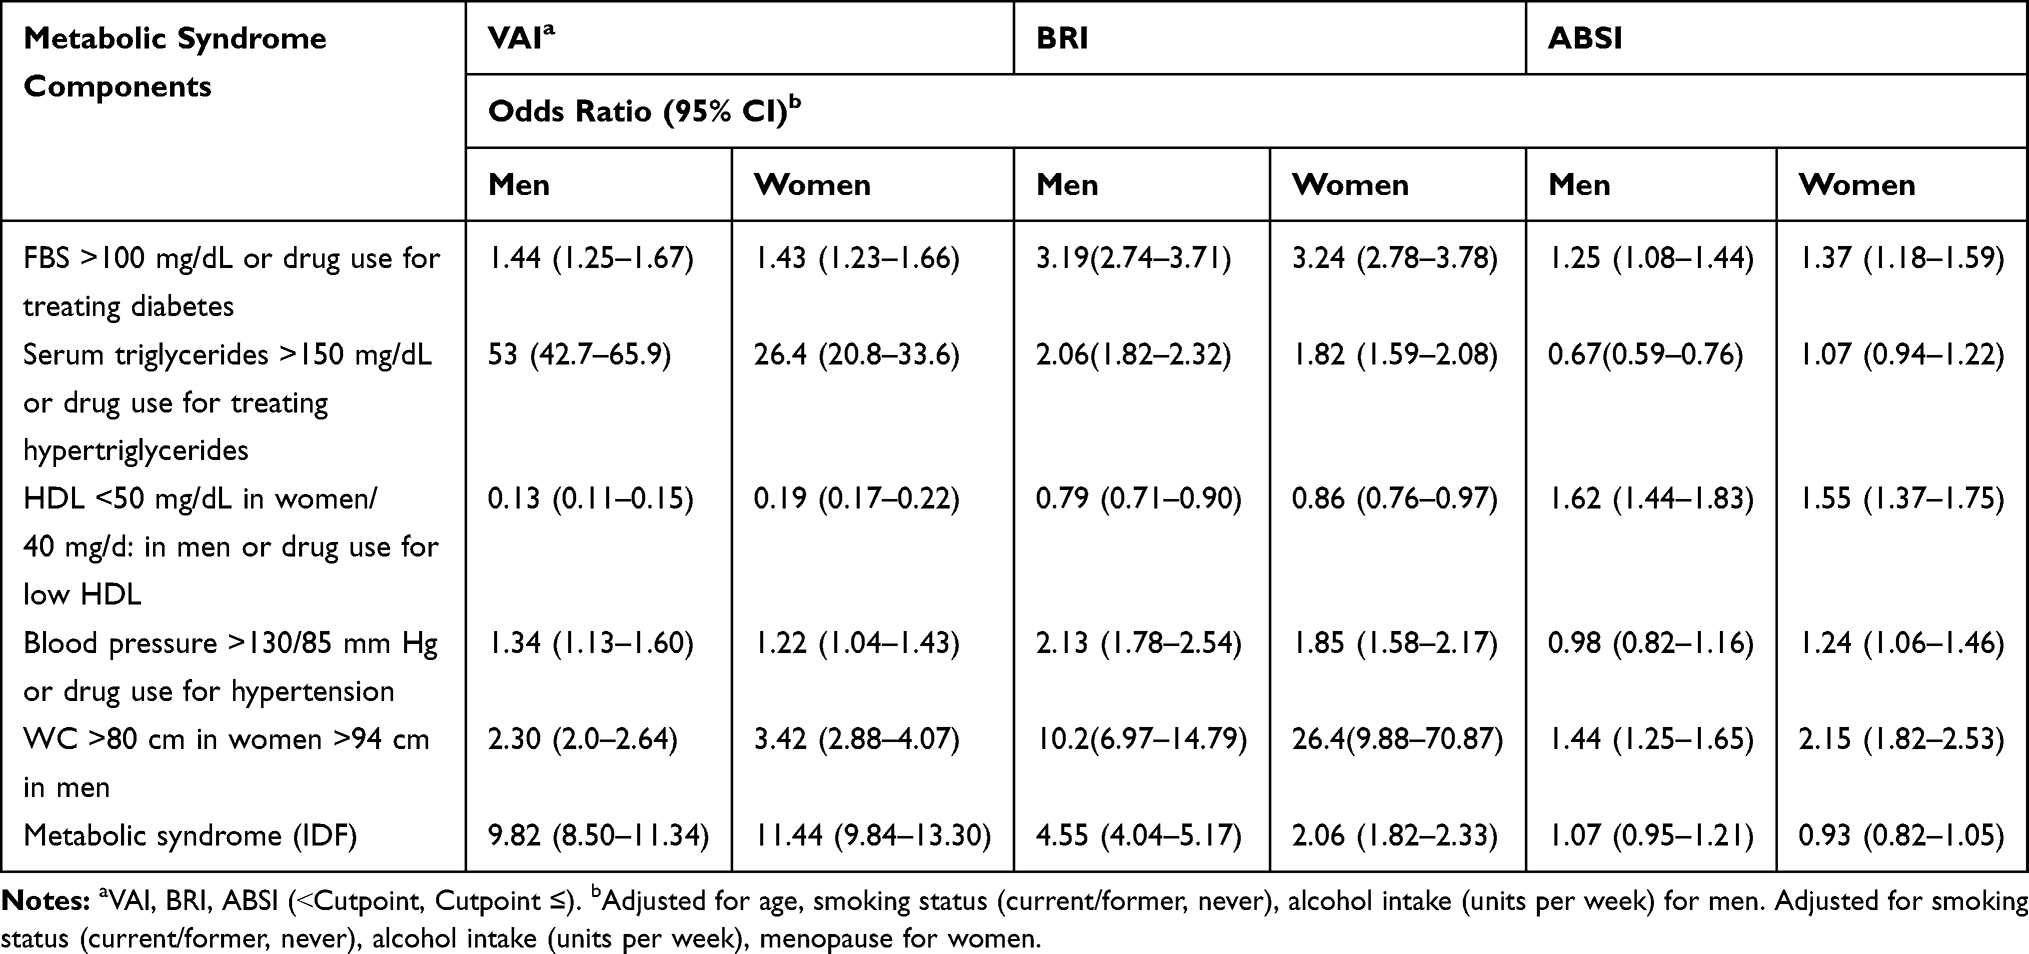 |
Table 3 Logistic Regression of MetS and Its Components on Cutoff Points of ABSI, BRI, and VAI |
Discussion
In this study, the optimal VAI cut-off points of 4.1 in men and 4.3 in women to predict the risk of MetS, which had the highest AUC, and it was the best predictor of the MetS compared to BRI and ABSI. The optimal VAI cutoff point was reported 2 in Chinese and 2.2 in Turkish population to predicting the risk of MetS.20,21 In the study of Stefanescu et al6 and Motamed et al,22 among the evaluated anthropometric indices (WC, BMI, BRI, VAI, WHR, WHTR and ABSI), VAI was the best predictor of MetS. Also, several studies have reported VAI as a good predictor of MetS and CVD.20,23,24 This is partly because of the measure’s high degree of correlation with triglycerides and HDL.6
The optimal BRI cut-off points of 4.7 in men and 6.2 in women to predict the risk of MetS. BRI has less predictive power in women than men. The optimal BRI cutoff point was reported 4.7 in men and 6.2 in women on Chinese population and 3.8 in men and 4.0 in women in Colombia for predicting the risk of cardiometabolic risk and MetS.25,26 Studies have shown that the power of BRI to detect MetS and its components was greater than ABSI, BMI and WC.6,26 Some studies have reported that BRI can be a good indicator for predicting MetS in diabetics.25,27 Insulin resistance and chronic inflammation are the main mechanisms of MetS. BRI showed significant correlation with insulin resistance and inflammatory factors and equivalence with traditional obesity indices.28–30 Therefore, based on our findings and studies mentioned above, BRI as a new and non-invasive anthropometric index has acceptable predictive power for MetS and can be used as an alternative index to older indices in predicting MetS.
Our study showed AUC and Youden J-index values for ABSI were lower than BRI and VAI in adult to predict MetS. Therefore, based on our results, ABSI could not be a good and reliable predictor for MetS. Previous studies in Iran and Nigeria have shown that ABSI is not a good predictor of MetS compared to other anthropometric indices (BRI, BMI, and WHTR), and has the lowest AUC to predict the MetS and CVD risk factors.31,32
Some reasons such as ethnic and racial differences which can lead to a difference in population’s lifestyle (diet and physical activity)33,34 could explain disparity between cutoff points reported in various studies. Another reason is the use of different criteria for MetS (IDF, ATP III, AHA, WHO) in studies. Furthermore, the different prevalence of obesity and overweight from one population to another may be another reason for the difference between cutoff points for anthropometric indices.
In our study, based on regression analysis, VAI was more strongly associated with the MetS than BRI and ABSI. All anthropometric indices above the optimal cut-off point, except ABSI, increased the odds ratio of developing MetS. In the study of Maessen et al, the odds of having CVD and its risk factors were higher in those with BRI, WC, and BMI higher the cut-off point. But the odds ratio of developing CVD and its risk factors in people with high ABSI was not statistically significant.35
Despite differences in demographic characteristics, geographic and life style in the studied populations of various studies worldwide, the results of our study and those of others show that simple anthropometric index have global utility in identifying individuals with high risk of developing MetS. The most important strength of this study is the use of prospective study data (RaNCD); therefore, the data were collected solely for research purposes, and the anthropometric and laboratory data were of high quality. The large sample size was strength of the study. One of the limitations of the present study is its cross-sectional design. Also, this study was conducted on adult adults in the Kurdish population, so it should be cautiously generalized to other ethnicities as well as other age groups.
Conclusion
The findings of the present study showed that anthropometric indices, which have recently been considered in the discussion of diseases, can be also good predictors for MetS and its components. Based on the AUC, sensitivity, and specificity VAI is a better predictor to MetS than BRI in adult. It may be related to the VAI formula which includes more defining variables of MetS. In fact, there is no big advantage for using VAI instead of IDF criteria in terms of cost. While VAI may provide a precise index for screening of MetS, the cost-benefit for using this index compared to the IDF criteria in most developing and developed countries need further studies.
Ethics Approval
The research was approved by the ethics committee of Kermanshah University of Medical Sciences (KUMS.REC.1395.770). From all participants was taken oral and written informed consent. The study in accordance with the Declaration of Helsinki. The research was registered (No: 98018) at the Research and Technology Deputy.
Acknowledgments
This work was extracted from MSc thesis of Nutrition Sciences (Mr. Kamran Baveysi), in the School of Nutritional Science and Food Technology, Kermanshah University of Medical Sciences, Kermanshah, Iran.
Funding
No Specific funding Was Received from Any Bodies in the Public.
Disclosure
The authors report no conflicts of interest in this work.
References
1. Ranasinghe P, Mathangasinghe Y, Jayawardena R, Hills A, Misra A Prevalence and trends of metabolic syndrome among adults in the asia-pacific region: a systematic review. BMC Public Health. 2017;17(1):101. doi:10.1186/s12889-017-4041-1
2. Alberti KG, Eckel RH, Grundy SM, et al. Harmonizing the metabolic syndrome: a joint interim statement of the international diabetes federation task force on epidemiology and prevention; National Heart, Lung, and Blood Institute; American Heart Association; World Heart Federation; International Atherosclerosis Society; and International Association for the Study of Obesity. Circulation. 2009;120(16):1640–1645. doi:10.1161/CIRCULATIONAHA.109.192644
3. Isomaa B, Almgren P, Tuomi T, et al. Cardiovascular morbidity and mortality associated with the metabolic syndrome. Diabetes Care. 2001;24(4):683–689. doi:10.2337/diacare.24.4.683
4. Amirkalali B, Fakhrzadeh H, Sharifi F, et al. Prevalence of metabolic syndrome and its components in the Iranian adult population: a systematic review and meta-analysis. Iran Red Crescent Med J. 2015;17(12). doi:10.5812/ircmj
5. Chobot A, Górowska‐Kowolik K, Sokołowska M, Jarosz‐Chobot P. Obesity and diabetes—not only a simple link between two epidemics. Diabetes/Metab Res Rev. 2018;34(7):e3042. doi:10.1002/dmrr.3042
6. Stefanescu A, Revilla L, Lopez T, Sanchez SE, Williams MA, Gelaye B Using a body shape index (ABSI) and Body Roundness Index (BRI) to predict risk of metabolic syndrome in Peruvian adults. J Int Med Res. 2019:1–12.
7. Bouchi R, Asakawa M, Ohara N, et al. Indirect measure of visceral adiposity ‘A Body Shape Index’(ABSI) is associated with arterial stiffness in patients with type 2 diabetes. BMJ Open Diabetes Res Care. 2016;4(1):e000188. doi:10.1136/bmjdrc-2015-000188
8. Krakauer NY, Krakauer JC A new body shape index predicts mortality hazard independently of body mass index. PLoS One. 2012;7(7):e39504. doi:10.1371/journal.pone.0039504
9. Wang F, Chen Y, Chang Y, Sun G, Sun Y New anthropometric indices or old ones: which perform better in estimating cardiovascular risks in Chinese adults. BMC Cardiovasc Disord. 2018;18(1):14. doi:10.1186/s12872-018-0754-z
10. Thomas DM, Bredlau C, Bosy‐Westphal A, et al. Relationships between body roundness with body fat and visceral adipose tissue emerging from a new geometrical model. Obesity. 2013;21(11):2264–2271. doi:10.1002/oby.20408
11. Tian S, Zhang X, Xu Y, Dong H Feasibility of body roundness index for identifying a clustering of cardiometabolic abnormalities compared to BMI, waist circumference and other anthropometric indices: the China Health and Nutrition Survey, 2008 to 2009. Medicine. 2016;95(34):e4642. doi:10.1097/MD.0000000000004642
12. Amato MC, Giordano C, Galia M, et al. Visceral adiposity index: a reliable indicator of visceral fat function associated with cardiometabolic risk. Diabetes Care. 2010;33(4):920–922. doi:10.2337/dc09-1825
13. Carroll JF, Chiapa AL, Rodriquez M, et al. Visceral fat, waist circumference, and BMI: impact of race/ethnicity. Obesity. 2008;16(3):600–607. doi:10.1038/oby.2007.92
14. Li Y, Wang H, Wang K, et al. Optimal body fat percentage cut-off values for identifying cardiovascular risk factors in Mongolian and Han adults: a population-based cross-sectional study in Inner Mongolia, China. BMJ Open. 2017;7(4):e014675. doi:10.1136/bmjopen-2016-014675
15. Pasdar Y, Hamzeh B, Najafi F, Darbandi M Optimal cutoff values of fat mass index, body fat percentage and visceral fat area for identifying metabolic syndrome in the kurdish population: results from an iranian RaNCD cohort study. Med J Nutr Metab. 2019;12(4):397–409. doi:10.3233/MNM-190324
16. Darbandi M, Najafi F, Pasdar Y, Rezaeian S Structural equation model analysis for the evaluation of factors associated with overweight and obesity in menopausal women in RaNCD cohort study. Menopause. 2020;27(2):208–215. doi:10.1097/GME.0000000000001452
17. Pasdar Y, Najafi F, Moradinazar M, et al. Cohort profile: Ravansar non-communicable disease cohort study: the first cohort study in a Kurdish population. Int J Mol Epidemiol. 2019;48(3):682–683.doi: doi:10.1093/ije/dyy296.
18. Poustchi H, Eghtesad S, Kamangar F, et al. Prospective epidemiological research studies in Iran (the PERSIAN Cohort Study): rationale, objectives, and design. Am J Epidemiol. 2017;187(4):647–655. doi:10.1093/aje/kwx314
19. Huang PL A comprehensive definition for metabolic syndrome. Dis Models Mech. 2009; 2 (5–6): 231–237. doi:10.1242/dmm.001180
20. Li R, Li Q, Cui M, et al. Clinical surrogate markers for predicting metabolic syndrome in middle‐aged and elderly Chinese. J Diabetes Investig. 2018;9(2):411–418. doi:10.1111/jdi.2018.9.issue-2
21. Pekgor S, Duran C, Berberoglu U, Eryilmaz MA The role of visceral adiposity index levels in predicting the presence of metabolic syndrome and insulin resistance in overweight and obese patients. Metab Syndr Relat Disord. 2019;17(5):296–302. doi:10.1089/met.2019.0005
22. Motamed N, Khonsari M, Rabiee B, et al. Discriminatory ability of visceral adiposity index (VAI) in diagnosis of metabolic syndrome: a population based study. Exp Clin Endocrinol Diabetes Care. 2017;125(03):202–207. doi:10.1055/s-0042-119032
23. Knowles K, Paiva L, Sanchez S, et al. Waist circumference, body mass index, and other measures of adiposity in predicting cardiovascular disease risk factors among Peruvian adults. Int J Hypertens. 2011;2011
24. Wang H, Liu A, Zhao T, et al. Comparison of anthropometric indices for predicting the risk of metabolic syndrome and its components in Chinese adults: a prospective, longitudinal study. BMJ Open. 2017;7(9):e016062. doi:10.1136/bmjopen-2017-016062
25. Liu B, Liu B, Wu G, Yin F Relationship between body-roundness index and metabolic syndrome in type 2 diabetes. Diabetes Metab Syndr Obes. 2019;12:931. doi:10.2147/DMSO.S209964
26. Ramírez-Vélez R, Pérez-Sousa MÁ, Izquierdo M, et al. Validation of surrogate anthropometric indices in older adults: what is the best indicator of high cardiometabolic risk factor clustering? Nutrients. 2019;11(8):1701. doi:10.3390/nu11081701
27. Chang Y, Guo X, Chen Y, et al. A body shape index and body roundness index: two new body indices to identify diabetes mellitus among rural populations in northeast China. BMC Public Health. 2015;15(1):794. doi:10.1186/s12889-015-2150-2
28. Barazzoni R, Cappellari GG, Semolic A, et al. Central adiposity markers, plasma lipid profile and cardiometabolic risk prediction in overweight-obese individuals. Clin Nutr. 2019;38(3):1171–1179. doi:10.1016/j.clnu.2018.04.014
29. Feng J, He S, Chen X Body adiposity index and body roundness index in identifying insulin resistance among adults without diabetes. Am J Med Sci. 2019;357(2):116–123. doi:10.1016/j.amjms.2018.11.006
30. Li G, Wu H-K, Wu X-W, et al. The feasibility of two anthropometric indices to identify metabolic syndrome, insulin resistance and inflammatory factors in obese and overweight adults. Nutrition. 2019;57:194–201. doi:10.1016/j.nut.2018.05.004
31. Adejumo EN, Adejumo AO, Azenabor A, et al. Anthropometric parameter that best predict metabolic syndrome in south west Nigeria. Diabetes Metab Syndr Clin Res Rev. 2019;13(1):48–54. doi:10.1016/j.dsx.2018.08.009
32. Haghighatdoost F, Sarrafzadegan N, Mohammadifard N, Asgary S, Boshtam M, Azadbakht L Assessing body shape index as a risk predictor for cardiovascular diseases and metabolic syndrome among Iranian adults. Nutrition. 2014;30(6):636–644. doi:10.1016/j.nut.2013.10.021
33. He J, Guo S, Liu J, et al. Ethnic differences in prevalence of general obesity and abdominal obesity among low-income rural Kazakh and Uyghur adults in far western China and implications in preventive public health. PLoS One. 2014;9(9):e106723. doi:10.1371/journal.pone.0106723
34. Zaccagni L, Rinaldo N, Bramanti B, Gualdi-Russo E Relation between lifestyle behaviors and body composition patterns among healthy young Italians: a cross-sectional study. J Sports Med Phys Fitness. 2018;58(11):1652–1656. doi:10.23736/S0022-4707.17.07871-9
35. Maessen MF, Eijsvogels TM, Verheggen RJ, Hopman MT, Verbeek AL, de Vegt F Entering a new era of body indices: the feasibility of a body shape index and body roundness index to identify cardiovascular health status. PLoS One. 2014;9(9):e107212. doi:10.1371/journal.pone.0107212
 © 2020 The Author(s). This work is published and licensed by Dove Medical Press Limited. The full terms of this license are available at https://www.dovepress.com/terms.php and incorporate the Creative Commons Attribution - Non Commercial (unported, v3.0) License.
By accessing the work you hereby accept the Terms. Non-commercial uses of the work are permitted without any further permission from Dove Medical Press Limited, provided the work is properly attributed. For permission for commercial use of this work, please see paragraphs 4.2 and 5 of our Terms.
© 2020 The Author(s). This work is published and licensed by Dove Medical Press Limited. The full terms of this license are available at https://www.dovepress.com/terms.php and incorporate the Creative Commons Attribution - Non Commercial (unported, v3.0) License.
By accessing the work you hereby accept the Terms. Non-commercial uses of the work are permitted without any further permission from Dove Medical Press Limited, provided the work is properly attributed. For permission for commercial use of this work, please see paragraphs 4.2 and 5 of our Terms.