")
Back to Journals » Risk Management and Healthcare Policy » Volume 14
Predicting Individual Risk of Emergency Hospital Admissions – A Retrospective Validation Study
Authors Skov Benthien K , Kart Jacobsen R , Hjarnaa L, Mehl Virenfeldt G, Rasmussen K, Toft U
Received 9 April 2021
Accepted for publication 27 August 2021
Published 15 September 2021 Volume 2021:14 Pages 3865—3872
DOI https://doi.org/10.2147/RMHP.S314588
Checked for plagiarism Yes
Review by Single anonymous peer review
Peer reviewer comments 2
Editor who approved publication: Dr Jongwha Chang
Kirstine Skov Benthien,1 Rikke Kart Jacobsen,1 Louise Hjarnaa,1 Gert Mehl Virenfeldt,1 Knud Rasmussen,2 Ulla Toft1
1Center for Clinical Research and Prevention, Bispebjerg and Frederiksberg Hospital, Frederiksberg, Denmark; 2Data and Development Support, Region Zealand, Sorø, Denmark
Correspondence: Kirstine Skov Benthien
Center for Clinical Research and Prevention, Bispebjerg and Frederiksberg Hospital, Nordre Fasanvej 57, Frederiksberg, 2000, Denmark
Tel +45 31160453
Email [email protected]
Purpose: A high number of hospital admissions may indicate poor general health and less than optimal health care across sectors. To prevent hospital admissions, previous studies have focused on predicting readmissions relating to a defined index admission and specific condition, whereas generic models suited for community-dwelling persons are lacking. The aim of this study was to validate a generic model that predicted risk of emergency hospital admission within the following three months and to investigate regional variation.
Materials and Methods: This study is an observational register-based validation study of a prediction model. The prediction model was based on a population of frail elderly, persons with non-communicable diseases, and persons with three emergency hospital admissions using information about diagnoses and hospital contacts. The prediction model consisted of two stages. In the first stage, covariate associations to admissions are estimated from observed data in one year. In the second stage, admissions are predicted in the coming three months based on observed estimations from the first stage. The validity of the model was calculated by comparing predicted and observed admissions from August 1st to October 31st, 2016.
Results: The study included 112,026 persons. In nationwide data, area under the curve (AUC) was 0.7742 (95% CI 0.7698– 0.7786), and the positive predictive value was 52% for the 99th percentile (the top 1%). AUC varied between regions from 0.6914 in Southern Denmark (95% CI 0.6779– 0.7049) to 0.8224 (95% CI 0.8064– 0.8384) in North Denmark. AUC was higher with nationwide data compared to regional.
Conclusion: The model performed satisfactorily in predicting individual risk of emergency hospital admission.
Keywords: hospital admissions, prediction, chronic disease, frailty, prevention
Introduction
A high number of emergency hospital admissions may indicate poor general health1 and less than optimal healthcare planning across sectors. Some hospital admissions are caused by ambulatory care sensitive conditions that may be prevented by interventions in primary care or outpatient hospital care.2
Persons with non-communicable diseases such as heart diseases and chronic obstructive pulmonary disease (COPD) are at risk of becoming high-cost users of healthcare resources.3 The incidence of unplanned hospital admissions for ambulatory care sensitive conditions varies with geographical regions, bed availability and quality of primary care.4,5 Being a high-cost user is associated with multimorbidity, mental illness, higher age and low income.6 Number of comorbidities as well as specific combinations thereof are associated with increased risk of hospital admissions,7 and hospital admissions are a substantial driver of healthcare costs.8
Aging populations and increasing healthcare costs call for rigorous prioritization of the delivery of healthcare resources and the recipients. Predicting which persons will become high-cost users and at high risk of needing specialized health care may enable timely preventive measures. Prediction models should accommodate the diversity and complexity of this population.9 Prediction models primarily based on administrative or clinical data tend to perform better than models developed with self-reported data.10 Most models that predict hospital admissions have moderate discriminative ability.10,11 In addition to disease-specific prediction models, generic models to predict hospital admissions have also been developed, but they mostly focus on readmission after a defined index admission, and prediction models without a defined index admission are rare.11,12 A generic model needs to encompass a wide range of conditions and time points in the healthcare trajectory, which may increase complexity but also enable preventive measures for patients with multimorbidity and general frailty. It is pertinent to develop generic prediction models that support personalized treatment and care across diagnoses. Focusing on modifiable risk factors and preventability of admissions may support the use of prediction models in case-finding and prioritizing patients for more intensive supportive measures.
In Denmark, a national randomized controlled trial of telephone-based self-management support entitled Proactive Health Support (PaHS) took place from April 2018 to July 2019.13 The participants in the trial were identified through an algorithm that calculated individual risk of hospital admission within the following three months – the PaHS prediction model. The aim of this article is to validate the PaHS prediction model to predict individual risk of hospital admission and to investigate the extent of regional variation.
Materials and Methods
Design
This nationwide cohort study was based upon two years of information from healthcare registers to predict the risk of hospital admissions. This study describes the validation of the PaHS prediction model alone, whereas model development is outside the scope of this study. The model development was data driven as well as informed by strategic decisions in focusing on predefined preventive admissions and the three target groups described below. This study is reported using the TRIPOD statement.14 Since the PaHS prediction model was used to select participants for a randomized controlled trial and the intervention might affect hospital admissions, we performed the analyses on information predating the trial and the preceding implementation period.15 Therefore, the validated prediction period was from August 1st to October 31st, 2016.
Participants
The target groups to be included in the PaHS prediction model were defined with the following inclusion criteria: 1. The chronic disease group: Persons with a hospital contact within the last year caused by ≥1 of the following diagnoses: heart diseases, connective tissue diseases, pulmonary diseases or diabetes and one or more emergency hospital contacts within 12 months. 2. The emergency group: Persons with three or more emergency hospital contacts in the past six months. 3. The frail elderly group: Persons aged 65 years or more with a preventable hospital admission (admissions caused by the following diagnoses: dehydration, constipation, lower respiratory tract infections, urinary tract infections, gastroenteritis, fractures, nutritional deficiency anemia, social causes, and pressure ulcers) or an emergency readmission (within 30 days regardless of diagnosis). The three target groups were selected because of the frequency of hospitalizations and clinical experiences with earlier versions of PaHS. Persons belonging to either one of the three target groups aged 18 or above were included in the prediction calculation. Persons with a contact within 12 months of the following psychiatric diagnoses were excluded: substance abuse disorder, schizophrenia or dementia and metastatic cancer. Diagnosis codes are included in the Supplementary Material, Table 1.
Data
All data were derived from the Danish National Patient Register (DNPR) and assembled at Statistics Denmark. During analysis, data were pseudonymized and managed according to the requirements of the Danish National Data Protection Agency (Reference Nr. 06046). The dependent variable was a composite score of risk for preventable and acute hospital admissions. Covariates were age, gender, diagnoses, number and type of outpatient visits, admissions, preventable admissions predefined by diagnosis, 30-day readmissions, bed days, referral, acute vs planned contacts, pulmonary and cardiac surgery, any surgery, medical specialty, costs and dates for all contacts and procedures. The full list of covariates can be found in the Supplementary Material, Table 2.
For this study, we included information from the DNPR from August 1st, 2014 to October 31st, 2016. The prediction is calculated for emergency admissions from August 1st to October 31st, 2016.
Analyses
PaHS Prediction Model
The PaHS prediction model predicts risk of emergency hospital admission in the three months following the prediction date based on information from hospital contacts in a period of one year prior to the three months. The impact of each covariate on the risk of emergency hospital admission is estimated from the corresponding data one year prior.
Initially, persons in the three target groups were identified (the chronic disease, emergency and frail elderly groups). In the first estimation step, several generalized linear models are then conducted. The first set of analyses is regressions on number of emergency admissions (within the three months) with a chosen set of variables (based on the prior year). This is done separately for the 57 different covariates presented in Supplementary Material, Table 2. The 57 covariates and their derived forms are modeled separately at first to allow for more flexibility, and the values for each individual are included in the next model, see Supplementary Material Table 3. The second step combines the results from step one in one regression model, and the third step is a logistic regression of admission (yes/no) based on the values in the second model.
These steps are conducted separately for emergency admissions and preventable emergency admissions as the dependent variable resulting in two scores. Finally, the two scores are combined into one by summing them each weighted by their share of a common sum of both areas under the receiver operating characteristic (ROC) curve. Predictions are made by the same three steps, using results from the estimation part as weight/loadings in each step. In consequence, regression coefficients estimated in the estimation period are combined with register information on the outcome hospital admissions in the prediction period. The samples for the first estimation step and the second prediction step are separated by time and both include 100% of the sample.
Validation
Applying the PaHS prediction model, we calculated a risk score of emergency hospital admission in the three months from August 1st to October 31st, 2016. The predicted risk was then compared with information on emergency hospital admission within the same three months registered in the DNPR. The ROC and the corresponding area under the curve (AUC) were used to evaluate the discriminative ability of the PaHs predicted risk. Sensitivity, specificity, positive and negative predictive values were calculated for the 10th, 25th, 50th, 75th, 90th, 95th and 99th percentiles. The main model discrimination result is AUC. Due to clinical relevance, secondary results are the positive predictive value of the 95th and 99th percentiles since they represent high-risk healthcare users. Model calibration was estimated with the Brier score.
Since precision of the PaHS model may depend on the number of individuals included in the prediction, the calculation of PaHS risk score and validation was conducted for the whole country and for each of the five Danish regions.
Results
There were 112,026 persons aged 18 and over, who were included in at least one of the three target groups on August 1st, 2016. Table 1 presents characteristics of the included persons.
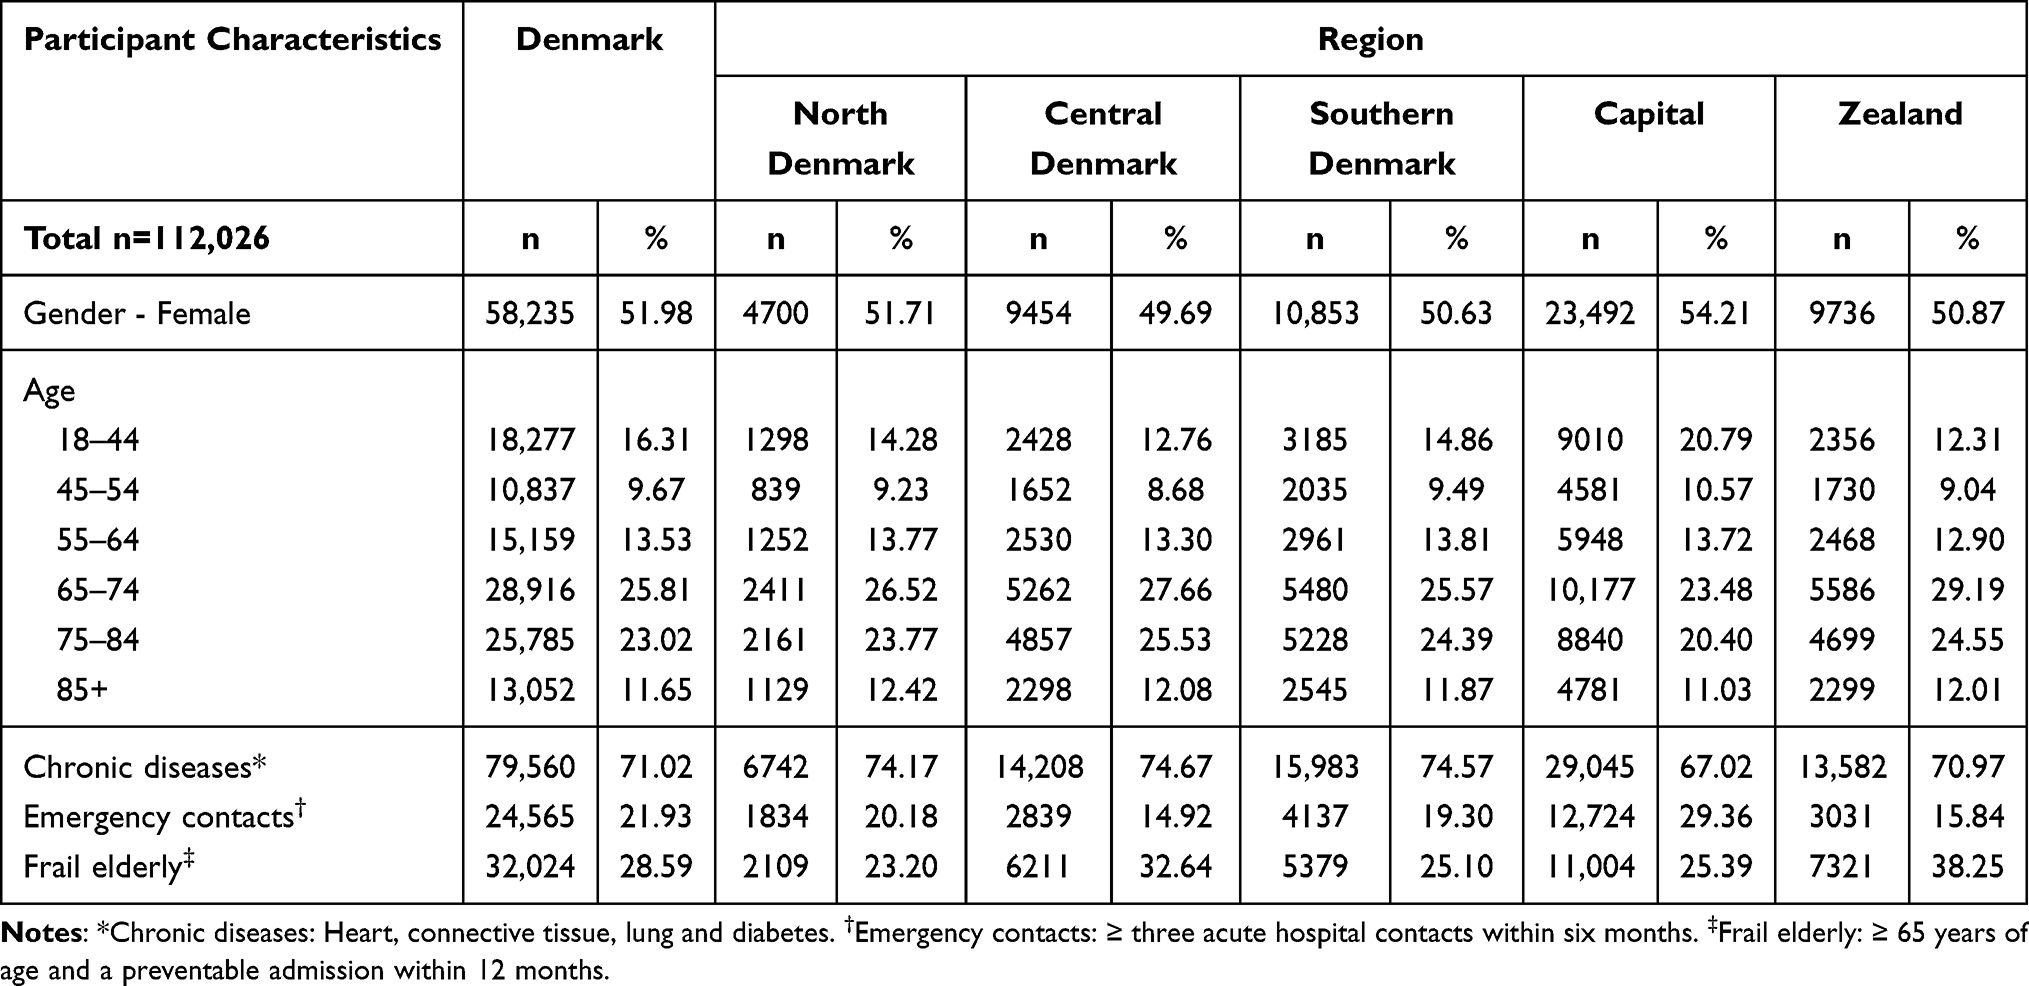 |
Table 1 Sample Characteristics |
Most participants were aged 65 years or older, 52% were women and 71% had at least one predefined chronic disease. The Capital Region differed from the other four regions by having a younger population, more women and fewer participants with chronic diseases compared to the other four regions.
Between August 1st and October 31st, 2016, 11,748 persons had one or more emergency hospital admissions.
Table 2 presents the sensitivity, specificity, positive and negative predictive value and the predicted risk threshold for the 10th, 25th, 50th, 75th, 90th, 95th, 99th percentiles with national data. The positive predictive value for the 99th percentile (top 1%) ranged from 0.251 (95% CI 0.193–0.309) in Southern Denmark to 0.656 (95% CI 0.589–0.723) in Zealand with a national average of 0.517 (95% CI 0.488–0.546) (Table 2). Model performance with regional data is presented in the Supplementary Material, Table 4. For regional data, the positive predictive value for the 99th percentile (top 1%) ranged from not applicable in Southern Denmark to 0.446 (95% CI 0.4–0.493) in the Capital.
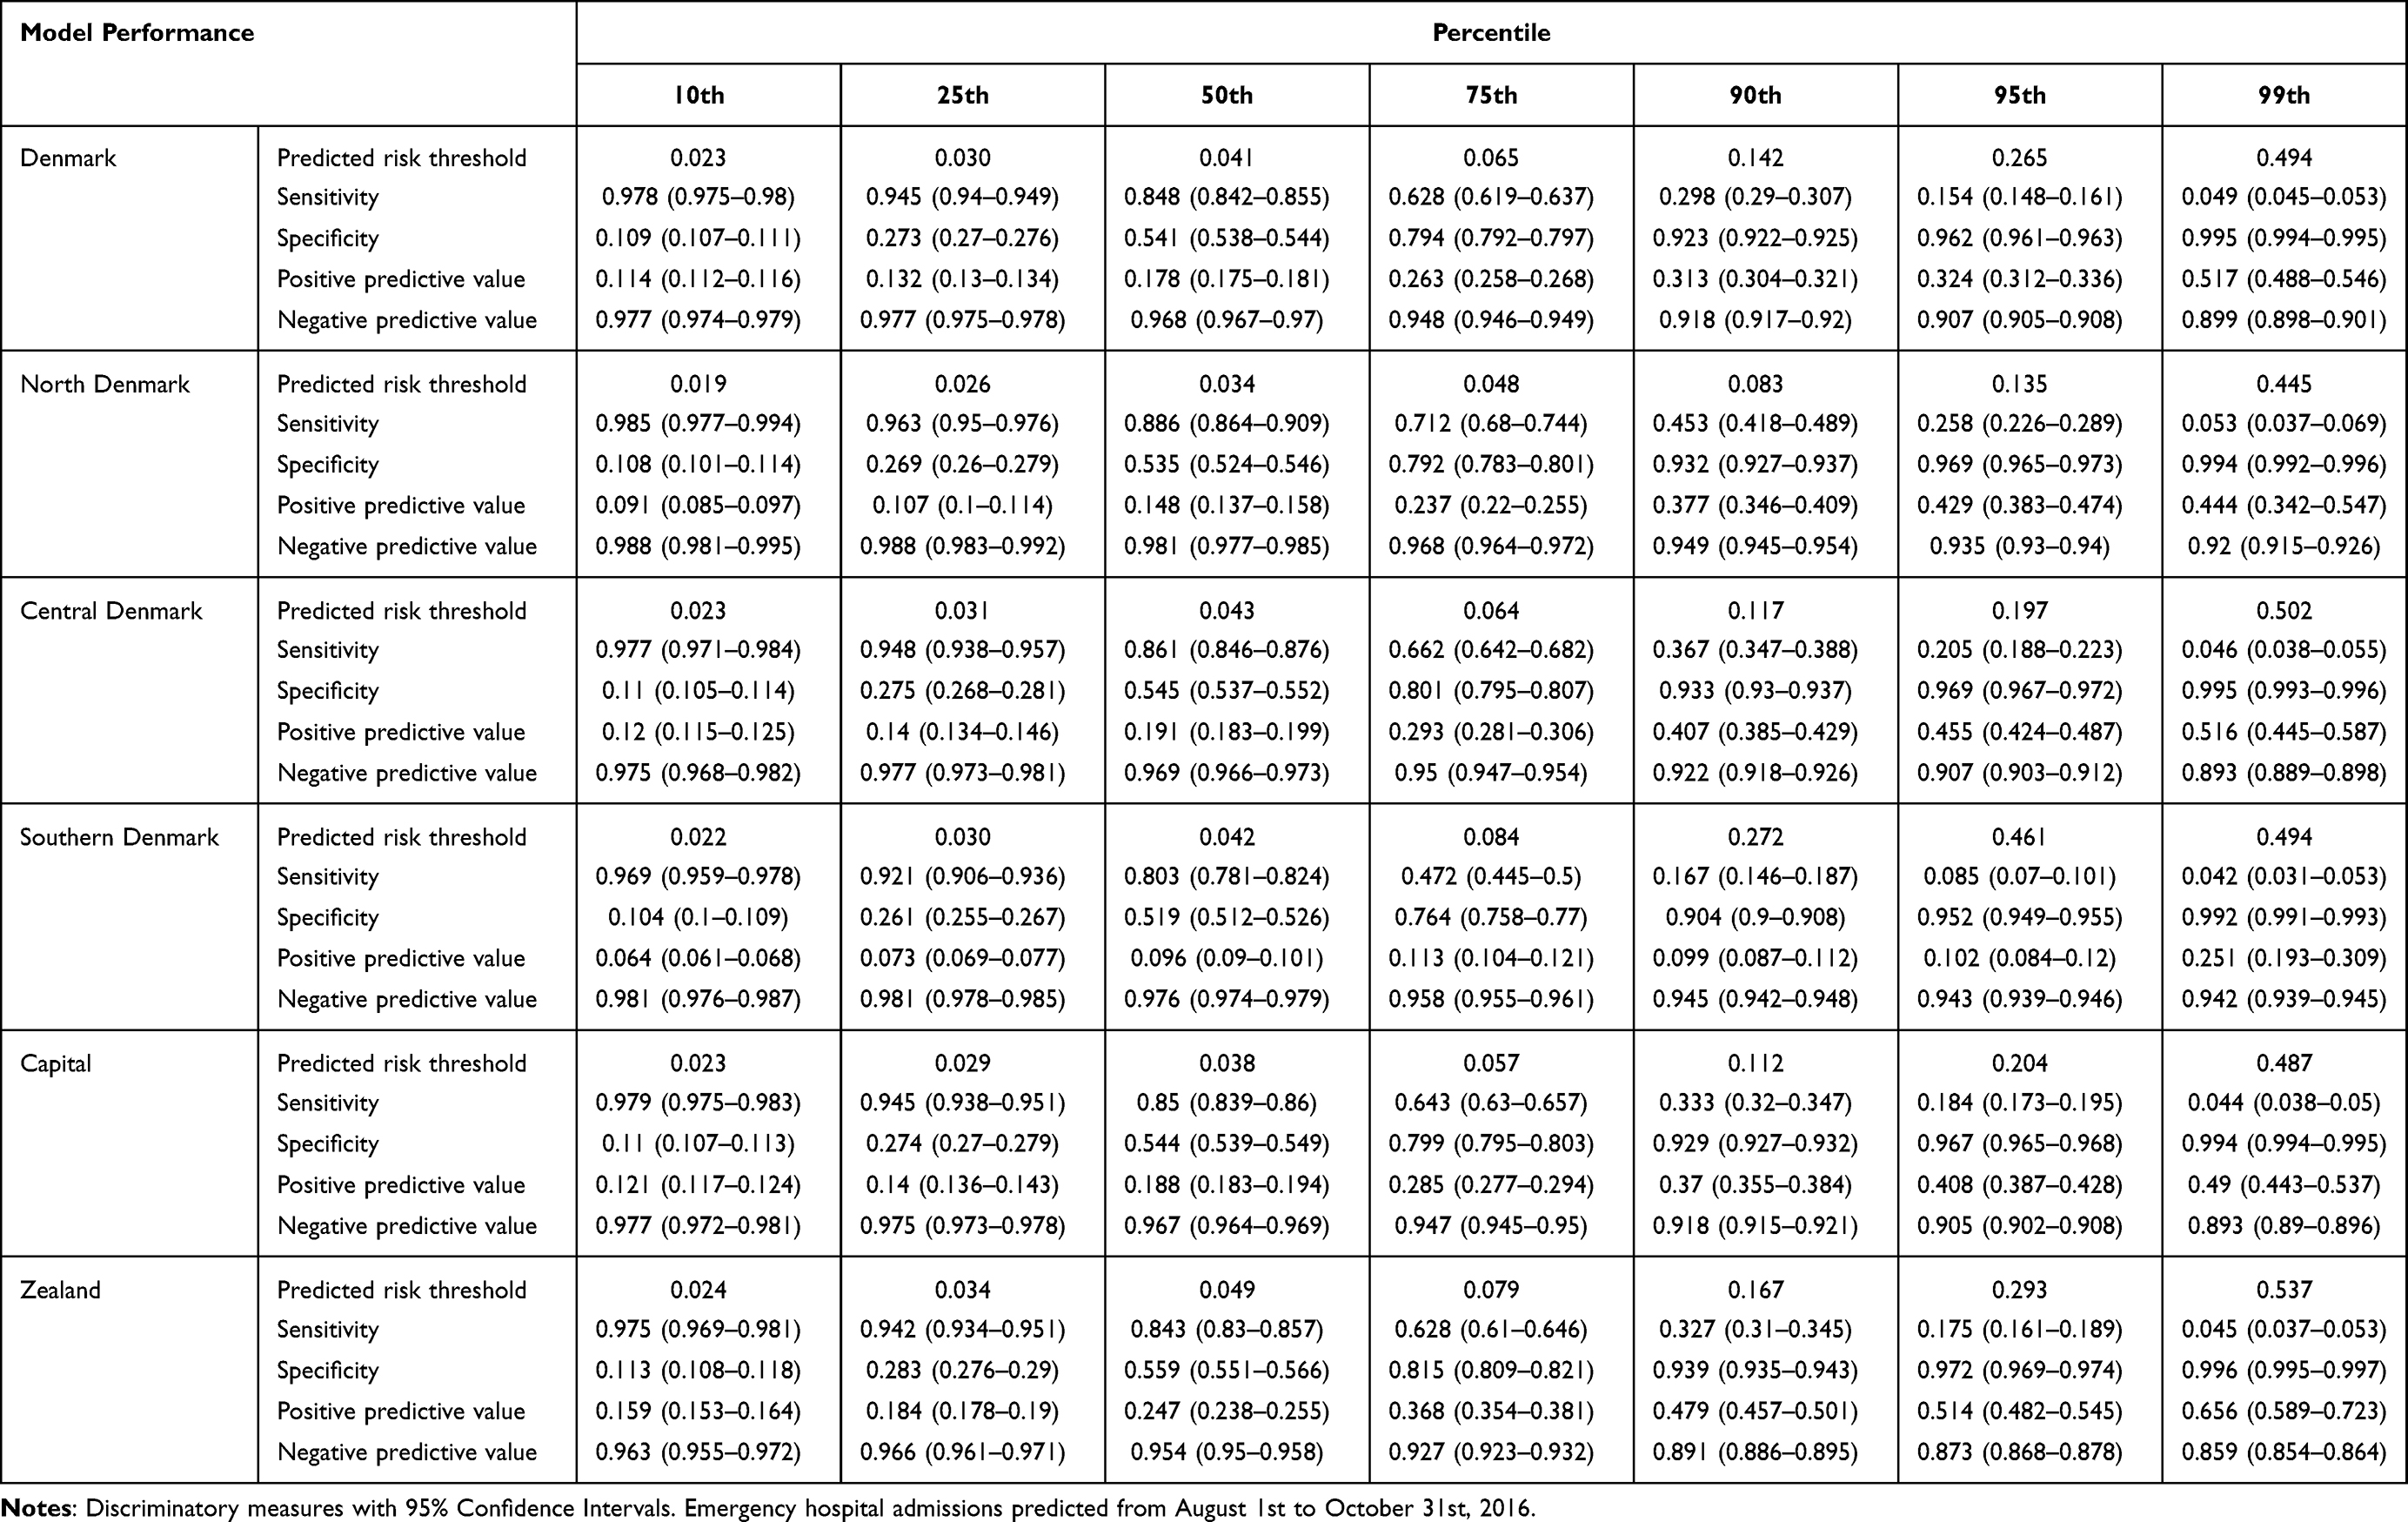 |
Table 2 Model Performance. Sensitivity, Specificity, Positive Predictive Value and Negative Predictive Value for the Following Percentiles: 10th, 25th, 50th, 75th, 90th, 95th and 99th |
Figure 1 presents the receiver operating characteristic curve. Area under the curve (AUC) was 0.7742 (95% CI 0.7698–0.7786) for the whole country when the model used national data.
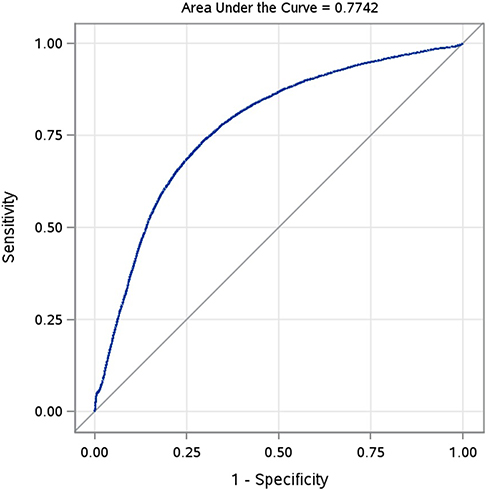 |
Figure 1 Receiver operating characteristics curve for national data. |
Table 3 presents AUC for each region when the model ran national and regional data, respectively. The model performed better with national data for estimation. While the AUC for four regions was ≥0.77 regardless of national or regional data, Southern Denmark had AUC of 0.69 (95% CI 0.6779–0.7049) with national data but only 0.64 (95% CI 0.6260–0.6535) on regional data.
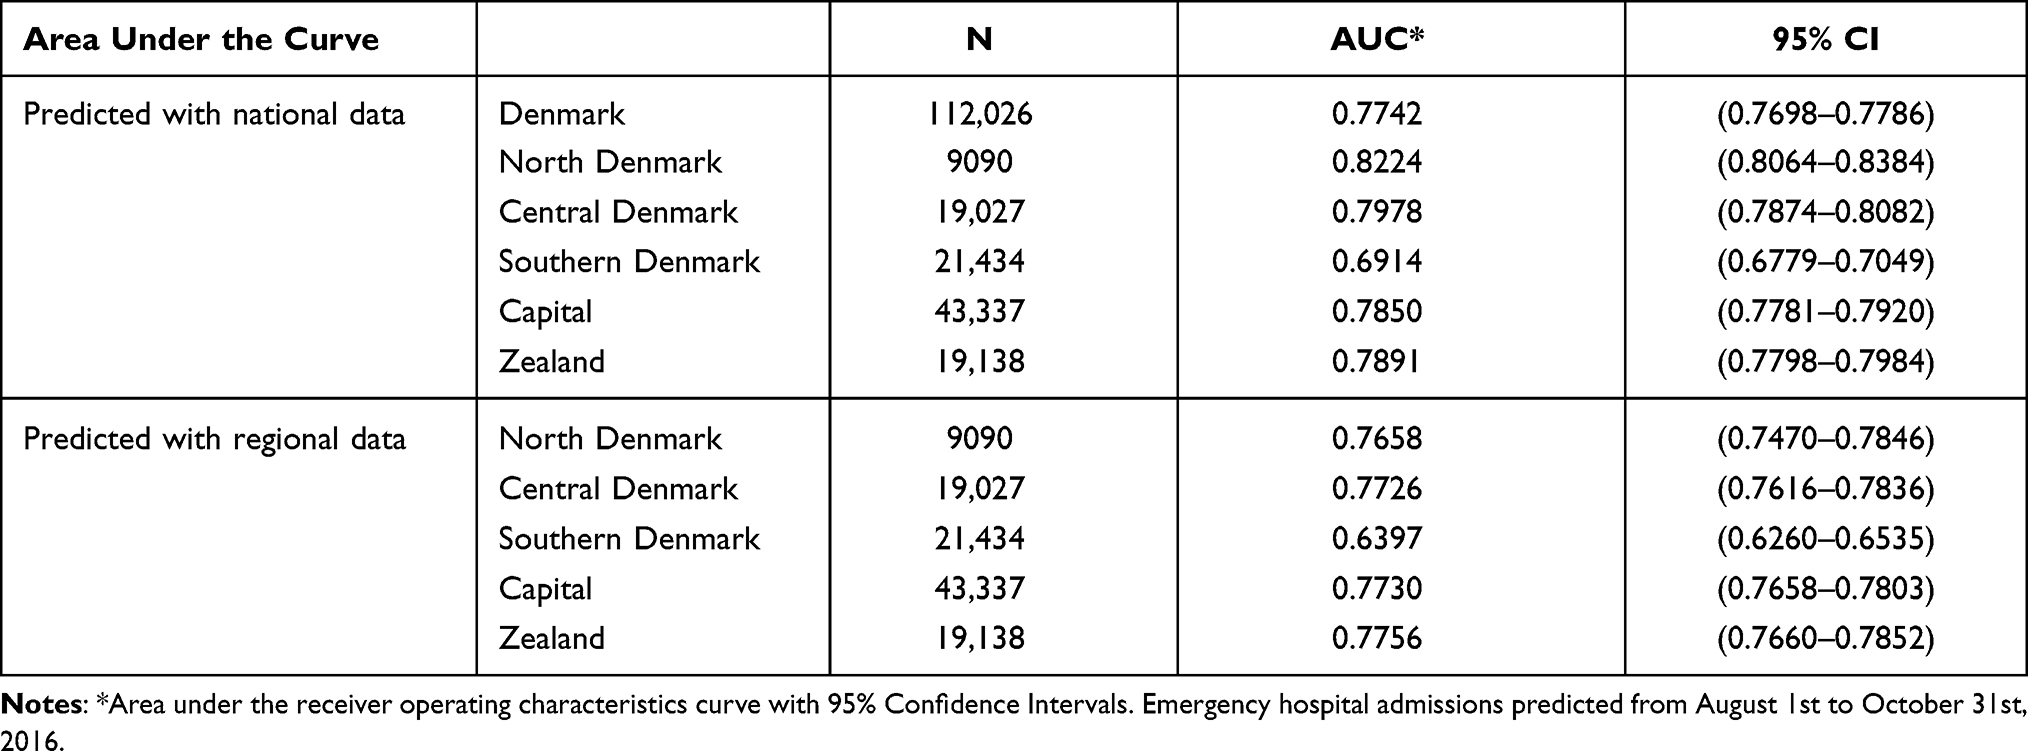 |
Table 3 Area Under the Curve for Each of the Five Regions Predicted with National and Regional Data Respectively |
Table 4 presents model calibration (accuracy) estimated with the Brier score. The Brier score was 0.09 for the national model and no higher than 0.11 in all regions.
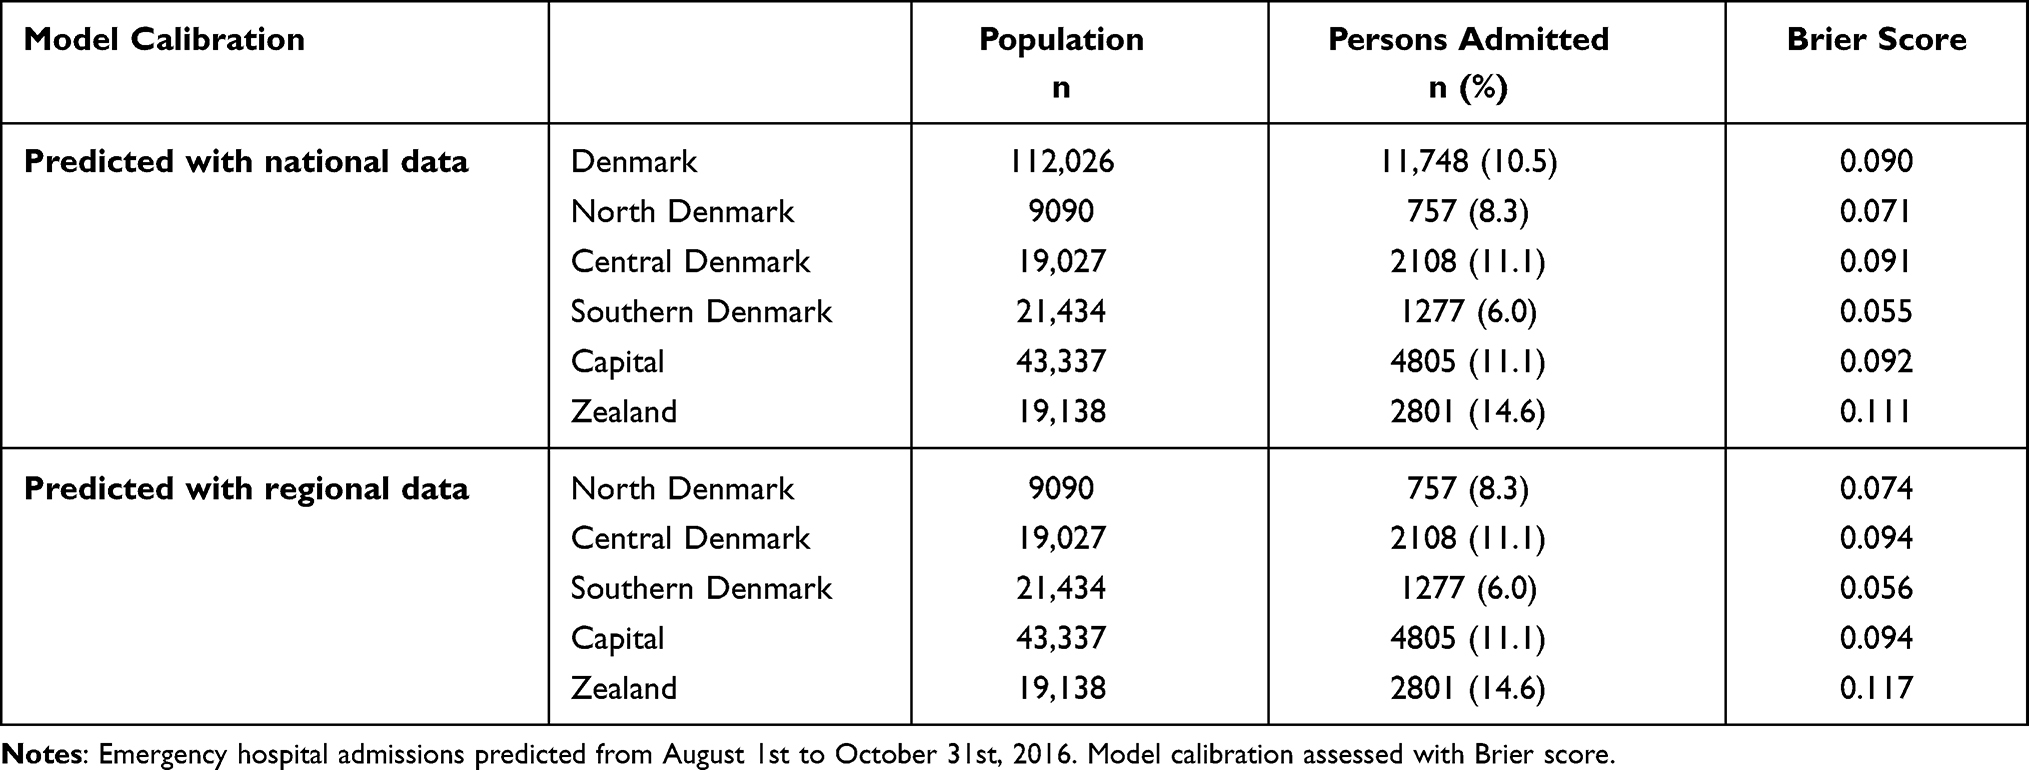 |
Table 4 Model Calibration Assessed with the Brier Score with National and Regional Data Respectively |
Discussion
Findings
The PaHS prediction model demonstrated satisfactory predictive value. The positive predictive value and AUC in Southern Denmark were well below the other regions. This may be explained by the relatively low number of emergency hospital admissions in this region, since the discriminatory ability of any prediction model may be reduced when the outcome prevalence is low.16 Furthermore, there may be indeterminable variation in registration practice between the regions such as classifying more hospital admissions as “planned” rather than “emergency”.
Strengths and Weaknesses
The complexity of the model enables prediction in a population that is heterogeneous in disease characteristics as well as point in the healthcare trajectory since there is no index admission. This demanding task is managed by using the estimated associations to calculate the expected number of admissions for each individual for each of the 57 covariates. The PaHS prediction model may identify persons already having many hospital admissions as well as those at risk of becoming consistently frequently admitted. The model design builds on estimation on the two years prior to prediction date and therefore assumes similar patterns of hospital admission in both years, which would account for seasonal variation but not clinical disease progression or recovery. A drawback of the model is the number of covariates that might imply overfitting of the model and might lead to errors in local implementation. The results, however, speak against overfitting since the model performed satisfactorily in four of the five regions. Furthermore, the Brier score was 0.09 overall and no higher than 0.11 in all regions suggesting fair model accuracy.
Similar Studies
The national AUC of 0.77 is comparable to other admission prediction models that rarely exceed 0.80.10 Other models with good discriminatory value have included predictors such as prior healthcare use, multimorbidity or polypharmacy and named medical diagnoses or prescription medication.10 The predictive value of the current model might improve with information about prescription medication. But these data are not available in the Danish National Patient Register, and they are registered with some delay, which would outdate the risk prediction.
Implications
The model is not focused on one specific condition and may be used to identify and prioritize community-dwelling adults for preventive measures. The model was developed for prioritization without a predefined cutoff. Based on the positive predictive value, focusing preventive interventions on the top 1% or top 5% would secure a relevant patient population.
Targeting high-risk persons for interventions includes the risk of the sample regressing towards the mean,17 which may dilute intervention efficacy. For example, an otherwise well-designed trial of highly intensive supportive care for so-called superutilizers turned out negative because the control group also experienced lower hospital admissions and a prediction model was not utilized.18 The PaHS prediction model was employed to select patients for telephone-based self-management support. The impending evaluation of the trial will demonstrate intervention efficacy and investigate whether predicted risk interacts with intervention effects. Since patients have untethered access to their own patient records, documentation of any risk score in a patient record has ethical implications and requires strong communicative skills to avoid stigmatization, ensure patients’ understanding of the risk score and ensure patient involvement in deciding whether to disclose the risk score. The PaHS prediction model was used to invite patients for trial participation. Although the risk score was not intended to have any role in the intervention, the topic might come up since randomization was stratified by risk score. The nurses with patient contact were well trained in communication.13 A qualitative observational study of 22 start-up sessions did not identify the predicted risk as a theme19 and it therefore seems unlikely that participants were burdened from the topic.
Future Research
The present prediction model assigns a risk to each patient at a given date but does not differentiate between stable, fluctuating, decreasing and increasing risk. Furthermore, high-cost healthcare users are heterogeneous and frequent users only account for a small portion of the population.9 Future prediction models could focus on identifying persons that are at risk of developing a high use of healthcare resources, such as trajectory modelling or mapping events that make the overall burden of disease and treatment unmanageable for each patient.
Conclusions
Individual risk of emergency hospital admissions can be satisfactorily predicted.
Data Sharing Statement
The data from this study are derived from the DNPR. The DNPR can be accessed through permission from Statistics Denmark.
Ethics Approval and Consent to Participate
The Helsinki Declaration was followed. The current validation study used register data only and therefore did not require consent or Ethics Committee approval according to Danish law. The prediction model under study has also been used to identify participants in a randomized controlled trial and this has been approved by the Ethics Committee (SJ-677).
Acknowledgments
The PAHS prediction model was developed by Data and Development Support, Region Zealand, Denmark.
Funding
The PaHS research program is funded by an unrestricted grant from the Danish Ministry of Health (no grant number available). The sponsor has no role in management, analysis and interpretation of data.
Disclosure
The authors declare that they have no competing interests.
References
1. Muratov S, Lee J, Holbrook A, et al. Unplanned index hospital admissions among new older high-cost health care users in Ontario: a Population-Based Matched Cohort Study. CMAJ Open. 2019;7(3):E537–E545. doi:10.9778/cmajo.20180185
2. Purdy S, Griffin T, Salisbury C, Sharp D. Ambulatory care sensitive conditions: terminology and disease coding need to be more specific to aid policy makers and clinicians. Public Health. 2009;123(2):169–173. doi:10.1016/j.puhe.2008.11.001
3. Toxvaerd CG, Benthien KS, Andreasen AH, Nielsen A, Osler M, Johansen NB. Chronic diseases in high-cost users of hospital, primary care, and prescription medication in the Capital Region of Denmark. J Gen Intern Med. 2019;34(11):2421–2426. doi:10.1007/s11606-019-05315-w
4. Busby J, Purdy S, Hollingworth W. A systematic review of the magnitude and cause of geographic variation in unplanned hospital admission rates and length of stay for ambulatory care sensitive conditions. BMC Health Serv Res. 2015;15(1):324. doi:10.1186/s12913-015-0964-3
5. Schiotz M, Price M, Frolich A, et al. Something is amiss in Denmark: a comparison of preventable hospitalisations and readmissions for chronic medical conditions in the Danish healthcare system and kaiser permanente. BMC Health Serv Res. 2011;11(1):347. doi:10.1186/1472-6963-11-347
6. Wammes JJG, van der Wees PJ, Tanke MAC, Westert GP, Jeurissen PPT. Systematic review of high-cost patients’ characteristics and healthcare utilisation. BMJ Open. 2018;8(9):e023113. doi:10.1136/bmjopen-2018-023113
7. Buja A, Rivera M, De Battisti E, et al. Multimorbidity and hospital admissions in high-need, high-cost elderly patients. J Aging Health. 2020;32(5–6):259–268. doi:10.1177/0898264318817091
8. Muratov S, Lee J, Holbrook A, et al. Incremental healthcare utilisation and costs among new senior high-cost users in Ontario, Canada: a Retrospective Matched Cohort Study. BMJ Open. 2019;9(10):e028637. doi:10.1136/bmjopen-2018-028637
9. Lee NS, Whitman N, Vakharia N, Taksler GB, Rothberg MB. High-cost patients: hot-spotters don’t explain the half of it. J Gen Intern Med. 2017;32(1):28–34. doi:10.1007/s11606-016-3790-3
10. Wallace E, Stuart E, Vaughan N, Bennett K, Fahey T, Smith SM. Risk prediction models to predict emergency hospital admission in community-dwelling adults: a systematic review. Med Care. 2014;52(8):751–765. doi:10.1097/MLR.0000000000000171
11. Zhou H, Della PR, Roberts P, Goh L, Dhaliwal SS. Utility of models to predict 28-day or 30-day unplanned hospital readmissions: an updated systematic review. BMJ Open. 2016;6(6):e011060. doi:10.1136/bmjopen-2016-011060
12. Kansagara D, Englander H, Salanitro A, et al. Risk prediction models for hospital readmission: a systematic review. JAMA. 2011;306(15):1688–1698. doi:10.1001/jama.2011.1515
13. Benthien KS, Rasmussen K, Nielsen CP, et al. Proactive health support (PaHS) - telephone-based self-management support for persons at risk of hospital admission: study protocol for a randomized controlled trial. Contemp Clin Trials. 2020;93:106004. doi:10.1016/j.cct.2020.106004
14. Collins GS, Reitsma JB, Altman DG, Moons KG. Transparent reporting of a multivariable prediction model for individual prognosis or diagnosis (TRIPOD): the TRIPOD statement. BMJ. 2015;350(jan07 4):g7594. doi:10.1136/bmj.g7594
15. Fredens M, Terkildsen MD, Bollerup S, et al. The national implementation of ‘proactive health support’ in Denmark since 2017: expectations and challenges for the telephone-based case management intervention. Health Policy (New York). 2020;124(7):674–678. doi:10.1016/j.healthpol.2020.05.014
16. Pavlou M, Ambler G, Seaman SR, et al. How to develop a more accurate risk prediction model when there are few events. BMJ. 2015;351:h3868. doi:10.1136/bmj.h3868
17. Roland M, Dusheiko M, Gravelle H, Parker S. Follow up of people aged 65 and over with a history of emergency admissions: analysis of routine admission data. BMJ. 2005;330(7486):289–292. doi:10.1136/bmj.330.7486.289
18. Finkelstein A, Zhou A, Taubman S, Doyle J. Health care hotspotting - a randomized, controlled trial. N Engl J Med. 2020;382(2):152–162. doi:10.1056/NEJMsa1906848
19. Winther S, Fredens M, Hansen MB, Benthien KS, Nielsen CP, Gronkjaer M. Proactive health support: exploring face-to-face start-up sessions between participants and registered nurses at the onset of telephone-based self-management support. Glob Qual Nurs Res. 2020;7:2333393620930026.
 © 2021 The Author(s). This work is published and licensed by Dove Medical Press Limited. The full terms of this license are available at https://www.dovepress.com/terms.php and incorporate the Creative Commons Attribution - Non Commercial (unported, v3.0) License.
By accessing the work you hereby accept the Terms. Non-commercial uses of the work are permitted without any further permission from Dove Medical Press Limited, provided the work is properly attributed. For permission for commercial use of this work, please see paragraphs 4.2 and 5 of our Terms.
© 2021 The Author(s). This work is published and licensed by Dove Medical Press Limited. The full terms of this license are available at https://www.dovepress.com/terms.php and incorporate the Creative Commons Attribution - Non Commercial (unported, v3.0) License.
By accessing the work you hereby accept the Terms. Non-commercial uses of the work are permitted without any further permission from Dove Medical Press Limited, provided the work is properly attributed. For permission for commercial use of this work, please see paragraphs 4.2 and 5 of our Terms.