")
Back to Journals » Nature and Science of Sleep » Volume 14
Predicting Attentional Vulnerability to Sleep Deprivation: A Multivariate Pattern Analysis of DTI Data
Authors Wang C, Fang P, Li Y, Wu L, Hu T, Yang Q, Han A, Chang Y, Tang X, Lv X, Xu Z , Xu Y, Li L, Zheng M, Zhu Y
Received 20 October 2021
Accepted for publication 14 April 2022
Published 22 April 2022 Volume 2022:14 Pages 791—803
DOI https://doi.org/10.2147/NSS.S345328
Checked for plagiarism Yes
Review by Single anonymous peer review
Peer reviewer comments 3
Editor who approved publication: Professor Ahmed BaHammam
Chen Wang,1,* Peng Fang,2,* Ya Li,1,* Lin Wu,2,* Tian Hu,3 Qi Yang,4 Aiping Han,5 Yingjuan Chang,1 Xing Tang,1 Xiuhua Lv,1 Ziliang Xu,1 Yongqiang Xu,1 Leilei Li,1 Minwen Zheng,1 Yuanqiang Zhu1
1Department of Radiology, Xijing Hospital, Fourth Military Medical University, Xi’an, People’s Republic of China; 2Department of Military Medical Psychology, Air Force Medical University, Xi’an, People’s Republic of China; 3Department of Radiology, Yan’an University Affiliated Hospital, Yan’an, People’s Republic of China; 4Department of Radiology, Affiliated Hospital of Shaanxi University of Traditional Chinese Medicine, Xianyang, People’s Republic of China; 5Imaging Diagnosis and Treatment Center, Xi’an International Medical Center Hospital, Xi’an, People’s Republic of China
*These authors contributed equally to this work
Correspondence: Yuanqiang Zhu, Department of Radiology, Xijing Hospital, Fourth Military Medical University, No. 127 West Changle Road, Xi’an, 710032, People’s Republic of China, Tel/Fax +86-29-84775415, Email [email protected] Minwen Zheng, Department of Radiology, Xijing Hospital, Fourth Military Medical University, No. 127 West Changle Road, Xi’an, 710032, People’s Republic of China, Tel/Fax +86-29-84771938, Email [email protected]
Background: Large individual differences exist in sleep deprivation (SD) induced sustained attention deterioration. Several brain imaging studies have suggested that the activities within frontal-parietal network, cortico-thalamic connections, and inter-hemispheric connectivity might underlie the neural correlates of vulnerability/resistance to SD. However, those traditional approaches are based on average estimates of differences at the group level. Currently, a neuroimaging marker that can reliably predict this vulnerability at the individual level is lacking.
Methods: Efficient transfer of information relies on the integrity of white matter (WM) tracts in the human brain, we therefore applied machine learning approach to investigate whether the WM diffusion metrics can predict vulnerability to SD. Forty-nine participants completed the psychomotor vigilance task (PVT) both after resting wakefulness (RW) and after 24 h of sleep deprivation (SD). The number of PVT lapse (reaction time > 500 ms) was calculated for both RW condition and SD condition and participants were categorized as vulnerable (24 participants) or resistant (25 participants) to SD according to the change in the number of PVT lapses between the two conditions. Diffusion tensor imaging were acquired to extract four multitype WM features at a regional level: fractional anisotropy, mean diffusivity, axial diffusivity, and radial diffusivity. A linear support vector machine (LSVM) learning approach using leave-one-out cross-validation (LOOCV) was performed to assess the discriminative power of WM features in SD-vulnerable and SD-resistant participants.
Results: LSVM analysis achieved a correct classification rate of 83.67% (sensitivity: 87.50%; specificity: 80.00%; and area under the receiver operating characteristic curve: 0.85) for differentiating SD-vulnerable from SD-resistant participants. WM fiber tracts that contributed most to the classification model were primarily commissural pathways (superior longitudinal fasciculus), projection pathways (posterior corona radiata, anterior limb of internal capsule) and association pathways (body and genu of corpus callosum). Furthermore, we found a significantly negative correlation between changes in PVT lapses and the LSVM decision value.
Conclusion: These findings suggest that WM fibers connecting (1) regions within frontal-parietal attention network, (2) the thalamus to the prefrontal cortex, and (3) the left and right hemispheres contributed the most to classification accuracy.
Keywords: sleep deprivation, vulnerability, diffusion tensor imaging, machine learning, psychomotor vigilance task
Introduction
Sleep facilitates the clearance of waste products that accumulate during wakefulness and plays an essential role in maintaining health and well-being.1 Sleep is also of critical importance for learning and memory. According to the synaptic homeostasis theory, one essential role of sleep is the optimization of synaptic circuits to retain salient memory traces. Therefore, sleep is believed to consolidate synaptic connections required for encoding and retention of memories.2 Sleep deprivation (SD) has become increasingly common in modern society. SD can lead to a variety of cognitive deficits, in which deterioration of sustained attention appears to be the most consistent consequence.3 Previous studies using functional magnetic resonance imaging (fMRI) have suggested that decreased activation within the frontal-parietal network (FPN),4 disrupted cortico-thalamic connections,5 and compromised interhemispheric connectivity might contribute to sustained impairments to attention after SD.6
Interestingly, not everyone experiences cognitive deficits after SD to the same extent and large individual differences exist in the degree of attentional impairment. Previous studies have demonstrated that amount of vulnerability (or resistance) to SD-induced attentional deterioration is trait-like and reproducible within a given individual.7,8 A number of studies have attempted to discern the underlying neural mechanisms that contribute to this vulnerability. For example, Chee et al found that frontal-parietal activation when performing a sustained attention task was higher in SD-resistant individuals than in vulnerable individuals.9 They also found that while thalamic activity after SD and at baseline were comparable in resilient individuals, it was reduced in vulnerable participants following SD. Yeo et al found that vulnerable participants had poorer negative correlations between default mode network and FPN activity compared with those who were resistant.10 Normal cognitive function requires effective communication among distributed neuronal populations in functionally specialized brain areas. Additionally, the efficient transfer of information relies on the integrity of white matter (WM) tracts in the human brain. Studies using diffusion tensor imaging (DTI) have suggested that primary insomnia was associated with WM tracts disruptions of several, such as superior longitudinal fasciculus (SLF) within the FPN network and corona radiate, internal capsule within the thalamocortical networks.11 A previous study using DTI also found that participants vulnerable to SD-induced attentional impairments exhibited significantly lower integrity in several WM fiber tracts compared with resistant participants.12
However, a reliable neuroimaging marker that can predict this kind of vulnerability is still missing. The most likely reason for the difficulty is that the differences between vulnerable participants and resistant participants are usually reported at the group level, which provides limited information for making inferences at the individual level. Unlike traditional group-level univariate analysis, cutting-edge machine learning techniques can detect differences that are subtle and spatially distributed and have been indicated to improve diagnoses, classification, and treatment-outcome prediction in a range of situations.13,14 However, to our best knowledge, studies using DTI and machine learning strategies for SD vulnerability prediction are rare. In the current study, we applied a linear support vector machine learning approach to investigate whether the WM diffusion metrics can predict vulnerability to SD. Based on the findings mentioned above, we hypothesized that microstructural properties of WM tracts within the FPN (superior longitudinal fasciculus), thalamocortical projections (corona radiata, internal capsule), and interhemispheric association tracts (corpus callosum) would be the primary contributors to accurate classification.
Methods
Participants
Forty-nine participants were recruited from universities and the local community via advertisements. Consistent with our previous studies,15,16 the exclusion criteria included sleep disorders, claustrophobia, drug/alcohol abuse, and a history of neurological or psychiatric illness. All participants provided their informed consent according to the Declaration of Helsinki. The study was approved by the clinical trial ethics committee of Xijing Hospital at Air Force Medical University.
Sleep-Deprivation Procedure
Participants were asked to make three visits to the laboratory. During the first visit, they were briefed about the study protocol and signed the informed consent form. To record their sleep patterns, participants were asked to wear a wrist Actiwatch (Philips Respironics, Mini Mitter) 24 hours continuously for 1 week. The monitor was placed on the nondominant wrist and participants were asked not to remove it. One week later, participants came to the laboratory either for a RW (resting wakefulness) session or a SD session. The session order was randomized in a cross-over fashion, and there was a ~ 1-week interval to minimize possible residual effects of sleep deprivation on cognition.17 During the RW condition, participants reached the laboratory at 8:00 AM. Compliance to a regular sleep schedule was verified by checking the participant’s sleep diary and wrist Actiwatch. Participants who did not comply with a regular sleep schedule (>6 h of sleep/night; sleep time no later than 1:00 AM; wake time no later than 9:00 AM) were excluded. The MRI scans (functional MRI scanning, published elsewhere) were scheduled after participants had completed the 10 min of the PVT. The SD process began at 8:00 AM and ended at 8:00 AM on the following day. During SD, participants were allowed to read, watch TV, or surf the internet. Strenuous activities and beverages with caffeine were not allowed during the experiment. The temperature was around 23°C with standard light (340 lux). Two researchers accompanied the participants to prevent them from falling asleep. The DTI scans used in the analyses were performed at 10:00 PM during the SD session. Functional MRI scanning was scheduled at 8:00 AM on the following day after participants had completed the 10 min of the PVT.
The ability to sustain attention was measured using the well-defined psychomotor vigilance task (PVT), which has been described in detail elsewhere.18 Briefly, at random intervals, a millisecond counter began to scroll, and participants were asked to press the space bar on a keyboard to stop the scrolling counter as quickly as possible. After pressing the button, the counter displayed the achieved RT for 1 second as a feedback for monitoring their performances. The duration of the task was 10 minutes, and the inter-stimulus intervals were distributed randomly from 2 to 10s. The average stimuli trials (RW mean: 61.1± 1.38; SD mean: 60.2 ±1.97) and the inter-stimulus intervals (RW mean: 6.13± 0.61 s; SD mean: 6.09 ±0.56 s) showed no significant differences between the two conditions. Reaction times longer than 500 ms were defined as a lapse in performance. The participants completed the PVT for both RW and SD conditions and the number of PVT lapse was calculated for both RW condition and SD condition. Vulnerability to SD was computed on the basis of the extent of an individual’s change in number of lapses after SD, taking into account their performance at RW condition. In other words, participants were stratified as SD-resistant or SD-vulnerable according to the number change of PVT lapse (lapseSD-lapseRW).
MRI Data Collection
Diffusion data were acquired using a GE Discovery MR750 3.0T scanner with a standard 8-channel head coil at Xijing Hospital. During scanning, all participants were instructed to keep their eyes open, let their minds wander, and stay awake.19 Diffusion-weighted sequences with single-shot echo planar imaging aligned to the anterior-posterior commissural plane were acquired using the following parameters: field of view (FOV) = 282 mm × 282 mm, repetition time (TR)/echo time (TE) = 8000/89 ms, flip angle = 90°, slice thickness = 2.2 mm, and 62 continuous axial slices with no gap. The diffusion sensitizing gradients were applied along 64 non-linear directions (b = 1000 s/mm2), combined with an acquisition without diffusion weighting (b = 0 s/mm2).
Whole Brain WM Diffusion Metrics
Individual diffusion-weighted images were corrected for head motion and eddy current distortion using Functional Magnetic Resonance Imaging of the Brain (FMRIB) Diffusion Toolbox v2.0 (FDT) from the FMRIB Software Library (FSL; http://fsl.fmrib.ox.ac.uk/fsl/fslwiki/).20,21 Gradient directions were also corrected to preserve the orientation information.22 Non-brain tissue and background noise were removed using FSL’s brain extraction tool.23 The diffusion tensor and diffusion parameter maps for fractional anisotropy (FA), axial diffusivity (AD), radial diffusivity (RD), and mean diffusivity (MD) was calculated using DTIFIT from FMRIB’s Diffusion Toolbox.20
The population-specific template was constructed through tensor-based registration using affine and diffeomorphic registration algorithms from the Diffusion Tensor Imaging ToolKit (DTI-TK; http://dti-tk.sourceforge.net).24–27 The JHU ICBM-DTI-81 template was normalized into this population template space using the Advanced Normalization Tools (ANTs; https://www.nitrc.org/projects/ants), diffeomorphic spatial registration algorithms, and nearest neighbor interpolation.28–31 The normalized JHU ICBM-DTI-81 template was then warped by the inverse of the transformation fields that were estimated in the population-specific template generation process to acquire the participant-specific WM tracts.29 Quality-control was performed throughout visual inspection of the direction-encoding color fractional anisotropic image and the participant-specific WM atlas.32 Distribution metrics (mean, standard deviation, skew, and kurtosis) for each tract were computed from diffusion parameter maps in individual diffusion space for each participant.32 The 768 diffusion metrics that represented the whole brain WM characteristics were selected as features in the following step.
Machine Learning Pipeline
This study applied a nested leave-one-out cross-validation (LOOCV) procedure. An external LOOCV was used to estimate classification accuracy and an internal LOOCV was used to determine the optimal subset of relevant features. The LOOCV means that data from N-1 subjects were used as the training set and the remaining one subject was the test sample, where N is the number of all subjects. Internal LOOCVs were applied in the training set for each external LOOCV. The LOOCV strategy provides a good estimation for evaluating the generalization ability of the model, especially applicable in the case of relatively small sample size (as in this study).33 The schematic overview of the proposed nested LOOCV classification framework is shown in Figure 1.
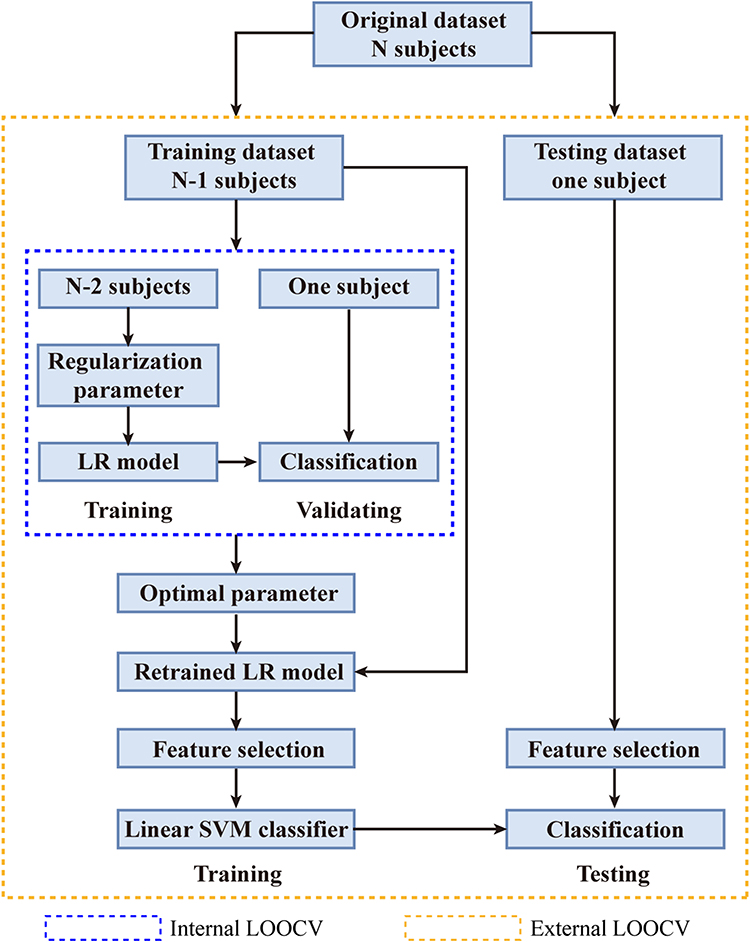 |
Figure 1 Schematic overview of the proposed nested LOOCV classification framework. Abbreviation: LR, logistic regression. |
Feature Selection Procedure
In machine learning and statistics, feature selection has been widely employed to identify relevant features for dimensionality reduction, to strengthen generalization capability, and to simplify the model.34,35 For each internal LOOCV, the feature selection was realized through an L1-regularized logistic regression model implemented within LIBLINEAR v2.4 (https://www.csie.ntu.edu.tw/~cjlin/liblinear/).36 As an embedded feature selection method, L1 regularization selects the optimum feature subset by shrinking the coefficients of irrelevant features toward zero with the regularization parameter C37. All features were normalized to a mean of 0 and a standard deviation of 1 before entering the feature selection process. Each value for 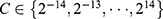 was applied to the training set (N-2 participants) for each internal LOOCV, resulting in 29 internal LOOCVs. Thus, 29 classification accuracies were obtained for each internal LOOCV. The C value with the highest classification accuracy for the internal LOOCV was defined as the optimal regularization parameter. This optimal parameter was then applied to the training set (N-1 participants) to train the model and the features corresponding to nonzero coefficients of the model were regarded as selected features.
LSVM-Based Classifier Implementation
For the external LOOCV, a linear support vector machine (LSVM) was adopted based on the features selected by the L1-regularized logistic regression. The LSVM was then used to construct the classification model and evaluate classification performance. This analysis was implemented using the LIBSVM MATLAB module (http://www.csie.ntu.edu.tw/~cjlin/libsvm/).38 As a widely used supervised learning algorithm, the LSVM maps training samples to points in a multidimensional space, with each dimension corresponding to a feature, and finds the hyperplane that maximizes the margin between the samples of different categories (SD-resistant was labeled as 1 and SD-vulnerable as −1).38 The hyperplane can be represented by a decision function  , in which y is the decision value, x is the multidimensional feature vector, and w is the coefficient/weight of the corresponding feature. The resultant weight for each feature represents the feature contribution/importance to the classification.34,35,39 We apply the untrained test sample to the decision function, any sample with a positive decision value was classified as SD-resistant and a negative score as SD-vulnerable.
The above procedure contains a total of 49 (external LOOCV) * 48 (internal LOOCV) * 29 (regularization parameter) = 68,208 cycles. The internal LOOCV takes the default approach in the LIBLINEAR toolkit. The pipeline system for Octave and Matlab (PSOM; https://www.nitrc.org/projects/psom/) was used to speed up this process.
LSVM Classification Performance Evaluation
In the current study, accuracy, sensitivity, specificity, positive predictive value (PPV), and negative predictive value (NPV) were used to evaluate the performance of the classification model. Accuracy (proportion of true positives and true negatives) was defined as the proportion of participants who were correctly identified as vulnerable or resistant. Sensitivity (proportion of true positives) and specificity (proportion of true negatives) measured the proportion of participants correctly classified as SD-vulnerable or SD-resistant, respectively. The PPV was the odds of being SD-vulnerable when classified as SD-vulnerable and the NPV was the odds of being SD-resistant if classified as SD-resistant. In addition, receiver operating characteristic (ROC) analysis was also used to evaluate classification performance.40 The area under the ROC curve (AUC) reflects the classification power of the classifier, with larger AUCs indicating better classification power.40
The permutation test was also conducted to assess whether the accuracy and AUC were significantly higher than values expected by chance.41,42 As a non-parametric statistical method, the permutation test can be used to analyze quantified data that do not satisfy statistical assumptions derived from traditional parametric tests.43,44 Specifically, the class labels across the entire sample were randomly permutated 1000 times without replacement, and the entire machine learning pipeline was re-executed each time. The p-value of the permutation test was calculated as the number of permutations that resulted in a greater statistic (accuracy or AUC) than was obtained using the real data, divided by the total number of permutations (ie, 1000).
Weight of Features
Because of the nested LOOCV strategy, the training set for each external LOOCV was slightly different, resulting in differences in selected features across repetitions.45 In the current study, the overlapping features across all folds of the external LOOCV were defined as the discriminative features and the discriminative weight represents the discriminative power of the corresponding feature. The discriminative weight was quantitatively calculated as the average of the absolute weights across all repetitions.45 A higher absolute value of the discriminative weight indicates a greater contribution of the corresponding feature to the classification.34,39,46
Results
Demographic Characteristics, Stanford Sleepiness Scale, and Objective Sleep Measures
Forty-nine participants successfully completed the SD experiment. Based on the change in the number of lapses between SD and RW condition. Participants were stratified as SD-resistant or SD-vulnerable group. The average change in PVT lapse was 0.54 for the SD-resistant group and 9.56 for the SD-vulnerable group. The two groups were similar in age (22.00 ± 1.71 for resistant group, 22.08 ± 1.77 for vulnerable group, P > 0. 5), gender distribution (12 females in resistant group, 13 females in vulnerable group, P > 0. 5) and body mass index (23.60 ± 0.96 for resistant group, 23.70 ± 1.10 for vulnerable group, P > 0. 5). They all had habitually good sleep confirmed by Actiwatchs and no significant differences were found for objective sleep parameters, including number of wakening each night, sleep duration all night, sleep efficiency and sleep latency. Detailed demographic and sleep-pattern information are listed in Table 1.
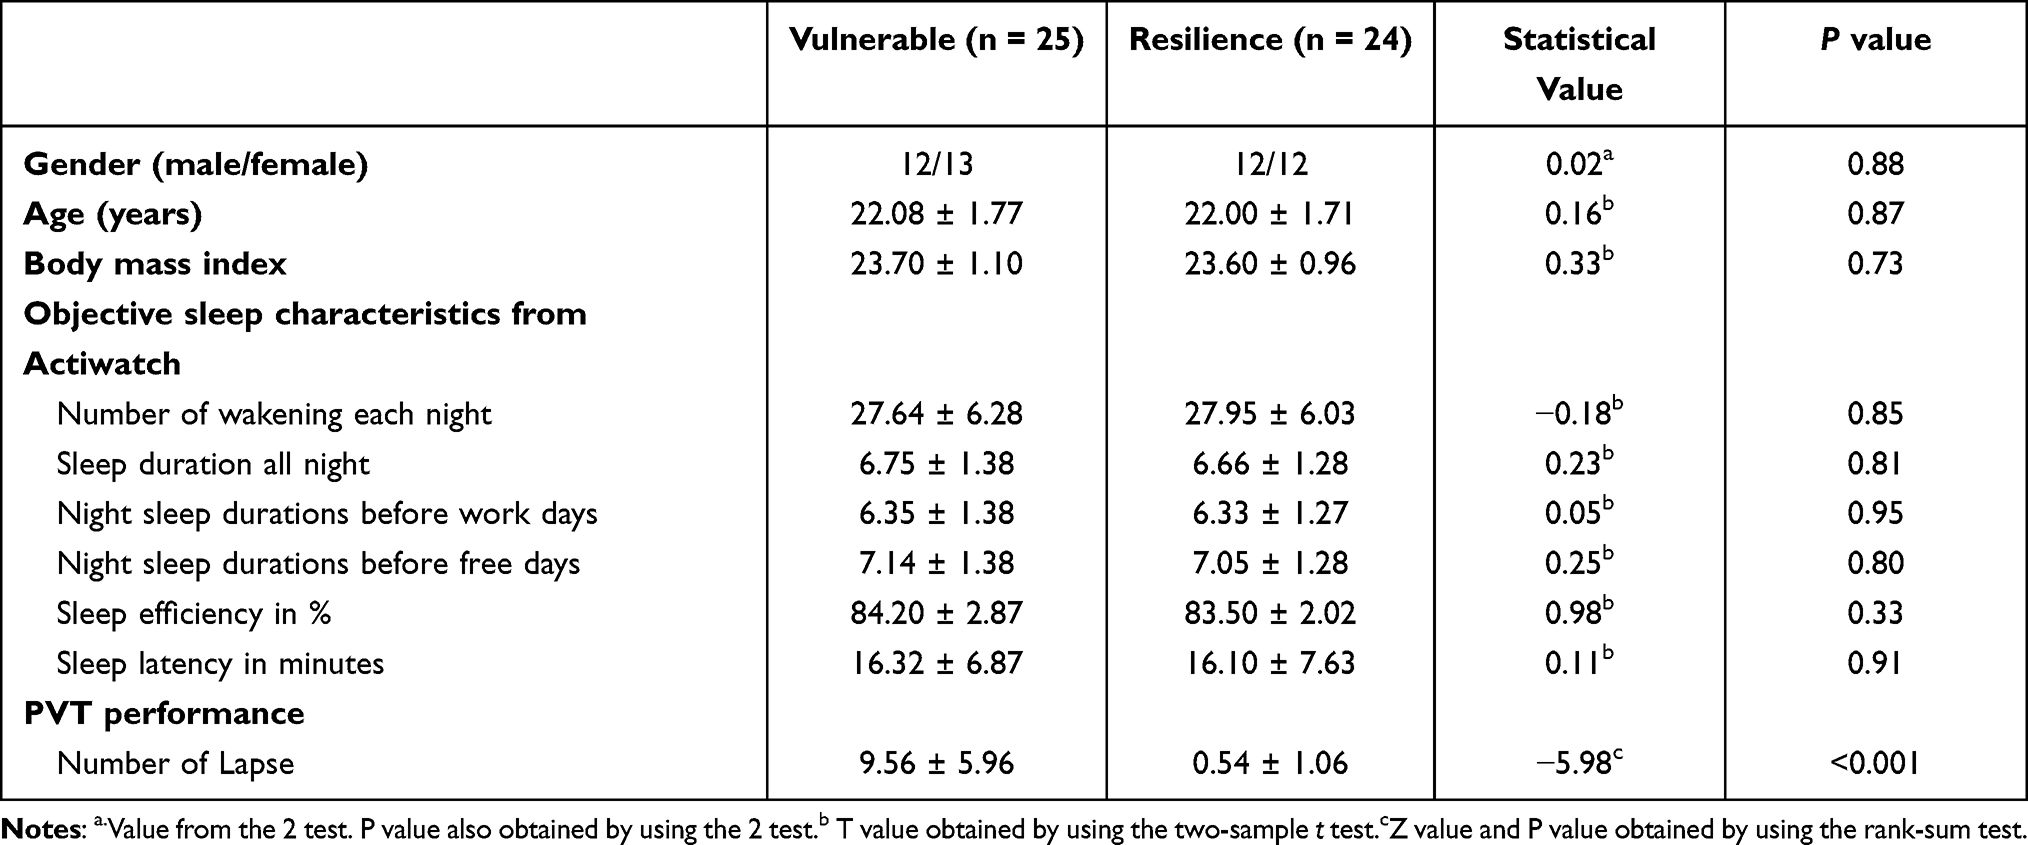 |
Table 1 Demographic Characteristics, Stanford Sleepiness Scale, and Objective Sleep Measures |
Classification Performance
The classification performance for different features using the total sample is presented in Table 2. By using the combined FA, MD, AD, and RD features, the LSVM classifier accurately discriminated SD-vulnerable from SD-resilient individuals. Specifically, the accuracy, sensitivity, specificity, PPV, and NPV were 83.67%, 87.50%, 80.00%, 86.96%, and 80.77%, respectively. The permutation tests showed that the true prediction accuracies were significantly higher than those obtained after random generation (P < 0.003) (Figure 2). The ROC analyses for the classification model based on combined features and single features are presented in Figure 3. The LSVM classifier using the combined features generated a larger AUC, indicating better classification performance. The permutation tests revealed that the true prediction AUC was significantly higher than that obtained through chance (P < 0.009) (Figure 2).
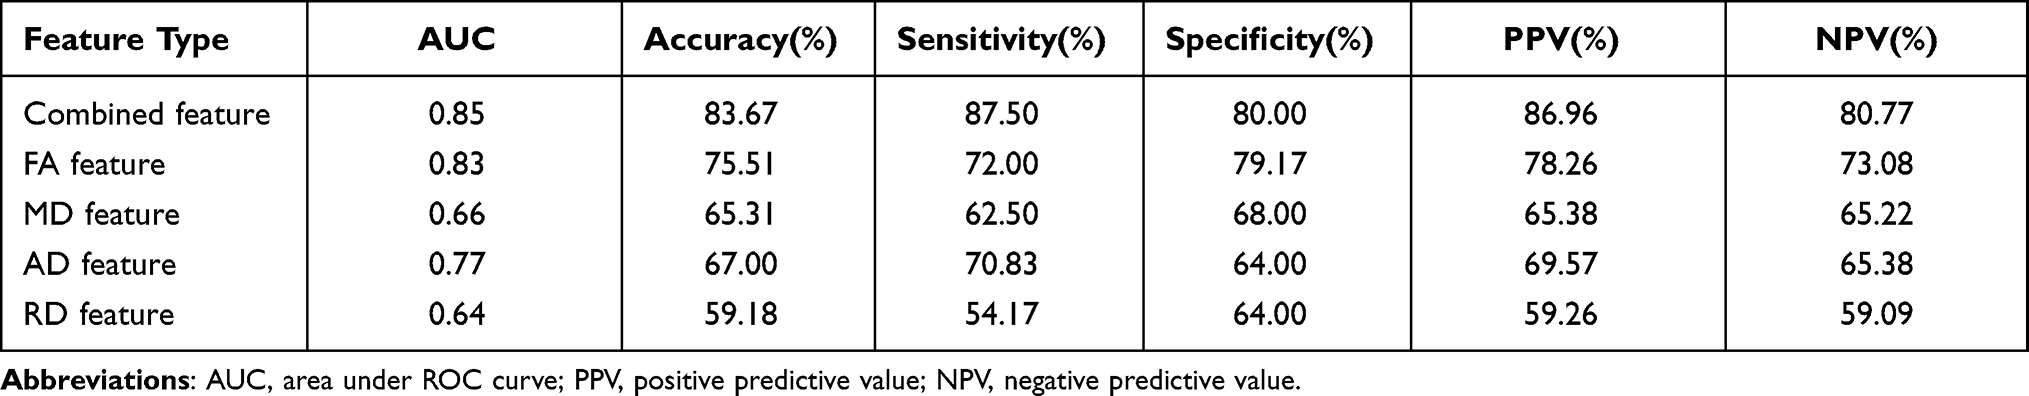 |
Table 2 Classification Performance of the LSVM Classifier Using Different Feature Types |
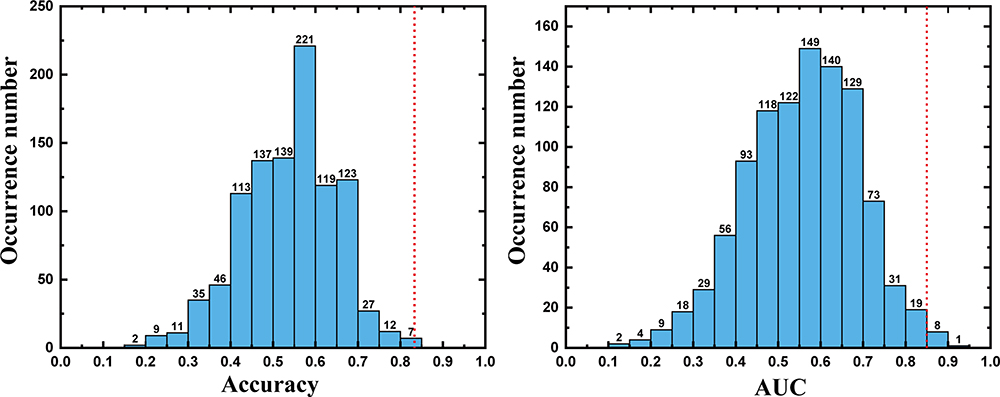 |
Figure 2 Two histograms depicting the accuracy and AUC permutation distributions for the classifier constructed using a combination of features. The values obtained using the real labels are indicated by the red dotted line. Abbreviation: AUC, area under the (receiver operating characteristic) curve. |
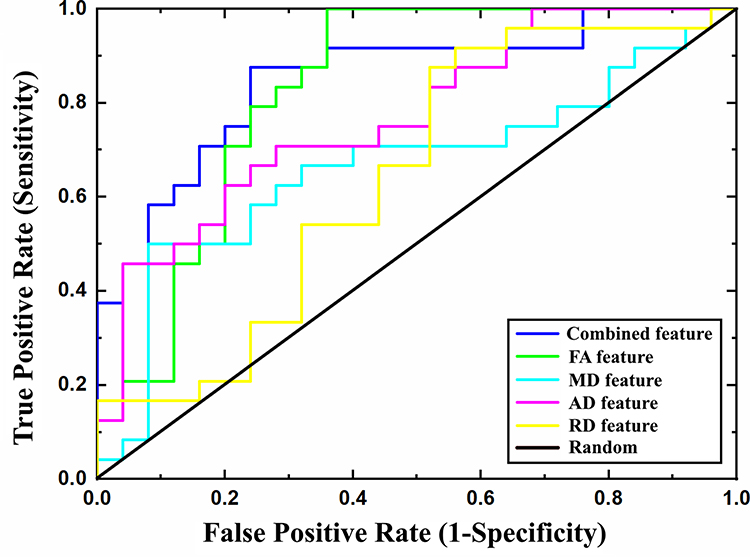 |
Figure 3 The ROC curves for classifiers constructed using different feature types. Abbreviation: ROC, receiver operating characteristic. |
To compare the classification performance for different features, we conducted a one-way analysis of variance (ANOVA) on the accuracy and AUC values obtained using the permutation tests. Post hoc analyses were conducted to further examine specific between-feature differences. The results showed significant differences in both accuracy and AUC among the classification models constructed using different features (FAUC = 11.43, P < 0.001, Faccuracy = 9.65, P < 0.001). Post hoc analysis revealed that accuracy and AUC were both significantly higher for the models with combined features (COMB) than the models with individual FA, AD, or RD features (COMB vs FA: Paccuracy < 0.001, PAUC < 0.001; COMB vs AD: Paccuracy < 0.001, PAUC < 0.001; COMB vs RD: Paccuracy < 0.001, PAUC < 0.001). A trend was also observed for the MD features (COMB vs MD: Paccuracy = 0.32, PAUC = 0.23). Detailed results of the post hoc analysis are shown in Supplementary Table 1.
Relationship Between LSVM Decision Value and PVT Performance
The decision value of the LSVM classifier for each participant is shown in Figure 4. The decision value was defined as the distance from the sample (ie, each participant) to the optimal separating hyperplane. Individuals with negative values were classified as SD-vulnerable, and individuals with positive values were classified as SD-resilient. Based on the proposed nested LOOCV strategy, five SD-vulnerable individuals were misidentified as SD-resilient, and 3 SD-resilient individuals were misidentified as SD-vulnerable. Correlation analysis showed that the decision values were significantly negatively correlated with PVT performance (r = −0.497, P < 0.001), which further supports the validity of the classification model.
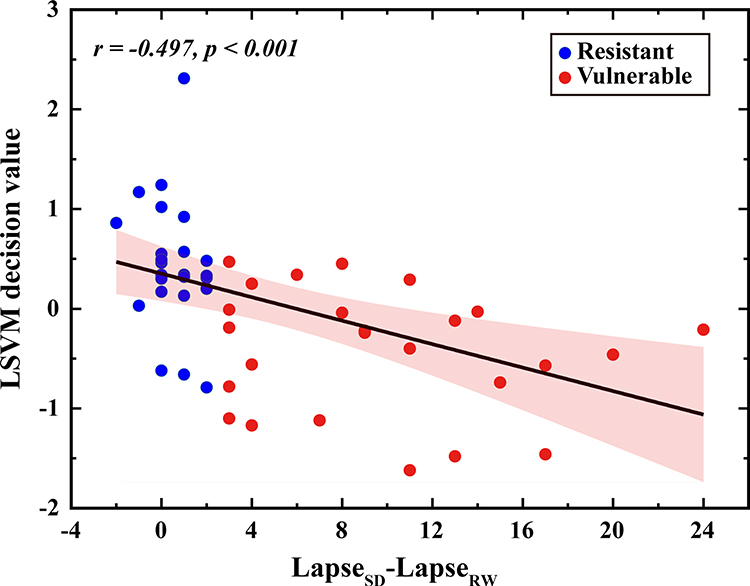 |
Figure 4 Correlation between the LSVM decision value and PVT performance. A significant negative correlation between the LSVM decision value and PVT performance was observed across all participants (r= −0.497, p<0.001). Here, individuals with negative values were classified as SD-vulnerable, and individuals with positive values were classified as SD-resilient. Abbreviations: LSVM, linear support vector machine; SD, sleep deprivation; RW, resting wakefulness. |
The Most Discriminative WM Tracts
The WM tracts that were most different (ie, most discriminative) between SD-vulnerable and SD-resilient individuals were selected using the proposed classification framework. Specifically, there were 27 discriminative WM features, including 8 FAs, 9 MDs, 6 ADs, and 4 RDs (Table 3). The WM regions that differed in FA features mainly included the left anterior limb of the internal capsule, left cingulum, left corticospinal tract, right superior corona radiata, right superior cerebellar peduncle, right tapetum, and middle cerebellar peduncle. The regions selected for the MD feature were located in the right cingulum, left superior fronto-occipital fasciculus, left anterior limb of internal capsule, right cingulum, right posterior corona radiata, right superior longitudinal fasciculus, genu of the corpus callosum, cerebellar peduncle, and the body of the fornix. The corresponding regions for the AD feature were the left genu of the corpus callosum, body of the corpus callosum, and the left superior longitudinal fasciculus. The discriminative RD features were derived from the right superior corona radiata, left superior fronto-occipital fasciculus, and right superior longitudinal fasciculus. We found that the discriminative features include the mean, standard deviation, skew, and kurtosis of the diffusion parameters of the corresponding WM regions, indicating existence of complementary information between different features’ distribution metrics. The discriminative WM regions are shown in Figure 5.
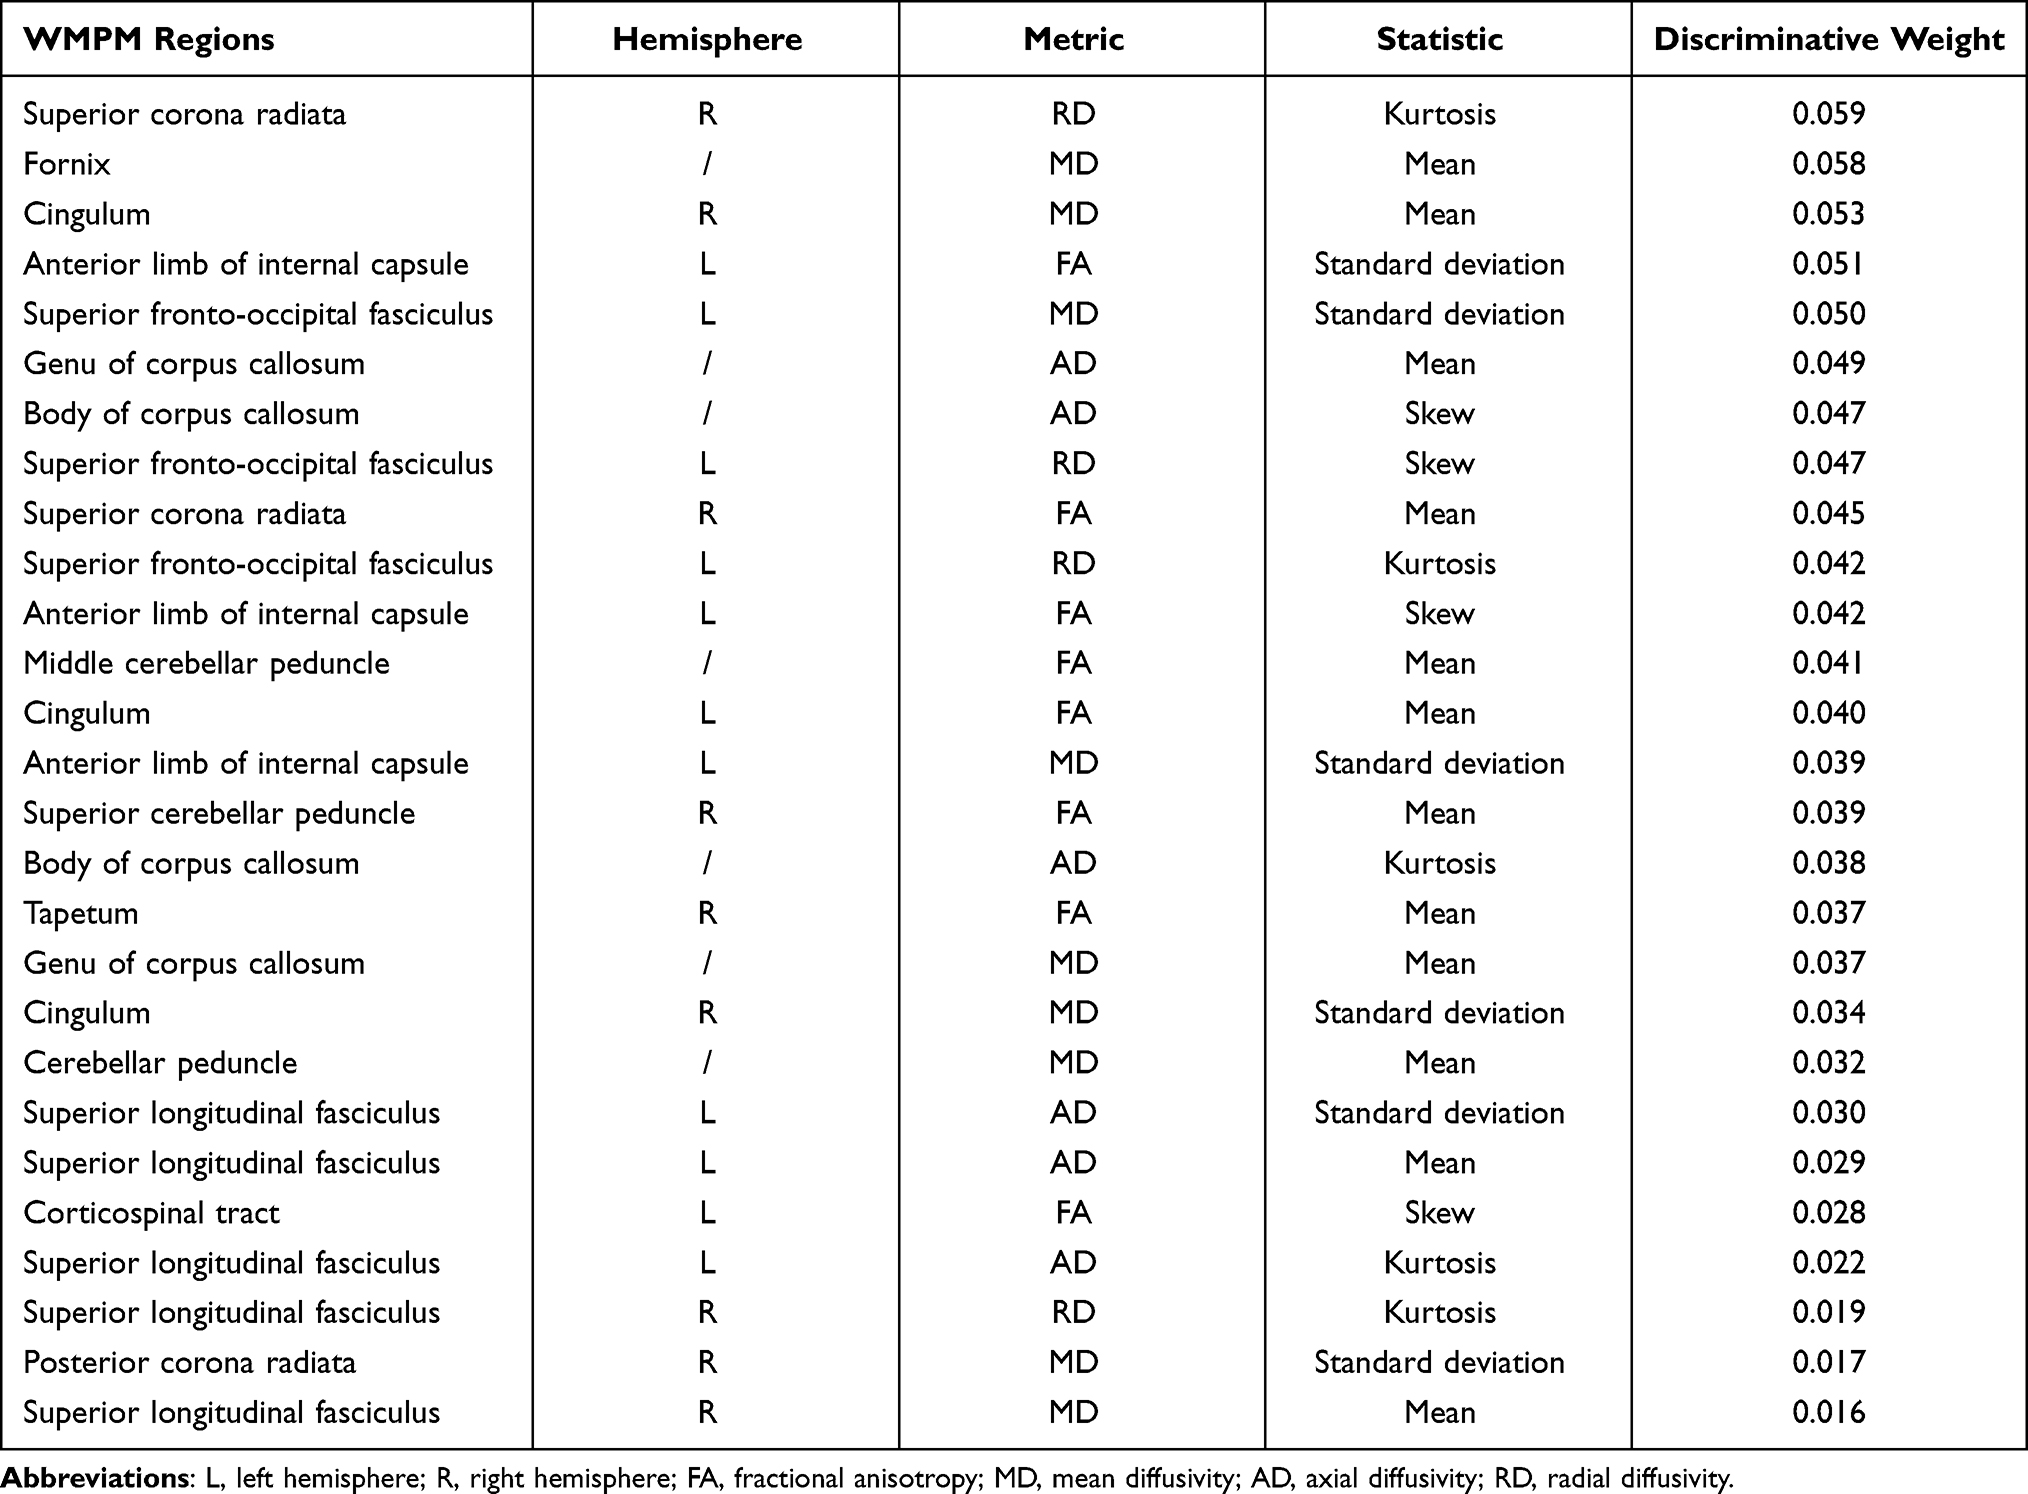 |
Table 3 The Selected Discriminative Features Using the Proposed Nested LOOCV Strategy |
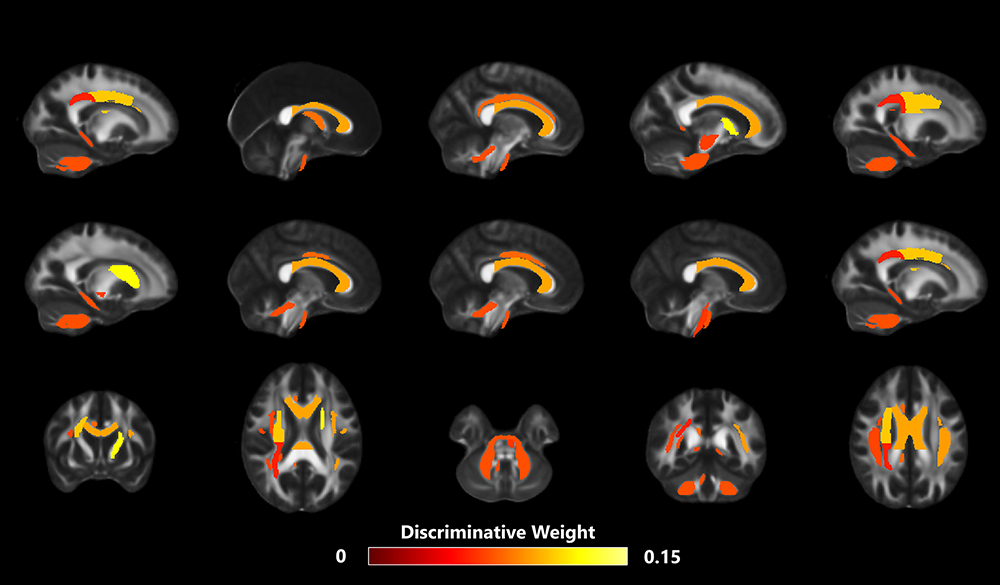 |
Figure 5 The discriminative WM tracts. To aid visualization, the image was thickened using the “tbss_fill” command. |
Discussion
Using WM metrics derived from diffusion tensor imaging and multivariate classification (LSVM), the current study found that combining FA, MD, AD and RD features from several WM tracts can predict vulnerability to SD with high accuracy. The WM tracts that showed the most discriminatory power were commissural pathways (superior longitudinal fasciculus), projection pathways (posterior corona radiata, anterior limb of internal capsule), and association pathways (body and genu of corpus callosum). The present study highlights the importance of WM in regulating cognitive instability after SD.
Rather than eliminating cognitive capability, SD affects cognitive performance by causing cognitive instability.47 After SD, cognitive instability manifests as increased number of attentional lapses. However, large inter-individual differences exist in SD-induced PVT lapses and substantial evidence indicates that this vulnerability to SD is stable within a given individual.8 Due to the 24/7 demands of contemporary society, a reliable biomarker that can be used to screen for SD-vulnerability is of great importance. Although a previous study tried to use baseline PVT measures with a drift-diffusion model to predict SD-vulnerability, classification accuracy was unsatisfactory (around 77%).48 Additionally, a recent study attempted to use imaging features derived from fMRI to predict SD-vulnerability. Accuracy was good enough, but resting-state fMRI is state-dependent and easily affected by head motion and preprocessing (such as with or without global signal regression).49 As SD-vulnerability is trait-like, intrinsic structural measures, such as the properties WM microstructure, might guarantee robust classification performance. Supporting this theory, we obtained 84% accuracy by combining FA, MD, AD, and RD measures and found a significant negative correlation between the change in PVT lapse number and the LSVM decision value.
Involvement of the FPN for attention has been consistently observed during sustained attention tasks. The first study that investigated the neural correlates of the PVT indicated that cortical activation within the dorsal attention network that encompasses the frontal and parietal regions is related to sustained attention performance.18 Another study by Chee et al further found that signal increases in frontal-parietal regions were lower in SD-vulnerable participants than in SD-resistant participants.9 These investigations have all suggested that the FPN helps regulate attentional lapses. FPN network connectivity was also associated with sleep disturbance in clinical populations. A recent study by Pini et al indicated that increased FPN connectivity were found in mild cognitive impairment (MCI) participants with high quality of sleep, positive coupling of connectivity between FPN network and default mode network (DMN) was also found in MCI reporting high quality of sleep.50 A large independent sample study by McKinnon et al found that MCI participants with nocturnal awakenings (defined by actigraphy) demonstrated reduced connectivity between temporal and parietal, and between temporal and temporal-parietal regions, compared with MCIs with intact sleep.51 Those studies implicated that distinct alterations in FPN and DMN functional connectivity are related with sleep disturbance in MCI. The superior longitudinal fasciculus (SLF) is an extensive longitudinal WM tract connecting the frontal and parietal lobes, which is divided into three branches: SLF I, SLF II, and SLF III.52 SLF I extends between the superior parietal lobe and the dorsal and medial parts of the frontal lobe, while SLF II connects the inferior parietal lobe to posterior portions of the middle frontal gyrus, and SLF III connects the inferior parietal lobe to the inferior frontal gyrus. All three segments of the SLF facilitate top-down control of behavior. The contribution of RD and MD features from the right SLF and AD from the left SLF to the classification model found in the current study indicates that efficient signal communication between frontal and parietal regions are likely necessary for better resistance to SD.
We further found that RD and FA of the superior corona radiata, MD of the posterior corona radiata, and FA of the anterior limb of internal capsule contributed to the accuracy of SD-vulnerable/resilient classification. The corona radiata is part of the thalamocortical circuitry and contains fibers (thalamic radiations) that mostly connect the prefrontal cortex to the thalamus.53 Additionally, the anterior limb of the internal capsule connects the prefrontal cortex with the thalamus.53 A broad review of previous studies has implicated the thalamus in regulating sustained attention, with increased thalamic activation frequently observed after SD.54 Consistent with our finding, a previous study found that patients who experienced strokes that were localized to the corona radiata and the internal capsule performed poorly on the PVT.55
Another important finding was that the AD for the body and genu of corpus callosum also contributed to the classification. The corpus callosum is the major WM tract connecting the left and right cerebral hemispheres and thus plays an important role in interhemispheric communication. Our previous study found that functional interhemispheric connectivity in increased after SD, which might reflect compensation for the detrimental effects of accumulating sleep debt.56 By increasing the number of imaging scans during the SD process, our recent study found a monotonically increased interhemispheric connection during SD.6 In line with these studies, the current study further verified the role that microstructural properties of the corpus callosum has in maintaining cognitive stability after SD.
The present study has several limitations. First, in the current study, participants were median-split into SD-resistant or SD-vulnerable group according to the number change of PVT lapse (SD-RW). This approach enabled us to build a model that predicts a binary outcome (resilient or vulnerable). However, it is of great importance to note that the vulnerability to sleep deprivation is actually continuous, and the decision to split the dataset by the median was arbitrary. The number of lapse change in the “most resistant” vulnerable subjects were similar to that in the “most vulnerable” resistant subjects, which influences the actual accuracy of the classification model. Second, we only calculated the number of lapses in two sessions (RW and SD), which can not rule out the effects brought by random variability in performance, future studies are needed to verify whether the obtained vulnerability was reproducible across multiple sessions. Third, the age distribution of participants recruited was relatively narrow and the sample size is relatively small, further studies with larger sample size and wider age range will be necessary to confirm the present results. Finally, we only used WM properties to build the discrimination model, the combination of other structural measures, such as cortical surface area or cortical thickness derived from high-resolution T1 images should be investigated in the future.
Conclusion
Our study demonstrated that microstructural properties derived from diffusion tensor imaging combined with cutting-edge machine algorithms have the potential to predict cognitive vulnerability to SD. Classification accuracy was driven primarily by (1) commissural fiber tracts within the frontal-parietal attention network, (2) projection fiber tracts linking the thalamus to the prefrontal cortex, and (3) association fiber tracts that facilitate interhemispheric communication.
Acknowledgments
We thank all volunteers for their participation in the study. This study was financially supported by the Major Project of Medicine Science and Technology of PLA (Grant No. AWS17J012), and the National Natural Science Foundation of China (81801772, 61806210, 82071917). We also thank Adam Phillips, PhD, from Liwen Bianji (Edanz) (www.liwenbianji.cn/) for editing the English text of a draft of this manuscript.
Disclosure
The authors report no conflicts of interest in relation to this work.
References
1. Xie L, Kang H, Xu Q, et al. Sleep drives metabolite clearance from the adult brain. science. 2013;342(6156):373–377. doi:10.1126/science.1241224
2. Tononi G, Cirelli C. Sleep and the price of plasticity: from synaptic and cellular homeostasis to memory consolidation and integration. Neuron. 2014;81:12–34. doi:10.1016/j.neuron.2013.12.025
3. Durmer JS, Dinges DF. Neurocognitive consequences of sleep deprivation. In: Seminars in neurology. New York: Copyright© 2005 by Thieme Medical Publishers Inc; 2005:117–129.
4. Chee MW, Chuah LY. Functional neuroimaging insights into how sleep and sleep deprivation affect memory and cognition. Curr Opin Neurol. 2008;21(4):417–423. doi:10.1097/WCO.0b013e3283052cf7
5. Shao Y, Wang L, Ye E, et al. Decreased thalamocortical functional connectivity after 36 hours of total sleep deprivation: evidence from resting state FMRI. PLoS One. 2013;8(10):e78830. doi:10.1371/journal.pone.0078830
6. Zhu Y, Ren F, Zhu Y, et al. Gradually increased interhemispheric functional connectivity during one night of sleep deprivation. Nat Sci Sleep. 2020;12:1067. doi:10.2147/NSS.S270009
7. Rupp TL, Wesensten NJ, Balkin TJ. Trait-like vulnerability to total and partial sleep loss. Sleep. 2012;35(8):1163. doi:10.5665/sleep.2010
8. Yamazaki EM, Goel N. Robust stability of trait-like vulnerability or resilience to common types of sleep deprivation in a large sample of adults. Sleep. 2020;43(6):zsz292. doi:10.1093/sleep/zsz292
9. Chee MW, Tan JC. Lapsing when sleep deprived: neural activation characteristics of resistant and vulnerable individuals. Neuroimage. 2010;51(2):835–843. doi:10.1016/j.neuroimage.2010.02.031
10. Yeo BT, Tandi J, Chee MW. Functional connectivity during rested wakefulness predicts vulnerability to sleep deprivation. Neuroimage. 2015;111:147–158. doi:10.1016/j.neuroimage.2015.02.018
11. Sanjari Moghaddam H, Mohammadi E, Dolatshahi M, et al. White matter microstructural abnormalities in primary insomnia: a systematic review of diffusion tensor imaging studies. Prog Neuropsychopharmacol Biol Psychiatry. 2021;105:110132. doi:10.1016/j.pnpbp.2020.110132
12. Cui J, Tkachenko O, Gogel H, et al. Microstructure of frontoparietal connections predicts individual resistance to sleep deprivation. NeuroImage. 2015;106:123–133. doi:10.1016/j.neuroimage.2014.11.035
13. Liu W, Zhang X, Qiao Y, et al. Functional connectivity combined with a machine learning algorithm can classify high-risk first-degree relatives of patients with schizophrenia and identify correlates of cognitive impairments. Front Neurosci. 2020;14. doi:10.3389/fnins.2020.577568.
14. Kaplan KA, Hardas PP, Redline S, Zeitzer JM, Group SHHSR. Correlates of sleep quality in midlife and beyond: a machine learning analysis. Sleep Med. 2017;34:162–167. doi:10.1016/j.sleep.2017.03.004
15. Zhu Y, Xi Y, Fei N, et al. Dynamics of cerebral responses to sustained attention performance during one night of sleep deprivation. J Sleep Res. 2018;27(2):184–196. doi:10.1111/jsr.12582
16. Zhu Y, Xi Y, Sun J, et al. Neural correlates of dynamic changes in working memory performance during one night of sleep deprivation. Hum Brain Mapp. 2019;40(11):3265–3278. doi:10.1002/hbm.24596
17. Van Dongen HP, Maislin G, Mullington JM, Dinges DF. The cumulative cost of additional wakefulness: dose-response effects on neurobehavioral functions and sleep physiology from chronic sleep restriction and total sleep deprivation. Sleep. 2003;26(2):117–126. doi:10.1093/sleep/26.2.117
18. Drummond SP, Bischoff-Grethe A, Dinges DF, Ayalon L, Mednick SC, Meloy MJ. The neural basis of the psychomotor vigilance task. Sleep. 2005;28:1059–1068.
19. Yuan K, Yu D, Bi Y, et al. The left dorsolateral prefrontal cortex and caudate pathway: new evidence for cue-induced craving of smokers. Hum Brain Mapp. 2017;38(9):4644–4656. doi:10.1002/hbm.23690
20. Behrens TE, Woolrich MW, Jenkinson M, et al. Characterization and propagation of uncertainty in diffusion-weighted MR imaging. Magn Reson Med. 2003;50(5):1077–1088. doi:10.1002/mrm.10609
21. Jenkinson M, Bannister P, Brady M, Smith S. Improved optimization for the robust and accurate linear registration and motion correction of brain images. NeuroImage. 2002;17(2):825–841. doi:10.1006/nimg.2002.1132
22. Leemans A, Jones DK. The B-matrix must be rotated when correcting for subject motion in DTI data. Magn Reson Med. 2009;61:1336–1349. doi:10.1002/mrm.21890
23. Smith SM. Fast robust automated brain extraction. Hum Brain Mapp. 2002;17(3):143–155. doi:10.1002/hbm.10062
24. Zhang H, Yushkevich PA, Alexander DC, Gee JC. Deformable registration of diffusion tensor MR images with explicit orientation optimization. Med Image Anal. 2006;10(5):764–785. doi:10.1016/j.media.2006.06.004
25. Zhang Y, Schuff N, Jahng GH, et al. Diffusion tensor imaging of cingulum fibers in mild cognitive impairment and Alzheimer disease. Neurology. 2007;68(1):13–19. doi:10.1212/01.wnl.0000250326.77323.01
26. Caan MW, Vliet V, Majoie CB, et al. Nonrigid point set matching of white matter tracts for diffusion tensor image analysis. IEEE Trans Biomed Eng. 2011;58(9):2431–2440. doi:10.1016/j.neuroimage.2008.07.009
27. Alexander DC, Pierpaoli C, Basser PJ, Gee JC. Spatial transformations of diffusion tensor magnetic resonance images. IEEE Trans Med Imaging. 2001;20(11):1131–1139. doi:10.1109/42.963816
28. Tustison NJ, Cook PA, Klein A, et al. Large-scale evaluation of ANTs and FreeSurfer cortical thickness measurements. NeuroImage. 2014;99:166–179. doi:10.1016/j.neuroimage.2014.05.044
29. Dean DC 3rd, Travers BG, Adluru N, et al. Investigating the microstructural correlation of white matter in autism spectrum disorder. Brain Connect. 2016;6(5):415–433. doi:10.1089/brain.2015.0385
30. Zhang S, Peng H, Dawe RJ, Arfanakis K. Enhanced ICBM diffusion tensor template of the human brain. NeuroImage. 2011;54(2):974–984. doi:10.1016/j.neuroimage.2010.09.008
31. Oishi K, Zilles K, Amunts K, et al. Human brain white matter atlas: identification and assignment of common anatomical structures in superficial white matter. NeuroImage. 2008;43:447–457.
32. Sun H, Chen Y, Huang Q, et al. Psychoradiologic utility of MR imaging for diagnosis of AttentionDeficit hyperactivity disorder: a radiomics analysis. Radiology. 2018;287(2):620–630. doi:10.1148/radiol.2017170226
33. Pereira F, Mitchell T, Botvinick M. Machine learning classifiers and fMRI: a tutorial overview. NeuroImage. 2009;45(1):S199–209. doi:10.1016/j.neuroimage.2008.11.007
34. Dai Z, Yan C, Wang Z, et al. Discriminative analysis of early Alzheimer’s disease using multi-modal imaging and multi-level characterization with multi-classifier (M3). NeuroImage. 2012;59:2187–2195. doi:10.1016/j.neuroimage.2011.10.003
35. Dosenbach NU, Nardos B, Cohen AL, et al. Prediction of individual brain maturity using fMRI. Sci. 2010;329:1358–1361. doi:10.1126/science.1194144
36. Chen Y, Lu BL, Hai Z. Parallel learning of large-scale multi-label classification problems with min-max modular LIBLINEAR. In:
37. Tibshirani R. Regression shrinkage and selection via the lasso: a retrospective. J R Stat Soc Series B Stat Methodol. 2011;73(3):273–282. doi:10.1111/j.1467-9868.2011.00771.x
38. Chang CC, Lin CJ. LIBSVM: a library for support vector machines. ACM Trans Intell Syst Technol. 2007;2(3):1–27. doi:10.1145/1961189.1961199
39. Ecker C, Marquand A, Mourão-Miranda J, et al. Describing the brain in autism in five dimensions–magnetic resonance imaging-assisted diagnosis of autism spectrum disorder using a multiparameter classification approach. J Neurosci. 2010;30(32):10612–10623. doi:10.1523/JNEUROSCI.5413-09.2010
40. Fawcett T. An introduction to ROC analysis. Pattern Recognit Lett. 2006;27(8):861–874. doi:10.1016/j.patrec.2005.10.010
41. Tian L, Ma L, Wang L. Alterations of functional connectivities from early to middle adulthood: clues from multivariate pattern analysis of resting-state fMRI data. NeuroImage. 2016;129:389–400. doi:10.1016/j.neuroimage.2016.01.039
42. Zeng LL, Shen H, Liu L, et al. Identifying major depression using whole-brain functional connectivity: a multivariate pattern analysis. Brain:J Neurol. 2012;135(5):1498–1507. doi:10.1093/brain/aws059
43. Golland P, Fischl B. Permutation tests for classification: towards statistical significance in image-based studies.
44. Ojala M, Garriga GC. Permutation tests for studying classifier performance. IEEE. 2009;11(6).
45. Cui Z, Xia Z, Su M, Shu H, Gong G. Disrupted white matter connectivity underlying developmental dyslexia: a machine learning approach. Hum Brain Mapp. 2016;37(4):1443–1458. doi:10.1002/hbm.23112
46. Mourão-Miranda J, Bokde AL, Born C, Hampel H, Stetter M. Classifying brain states and determining the discriminating activation patterns: support vector machine on functional MRI data. NeuroImage. 2005;28(4):980–995. doi:10.1016/j.neuroimage.2005.06.070
47. Doran SM, Van Dongen HP, Dinges DF. Sustained attention performance during sleep deprivation: evidence of state instability. Arch Ital Biol. 2001;139(3):253–267.
48. Patanaik A, Zagorodnov V, Kwoh CK, Chee MW. Predicting vulnerability to sleep deprivation using diffusion model parameters. J Sleep Res. 2014;23(5):576–584. doi:10.1111/jsr.12166
49. Xu Y, Yu P, Zheng J, et al. Classifying vulnerability to sleep deprivation using resting-state functional MRI graph theory metrics. Front Neurosci. 2021;15.
50. Pini L, Wennberg A, Mitolo M, et al. Quality of sleep predicts increased frontoparietal network connectivity in patients with mild cognitive impairment. Neurobiol Aging. 2020;95:205–213. doi:10.1016/j.neurobiolaging.2020.07.026
51. McKinnon AC, Lagopoulos J, Terpening Z, et al. Sleep disturbance in mild cognitive impairment is associated with alterations in the brain’s default mode network. Behav Neurosci. 2016;130(3):305–315. doi:10.1037/bne0000137
52. Luna FG, Lupiáñez J, Martín-Arévalo E. Microstructural white matter connectivity underlying the attentional networks system. Behav Brain Res. 2021;401:113079. doi:10.1016/j.bbr.2020.113079
53. Mori S, Oishi K, Jiang H, et al. Stereotaxic white matter atlas based on diffusion tensor imaging in an ICBM template. Neuroimage. 2008;40(2):570–582. doi:10.1016/j.neuroimage.2007.12.035
54. Muto V, Jaspar M, Meyer C, et al. Local modulation of human brain responses by circadian rhythmicity and sleep debt. Science. 2016;353:687–690. doi:10.1126/science.aad2993
55. Malik PR, Muir RT, Black SE, et al. Subcortical brain involvement is associated with impaired performance on the psychomotor vigilance task after minor stroke. Neurorehabil Neural Repair. 2018;32(11):999–1007. doi:10.1177/1545968318804415
56. Zhu Y, Feng Z, Xu J, et al. Increased interhemispheric resting-state functional connectivity after sleep deprivation: a resting-state fMRI study. Brain Imaging Behav. 2016;10(3):911–919. doi:10.1007/s11682-015-9490-5
 © 2022 The Author(s). This work is published and licensed by Dove Medical Press Limited. The full terms of this license are available at https://www.dovepress.com/terms.php and incorporate the Creative Commons Attribution - Non Commercial (unported, v3.0) License.
By accessing the work you hereby accept the Terms. Non-commercial uses of the work are permitted without any further permission from Dove Medical Press Limited, provided the work is properly attributed. For permission for commercial use of this work, please see paragraphs 4.2 and 5 of our Terms.
© 2022 The Author(s). This work is published and licensed by Dove Medical Press Limited. The full terms of this license are available at https://www.dovepress.com/terms.php and incorporate the Creative Commons Attribution - Non Commercial (unported, v3.0) License.
By accessing the work you hereby accept the Terms. Non-commercial uses of the work are permitted without any further permission from Dove Medical Press Limited, provided the work is properly attributed. For permission for commercial use of this work, please see paragraphs 4.2 and 5 of our Terms.