")
Back to Journals » Drug Design, Development and Therapy » Volume 16
Preclinical Pharmacokinetics, Tissue Distribution and in vitro Metabolism of FHND6091, a Novel Oral Proteasome Inhibitor
Authors Yang X, Liu A, Yang L, Wen T, Wang J, Shi J, Zhou H, Chen Z, Lei M, Zhu Y
Received 28 April 2022
Accepted for publication 5 August 2022
Published 13 September 2022 Volume 2022:16 Pages 3087—3107
DOI https://doi.org/10.2147/DDDT.S371020
Checked for plagiarism Yes
Review by Single anonymous peer review
Peer reviewer comments 3
Editor who approved publication: Professor Anastasios Lymperopoulos
Xu Yang,1 Amin Liu,1 Lin Yang,1 Tiantian Wen,2 Jia Wang,3 Jingmiao Shi,3 Hui Zhou,2 Zhimeng Chen,1 Meng Lei,1 Yongqiang Zhu2
1College of Science, Nanjing Forestry University, Nanjing, People’s Republic of China; 2College of Life Science, Nanjing Normal University, Nanjing, People’s Republic of China; 3Jiangsu Chia Tai Fenghai Pharmaceutical Co. Ltd, Nanjing, People’s Republic of China
Correspondence: Meng Lei; Yongqiang Zhu, Tel +86 25 85427621 ; +86 25 85891591, Email [email protected]; [email protected]
Introduction: FHND6091, a novel N-capped dipeptidyl boronic acid proteasome inhibitor with promising pharmacological properties, entirely converted into active form FHND6081 under physiological conditions. The proteasome, a key component of the ubiquitin-proteasome pathway (UPP), has emerged as a validated target of multiple myeloma (MM) therapeutics. FHND6091 is a selective oral proteasome inhibitor that binds irreversibly to the β 5 submit of the 20S proteasome and exerts anti-cancer roles.
Methods: In this study, we investigated the metabolic stability, metabolite production, metabolic pathways and plasma protein binding (PPB) of FHND6081 along with its absorption, tissue distribution, excretion (ADME) and pharmacokinetics (PK) in animals.
Results: Ultra-high performance liquid chromatography-tandem quadrupole time-of-flight mass spectrometry (UPLC-Q-TOF/MS) identified a total of nine new metabolites after co-incubation with FHND6091 in hepatocytes from different species. A hypothetical CYP450-metabolic pathway including dehydrogenation, N-dealkylation plus mono-oxygenation and other was proposed. In addition, FHND6081 was highly bound to plasma proteins (> 99%); nevertheless, it preferred to partition to red blood cells (B/P ratio: 4.91). The results of microsomal metabolic stability corroborated that FHND6081 was a moderate-clearance compound. In Caco-2 cell experiments, the compound displayed modest permeability suggesting that it may show limited bioavailability via oral routes. Furthermore, FHND6081 was extensively distributed in rats and the highest exposure was achieved in the stomach followed by the small intestine and adrenal gland. Pharmacokinetic studies were done by using Sprague-Dawley (SD) rats, oral absorption was fast and plasma exposure was dose-dependent and oral bioavailability were low. At the same dose, FHND6081 exposure was severalfold higher in whole blood than in plasma, which was consistent with blood cell partitioning. Moreover, only a small fraction of the parent compound was excreted via feces and urine and oxidative metabolites were detected in feces and plasma.
Conclusion: The overall preclinical pharmacokinetic profile supported the selection and development of FHND6091 as a clinical candidate.
Keywords: FHND6091, active form FHND6081, proteasome inhibitor, preclinical pharmacokinetics, tissue distribution, drug-availability
Introduction
Multiple myeloma (MM) is a hematological malignancy characterized by aberrant proliferation of malignant plasma cells, and it has a broad spectrum of genetic and clinical features.1,2 The incidence of MM is 3 per 100,000, accounting for 1.8% of all new cancer cases. MM is mainly diagnosed in the elderly, with a median age of 65 years.3 So far, MM is still a chemotherapy-refractory disease and most patients suffer from a repeating pattern of remission and relapse during treatment for the heterogeneity, genome instability, and interactions between MM cells and components of the bone marrow microenvironment (BMME). Developing new anti-MM agents with high efficiency and no recurrence has always been the goal and the challenge for us. In the past few decades, the marketing of some new drugs, such as immunoregulatory drugs (IMiDs), proteasome inhibitors (PIs), and histone deacetylase inhibitors (HDACi) have significantly prolonged the survival of MM patients and reduced the risk of the relapse. The breakthroughs have brought great news and hopes to MM patients and among them, proteasome inhibition has emerged as a prominent therapeutic strategy in the treatment of MM.4
The proteasome as a multicatalytic proteinase complex, which widely exists in the nucleus and cytosol of all eukaryotic cells, plays an important role in the ubiquitin-protein pathway (UPP).5 The UPP was discovered a key way to degrade the proteins in the cells and regulate the antigen presentation, cell cycle, NF-kB metabolic, and so on, which maintains intracellular homeostasis via covalent linkage of ubiquitin molecules to protein substrates. The ubiquitination is divided into 3 steps regulated by (1) the ubiquitin-activating enzymes (E1s), (2) the ubiquitin-conjugating enzymes (E2s), and (3) the ubiquitin ligases (E3s), including E1 activates ubiquitin, E2 accepts the transfer of activated ubiquitin, and E3 selectively recognizes the substrate proteins.6 Abnormal UPP is closely related to many diseases, such as genetic or autoimmune diseases, inflammation, tumors and others.7 In malignant cells, UPP is frequently over-expressed due to the overloaded degradation requirement caused by a plethora of misfolded proteins. Previous preclinical studies have indicated cancer cells relied heavily on the proteasome to meet the demand for turnover and were therefore more sensitive to proteasome inhibition than normal cells.8 Hence, the proteasome has become a promising target for the treatment of various types of cancer.
The marketed PIs (Figure 1), while potent antitumor activity is exerted, they have dose-related toxicities, such as neurotoxicity, thrombocytopenia, neutropenia, and cardiotoxicity.9–11 The new compound FHND6091 developed in our group brought us great confidence and strength in therapeutic application and satisfactory safety profile for its excellent physical properties, high selectivity and irreversibility to β5 of the 20S proteasome, and so on.12,13 FHND6091 is an N-capped dipeptidyl boronic acid, which can undergo hydrolysis in aqueous solutions and 100% convert to active form FHND6081. Hui Zhou et al showed that FHND6081 resulted in the accumulation of ubiquitinated proteins, which led to G2/M phase arrest, downregulation of NF-κB expression, apoptosis via ER stress-dependent and mitochondrial-mediated pathways, and ultimately caused tumor cell death. FHND6081 showed more selective inhibition to proteasome catalytic subunits and fewer off-target effect than bortezomib in vitro. In contrast to Ixazomib, FHND6081 exhibits improved antitumor activity and lower application dosage. However, the pharmacokinetics of FHND6091 still remain unknown. Here the drug-availability from the ADME properties of FHND6091 were investigated: oral (PO) and intravenous (IV) pharmacokinetic disposition, microsomal stability, tissue distribution as well as the hepatocytes metabolism among various species. The plasma protein binding and permeability of FHND6081 were also be assessed by using in vitro models. Recently, the IND of FHND6091 was approved by the National Medical Products Administration (NMPA) and clinical trials are being carried out in several hospitals.
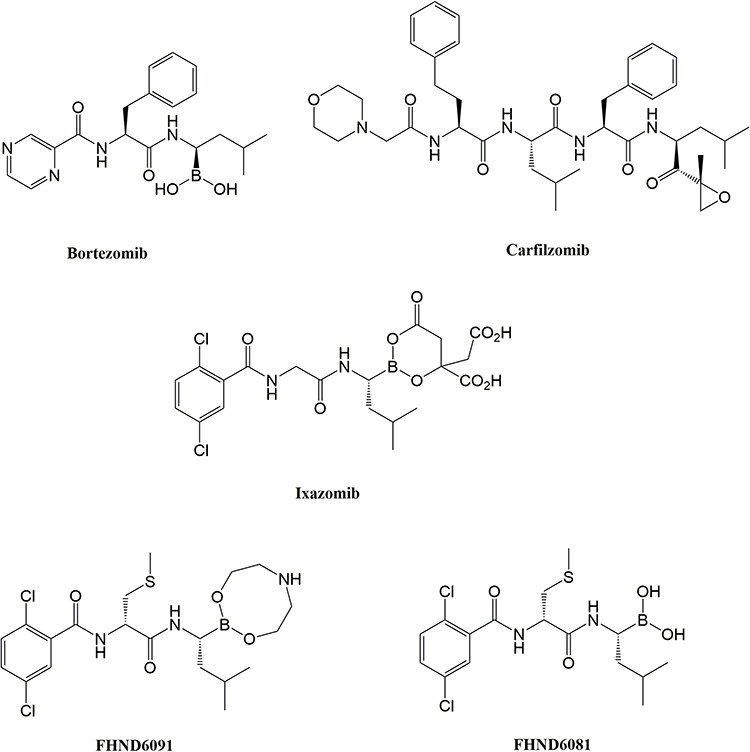 |
Figure 1 Chemical structures of proteasome inhibitors. |
Materials and Methods
Chemicals and Reagents
FHND6091 was prepared by Jiangsu Chia Tai Fenghai Pharm. Co. LTD and hydrolyzed immediately to the biologically active form FHND6081 on exposure to aqueous solutions or plasma. The internal standard 4-Hydroxy mephenytoin (MP) was purchased from Toronto Research Chemicals, Inc (Toronto, Canada). Acyclovir (purity, 99%), Minoxidil (purity, 99%) and GF120918 (purity, 99%) were purchased from Dalian Meilun biotechnology Co., Ltd, whereas digoxin (purity, 98%) was purchased from MCE Technologies, USA. All compounds were stored at −20°C. HPLC grade ammonium acetate and acetonitrile were purchased from Merck, Germany.
Drug Preparation Before Administration
A certain amount of FHND6091 was weighed and dispersed in 5% sulfobutyl ether β-cyclodextrin solution, and then the mixture was stirred well for complete homogenization. The pH of solution was adjusted to 8.0–8.2 using 1N sodium hydroxide. The prepared solution was wrapped with aluminum foil and kept at room temperature. Formulations were prepared freshly before dosing.
Permeability Assay Using Caco-2 Cells
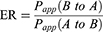
Caco-2 cells were obtained from the ATCC and cultured according to the specific media requirements. Cells were seeded at a density of 4×10⁴ cells/well in 24-well plates (0.3 cm2, 1 µm pore size—Shanghai Titan, China) and grown for 21–23 days. Lucifer yellow (LY), a fluorescent paracellular permeability marker, was conducted to the integrity of Caco-2 monolayers. DMEM was removed and the cell monolayer was washed once with Hank’s balanced salt solution (pH 7.4) to remove residual media. In the AP-BL direction studies, 0.2 mL of HBSS containing FHND6091 (2, 10 and 50 µM), Acyclovir (10 µM), Minoxidil (10 µM), P-gp substrate (10 µM Digoxin), or mixture (10 µM Digoxin + 10 µM GF120918; 10.0 µM FHND6091 + 10.0 µM GF120918) were added to the AP side; In the BL-AP direction studies, 1.2 mL of HBSS containing different compounds (as above) were added to the BL side. Then, the plates were incubated at 37°C for 120 min. Samples (0.15 mL) were taken from the receiving side and equal volume acetonitrile was added, which were stored at −80°C. The concentrations of samples were analyzed by LC-MS/MS. The apparent permeability (Papp, cm/s), efflux ratio (ER) were calculated for drug transport assay according to the following equations: (2) and (3)
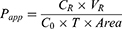
Where VR is the solution volume in the receiver chamber; Area is the surface area of the cell monolayer, ie, 0.3 cm2; T is incubation time, which is 7200 s; C0 is initial concentration in the donor chamber; CR is final concentration in the receiver chamber.
Pharmacokinetics of FHND6081 in Rats
Sprague Dawley (SD) rats, weighing 200–260 g, were purchased from Shanghai Xi Puer-Bikai Experimental Animal Co., Ltd, which were randomly divided into four groups with six animals per group. All the rats were raised under standard animal feeding condition. The experimental protocol was approved by the Institutional Animal Care and Use Committee of Nanjing Normal University. All animal experiments were performed in strict compliance with the guidelines of the Animal Welfare Council of China. One group was for intravenous (IV) dosing (0.15 mg/kg), and the other three groups of rats received three doses of FHND6091: 0.15 mg/kg, 0.30 mg/kg and 0.60 mg/kg as low, medium and high dose by single oral gavage. The animals were fasted overnight before drug administration and food was returned at 4 h post-dosing.
During experiments, all rats were awake and un-anaesthetized. Serial plasma and whole blood samples were collected from the orbital venous plexus (0.2 mL) at 0 min, 5 min, 15 min, 30 min, 1 h, 2 h, 4 h, 6 h, 8 h, 10 h, 24 h. Several additional blood collection points (48, 72, 96, 120, 144, 168 h) for whole blood samples prolonged up to 168h. And 0.5% of formic acid/acetonitrile (v/v) was prepared in advance and sealed for preservation. All blood samples were placed in labeled centrifuge tubes containing EDTA-K2. Whole-blood samples and 0.5% of formic acid/acetonitrile were mixed according to the ratio of 50 µL: 100 µL per well in a clean EP tube. The remaining blood samples were separated into plasma and blood cells by centrifugation (11,000 rpm, 4°C, 5 min). Seventy microliters of plasma were accurately drawn to 1.5mL of EP tube, 140 µL of 0.5% formic acid/acetonitrile was added, then vortex for 15s. All samples were stored at −70 °C.
Plasma and Whole Blood Sample Preparation for LC-MS/MS Analysis
A series of standards and test samples were prepared by protein precipitation. 100 µL of blank rat plasma or whole blood was taken in EP tubes, 200 µL acetonitrile containing 0.5% formic acid was added, centrifuged at 3900 rpm for 10 min at 4°C. The supernatant was collected as a plasma (or whole blood) substrate. Accurately weighed an appropriate amount of FHND6091 (solid powder) into a brown glass bottle, added methanol to dissolve and diluted to the mark. The above solution was diluted to different concentrations with acetonitrile/water/formic acid (50: 50: 0.5, v/v/v), from which 10 µL was extracted and placed in new EP tubes, and 190 µL blank plasma/whole blood substrate was added to obtain standard series samples with concentrations of 0.3, 0.6, 4, 20, 60, 120, 160 and 200 ng/mL. Plasma or whole blood samples (50 µL) were added with 225 µL of acetonitrile/water/formic acid (50: 50: 0.5, v/v/v), 25 µL internal standard solution and the mixture was shaken by vortex for 10 min. From this, 10 µL were taken for LC-MS/MS analysis.
LC-MS/MS Instrumentation and Conditions
A newly constructed method was adopted for the determination of FHND6081 concentrations, 4-Hydroxy mephenytoin (MP) was used as IS at 200 ng/mL. Analyses were carried out using a Shimadzu Nexera X2 UHPLC system (Columbia, USA) and coupled with a Sciex Triple Quadrupole 5500 mass spectrometer (Framingham, MA, USA) at 40°C. A binary solvent system: Solvent A – 2 mM ammonium acetate aqueous solution and Solvent B – acetonitrile was employed at a flow rate of 1.0 mL/min. When between 0.6 and 1.8 min, flow rate was adjusted to 0.7 mL/min. Ten microliters of the sample were injected, and all samples were analyzed using isocratic elution: 18% A and 82% B. Data acquisition for FHND6081 and IS was performed by electrospray ionization (ESI) using multiple reaction monitoring (MRM) operated in negative ion mode. The transitions of m/z 419.1→353.1 for FHND6081 and m/z 233.1→190.1 for MP were selected for the final MRM method based on intensity.
Standard Curve and Quality Control Samples Preparation
The 100 µL blank rat plasma was achieved from the blood of healthy SD rats and placed in the EP tube, 200 µL acetonitrile containing 0.5% formic acid was added, and centrifuged for 10 min at 3900 rpm at 4°C. The supernatant was taken to obtain plasma matrix samples. Whole blood was processed as described previously.
A certain amount of FHND6091 powder was accurately weighed, and dissolved with methanol, then 1 mg/mL stock solution was prepared, which was shaken and mixed evenly. The prepared stock solution was absorbed and next diluted with methanol/formic acid solution (methanol: water: formic acid = 50:50:0.5) to obtain a working solution with a concentration of 30.0 µg/mL. Precisely took an appropriate amount of the working solution, and successively diluted it with methanol/formic acid solution and blank plasma matrix to the standard curve (200, 160, 120, 60, 20, 4, 0.6 and 0.3 ng/mL.) of plasma matrix samples of FHND6081. The whole blood standard samples were prepared in the same way as plasma. The preparation procedure of the quality control samples was consistent with the standard curve samples, and finally, the concentration of QC samples was 0.3, 0.9, 8, 80 and 150 ng/mL.
Method Validation
Specificity
Six blank matrices from different rats, blank matrix spiked with the analytes (LLOQ) and IS were analyzed to verify the specificity of the established method. The study was made to ensure that were no potential components to disturb the analysis of FHND6081.
Linearity
In order to detect the method linearity, three replicates with eight above-mentioned concentrations levels of FHND6081 were analyzed. The linearity of each calibration curve was determined by plotting the peak area ratio (y) of the analyte/IS vs nominal concentration of the analyte (x). The calibration curves were constructed using concentrations of 0.3–200 ng/mL by the weighted (1/x2) least-squares linear regression.
Intra-Assay and Inter-Assay Accuracy and Precision
Accuracy and precision were determined for both intra- and inter-batch QC samples. Intra-batch accuracy and precision were determined by analyzing six replicates within the same batch for all the five QC samples. Inter-batch accuracy and precision was determined by analyzing six replicates (from each batch) of QC samples of three different batches. The percent coefficient of variation (% CV) of the assay was assessed to determine precision and it should be <15% in all cases except at LLOQ. Accuracy was determined by comparing the mean value with the actual value and it should be ± 15% of the actual value except at LLOQ, where it should not exceed ± 20% of the actual value.
Matrix Effect
Matrix effect (ME) was the ratio between the peak area of the analytes in blank samples and that in neat solution. The peak area (A) was obtained by determining the six different blank matrices spiked with the mixed QC samples of the analyte’s concentrations at 0.9, 150 ng/mL. The plasma (or whole blood) was replaced by a pure solution of acetonitrile (1:2, v/v) containing 0.5% formic acid, by the same procedure, the peak area (B) was achieved by adding the same concentrations of QC samples. The ME of the MP (IS) was also assessed at the working concentration (200 ng/mL) by the same procedure. ME was calculated by A/B × 100% and assessed with an IS-normalized matrix factor. The CV% of the normalized matrix factor should be within 15%.
Stability
Stability studies were carried out for low and high QC samples as long-term and short-term stability, freeze-thaw stability. Long-term and short-term stability were determined by keeping the samples at −80°C for 63 days and at room temperature for 41 h. Freeze-thaw stability was assessed by storing the samples at −80°C for 12 h and then thawing at room temperature. After such four freeze-thaw cycles the stability was determined.
Plasma Protein Binding Assay
The plasma protein binding (PPB) of FHND6081 was conducted with the Rapid Equilibrium Dialysis (RED) in rat, dog and human plasma.14 Plasma samples from SD rats, beagle dogs and humans were purchased from BioreclamationIVT. FHND6091 was added to plasma and vortexed well to a final concentration of 20, 60, and 200 ng/mL. Aliquots of spiked plasma were added to the donor (red) side, followed by addition of PBS (pH 7.4) to the receiver (white) side, and then incubated in a 37°C CO2 incubator for 4 h. Samples collected from both chambers were analyzed with LC-MS/MS to determine the compound concentrations. PPB was calculated by the equation (1):
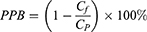
where Cf and Cp are FHND6081 concentrations in the dialysate and plasma, respectively. The experiments were performed in triplicate. The lower limit of quantitation (LLOQ) was 1.0 ng/mL.
Tissue Exposure Measurements in Rats
In this analysis, thirty SD rats were divided equally into five groups. FHND6091 was administered to rats by oral gavage (0.6 mg/kg). Samples were collected at 0 min, 5 min, 1 h, 4 h and 24 h after oral drug administration. Rats were euthanized by CO2 inhalation and about 1 mL of blood was collected by intracardiac puncture. EDTA-K2 was added into the blood samples for anticoagulation and stored on ice. Then, plasma, whole blood and multiple tissues were harvested. The tissues were rinsed with normal saline and blotted dry with filter paper. Tissue homogenate was prepared through a high-speed homogenizer. The whole blood and plasma samples treatment is consistent with the above method. The concentrations of FHND6081 in the plasma, whole blood, tissue homogenate was measured with a validated LC-MS/MS assay. The blood cell partitioning of FHND6081 was determined in whole blood at 24 h. The blood-to-plasma concentration ratio (Cb/Cp) was calculated by dividing the concentration in the plasma with the concentration in the whole blood.
Microsomal Stability Assay
The liver microsomal stability assay of FHND6081 was estimated using pooled human, monkey, dog, rat and mouse microsomes (human: Corning Inc; monkey, dog, rat, mouse: Research Institute for Liver Diseases Co. Ltd (Shanghai, China)). Incubation volumes were 100 µL including 3 µM test compound with 0.20 mg/mL microsomal protein in 100 mM phosphate-buffered saline, pH 7.4. The reaction was initiated by adding NADPH (1 mM final concentration) and performed at 37°C in a water bath. Each group was separately added an equal volume of ice-cold acetonitrile to stop the reaction and precipitate proteins at 0, 5, 15, 30 and 60 min. The corresponding species of heat-inactivated microsomes served as negative control groups and incubation time was 0, 15, 60 min, respectively. At the end of the assay, the remaining content of FHND6081 was tested by LC-MS/MS.
The slope of the linear regression of ln (% remaining) with incubation time (−k) was used to calculate the t1/2 value according to the following equation (4). The intrinsic clearance (CLint) of FHND6081 in various species was estimated from the microsomal data using the equation: (5). The microsomal protein per gram of liver tissue was 48.8, 45, 77.9, 44.8 and 45 mg/g for human, monkey, dog, rat and mouse respectively. The liver tissue per kilogram of body weight was 25.7, 32.5, 32, 40 and 87.5 g/kg for all species.


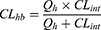
The in vivo hepatic clearance of FHND6081 in diverse species was predicted by the “well-stirred” model shown in equation (6), where Qh is the hepatic flow, CLint is the intrinsic clearance determined using equation (5).
Hepatocyte Incubations and Metabolite Identification
Human and monkey primary hepatocytes were purchased from XenoTech (KS, USA), and beagle dog, SD rat and CD-1 mouse primary hepatocytes were obtained from Biopredic International (BPI, Rennes, France). Cultures in suspension were performed according to the manufacturer's protocol. Cell viability was verified under a microscope by trypan blue exclusion. During the experiment, William’s E Medium (pH 7.4) was used as the medium. Approximately 1.0 × 10⁶ hepatocytes were incubated with 3 µM FHND6091 for 3 h. Reactions were terminated with an equal volume of ice-cold acetonitrile. All samples are prepared in duplicate. For pretreatment of the samples, a total of 160 µL of solution from each sample was used. Samples in duplicate were mixed, 350 µL of the mixed sample was taken, 200 µL of acetonitrile was added and vortexed for 1 min. The samples were vortexed and centrifuged for 5 min at 14,000 rpm; the supernatant was placed in a 10 mL centrifuge tube and then dried under a stream of nitrogen gas at 40°C. Finally, the residue was dissolved with 150 µL aqueous acetonitrile (acetonitrile: water (1:9, v/v)) and then centrifuged for 5 min at 14,000 rpm and 4°C. And 7 µL of supernatant was injected for UPLC-UV/Q-TOF MS analysis. Detailed model specification and parameters of the instrument were presented in the Supplementary Materials and Methods. Data acquisition was controlled via Sciex Analyst TF 1.8 software. Metabolite identification was done by MetabolitePilot Software.
Excretion Study
A single dose of FHND6091 (0.30 mg/kg) was orally administered to intact and bile duct-cannulated SD rats (six of each species, half male and half female) which were housed in separate metabolic cages. Before administration, rats were fasted for 12 h with access to water freely. Urine and fecal samples were collected from 0 to 4, 4 to 8, 8 to 24, 24 to 48, 48 to 72, and 72 to 96 h, and bile samples were collected prior and after the administration (from 0 to 4, 4 to 8, 8 to 24 and 24 to 48 h). The weight of feces and the volume of the urine samples were measured, after which all samples were stored at −70°C until further analyzed.
Fecal samples were transferred to a 2 mL EP tube and mixture of methanol/formic acid solution (methanol: water: formic acid = 50:50:0.5) was added to each tube. The suspension was stirred and ultrasonically treated for 30 min. Subsequently, fecal homogenate was taken and then added internal standard solution (200 ng/mL MP) and acetonitrile: formic acid (100:0.5, V/V). The mixture was vortexed and centrifuged, and then the supernatant was removed and solution (acetonitrile/water/formic acid at 80:20:0.4, v/v/v) was added. Subsequently, treated fecal samples were supplied for the LC-MS/MS analysis, along with urine and bile samples (the subsequent processing is consistent with the above method). Metabolite profiling and identification Metabolite profiling and identification was conducted for the plasma, urine, bile, and feces using UPLC-UV/Q-TOF MS analysis.
Statistical Analysis
The data in this manuscript were presented as mean ± SEM, if no specified otherwise. Significant differences were determined using unpaired one-way ANOVA. LC-MS/MS was performed as described in the Supplementary Methods. All the PK parameters were calculated using noncompartmental analysis (Phoenix WinNonlin version 7.0; Pharsight Corp., Mountain View, CA).
Results
Method Validation
Specificity of the method was determined by comparing chromatograms of blank plasma and whole blood from six different sources. As shown in Figures 2–3, no significant interfering peaks were observed at the retention times of analytes and IS. The retention times of FHND6081 and MP were 1.29 and 1.12 min, respectively. The results of specificity indicated that there were no significant endogenous interferences was observed at the retention time of them. Regression equations, linear ranges, and correlation coefficient (r) of FHND6081 were listed in Table 1. The calibration curves of FHND6081 in plasma or whole blood was linear in the concentration range of 0.3–200 ng/mL with correlation coefficient greater than 0.99. The accuracy and precision data, summarized in Table 2, shows that they were well within the 15% acceptance range. Stability studies were summarized in Table 3. A maximum deviation of QC solutions was 9.8%, which showed that FHND6081 were stable under all conditions employed in this study. The matrix effect was carried out to assess ionization interference from co-eluted endogenous compounds with analyte. The results were shown in Table 4 indicated that there was no endogenous substance to affect the reproducibility and the accuracy of FHND6081 in the rat plasma. The LC-MS/MS analytical method was validated as accurate and precise for the quantification of FHND6081 in plasma and whole blood of concentration ranging from 0.3–200 ng/mL.
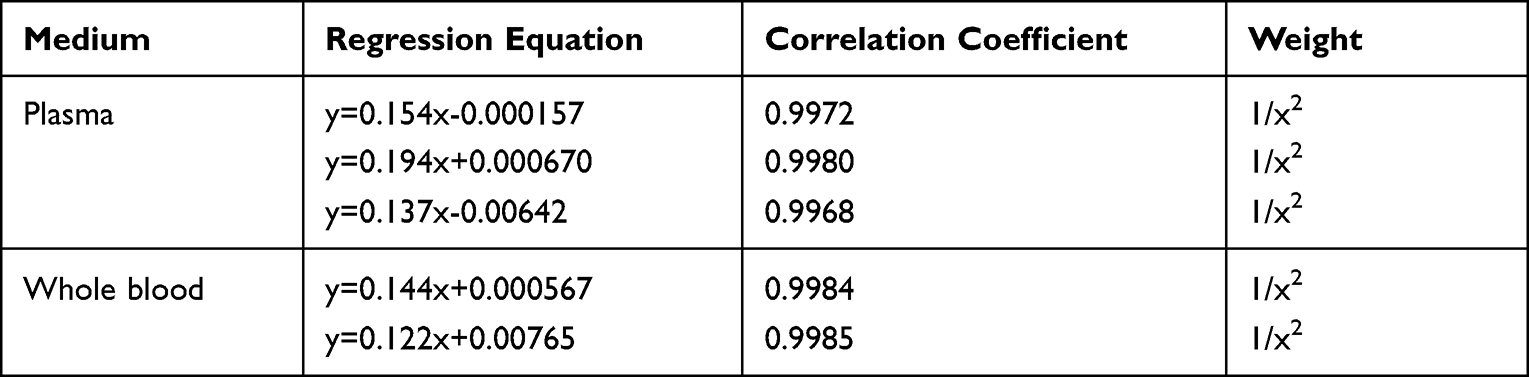 |
Table 1 Linearity for Assay of FHND6081 |
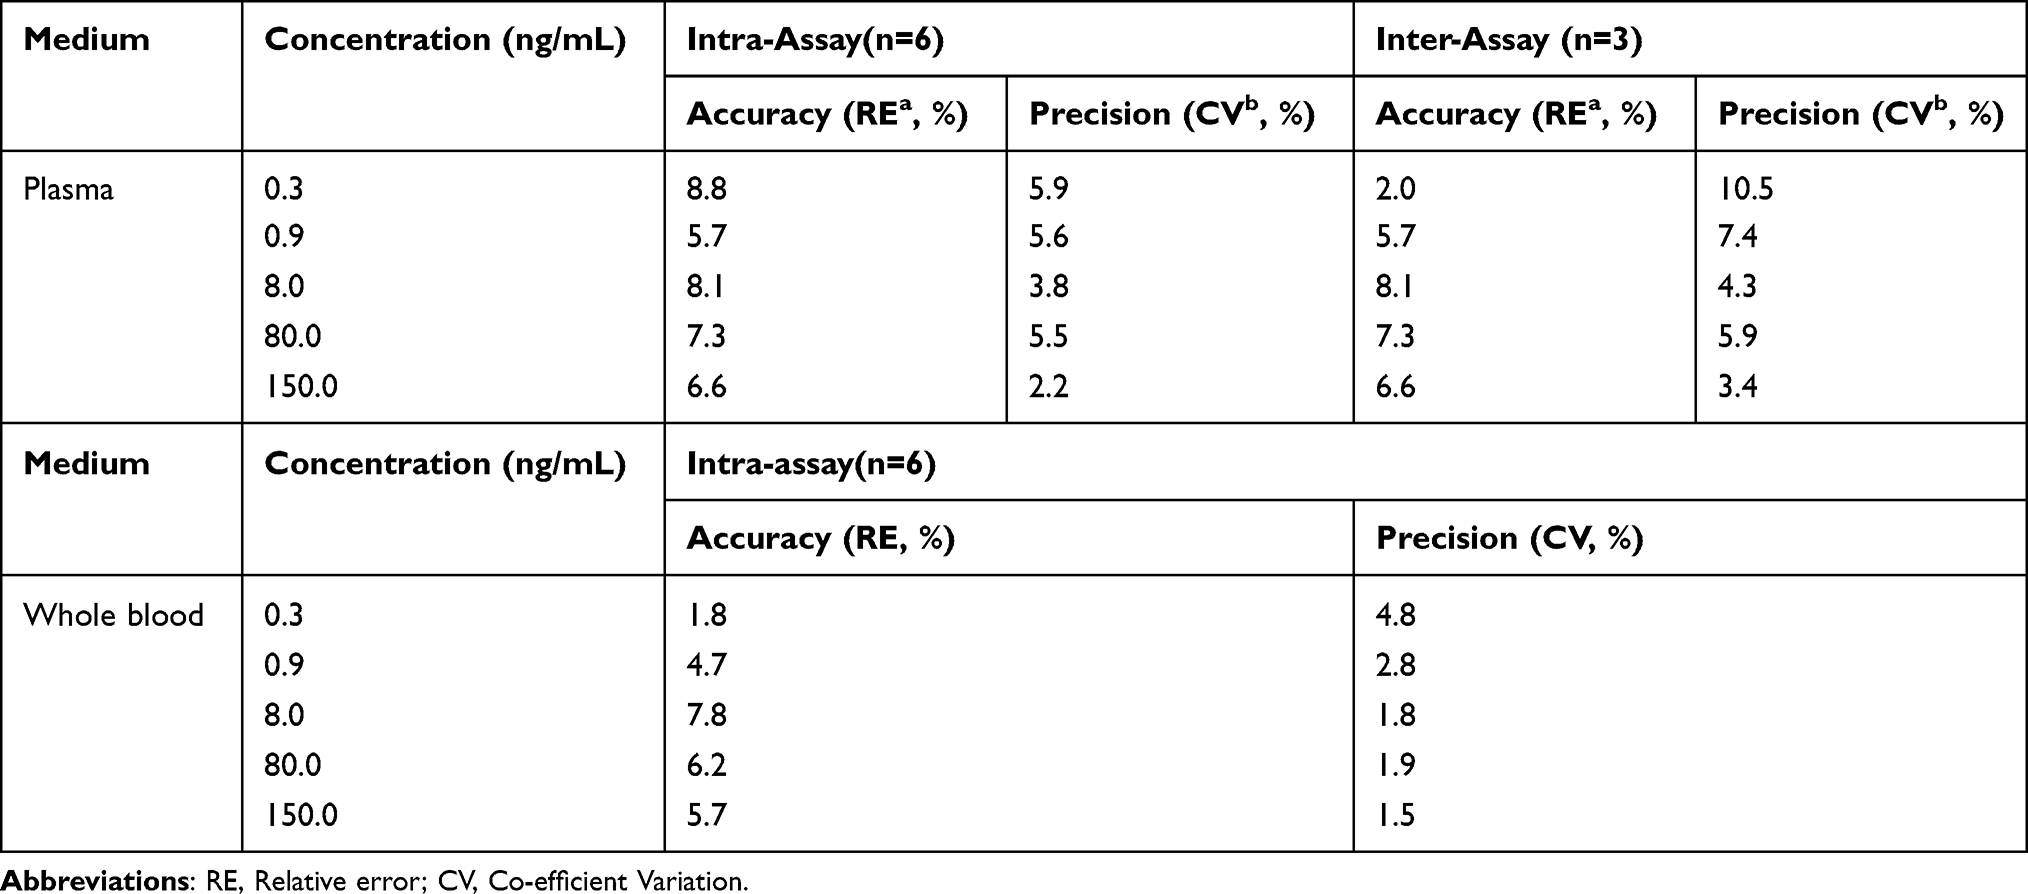 |
Table 2 Intra-Assay and Inter-Assay Accuracy and Precision of FHND6081 |
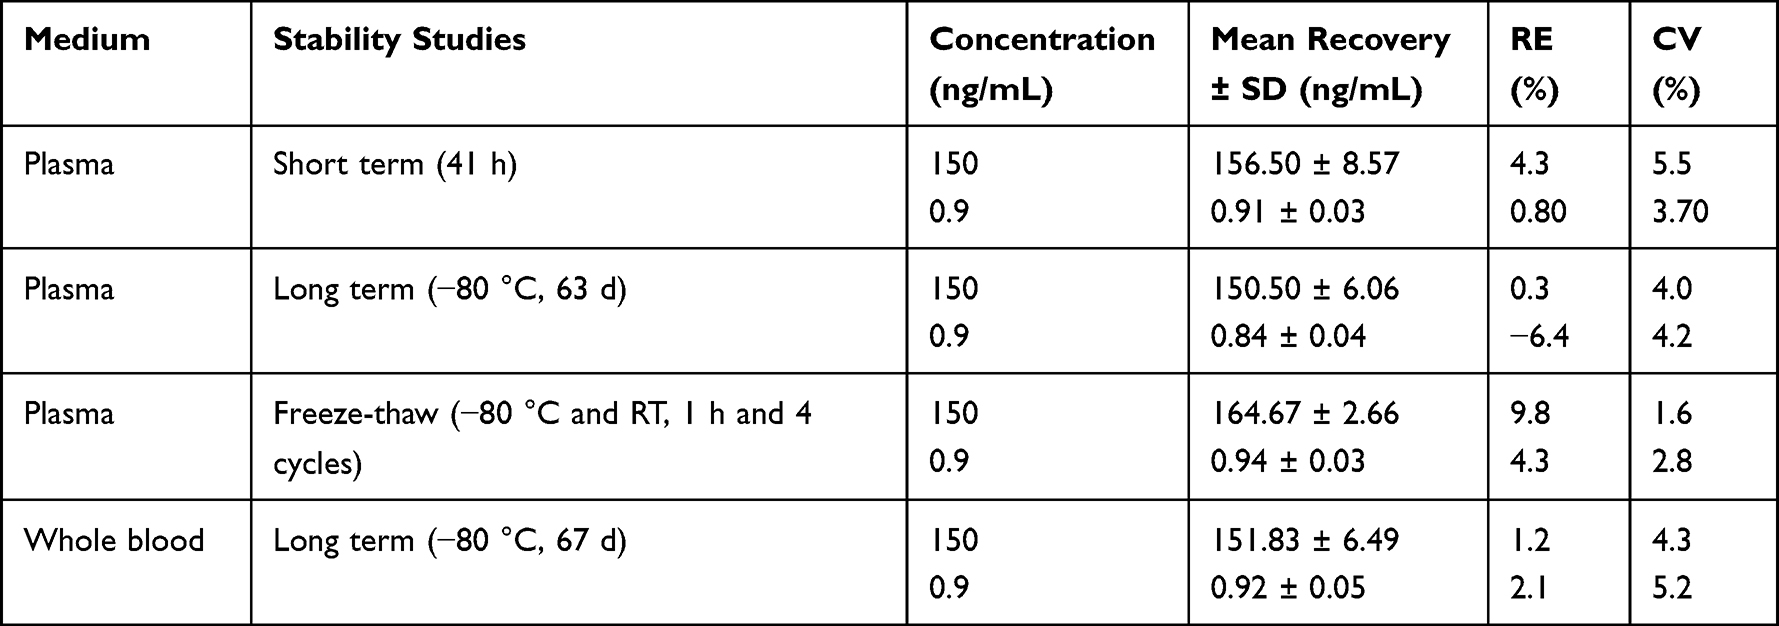 |
Table 3 Stability of FHND6081 Under Different Storage Conditions (n=6) |
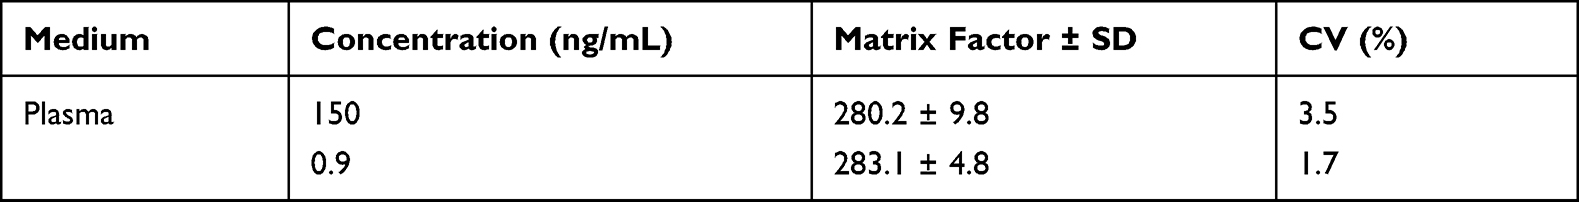 |
Table 4 Matrix Effect of FHND6081 in Rat Plasma |
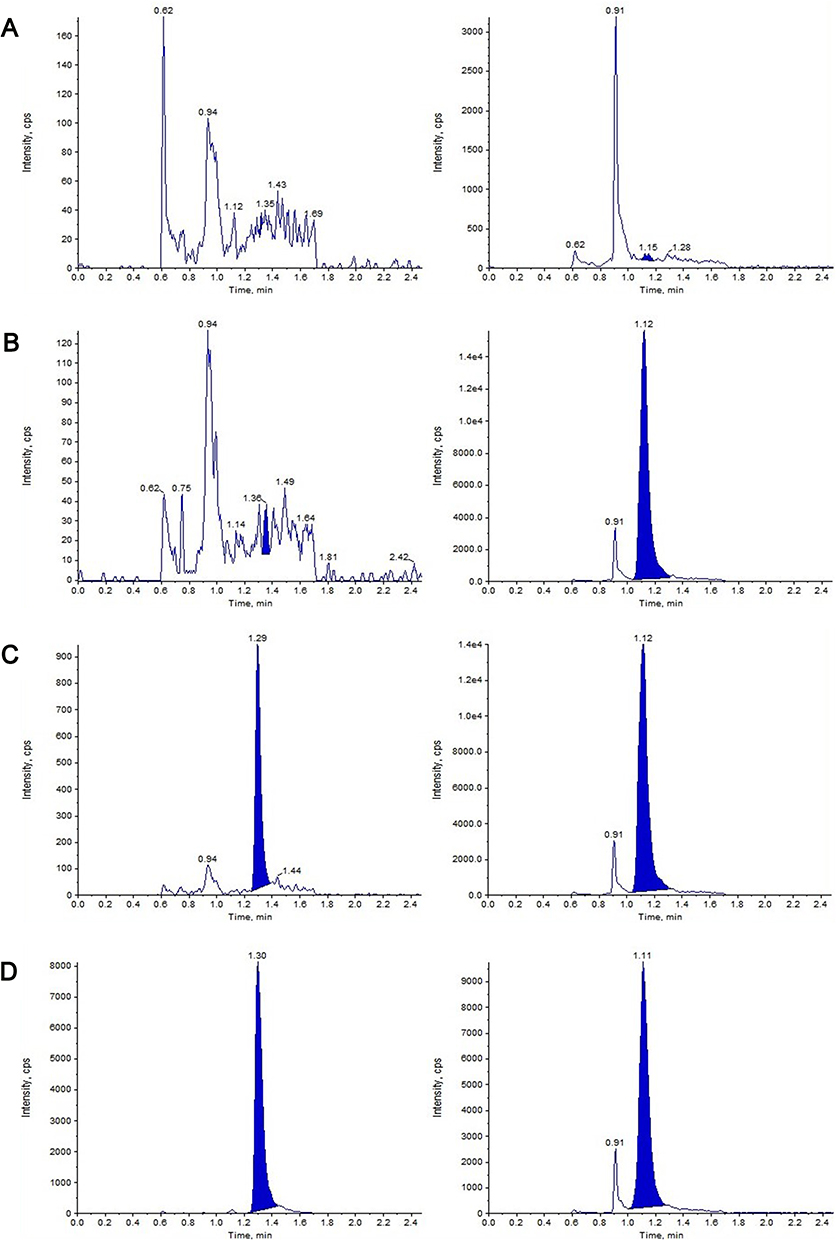 |
Figure 2 Representative MRM chromatograms of FHND6091 and MP in rat plasma. (A) Blank plasma matrix; (B) Blank plasma matrix spiked with IS; (C) Blank plasma matrix spiked with FHND6081 at LLOQ and MP; (D) Plasma samples obtained at 0.15 min after intragastric administration of FHND6091 (0.3 mg/kg). (left: FHND6081; right: MP). |
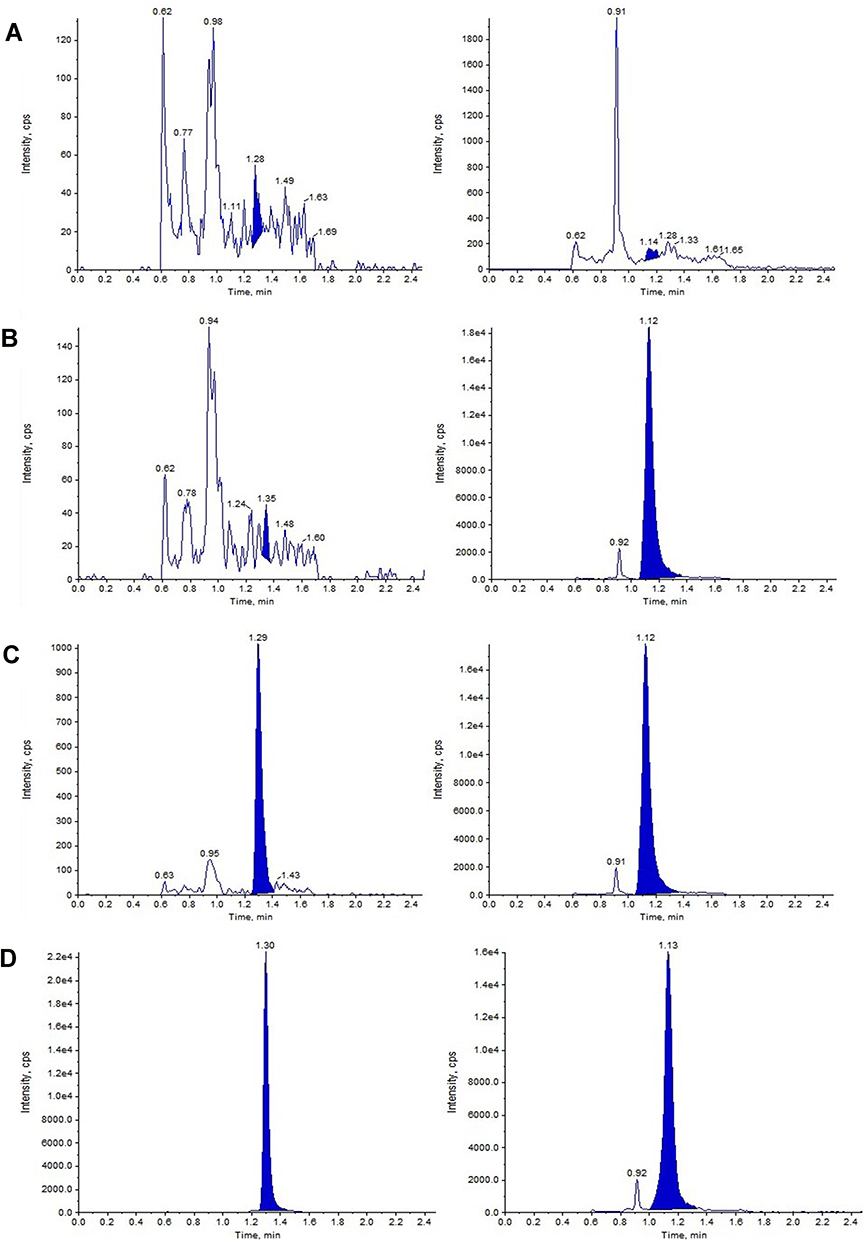 |
Figure 3 Representative MRM chromatograms of FHND6091 and MP in rat whole blood. (A) Blank whole blood matrix; (B) Blank whole blood matrix spiked with IS; (C) Blank whole blood matrix spiked with FHND6081 at LLOQ and IS; (D) Whole blood sample obtained at 10 h after intragastric administration of FHND6091 (0.3 mg/kg). (left: FHND6081; right: MP). |
Plasma Protein Binding
The binding of FHND6081 to plasma protein from three different species was evaluated. At 20, 60, and 200 ng/mL, the fraction of FHND6081 bound to plasma protein was greater than 99% and the resulting FHND6081 concentration in the dialysate were below the LLOQ.
Caco-2 Transport
Caco-2 cell monolayer as an in vitro model of the intestinal luminal epithelium has become an important and reliable method to evaluate the permeability of drugs.15 As illustrated in Table 5, the Papp (A-B) value of minoxidil was (4.18±1.04) × 10−6cm/s, and it was used as a high permeable control. On the contrary, the Papp (A-B) value of acyclovir was (0.0803±0.0399) × 10−6cm/s, which was considered as a low permeable control. The Papp of FHND6091 at different drug concentrations (2, 10, 50 μM) were all ranged between 0.0803 and 4.18 × 10⁻⁶cm/s, and hence, it was inferred to be moderately permeable. The Papp (B-A)/ Papp (A-B) value of digoxin (a standard substrate of P-gp) was 87.9, and it was used as a positive control. The efflux ratio of FHND601 (10 μM) was 34.0 in Caco-2 cell monolayers, and the addition of the efflux transport inhibitor GF120918 significantly altered the efflux ratio, which indicated that FHND6091 might be a potential substrate for P-glycoprotein (P-gp) or other active transporters. However, at a higher concentration (50 μM), the efflux ratio of FHND6091 was comparable to that added with GF120918, and the value of Papp (A-B) was expressed as equivalent to Minoxidil. When the concentration of FHND6091 exceeds a certain range, these data not only suggested that the efflux transporters were saturated or inhibited but also had high permeability and excellent oral absorption.
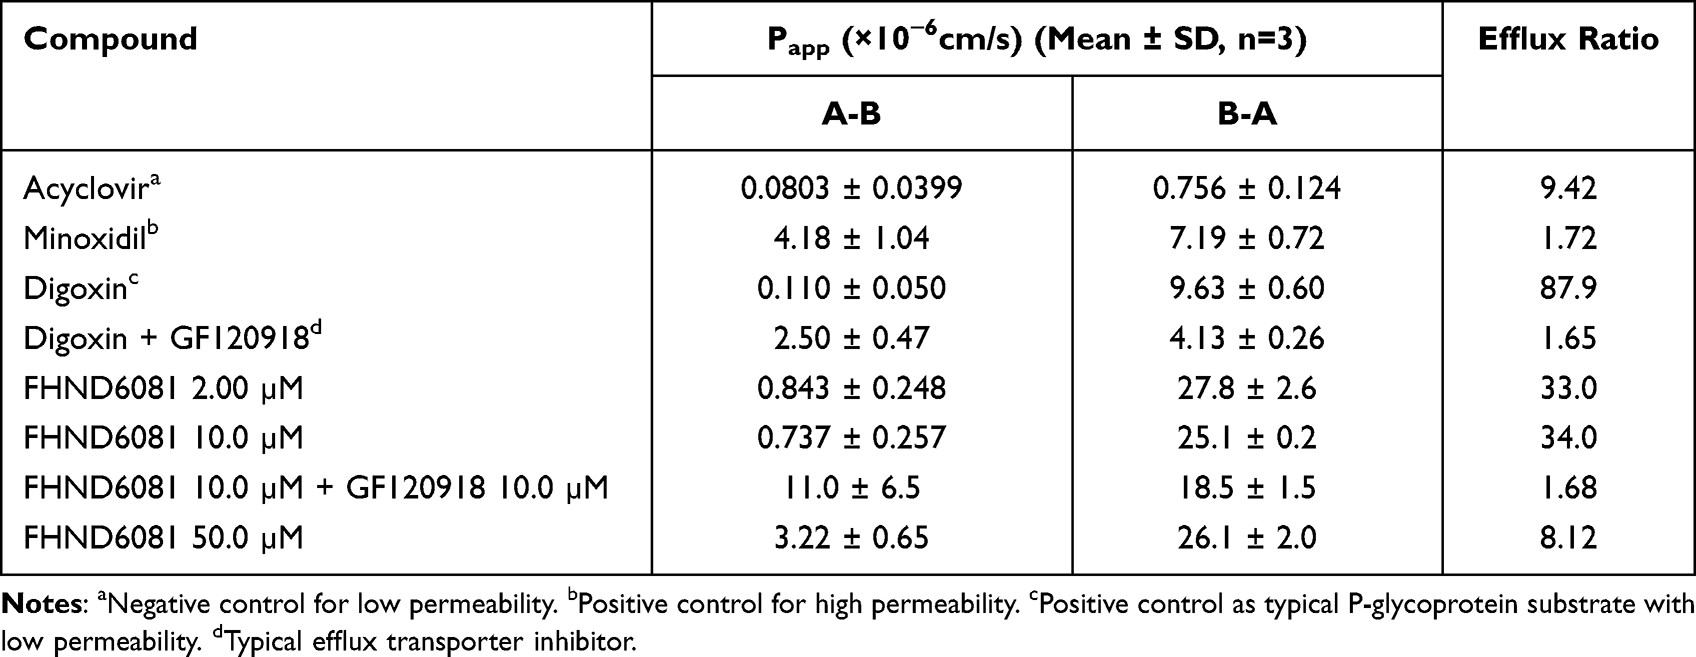 |
Table 5 The Bi-Directional Transport Permeability and the Efflux Ratio of FHND6081 Across Caco-2 Cell Monolayers |
Pharmacokinetic Parameters for Both Plasma and Whole Blood After Single Administration of FHND6091
After oral administration of FHND6091 in SD rats, the plasma concentrations of FHND6081 were detected using LC-MS/MS with a lower limit of quantification of 0.3 ng/mL. The data obtained from each group was averaged. Figures 4 showed the mean plasma concentration-time curves of FHND6081 in rats receiving oral doses of 0.15, 0.30 and 0.60 mg/kg. The main pharmacokinetic parameters were summarized in Table 6. Dose escalation was studied in rats. As displayed in Table 6, within the tested dose ranges (0.15–0.60 mg/kg in rats), both the plasma Cmax and AUC0-t were significantly increased in a greater than dose-proportional manner. To assess absolute bioavailability (F), FHND6091 was also administered by tail vein injection (0.15 mg/kg). Pharmacokinetic parameter analysis and the plasma concentration-time curve of the intravenous study were presented in Supplementary Table 1 and Supplementary Figure 1, respectively. The F values of FHND6081 in rats were 3.90% and 7.46% at the low and medium doses (0.15 and 0.30 mg/kg), respectively, and increased to 9.75% at 0.60 mg/kg. Following single oral administration, FHND6081 was detected at the first sample collection time (5 min) and reached the peak concentration at 0.2–0.5 h. It was suggested that FHND6081 was absorbed relatively rapidly. Moreover, FHND6081 exhibited slow elimination (t1/2=7.8–23.6 h) from the plasma and displayed good oral exposure.
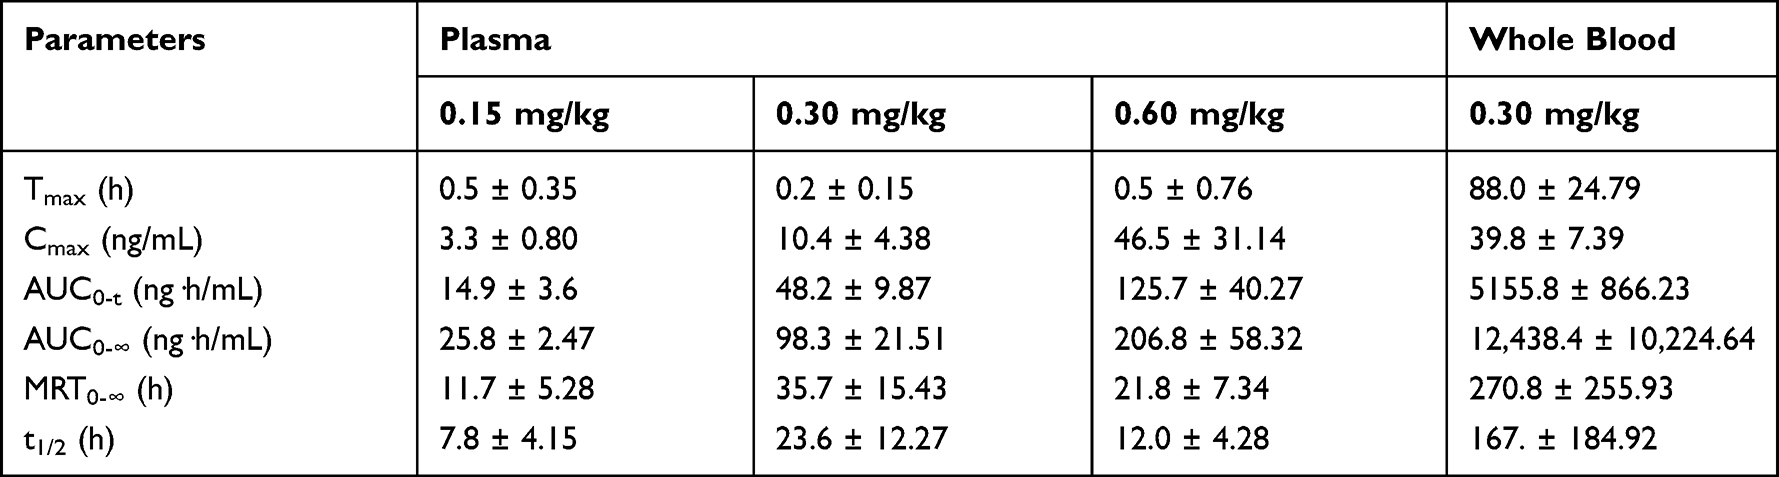 |
Table 6 The Plasma and Whole Blood Pharmacokinetic Parameters of FHND6081 After Single Oral Administration in Rats (n=6) |
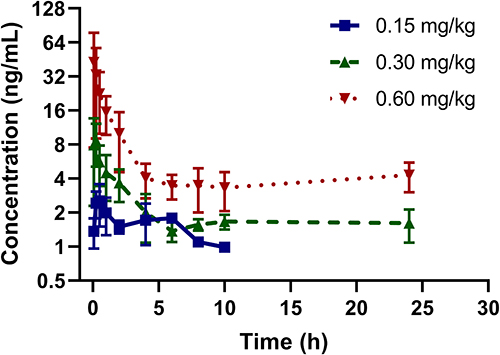 |
Figure 4 Concentration versus time profile of FHND6081 following single oral doses of 0.15, 0.30, 0.60 mg/kg to rats (n=6 per treatment group). |
According to literatures, the proteasome is normally highly expressed in red blood cells (RBCs),16,17 thus we preliminarily inferred that FHND6081 might bind to intraerythrocytic proteasomes. This could have implications for plasma pharmacokinetic profiles of FHND6081 and correlate with drug toxicities. In addition, since the blood distribution assay in rats resulted in the ratio of blood-to-plasma ratio more than 1, we considered that whole blood should also be used for monitoring the systemic exposure of FHND6081 in this preclinical pharmacokinetic study. To examine the levels of FHND6081, a sample of whole blood was collected in the groups treated with the middle doses. The whole blood pharmacokinetic parameters and the concentration-time curve were listed in Table 6 and Figure 5, respectively. Rats were given moderate doses of FHND6081, Cmax of FHND6081 in plasma was three times higher than that in whole blood and AUC0-t was induced up to more than 100-fold. A strikingly different pattern of elimination half-life (t1/2) and mean residence time (MRT) between plasma and whole blood was also observed, suggesting that FHND6081 was retained in erythrocytes for a long time in prototype form. The mean whole blood/plasma ratio increased with time. The above results suggested that FHND6081 preferred prolonged distribution in the hemocytes. The comparison of mean plasma and whole blood concentration-time curves of FHND6081 after single oral administration in medium dosage were showed in Figure 2. At 168h, only a slightly decreasing tendency of drug concentration can be observed in rats. Moreover, FHND6081 was maintained in vivo models for several days, which further confirmed that most of the drug was distributed within the RBC component.
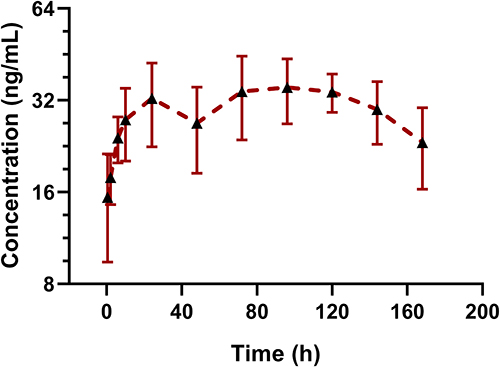 |
Figure 5 The mean whole blood concentration-time curves of FHND6081 following a single oral dose of 0.30 mg/kg to rats. (n=6). |
Tissue Distribution in Rat
As shown in Figure 6, FHND6081 is widely distributed in a variety of tissues, including the stomach, adrenal glands, small intestine, spleen and liver. No difference was noticeable among genders. The highest exposure in tissue was found in the stomach and was much higher than in other organs, which was associated with the route of drug administration. Furthermore, except gastrointestinal, FHND6081 had a relatively high distribution in the adrenal gland, followed by the spleen and liver, which implied that the distribution of FHND6081 depended on the blood flow. Tmax in most tissues was approximately at 24h post-dose, and it is eliminated rapidly in the stomach and small intestine. Additionally, the ratio of whole blood to plasma concentration was 4.91, revealing that FHND6081 distributed more in erythrocytes than in plasma. FHND6081 was not able to cross the blood–brain barrier (BBB) because it was not detected in the rat brain.
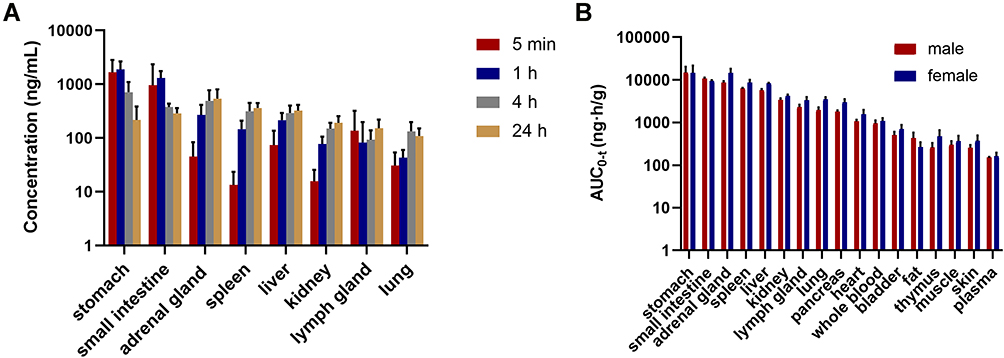 |
Figure 6 (A) Tissue distribution profiles of FHND6081 in males or female rats at 5 min, 1, 4 and 24 h following a single-dose oral administration of 0.6 mg/kg (n = 6). (B) The exposure (AUC0-t) of FHND6081 in various tissues. |
Metabolic Stability
The mean ± SD percentage of FHND6081 remaining after a 60 min incubation in human, monkey, dog, rat and mouse liver microsomes were 50 ± 1.58%, 51 ± 0.54%, 68 ± 1.37%, 61 ± 0.44% and 61% ± 0.29%. The turnover of FHND6081 was fastest in human microsomes but slower in dog microsomes (Figure 7). Heat-inactivated liver microsomes served as negative controls (Supplementary Figure 2). The ranking of the metabolic rate was as follows: mouse > dog > monkey > rat > human. In general, small animals, such as mice, commonly had a higher metabolic rate than humans because of the relatively high amount of hepatic metabolizing enzymes (CYP/gram of body weight).18 In Table 7, the predicted hepatic clearance (CLhb) values of each species were in the range of 12.2 and 39.1 mL/min/kg. According to the metabolic clearance evaluation criteria of drugs in various species, FHND6081 was a moderate-clearance compound with CLs between 20% and 80% of hepatic blood flow.19
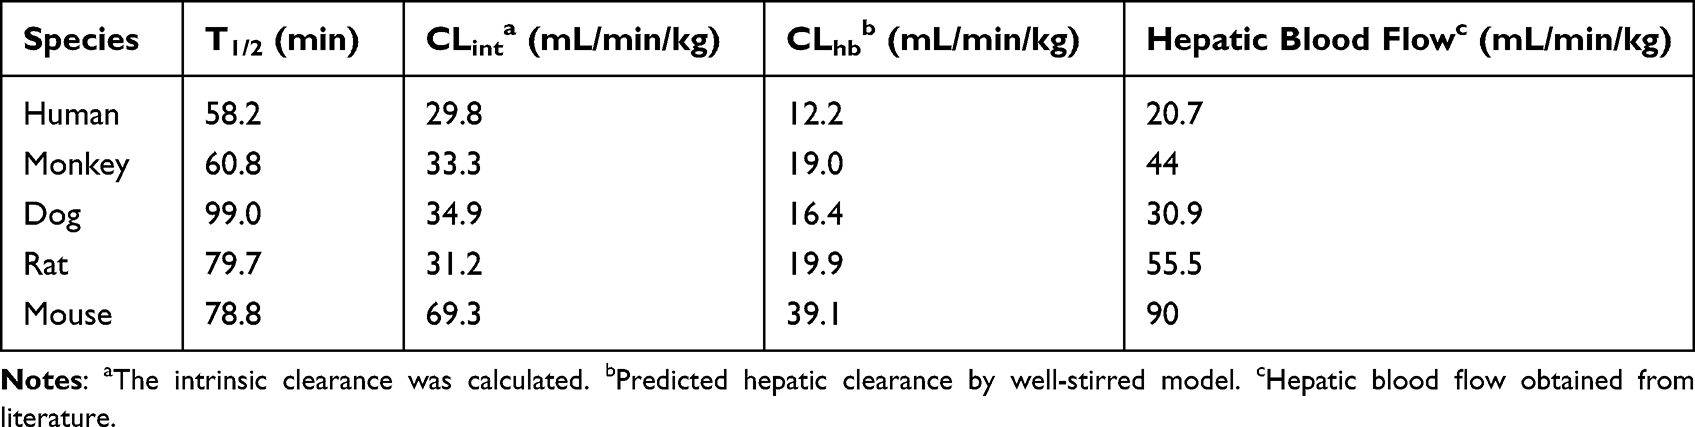 |
Table 7 The Microsomal Metabolism of FHND6081 in Liver Microsomes from Five Different Species |
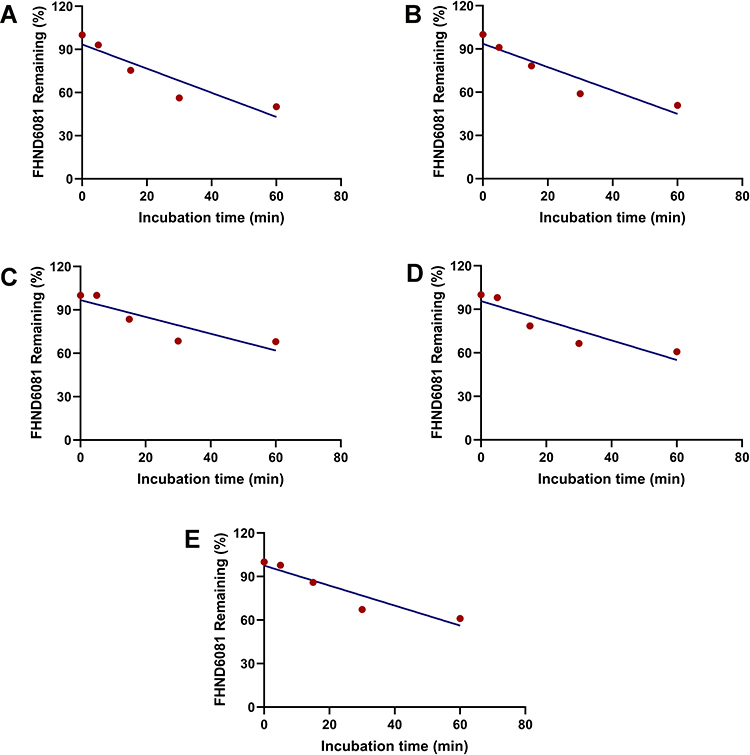 |
Figure 7 Concentration-time curves of FHND6081 after FHDN6081 incubation with (A) human, (B) monkey, (C) dog, (D) rat and (E) mouse liver microsomes. |
Identification of Major Metabolites of FHND6081 in Hepatocytes
The parent compound FHND6081 was detected in hepatocytes samples from human, monkey, dog, rat and mouse. It was eluted at 7.10 min with an accurate [M-H]− ion at m/z 419.0718. In Figure 8, firstly, FHND6091 was not detected in any samples, which showed full conversion of FHND6091 into FHND6081. Secondly, we could learn from Figure 8 that FHND6081 was detected in human and monkey hepatocytes, while the other three species and inactivated hepatocytes had a low relative abundance, mostly due to detection interval of 12 h and instability of FHND6081 in samples. In a second replicate experiment, the addition of vitamin C to the reaction system (after incubation) was found to be effective in improving the stability of FHND6081 in samples. Relevant information on FHND6081 and its metabolites were summarized in Table 8 (the second experiment). FHND6081 in the hepatocyte incubation system generated primarily N-dealkylation metabolite M1 and a smaller number of amide hydrolytic metabolite M2 via a non-enzymatic pathway. Metabolic reactions catalyzed by enzymes were dehydrogenation (M6), N-dealkylation plus mono-oxygenation (M4) and conjugation with glucuronic acid and glutathione (M7, M8-1, M8-2). Although M5 was not detected in dog hepatocytes, it was also occurred oxidative deborylation and further bound to glucuronic acid to form M7. Beyond this, other metabolites of human hepatocytes could be detected in other species, and they were not human-specific. These results illustrated that no clear difference was observed in the metabolites among the five species. The possible metabolic pathways were shown in Figure 9, which provided a theoretical foundation and a better understanding of the biotransformation of FHND6081.
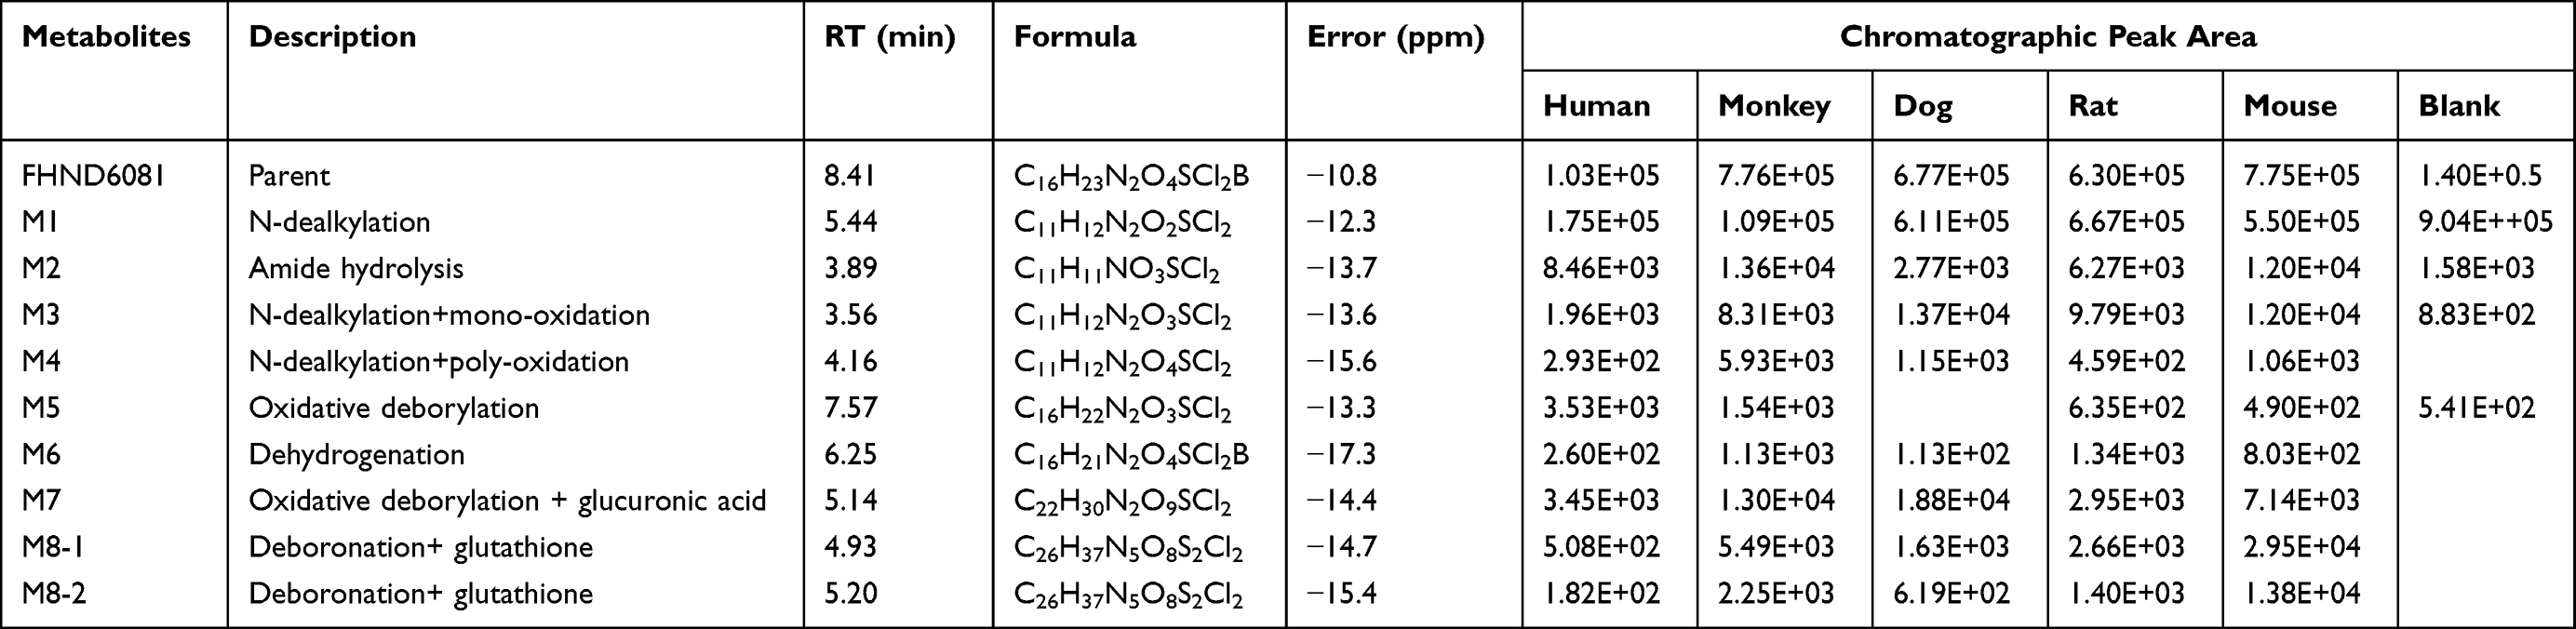 |
Table 8 Characterization of Metabolites of FHND6081 in vitro by UPLC/Q-TOF MS |
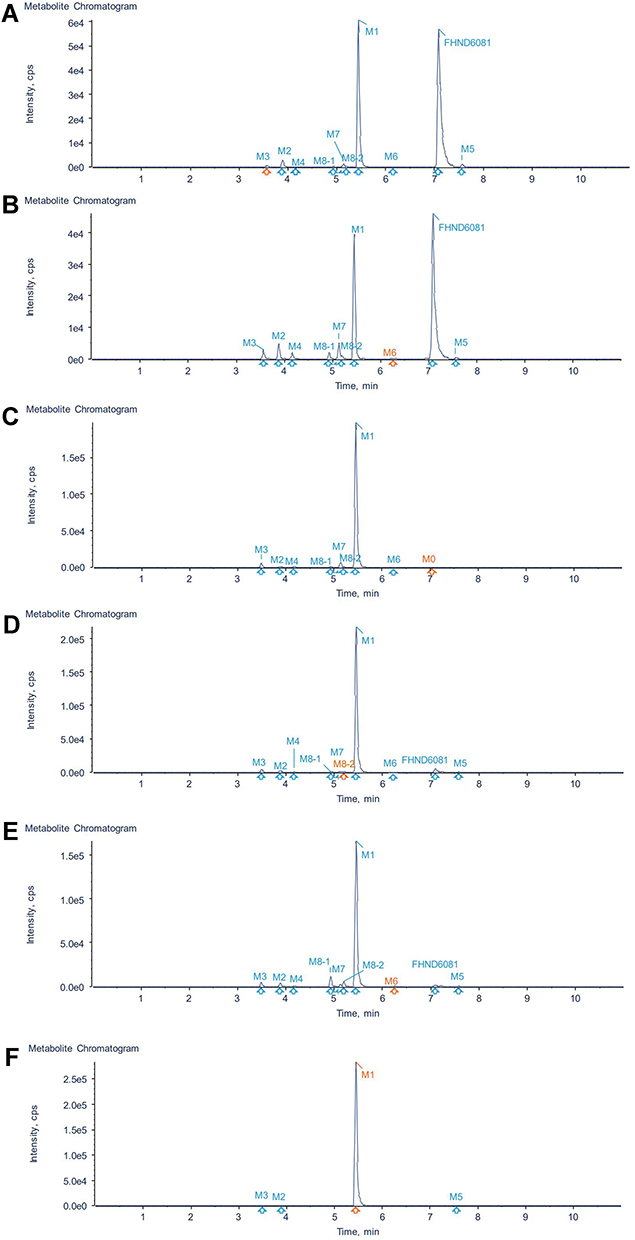 |
Figure 8 Identification of major metabolites of FHDN6081 in hepatocytes samples from (A) human, (B) monkey, (C) dog, (D) rat, (E) mouse and (F) blank. |
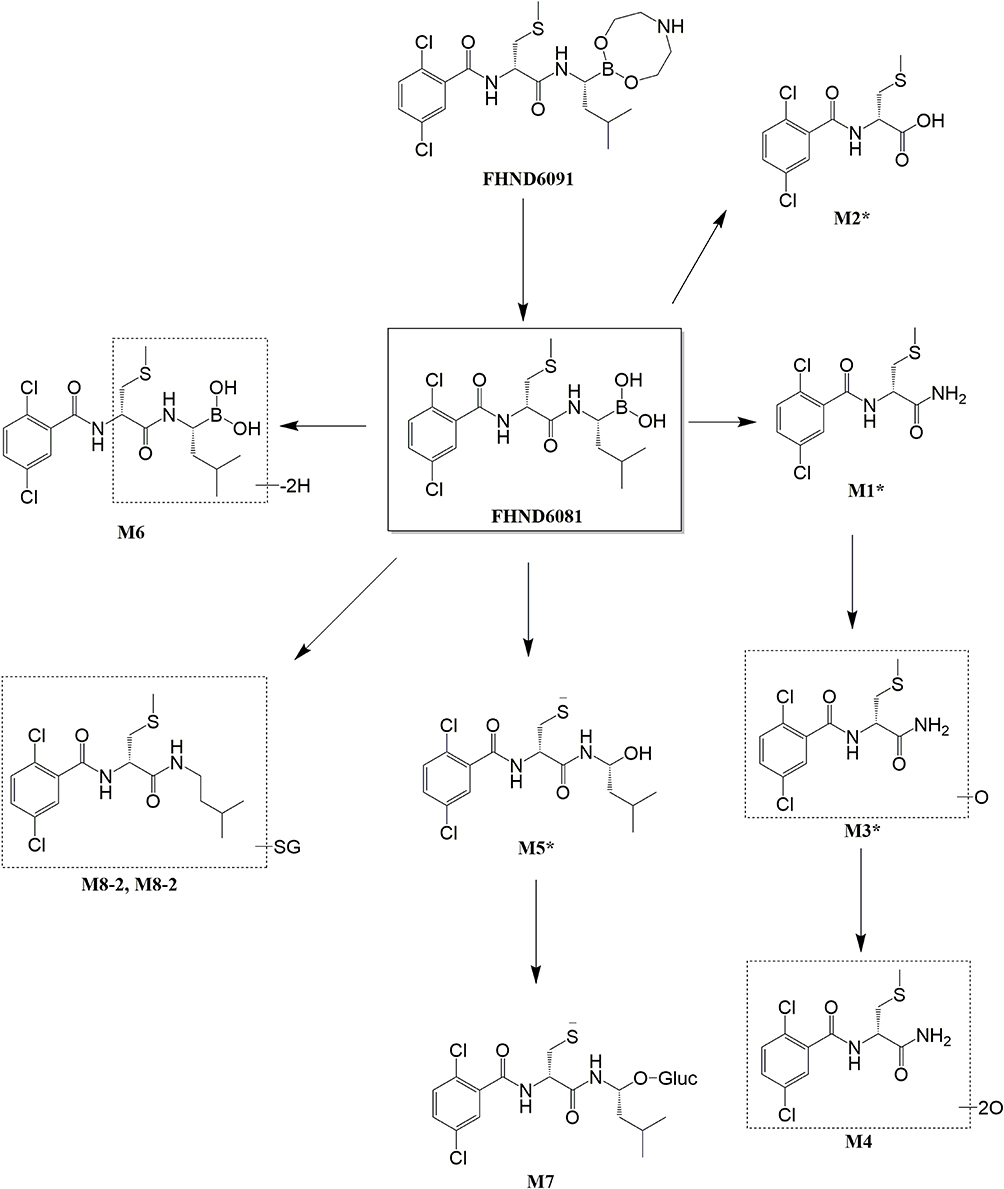 |
Figure 9 The presumed metabolic pathways of FHND6091 in hepatocytes of human, monkey, dog, rat and mouse. (* indicates non-enzymatic hydrolysis products). |
Excretion of FHND6081 from Rats
The cumulative FHND6081 excretion results in rat feces, urine and bile, following a single intragastric administration of FHND6091 (0.30 mg/kg), were presented in Figure 10. The cumulative fecal excretion of FHND6081 was very small, only 2.03% of the dose in 96 h. The accumulated excretion of FHND6081 in urine was even lower, within 0.888% of the dose being excreted. However, FHND6081 was not detected in bile samples. The results exhibited that FHND6081 was extensively metabolized in rats. Metabolites were identified by UHPLC-QTOFMS. As showcased in Figures 11 and 12, three (M1, M2 and M3) and two (M1 and M3) metabolites were detected respectively in plasma and feces, and metabolites were not detected in urine and bile. The main metabolic pathway was oxidation and formylation.
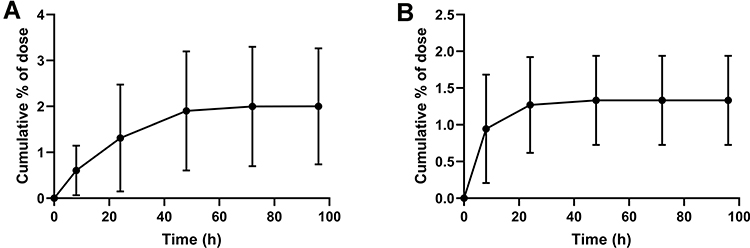 |
Figure 10 Excretion of FHND6081 in the feces and urine of rats. Excretion of FHND6081 in (A) feces, (B) urine of rats following a single oral dose of FHND6091 at 0.3 mg/kg. Data are presented as the mean ± standard deviation, n=6. |
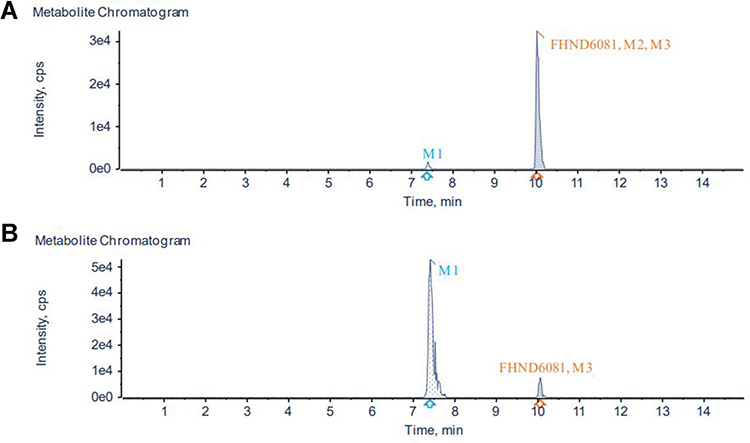 |
Figure 11 Identification of major metabolites of FHDN6081 in (A) plasma samples and (B) fecal samples. |
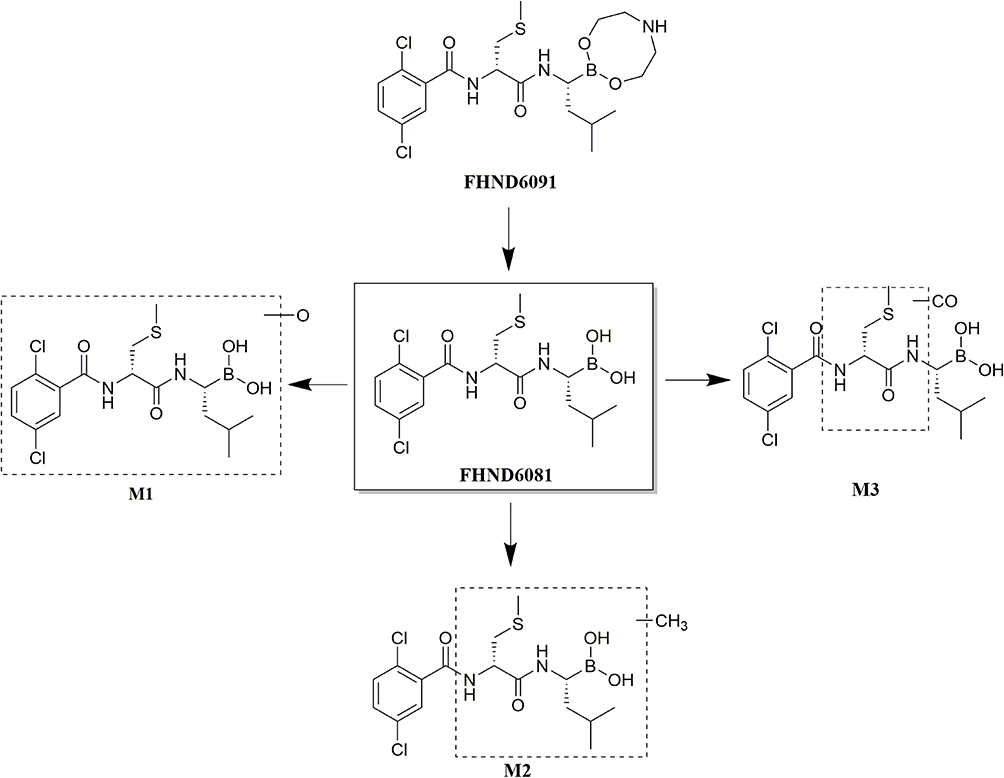 |
Figure 12 The presumed metabolic pathways of FHND6091 in plasma and fecal samples. |
Discussion
Based on our previous studies, we designed a novel and oral available dipeptidyl boronic acid proteasome inhibitor FHND6091 (prodrug) and applied an exclusive sulfur-based technology to introduce methylthio group into the chemical scaffolds to enhance metabolic stability and improve oral bioavailability. In vitro and in vivo activities data indicated that the hydrolyzed form FHND6081 was active enough to be developed as a candidate for the treatment of multiple myeloma. In this manuscript, the ADME properties and preclinical PK in animals was investigated according to Product Development Under the Animal Rule: Guidance for Industry from FDA, which further confirmed that FHND6091 was worthy of clinical application.
Results of the permeability study in Caco-2 monolayer cells showed the moderate permeability of FHND6081, which was related to the introduction of methanethiol to increase lipophilicity. At low concentrations, efflux was observed and at high concentrations efflux ratio decreased significantly during the Caco-2 transport of FHND6081. Therefore, the presence of P-gp efflux transporter would limit its absorption considering that FHND6081 might be the substrate of the P-gp. These findings suggested that further increasing the dose within safe limits could promote oral absorption and improve bioavailability, which was consistent with our PK results in rats. In our pharmacokinetics research, dosage of administration was 0.15, 0.30 and 0.60 mg/kg were in the safe dose range. Due to the poor solubility of FHND6091, 5% sulfobutyl ether β-cyclodextrin solution was used as the solvent of FHND6091. The AUC0-t and Cmax values of these three oral dosages were not proportionately increased, and therefore, the results supported non-linear plasma pharmacokinetics of FHND6081 across the investigated dosage range in rats. This might be due to the saturation of metabolic enzymes and efflux transporters by drugs.
The tissue distribution of FHND6081 demonstrated that FHND6081 was widely distributed in blood-rich tissues and organs, including the stomach, adrenal glands, small intestine, spleen and liver. The overall trends of tissue drug concentrations were similar to blood drug concentrations. Furthermore, FHND6081 was not able to permeate through the blood–brain barrier. If this observation translates to humans, the extensive distribution of FHND6081 would be beneficial in chemotherapy targeting these tissues. The in vitro PPB values of human, rat and dog were up to 99% indicating that was no inter-species variation between rodent and non-rodent, and it had a significant impact on the disposition of FHND6081. However, the ratio of blood-to-plasma ratio (B:P) in vivo was 4.91, which provided evidence of FHND6081 partitioning into RBCs. In addition, the t1/2 and MRT of whole blood were several folds higher than plasma. When considered in vivo, the results implied that FHND6081 had a higher accumulation and longer residence time of RBCs than plasma. According to the literature, factors modulating the partition of drugs into RBCs included pH, physicochemical properties, RBC and plasma protein binding.20 We therefore speculated that FHND6081 had a higher affinity for RBCs than plasma proteins, as it might directly couple with primary drug-binding proteins. However, what proteins in the blood cells FHND6081 binds to achieve sustained or controlled release effects remained unknown, which needs to be further studied and verified in the future. Whether the higher concentration in the RBCs would pose any safety risk remains unknown so far.
Metabolically, amount of parent compound was found in hepatocytes of five species, which were mainly N-dealkylation (non-enzymatic pathway), dehydrogenation, N-dealkylation plus mono-oxygenation, oxidative deborylation combined with glucuronic acid and deboronation followed by glutathione metabolites. The results indicated that both metabolic reactions were involved in the metabolism of FHND6081 through the liver. No human-specific metabolite was identified in this study. Next, the in vivo clearance of FHND6081 was predicted by physiologically based scaling from the in vitro metabolism of FHND6081 by liver microsomes. The predicted hepatic clearance in different species ranked from highest to lowest in the order of mouse, rat, dog, monkey and human. Smaller animals had higher CYPs/gram body weight and tended to have higher clearance than larger mammals. Compared with hepatic blood flow, predicted hepatic clearance of FHND6081 could be characterized as moderate in the five species. The cumulative excretion percentage in feces, urine and bile following oral administration were evaluated. A small percentage of FHND6081 was excreted through the feces and urine. These results suggested that FHND6081 underwent biotransformation in the small intestine.
Conclusion
FHND6091 is a promising proteasome reversible inhibitor for MM treatment as published previously. In this study, the preclinical pharmacokinetics properties of FHND6091 were systematically studied by several in vivo and in vitro experiments. It was highly bound to plasma proteins in vitro, but partitioned into red blood cells. Although FHND6081 had low oral bioavailability, it was rapidly absorbed and widely distributed in essential organs. FHND6081 was metabolized predominantly in the liver, and the gastrointestinal tract was also one of the metabolic sites. The results could support its future development as an oral drug for the treatment of MM disease in clinic. Hopefully, it can offer a new option for patients who are resistant to bortezomib or ixazomib.
Acknowledgments
The authors thank the Jiangsu Chia Tai Fenghai Pharmaceutical Co. Ltd. for providing instruments and samples.
Funding
This work was supported by the National Natural Science Foundation of China (2187706 to M.L., 121877061 to YQ.Z.) and Natural Science Foundation of Jiangsu Province (BK20171448 to M.L.).
Disclosure
The authors report no conflicts of interest in this work.
References
1. Goldman-Mazur S, Kumar SK. Current approaches to management of high-risk multiple myeloma. Am J Hematol. 2021;96:854–871. doi:10.1002/ajh.26161
2. Kyle RA, Rajkumar SV. Multiple myeloma. Blood. 2008;111:2962–2972. doi:10.1182/blood-2007-10-078022
3. Genadieva Stavric S, Bonello F, Bringhen S, Boccadoro M, Larocca A. How is patient care for multiple myeloma advancing? Expert Rev Hematol. 2017;10:551–561. doi:10.1080/17474086.2017.1326814
4. Scalzulli E, Grammatico S, Vozella F, Petrucci MT. Proteasome inhibitors for the treatment of multiple myeloma. Expert Opin Pharmacother. 2018;19:375–386. doi:10.1080/14656566.2018.1441287
5. Frankland-Searby S, Bhaumik SR. The 26S proteasome complex: an attractive target for cancer therapy. Biochim Biophys Acta. 2012;1825:64–76. doi:10.1016/j.bbcan.2011.10.003
6. Nakayama KI, Nakayama K. Ubiquitin ligases: cell-cycle control and cancer. Nat Rev Cancer. 2006;6:369–381. doi:10.1038/nrc1881
7. Gillessen S, Groettup M, Cerny T. The proteasome, a new target for cancer therapy. Onkologie. 2002;25:534–539. doi:10.1159/000068624
8. Tsalikis J, Abdel-Nour M, Farahvash A, et al. Isoginkgetin, a natural biflavonoid proteasome inhibitor, sensitizes cancer cells to apoptosis via disruption of lysosomal homeostasis and impaired protein clearance. Mol Cell Biol. 2019;39(10):1–17. doi:10.1128/MCB.00489-18
9. Moreau P, Pylypenko H, Grosicki S, et al. Subcutaneous versus intravenous administration of bortezomib in patients with relapsed multiple myeloma: a randomised, Phase 3, non-inferiority study. Lancet Oncol. 2011;12:431–440. doi:10.1016/S1470-2045(11)70081-X
10. Papadopoulos KP, Burris HA 3rd, Gordon M, et al. A Phase I/II study of carfilzomib 2-10-min infusion in patients with advanced solid tumors. Cancer Chemother Pharmacol. 2013;72:861–868. doi:10.1007/s00280-013-2267-x
11. Kupperman E, Lee EC, Cao Y, et al. Evaluation of the proteasome inhibitor MLN9708 in preclinical models of human cancer. Cancer Res. 2010;70:1970–1980. doi:10.1158/0008-5472.CAN-09-2766
12. Lei M, Feng H, Bai E, et al. Discovery of a novel dipeptidyl boronic acid proteasome inhibitor for the treatment of multiple myeloma and triple-negative breast cancer. Org Biomol Chem. 2019;17:683–691. doi:10.1039/C8OB02668H
13. Zhou H, Lei M, Wang W, et al. In vitro and in vivo efficacy of the novel oral proteasome inhibitor NNU546 in multiple myeloma. Aging. 2020;12:22949–22974. doi:10.18632/aging.104023
14. Wang C, Williams NS. A mass balance approach for calculation of recovery and binding enables the use of ultrafiltration as a rapid method for measurement of plasma protein binding for even highly lipophilic compounds. J Pharm Biomed Anal. 2013;75:112–117. doi:10.1016/j.jpba.2012.11.018
15. Yang Z, Gao S, Yin T, et al. Biopharmaceutical and pharmacokinetic characterization of matrine as determined by a sensitive and robust UPLC-MS/MS method. J Pharm Biomed Anal. 2010;51:1120–1127. doi:10.1016/j.jpba.2009.11.020
16. Neelam S, Kakhniashvili DG, Wilkens S, Levene SD, Goodman SR. Functional 20S proteasomes in mature human red blood cells. Exp Biol Med. 2011;236:580–591. doi:10.1258/ebm.2011.010394
17. Kakhniashvili DG, Bulla LA, Goodman SR. The human erythrocyte proteome: analysis by ion trap mass spectrometry. Mol Cell Proteomics. 2004;3:501–509. doi:10.1074/mcp.M300132-MCP200
18. Smith DA, Jones BC. Speculations on the substrate structure-activity relationship (SSAR) of cytochrome P450 enzymes. Biochem Pharmacol. 1992;44:2089–2098. doi:10.1016/0006-2952(92)90333-E
19. Davies B, Morris T. Physiological parameters in laboratory animals and humans. Pharm Res. 1993;10:1093–1095. doi:10.1023/A:1018943613122
20. Dash RP, Veeravalli V, Thomas JA, Rosenfeld C, Mehta N, Srinivas NR. Whole blood or plasma: what is the ideal matrix for pharmacokinetic-driven drug candidate selection? Future Med Chem. 2021;13:157–171. doi:10.4155/fmc-2020-0187
 © 2022 The Author(s). This work is published and licensed by Dove Medical Press Limited. The full terms of this license are available at https://www.dovepress.com/terms.php and incorporate the Creative Commons Attribution - Non Commercial (unported, v3.0) License.
By accessing the work you hereby accept the Terms. Non-commercial uses of the work are permitted without any further permission from Dove Medical Press Limited, provided the work is properly attributed. For permission for commercial use of this work, please see paragraphs 4.2 and 5 of our Terms.
© 2022 The Author(s). This work is published and licensed by Dove Medical Press Limited. The full terms of this license are available at https://www.dovepress.com/terms.php and incorporate the Creative Commons Attribution - Non Commercial (unported, v3.0) License.
By accessing the work you hereby accept the Terms. Non-commercial uses of the work are permitted without any further permission from Dove Medical Press Limited, provided the work is properly attributed. For permission for commercial use of this work, please see paragraphs 4.2 and 5 of our Terms.