")
Back to Journals » Diabetes, Metabolic Syndrome and Obesity » Volume 14
Prdm16-Mediated Browning is Involved in Resistance to Diet-Induced and Monosodium Glutamate-Induced Obesity
Authors Liang J, Jia Y, Yan H, Shen Q, Bian W, Zhao D, Xu Y, Jin Y, Yang M
Received 25 August 2021
Accepted for publication 14 October 2021
Published 27 October 2021 Volume 2021:14 Pages 4351—4360
DOI https://doi.org/10.2147/DMSO.S335526
Checked for plagiarism Yes
Review by Single anonymous peer review
Peer reviewer comments 3
Editor who approved publication: Dr Konstantinos Tziomalos
Jia Liang,1 Ying Jia,1 Haijing Yan,1 Qingyu Shen,1 Weihua Bian,2 Dongmei Zhao,3 Yong Xu,1 Yongjun Jin,4 Meizi Yang1
1Department of Pharmacology, Binzhou Medical University, Yantai, People’s Republic of China; 2Department of Cell Biology, Binzhou Medical University, Yantai, People’s Republic of China; 3Department of Anatomy, Binzhou Medical University, Yantai, People’s Republic of China; 4Department of Endocrinology, Binzhou Medical University, Yantai, People’s Republic of China
Correspondence: Meizi Yang; Yongjun Jin
Department of Pharmacology, Binzhou Medical University, Yantai, 264003, People’s Republic of China
Tel +86 535 691 9507
Fax +86 535 691 3163
Email [email protected]; [email protected]
Purpose: To investigate resistance to diet-induced obesity (DIO) and monosodium glutamate (MSG)-induced obesity as well as the underlying mechanisms.
Methods: Newborn mice were used to construct DIO and MSG-induced obesity models. Obesity indices, such as body weight, body length, Lee index, body temperature, food intake, fat weight, and leptin level, were examined. Mice that did not exhibit obesity were defined as the obesity-resistant group. The morphological changes of white adipose tissue were observed by hematoxylin and eosin staining, and expression levels of PR domain containing 16 (Prdm16) and uncoupling protein-1 (Ucp-1) in white adipose tissue were measured by Western blot.
Results: Obesity-resistant mice fed a high-fat diet showed resistance beginning at week 5 along with lower weights and lengths than those in the obesity group from weeks 5 to 12. MSG-induced obesity-resistant mice showed features consistent with resistance to obesity from week 1 along with higher body lengths relative to the obesity group; however, the weight difference was not significant until week 10, when body weights decreased significantly in obesity-resistant mice. The Lee index was lower in obesity-resistant mice than in the obesity group and the normal group, further suggesting obesity resistance. Additionally, obesity-resistant mice showed higher levels of leptin, whereas obese mice induced by a high-fat diet showed leptin resistance. Furthermore, Prdm16 and Ucp-1 levels were both downregulated in the obesity group and upregulated in obesity-resistant mice, showing that white fat browning was highest in obesity-resistant mice.
Conclusion: The phenotypes of mice with DIO and MSG-induced obesity differed. Obesity resistance might be related to Prdm16 and Ucp-1-mediated white adipocyte browning.
Keywords: obesity resistance, brown adipose tissue, Ucp-1, adipocyte browning
Introduction
The rapid increase in the prevalence of overweight and obese individuals is a major public health issue worldwide.1,2 Obesity is a chronic metabolic disease attributed to a long-term imbalance between energy intake and total energy expenditure resulting from interactions between environmental and genetic factors, as well as metabolic dysfunction.3 Studies of obesity in humans have raised various questions, including why some individuals are obese and others not when controlling for diet and environmental conditions. Mammals exhibit variation in susceptibility to obesity, with individuals showing obesity and obesity resistance; therefore, research to determine the factors underlying obesity resistance is important.4,5
The most common animal models of obesity are diet-induced obesity (DIO) and monosodium glutamate (MSG)-induced obesity. The high-fat-diet-induced obesity model is based on feeding high-calorie diets to induce genetically susceptible animals and form an obesity model of late-onset obesity caused by excessive calorie intake. The DIO model is more relevant to human obesity and currently considered an important model for studying obesity. The DIO model is established after 8 weeks of feeding with a high-fat diet containing 60% calories from fat.6–8 MSG-induced obesity is a type of early onset obesity resulting from MSG-induced lesions in the arcuate nucleus of neonatal mice and damage to the satiety center in neonatal mice as a result of overeating.9–11
Mammalian adipose tissues are typically divided into two types: white adipose tissue (WAT) and brown adipose tissue (BAT). WAT mainly stores energy in the form of triglycerides, is distributed under the skin, perirenal areas, and the epididymis, and is divided into subcutaneous white fat and visceral white fat according to body distribution. BAT is resistant to cold and obesity and mainly distributed in the neck, supraclavicular area, and both sides of the spine. Increased BAT results in increased heat production, which increases the thermogenic activity of BAT and BAT-like tissues and might promote energy expenditure and combat obesity. Moreover, there are more mitochondria in brown adipocytes than in white adipocytes.12–15 BAT dissipates energy by uncoupled respiration mediated by uncoupling protein-1 (Ucp-1) on mitochondria, thereby increasing fatty acid oxidation and thermogenesis. Promoting brown fat function or the acquisition of BAT characteristics within white adipose depots is called browning.
PR domain containing 16 (Prdm16) is a zinc finger transcription factor in the PR domain family that contributes to the browning of WAT. The transgenic expression of Prdm16 in adipose tissue strongly induces a thermogenic program in subcutaneous WAT that effects energy expenditure and protects against obesity and related metabolic complications.16–21 Prdm16 is distributed in various organs, including the heart, liver, kidney, brain, embryo, skeletal muscle, adipose tissue, and other tissues, and is a marker of brown adipocytes, as well as an important regulatory factor in white fat browning.22 The ectopic expression of Prdm16 converts myoblasts and white adipocytes into thermogenic brown adipocytes expressing Ucp-1, which is mainly found in the mitochondrial membrane of brown adipocytes, generates heat to maintain body temperature and energy homeostasis, and controls body weight. Ucp-1 uncouples the mitochondrial oxidative respiratory chain and catalyzes proton leakage to directly release the proton gradient as heat.11,21,23,24 However, the roles of Prdm16 and Ucp-1 in obesity resistance have not been established.
In this study, we induced obesity in C57BL/6J mice by a high-fat diet and MSG, summarized the obesity characteristics, compared energy-metabolism-related protein expression between obesity and obesity-resistance groups, and evaluated the mechanism underlying obesity resistance.
Methods
Obesity Model
C57BL/6J mice (No. SCXK2019-0003; Jinan Peng Yue Experimental Animal Breeding Co. Ltd., Jinan, China) were used to establish the obesity models. All animal experiments were conducted in compliance with the National Institutes of Health Guide for the Care and Use of Laboratory Animals and approved by the Binzhou Medical University Animal Experimentation Committee (approval No. 2017002). Animals were housed individually. For the DIO model, mice were weaned for 3 weeks after birth and fed a high-fat diet, followed by random division into two groups [normal control (NC) and DIO groups] and rearing in stainless steel cages. All mice were reared under a 12-/12-h light/dark cycle under ventilated, dry conditions at 22 ± 2°C and with ad libitum access to food and water. At 12 weeks of age, mice were divided into three groups: NC group, DIO group, and DIO-resistant group (DIO-R). The Lee index was used to assess obesity induced by a high-fat diet.
For the MSG-induced obesity model, newborn mice were subcutaneously injected with an equal dose of MSG (3.0 g/kg; Sigma-Aldrich, St. Louis, MO, USA) from day 4 after birth for 5 consecutive days. The mice were then randomly divided into two groups: the NC group and the MSG-induced obesity group (MSG group). The mice were weaned for 3 weeks after birth and raised in stainless steel cages. All mice were kept under a 12-/12-h light/dark cycle under ventilated, dry conditions at 22 ± 2°C and with ad libitum access to food and water. At 12 weeks of age, mice were divided into three groups: NC group, MSG group, and MSG-induced obesity-resistant group (MSG-R). The Lee index was used to assess obesity induced by MSG.
Detection of Growth Indexes
Each mouse was weighed with an electronic balance (Mettler Toledo, Columbus, OH, USA), and body temperature behind the ear was measured with an infrared thermometer (GUIDE, Wuhan, China). A ruler was used to measure the nose-to-anus body length, and average food intake was measured three times weekly. The Lee index was calculated as follows: body weight (g)1/3 × 103/length (cm).
Organ Weights
After blood samples were collected, all mice were dissected to obtain materials. The perirenal WAT, inguinal subcutaneous WAT, gonadal WAT, and interscapular BAT were weighed and recorded.
Determination of Serum Leptin Levels
Serum leptin was measured using a mouse leptin ELISA kit (Enzyme-linked Biotech, Shanghai, China), and the optical density of samples was analyzed at 450 nm using an enzyme standard instrument (Bio-Tek, Winooski, VT, USA).
Hematoxylin and Eosin (H&E) Staining
WAT was obtained from the animals, fixed with 4% paraformaldehyde, embedded in paraffin, and then cut into 4-mm thick slices. The slides were stained with (H&E) and measured under a microscope.
Western Blotting
The extracted adipose tissue was immersed in RIPA lysis buffer and centrifuged at 12,000g at 4°C for 20 min to obtain the supernatant. After protein extraction, a BCA kit (Thermo Fisher Scientific, Rockford, IL, USA) was used to determine protein concentration, and proteins were separated on an 8% sodium dodecyl sulfate-polyacrylamide gel and transferred to a polyvinylidene difluoride membrane. Non-specific binding was blocked with 5% skim milk for 3 h, followed by incubation with anti-Prdm16 (1:1000; Affinity, Cincinnati, OH, USA), anti-Ucp-1 (1:1000, Affinity), and anti-glyceraldehyde 3-phosphate dehydrogenase (GAPDH; 1:1000, Affinity) antibodies at 4°C overnight. Each membrane was washed with Tris-buffered saline containing Tween-20 three times for 10 min each, after which the membranes were incubated with horseradish peroxidase-conjugated IgG at room temperature for 2 h. An enhanced chemiluminescence system was used to detect the bands, and ImageJ software (v.1.37; NIH, Bethesda, MD, USA) was used for grayscale analysis. The results are presented as the ratio of the intensity of target proteins to the GAPDH band.
Statistical Analysis
All values are shown as means ± standard deviation determined using GraphPad Prism software (v.8.0.1; GraphPad Software, La Jolla, CA, USA). Expression levels of Prdm16 and Ucp-1 were analyzed by one-way analysis of variance with Dunnett’s T3 post hoc tests. All results were considered significant at a P < 0.05.
Results
Comparison of DIO and MSG-Induced Obesity Models
After mice were fed for 12 weeks, obesity symptoms differed between the DIO and MSG-induced obesity models. We used the Lee index to verify the successful establishment of the obesity models. The Lee index values for the two obesity groups differed significantly from those of the NC group. Compared with those of the other groups, mice in the DIO group showed significantly higher body weights (P < 0.001 and P < 0.01; Figure 1A), body lengths (P < 0.001; P < 0.01; P < 0.05; Figure 1B), and Lee indexes (P < 0.001; Figure 1C). Although the weights of mice in the MSG-induced obesity group were significantly lower than those of DIO mice, the body length of the former was significantly shorter. Accordingly, the Lee index was also significantly higher in the MSG-induced obesity group than in the DIO group. This result was consistent with the distinct features of MSG-induced obesity, which is characterized by a shorter body, less obvious body weight gain, and an increased Lee index. The body temperature and food intake of mice did not differ significantly between the two obesity groups or between the obesity groups and the NC group. Because MSG-induced obesity affects the hypothalamus, the body temperature of the DIO group was generally higher and more stable than that of the MSG group (Figure 1D), and food intake by mice in the MSG group was slightly higher than that in the DIO group (Figure 1E). These results indicated the successful establishment of the DIO model (characterized by increases in body length, body weight, and the Lee index) and the MSG-induced obesity model (characterized by a shorter body, lower body weight, and increased Lee index).
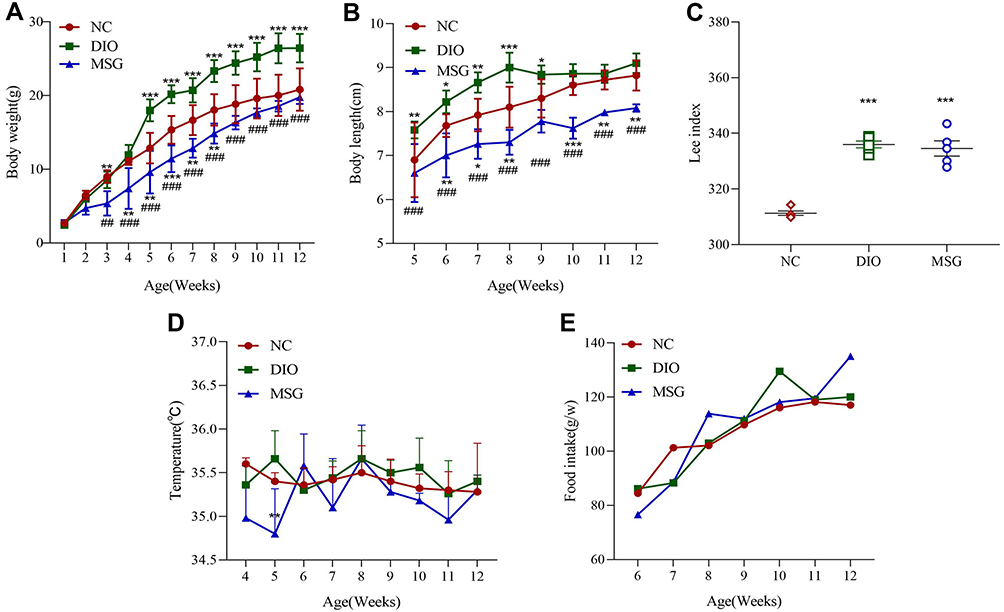 |
Figure 1 Comparison of obesity-associated characteristics in DIO and MSG-induced obese mice. (A) Body weights in the NC, DIO, and MSG groups from weeks 1 to 12 are presented as the mean ± SD (n = 5). (B) Body lengths in the three groups from weeks 5 to 12 are presented as the mean ± SD (n = 5). (C) Lee indexes in the three groups at week 12 are presented as the mean ± SD (n = 5). (D) Body temperatures in the three groups are shown as the mean ± SD (n = 5). (E) Food intake in the three groups is presented as the mean ± SD (n = 5). *P < 0.05; **P < 0.01; ***P < 0.001 vs the NC group; ##P < 0.01; ###P < 0.001 vs the DIO group. Abbreviations: DIO, diet-induced obese mice; DIO-R, diet-induced obesity-resistant mice; MSG, MSG-induced obese mice; MSG-R, MSG-induced obesity-resistant mice; NC, normal control. |
The WAT weights of DIO and MSG-induced obese mice were significantly higher than those of the NC group (P < 0.001; Figure 2A). Although the difference was not significant, the fat weight was higher in the MSG group than that in the DIO group. The BAT weight of mice did not differ significantly between the two groups (P > 0.05; Figure 2A). As shown in Figure 2, the WAT in various parts of the body differed significantly between the two obesity groups. The MSG group had higher subcutaneous and gonadal fat weights than those of the DIO group but a lower perirenal fat weight (P < 0.01 and P > 0.05; Figure 2B). These results indicated that the weight gain in the MSG-induced obesity model was more obvious.
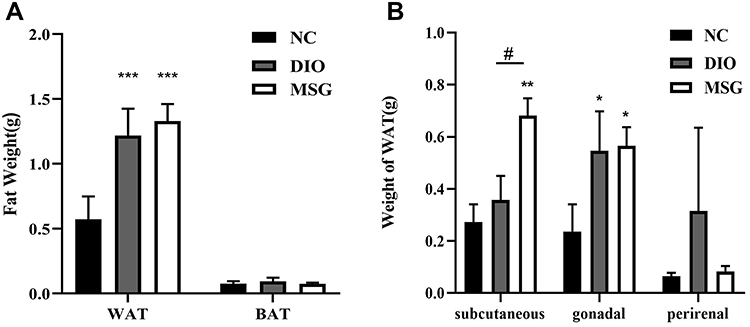 |
Figure 2 Comparison of the fat weight and WAT distribution between the MSG and DIO groups. (A) Fat weights of obese mice in the MSG and DIO groups are presented as the mean ± SD (n = 5). (B) WAT distribution in obese mice in the MSG and DIO groups are presented as the mean ± SD (n = 5). *P < 0.05; **P < 0.01; ***P < 0.001 vs the NC group; #P < 0.05 vs the DIO group. Abbreviations: DIO, mice with diet-induced obesity; DIO-R, diet-induced obesity resistance; MSG, mice with MSG-induced obesity; MSG-R, mice with MSG-induced obesity resistance; NC, normal control; WAT, white adipose tissue. |
Characteristics of Obesity Resistance in the DIO Model
We then evaluated the characteristics of obesity and obesity-resistant mice induced by a high-fat diet according to weight, length, and the Lee index. At 5 weeks of age, the body weights (P < 0.05; Figure 3A) of mice in the DIO-R group were significantly lower than those in the DIO group, and the body lengths of mice in the DIO-R group were slightly lower than those in the DIO group; however, there was no significant difference between the DIO-R and DIO groups (P > 0.05; Figure 3B). At the end of the experiment (12 weeks), the Lee index was significantly lower in the DIO-R group (Figure 3C) than in the DIO group (P < 0.05) and the NC group (P < 0.001). As shown in Figure 3D, mice in the DIO group were largest, and there was no obvious size difference between the other two groups of mice.
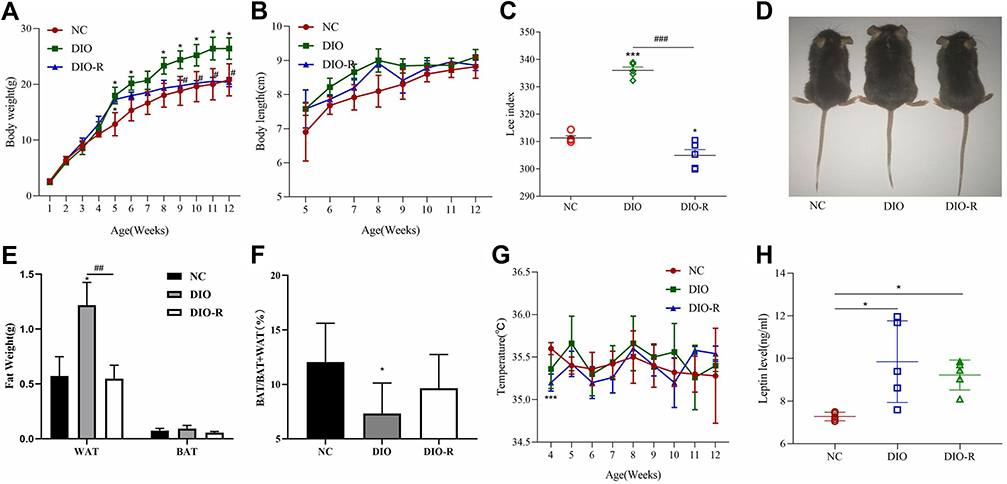 |
Figure 3 Comparison of the characteristics of high-fat diet-induced mice based on growth indicators, fat weight, and relative composition. (A) Body weights of mice from weeks 1 to 12 are presented as the mean ± SD (n = 5). (B) The body length of mice from weeks 5 to 12 are presented as the mean ± SD (n = 5). (C) Lee index was highest in the DIO group and lowest in the DIO-R group. Data represent the mean ± SD (n = 5). (D) Three mice from the same litter. The left image shows the general appearance of a normal mouse, the middle image shows an obese mouse induced by a high-fat diet, and the right image shows an obesity-resistant mouse induced by a high-fat diet. (E and F) Changes in WAT and BAT in mice with high-fat-diet-induced obesity are presented as the mean ± SD (n = 5). (G) The temperatures of mice from weeks 4 to 12 are presented as the mean ± SD (n = 5). (H) Levels of high-fat-diet-induced leptin levels in mouse serum are presented as the mean ± SD (n = 5). *P < 0.05; ***P < 0.001 vs the NC group. #P < 0.05; ##P < 0.01; ###P < 0.001 vs the DIO group. Abbreviations: BAT, brown adipose tissue; WAT, white adipose tissue; DIO, diet-induced obesity; DIO-R, diet-induced obesity resistance; NC, normal control. |
Because the weight of adipose tissue can provide a more intuitive representation of the characteristics of obesity and obesity resistance, we compared the WAT and BAT weights among the three groups. Compared with those in the NC group, the WAT weight (P > 0.05) and BAT weight (P > 0.05) were not significantly different in the DIO-R group. However, the WAT weight in the DIO-R group was lower than that in the DIO group (P < 0.01; Figure 3E). As shown in Figure 3F, the ratio of the BAT weight to the total adipose tissue weight was lower in the obesity-resistant group than in the NC group. Additionally, the decrease in the relative BAT weight was significant in the DIO group but not in the DIO-R group (P < 0.05 and P > 0.05; Figure 3F). Although body temperature did not differ significantly between the DIO and DIO-R groups, it was generally lower in the DIO-R group and showed greater fluctuations (Figure 3G). These results indicated that mice in the DIO-R group had lower weights, body lengths, and Lee indexes and higher brown fat contents than those of mice in the DIO group.
Leptin, a hormone most closely related to obesity, is secreted by adipose tissue and involved in regulating energy metabolism, increasing energy consumption, and inhibiting adipocyte synthesis to reduce body weight.25 In the present study, we found that serum leptin levels were significantly higher in both the DIO and DIO-R groups than in the NC group (P < 0.05; Figure 3H), although there was no significant difference between the two groups (P>0.05; Figure 3H). These results showed the body weight of mice in the DIO group was higher than that of mice in the DIO-R group, and that serum leptin levels in the DIO group were also slightly higher. This suggested that the sensitivity of DIO mice to leptin response decreased, whereas that of DIO-R mice did not and DIO-R may be influenced by leptin and show obesity resistance.
Characteristics of Obesity Resistance in the MSG Model
We then compared the characteristics of MSG-induced obesity and obesity-resistant mice. After 10 weeks of age, the body weight tended to decrease in the MSG-R group and was significantly lower than that in the MSG group at 11 weeks of age (P < 0.01 and P < 0.05; Figure 4A). At 2 weeks of age, the body lengths in the MSG and MSG-R groups were significantly shorter than those of the NC group and lowest in the MSG group (P < 0.01 and P < 0.05; Figure 4B). Additionally, the Lee index was significantly higher in the MSG-induced obesity group than in the NC group (P < 0.001) and significantly lower in the MSG-R group than in the MSG group (P < 0.001 Figure 4C). As shown in Figure 4D, mice in the MSG group were the shortest and showed the highest fat accumulation as compared with the other two groups.
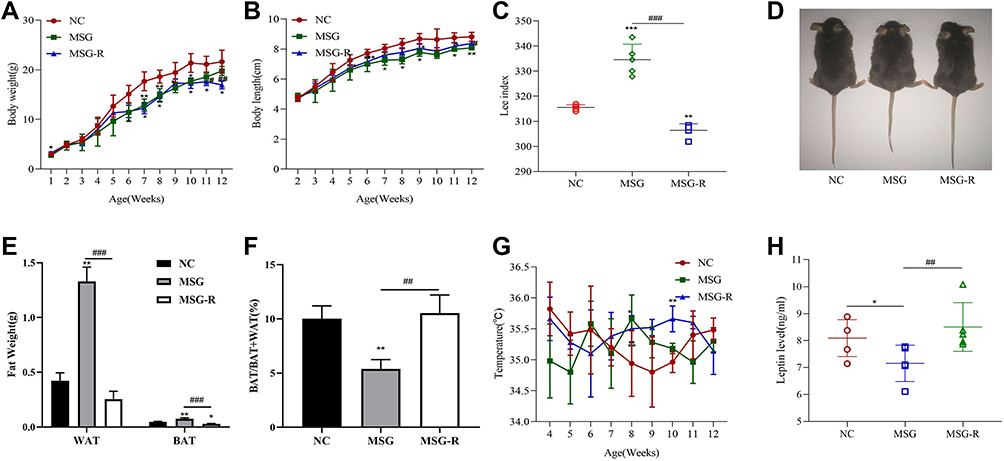 |
Figure 4 Comparison of the characteristics of mice induced by MSG based on growth indicators, fat weight, and relative compositions. (A) Body weights of mice from weeks 1 to 12 are presented as the mean ± SD (n = 5). (B) Body lengths of mice from weeks 2 to 12 are presented as the mean ± SD (n = 5). (C) The Lee index was highest in the MSG group and lowest in the MSG-R group. Data represent the mean ± SD (n = 5). (D) Three mice from the same litter. The image on the left shows the general appearance of a normal mouse, the middle image shows an obese mouse induced by MSG, and the right image shows an obesity-resistant mouse induced by MSG. (E and F) Changes in WAT and BAT in mice with MSG-induced obesity are presented as the mean ± SD (n = 5). (G) Temperatures of mice from weeks 4 to 12 are presented as the mean ± SD (n = 5). (H) Levels of MSG-induced leptin levels in mouse serum are presented as the mean ± SD (n = 5). *P < 0.05; **P < 0.01; ***P < 0.001 vs the NC group; #P < 0.05; ##P < 0.01; ###P < 0.001 vs the MSG group. Abbreviations: BAT, brown adipose tissue; WAT, white adipose tissue; MSG, mice with MSG-induced obesity; MSG-R, MSG-induced obesity resistant; NC, normal controls. |
We also compared WAT and BAT weights among the three groups. The WAT and BAT weights of the MSG-R group were significantly lower than those in the MSG group (P < 0.001; Figure 4E). As shown in Figure 4F, the relative BAT weight in the MSG-R group increased significantly relative to that in the obesity group (P < 0.01; Figure 4F). There was no significant difference in body temperature between the MSG and MSG-R groups, and the body temperature of the MSG-R group was generally high, with substantial fluctuations (P > 0.05; Figure 4G). Accordingly, the MSG-R group exhibited a reduced weight, increased body length, reduced Lee index, and reduced fat weight but an increase in the relative BAT weight.
As shown in Figure 4H, leptin levels in the MSG-R and NC groups were significantly higher than those in the MSG group, and those in the MSG-R group were slightly higher than those in the NC group, although there was no significant difference (P < 0.01, P < 0.05, and P > 0.05, respectively; Figure 4H). These results showed that different from results from obesity induced by a high-fat diet, leptin levels in the MSG group were significantly lower than those in the MSG-R group. This suggested that MSG-R mice were sensitive to leptin, increased energy expenditure, resistant to obesity.
Adipose Browning is Involved in Obesity Resistance
White adipocytes and brown adipocytes exhibit different morphologies and functions. White adipocytes are single-locular, large lipid droplets, whereas brown adipocytes are multi-locular, small lipid droplets.16 In the present study, the DIO-R group showed smaller lipid droplets and a higher number of these around local large lipid droplets as compared with compared with the DIO and NC groups (Figure 5A and B). Similarly, the lipid droplet volume of adipocytes in the MSG-R group decreased, with the volume observed in the MSG group being the largest. Moreover, H&E staining showed that the lipid droplets in obesity-resistant mice of the two models decreased in size and appeared similar to brown adipocytes, which was a manifestation of WAT browning.
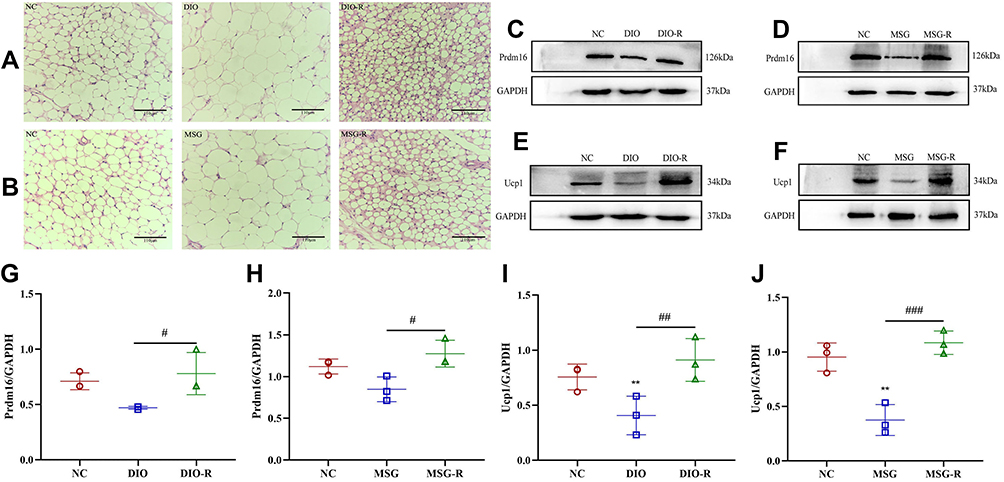 |
Figure 5 Prdm16 and Ucp-1 expression in subcutaneous WAT and comparison of serum leptin levels in each group. (A and B) H&E staining in the inguinal subcutaneous WAT of mice induced by DIO and MSG (scale bar = 110 μm). (C and D) Prdm16 expression in the adipose tissue of mice induced by DIO and MSG according to Western blot. (E and F) Ucp-1 expression in the adipose tissue of mice induced by DIO and MSG according to Western blot. (G) Immunoreactivity of Prdm16 in the adipose tissue of mice induced by a high-fat diet and presented as the mean ± SD (n = 3). #P < 0.05 vs the DIO group. (H) Immunoreactivity of Prdm16 in the adipose tissue of mice induced by MSG and presented as the mean ± SD (n = 3). #P < 0.05 vs the MSG group. (I) Immunoreactivity of Ucp-1 in the adipose tissue of mice induced by a high-fat diet and presented as the mean ± SD (n = 3). **P < 0.01 vs the NC group. ##P < 0.01 vs the DIO group. (J) Immunoreactivity of Ucp-1 in the adipose tissue of mice induced by MSG and presented as the mean ± SD (n = 3). **P < 0.01 vs the NC group. ###P < 0.001 vs the MSG group. Abbreviations: DIO, diet-induced obesity; MSG, mice with MSG-induced obesity; NC, normal control; Prdm16, PR domain containing 16; Ucp-1, uncoupling protein-1. |
Prdm16 is an important regulator of the browning process in white fat, and Prdm16 overexpression can significantly increase the number of brown adipocytes, which determines the browning of subcutaneous white fat. Compared with levels in the NC group, Prdm16 protein expression in subcutaneous white fat was downregulated in DIO and MSG-induced obese mice. Additionally, Prdm16 levels in the DIO-R and MSG-R groups were significantly higher than those in the corresponding obesity groups (P < 0.05; Figure 5C, D, G, and H), and Ucp-1 levels in the DIO-R and MSG-R groups were significantly higher than those in the corresponding obesity groups (P < 0.001 and P < 0.01, respectively; Figure 5E, F, I, and J). Moreover, Prdm16 and Ucp-1 levels in the obesity-resistant group were slightly higher than those in the corresponding NC groups but did not differ significantly between the obesity-resistant and NC group (P > 0.05; Figure 5G–J). As shown in Figure 5, parallel results for the two browning marker proteins indicated elevated expression in obesity-resistant mice, indicating that obesity resistance is associated with a high browning level and involves Prdm16.
Discussion
Because modern technology has led to a sedentary lifestyle, obesity has become a global epidemic, with increases in diet-associated obesity and hypothalamic obesity due to genetic and environmental factors. In this study, we analyzed obesity mouse models based on body weight, body length, body temperature, food intake, fat weight, and Lee index values.
DIO and MSG-induced obesity are typical models used in obesity research; however, the phenotypic characteristics of the two models have not been compared in detail. Here, the data showed that mice with DIO and MSG-induced obesity had distinct characteristics. Specifically, the DIO model was characterized by a heavier weight, longer body length, and higher Lee index than those of the NC. A high-fat diet can disrupt the balance between insulin and glucose, promote fat and sugar metabolism, and cause glucose and lipid metabolism disorders, as well as the ectopic deposition of adipose tissue. Typical symptoms of obesity include a large body size and increased visceral fat.26 The MSG-induced obesity model was characterized by a significant increase in the Lee index due to fat accumulation and a short body length without an increase in body weight. In animal models of MSG-induced obesity, hypothalamic injury disrupts feeding, and hypothalamic neuropeptides comprise different cell nuclei and form a complex regulatory network that regulates eating behavior and energy balance.27–30
BAT represents a site of adaptive non-shivering thermogenesis and major calorie-consuming tissue in mammals. Previous studies show that a higher proportion of BAT relative to total adipose tissue content is associated with increased heat production, with increased thermogenic activity of BAT and BAT-like tissues possibly promoting energy expenditure to counteract obesity.31,32 Here, the experimental results further verified the importance of BAT in energy metabolism and obesity resistance. In the present study, obesity-resistant mice showed resistance characteristics beginning at week 5 after high-fat feeding. Additionally, obesity-resistant mice demonstrated suppressed lipogenesis and intensive fatty-acid oxidation in visceral fat. To maintain homeostasis, obesity-resistant mammals tend to reduce food intake and/or increase energy expenditure as they accumulate fat.33 We suggest that these characteristics might contribute to the formation of phenotypes in obesity-resistant mice or be a consequence of the low susceptibility to high-fat diet-induced weight or fat gain. However, obesity resistance in the MSG-R mice appeared at the beginning of the experiment, and the resistance characteristics were very obvious at week 10. MSG-induced obese mice present many features, including disruption of the arcuate nucleus, reduction of growth-hormone secretion, a slowed rate of growth, and a relatively small body size.34 MSG-induced obesity affects the hypothalamus, which leads to disturbances in thermoregulation and presents as substantial fluctuations in body temperature. Individuals who develop obesity resistance may avoid fat accumulation and obesity via improved fat oxidization, with resistance also potentially affected by genes related to energy metabolism.35 We cannot exclude the possibility that individual mice were insensitive to MSG drugs. Leptin is the hormone most closely related to obesity, and under normal circumstances, mice lose weight due to increased leptin levels. A possible explanation of the obesity-resistance observed in mice in the two different models might be related to the increased leptin levels. MSG-induced obese mice experience obesity as a result of low leptin levels, whereas obese mice induced by a high-fat diet can develop leptin resistance due to reduced leptin sensitivity, resulting in an obese state.
We also investigated the mechanism underlying obesity resistance by observing the morphological changes of subcutaneous fat in the groin and evaluating the brown adipocyte marker protein Prdm16 and the thermogenic protein Ucp-1 on the mitochondrial membrane, as well as the level of WAT browning. Studies confirmed that brown fat-mediated Ucp-1 is activated under conditions of a strong thermogenic response caused by a high-fat diet, thereby contributing to obesity resistance.36–38 Additionally, the transgenic overexpression of Prdm16 in fat tissues stimulates the development of Ucp-1-expressing brown-like fat cells in subcutaneous WAT and induces a thermogenic program with potent effects on energy expenditure.16,39 Moreover, under a high-fat diet, increasing “white fat browning” can improve insulin sensitivity and reduce weight gain.32 In both the DIO and MSG-induced obesity-resistant mouse models, the results of morphological experiments showed that the subcutaneous WAT in obesity-resistant mice resembled small lipid droplets similar to brown adipocytes, resulting in browning of white fat. Furthermore, the expression levels of Prdm16 and Ucp-1 in the subcutaneous WAT of obesity-resistant mice were significantly higher than those in normal and obese mice. The obesity group showed the lowest Prdm16 and Ucp-1 expression levels, suggesting that obesity-resistant mice had the highest level of white fat browning. The ectopic expression of Prdm16 and Ucp-1 was consistent with the presence of brown adipocytes within white adipocytes in the two obesity models. Brown adipocytes consume energy and counteract obesity by a unique thermogenic mechanism, and Prdm16 expression determines the thermogenic program in brown adipocytes. Notably, excessive energy intake activates thermogenesis, and the potential for energy expenditure depends on Ucp-1. Increases in the levels of these two proteins can reportedly prevent obesity;40 therefore, we speculate that elevated Prdm16 expression induces the formation of brown fat-like adipocytes in WAT, promotes subcutaneous white fat browning, and increases the number of brown adipocytes, which subsequently increases Ucp-1 expression in the mitochondria of brown adipocytes and stimulates thermogenic programs for the development of obesity resistance.
In the future, further studies on the mechanisms involved in the occurrence of obesity resistance are required; understanding these mechanisms may be an interesting area in the field of metabolism research.
Conclusion
In summary, we found that mice with high-fat diet resulted in longer body length, obese mice, while those with MSG-induced mice with a dumpy appearance and fat accumulation. Our findings indicate that obesity resistance may be related to the high expression of Prdm16 and Ucp-1, which can promote white adipocyte browning, activate thermogenesis, stimulate energy expenditure, and contribute to obesity-resistance development.
Acknowledgments
This study was supported by grants from the National Natural Science Foundation of China (Grant No. 81500930, 81801192) and the Natural Science Foundation of Shandong Province (Grant No. ZR2012HM057, ZR2014HQ014).
Disclosure
The authors report no conflict of interest in this work.
References
1. Butterick TA, Billington CJ, Kotz CM, Nixon JP. Orexin: pathways to obesity resistance? Rev Endocr Metab Disord. 2013;14(4):357–364. doi:10.1007/s11154-013-9259-3
2. Kotz C, Nixon J, Butterick T, Perez-Leighton C, Teske J, Billington C. Brain orexin promotes obesity resistance. Ann N Y Acad Sci. 2012;1264(1):72–86. doi:10.1111/j.1749-6632.2012.06585.x
3. GBD 2015 Obesity Collaborators. Health effects of overweight and obesity in 195 countries over 25 years. N Engl J Med. 2017;377(1):13–27.
4. Bulik CM, Allison DB. The genetic epidemiology of thinness. Obes Rev. 2001;2(2):107–115. doi:10.1046/j.1467-789x.2001.00030.x
5. Wang Y, Diao S, Hu M, Zhang L. Methylation of hypothalamic Tsc1-mTOR signaling in regulation of obesity and obesity resistance. Biomed Res Int. 2020;2020:8723869. doi:10.1155/2020/8723869
6. de Moraes C, Davel AP, Rossoni LV, Antunes E, Zanesco A. Exercise training improves relaxation response and SOD-1 expression in aortic and mesenteric rings from high caloric diet-fed rats. BMC Physiol. 2008;8:12. doi:10.1186/1472-6793-8-12
7. Levin BE, Triscari J, Sullivan AC. Altered sympathetic activity during development of diet-induced obesity in rat. Am J Physiol. 1983;244(3):R347–R355.
8. Halade GV, Rahman MM, Williams PJ, Fernandes G. High fat diet-induced animal model of age-associated obesity and osteoporosis. J Nutr Biochem. 2010;21(12):1162–1169. doi:10.1016/j.jnutbio.2009.10.002
9. Dawson R, Annau Z. A behavioral assessment of arcuate nucleus damage after a single injection of monosodium glutamate. Neurobehav Toxicol Teratol. 1983;5(4):399–406.
10. Bunyan J, Murrell EA, Shah PP. The induction of obesity in rodents by means of monosodium glutamate. Br J Nutr. 1976;35(1):25–39. doi:10.1079/BJN19760005
11. Yulyaningsih E, Rudenko IA, Valdearcos M, et al. Acute lesioning and rapid repair of hypothalamic neurons outside the blood-brain barrier. Cell Rep. 2017;19(11):2257–2271. doi:10.1016/j.celrep.2017.05.060
12. Lidell ME, Betz MJ, Enerback S. Two types of brown adipose tissue in humans. Adipocyte. 2014;3(1):63–66. doi:10.4161/adip.26896
13. Kaisanlahti A, Glumoff T. Browning of white fat: agents and implications for beige adipose tissue to type 2 diabetes. J Physiol Biochem. 2019;75(1):1–10. doi:10.1007/s13105-018-0658-5
14. Petrovic N, Walden TB, Shabalina IG, Timmons JA, Cannon B, Nedergaard J. Chronic peroxisome proliferator-activated receptor gamma (PPARgamma) activation of epididymally derived white adipocyte cultures reveals a population of thermogenically competent, UCP-1containing adipocytes molecularly distinct from classic brown adipocytes. J Biol Chem. 2010;285(10):7153–7164.
15. Seale P, Kajimura S, Yang W, et al. Transcriptional control of brown fat determination by PRDM16. Cell Metab. 2007;6(1):38–54. doi:10.1016/j.cmet.2007.06.001
16. Fenzl A, Kiefer FW. Brown adipose tissue and thermogenesis. Horm Mol Biol Clin Investig. 2014;19(1):25–37.
17. Peirce V, Carobbio S, Vidal-Puig A. The different shades of fat. Nature. 2014;510(7503):76–83. doi:10.1038/nature13477
18. Harms M, Seale P. Brown and beige fat: development, function and therapeutic potential. Nat Med. 2013;19(10):1252–1263. doi:10.1038/nm.3361
19. Blondin DP, Labbé SM, Tingelstad HC, et al. Increased brown adipose tissue oxidative capacity in cold-acclimated humans. J Clin Endocrinol Metab. 2014;99(3):438–446. doi:10.1210/jc.2013-3901
20. Schulz TJ, Huang TL, Tran TT, et al. Identification of inducible brown adipocyte progenitors residing in skeletal muscle and white fat. Proc Natl Acad Sci USA. 2011;108(1):143–148. doi:10.1073/pnas.1010929108
21. Shinoda K, Luijten IH, Hasegawa Y, et al. Genetic and functional characterization of clonally derived adult human brown adipocytes. Nat Med. 2015;21(4):389–394. doi:10.1038/nm.3819
22. Arndt AK, Schafer S, Drenckhahn JD, et al. Fine mapping of the 1p36 deletion syndrome identifies mutation of PRDM16 as a cause of cardiomyopathy. Am J Hum Genet. 2013;93(1):67–77. doi:10.1016/j.ajhg.2013.05.015
23. Liu J, Wang Y, Lin L. Small molecules for fat combustion: targeting obesity. Acta Pharm Sin B. 2019;9(2):220–236. doi:10.1016/j.apsb.2018.09.007
24. Gesta S, Tseng YH, Kahn CR. Developmental origin of fat: tracking obesity to its source published correction appears in Cell. Cell. 2007;131(2):242–256. doi:10.1016/j.cell.2007.10.004
25. de Luis DA, Perez Castrillón JL, Dueñas A. Leptin and obesity. Minerva Med. 2009;100(3):229–236.
26. Li S, Brown MS, Goldstein JL. Bifurcation of insulin signaling pathway in rat liver: mTORC1 required for stimulation of lipogenesis, but not inhibition of gluconeogenesis. Proc Natl Acad Sci USA. 2010;107(8):3441–3446. doi:10.1073/pnas.0914798107
27. Das UN. Is metabolic syndrome X a disorder of the brain with the initiation of low-grade systemic inflammatory events during the perinatal period? J Nutr Biochem. 2007;18(11):701–713. doi:10.1016/j.jnutbio.2007.01.002
28. Jeanrenaud B, Rohner-Jeanrenaud F, Cusin I, et al. The importance of the brain in the aetiology of obesity and type 2 diabetes. Int J Obes Relat Metab Disord. 1992;16(Suppl 2):S9–S12.
29. Benoit SC, Air EL, Coolen LM, et al. The catabolic action of insulin in the brain is mediated by melanocortins. J Neurosci. 2002;22(20):9048–9052. doi:10.1523/JNEUROSCI.22-20-09048.2002
30. Sternson SM, Shepherd GM, Friedman JM. Topographic mapping of VMH –> arcuate nucleus microcircuits and their reorganization by fasting. Nat Neurosci. 2005;8(10):1356–1363. doi:10.1038/nn1550
31. Solinas G, Summermatter S, Mainieri D, et al. The direct effect of leptin on skeletal muscle thermogenesis is mediated by substrate cycling between de novo lipogenesis and lipid oxidation. FEBS Lett. 2004;577(3):539–544. doi:10.1016/j.febslet.2004.10.066
32. Gulyaeva O, Dempersmier J, Sul HS. Genetic and epigenetic control of adipose development. Biochim Biophys Acta Mol Cell Biol Lipids. 2019;1864(1):3–12. doi:10.1016/j.bbalip.2018.04.016
33. Sá FG, Lima-Leopoldo AP, Jacobsen BB, et al. Obesity resistance promotes mild contractile dysfunction associated with intracellular Ca2+ handling. Arq Bras Cardiol. 2015;105(6):588–596.
34. Tiraby C, Langin D. Conversion from white to brown adipocytes: a strategy for the control of fat mass? Trends Endocrinol Metab. 2003;14(10):439–441. doi:10.1016/j.tem.2003.10.001
35. Boi SK, Buchta CM, Pearson NA, et al. Obesity alters immune and metabolic profiles: new insight from obese-resistant mice on high-fat diet. Obesity. 2016;24(10):2140–2149. doi:10.1002/oby.21620
36. Cao PJ, Jin YJ, Li ME, Zhou R, Yang MZ. PGC-1α may associated with the anti-obesity effect of taurine on rats induced by arcuate nucleus lesion. Nutr Neurosci. 2016;19(2):86–93. doi:10.1179/1476830514Y.0000000153
37. Kus V, Prazak T, Brauner P, et al. Induction of muscle thermogenesis by high-fat diet in mice: association with obesity-resistance. Am J Physiol Endocrinol Metab. 2008;295(2):356–367. doi:10.1152/ajpendo.90256.2008
38. Minokoshi Y, Kim YB, Peroni OD, et al. Leptin stimulates fatty-acid oxidation by activating AMP-activated protein kinase. Nature. 2002;415(6869):339–343. doi:10.1038/415339a
39. Seale P, Conroe HM, Estall J, et al. Prdm16 determines the thermogenic program of subcutaneous white adipose tissue in mice. J Clin Invest. 2011;121(1):96–105. doi:10.1172/JCI44271
40. Stefl B, Janovská A, Hodný Z, et al. Brown fat is essential for cold-induced thermogenesis but not for obesity resistance in aP2-Ucp mice. Am J Physiol. 1998;274(3):527–533.
 © 2021 The Author(s). This work is published and licensed by Dove Medical Press Limited. The full terms of this license are available at https://www.dovepress.com/terms.php and incorporate the Creative Commons Attribution - Non Commercial (unported, v3.0) License.
By accessing the work you hereby accept the Terms. Non-commercial uses of the work are permitted without any further permission from Dove Medical Press Limited, provided the work is properly attributed. For permission for commercial use of this work, please see paragraphs 4.2 and 5 of our Terms.
© 2021 The Author(s). This work is published and licensed by Dove Medical Press Limited. The full terms of this license are available at https://www.dovepress.com/terms.php and incorporate the Creative Commons Attribution - Non Commercial (unported, v3.0) License.
By accessing the work you hereby accept the Terms. Non-commercial uses of the work are permitted without any further permission from Dove Medical Press Limited, provided the work is properly attributed. For permission for commercial use of this work, please see paragraphs 4.2 and 5 of our Terms.