")
Back to Journals » Clinical Pharmacology: Advances and Applications » Volume 9
Practical recommendations for the use of therapeutic drug monitoring of biopharmaceuticals in inflammatory diseases
Authors Dreesen E, Bossuyt P, Mulleman D, Gils A , Pascual-Salcedo D
Received 26 April 2017
Accepted for publication 4 July 2017
Published 3 October 2017 Volume 2017:9 Pages 101—111
DOI https://doi.org/10.2147/CPAA.S138414
Checked for plagiarism Yes
Review by Single anonymous peer review
Peer reviewer comments 2
Editor who approved publication: Professor Arthur E. Frankel
Erwin Dreesen,1 Peter Bossuyt,2,3 Denis Mulleman,4 Ann Gils,1 Dora Pascual-Salcedo5
1Laboratory for Therapeutic and Diagnostic Antibodies, Department of Pharmaceutical and Pharmacological Sciences, KU Leuven, Leuven, 2Imelda GI Clinical Research Centre, Imelda Ziekenhuis, Bonheiden, 3Translational Research in GastroIntestinal Disorders (TARGID), Department of Clinical and Experimental Medicine, KU Leuven, Leuven, Belgium; 4Department of Rheumatology, Université François-Rabelais de Tours, CNRS, UMR 7292, Tours, France; 5Institute for Research IdiPAZ, University Hospital La Paz, Madrid, Spain
Abstract: Biopharmaceuticals directed against tumor necrosis factor-alpha, integrins, interleukins, interferons and their receptors have become key agents for the management of inflammatory diseases in the fields of gastroenterology, rheumatology, dermatology and neurology. However, response to these treatments is far from optimal. Therapeutic failure has been attributed in part to inadequate serum concentrations of the drug and the formation of antidrug antibodies (ADA). Therapeutic drug monitoring (TDM) based on drug concentrations and ADA represents a pharmacologically sound tool for guiding dosage adjustments to optimize exposure. Although becoming standard practice in tertiary care centers, the widespread accessibility and recognition of TDM is hindered by several hurdles, including a lack of education of health care providers on TDM. In this paper, the Monitoring of monoclonal Antibodies Group in Europe (MAGE) provides an introduction on the fundamental principles of the concept of TDM, aiming to educate clinicians and assist them in the process of implementing TDM of anti-inflammatory biopharmaceuticals.
Keywords: therapeutic drug monitoring, biopharmaceuticals, trough concentration, immunogenicity, antidrug antibodies, inflammatory diseases
Setting the scene
The approval of interferon beta-1b in 1995 by the European Medicines Agency (EMA) marked the start of a new therapeutic era for inflammatory diseases. This biopharmaceutical structurally and functionally mimics the cytokine interferon beta and is registered for the treatment of patients with relapsing–remitting multiple sclerosis (MS). One year later, the US Food and Drug Administration (FDA) approved interferon beta-1a for the same indication. In 1998, FDA approved the marketing of infliximab, a chimeric (sub-stem -xi-) monoclonal antibody targeting the pro-inflammatory cytokine tumor necrosis factor (TNF)-alpha, for the treatment of moderate-to-severe, active Crohn’s disease (CD) or fistulizing CD in patients who have not responded to conventional treatments such as a corticosteroid and/or an immunosuppressant. Also in 1998, etanercept, another TNF antagonist, was approved for reducing the signs and symptoms of active rheumatoid arthritis (RA) in patients with an unsatisfactory response to disease-modifying drugs. Unlike infliximab, etanercept was a fusion protein consisting of two identical chains of the recombinant human TNF receptor p75 monomer and the Fc domain of human IgG1. One year later, in 1999, the indication for infliximab was extended for the treatment of patients with RA. In 2002, yet another TNF antagonist was granted market authorization by FDA for the treatment of RA, adalimumab, which is a fully human (sub-stem -mu-) antibody. It was only until 2004, with the approval of natalizumab for the treatment of relapsing MS, that a novel inflammatory marker was targeted. Natalizumab is a humanized (sub-stem -zu-) monoclonal antibody that binds to the α4 integrin subunit, thereby preventing the migration of mononuclear leukocytes across the endothelium into the inflamed tissue. These biopharmaceuticals paved the way for many new monoclonal antibodies, antibody fragments (eg, certolizumab pegol, a pegylated Fab fragment), antibody fusion proteins and interferons, directed toward a wide spectrum of anti-inflammatory targets (Table 1).1
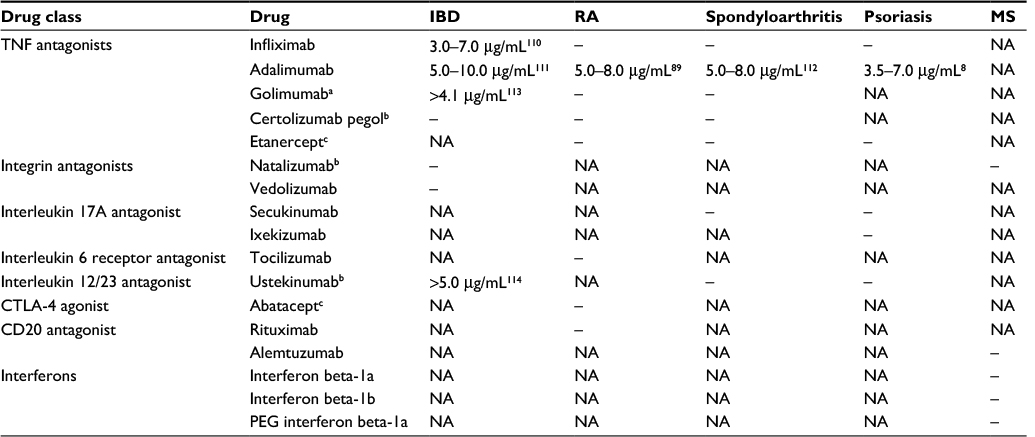 | Table 1 Biopharmaceuticals approved for the treatment of inflammatory diseases and their target trough concentration (range) during maintenance therapy Notes: aMarket authorization for ulcerative colitis only. bMarket authorization for Crohn’s disease only by FDA. cIgG1 Fc fusion protein. –, No target concentration (range) for performing TDM has been established yet. The presented thresholds should be interpreted with caution as they are highly dependent on the cohort in which established (eg, influence of disease type and disease activity), the assays used (eg, different calibrators) and the targeted outcome. Abbreviations: CD20, cluster of differentiation 20; CTLA-4, cytotoxic T lymphocyte-associated antigen 4; FDA, US Food and Drug Administration; IBD, inflammatory bowel disease; MS, multiple sclerosis; NA, not applicable; PEG, polyethylene glycol; RA, rheumatoid arthritis; TDM, therapeutic drug monitoring; TNF, tumor necrosis factor. |
The success of the therapeutic biopharmaceuticals is tapered by the fact that not all patients respond well to these treatments. For example, the rate of primary nonresponse to TNF antagonists in inflammatory bowel disease (IBD) is 10–40%.2 Most patients do experience an initial response, but have later relapses (ie, secondary loss of response). Up to 40% of the patients with IBD experience secondary loss of response within the first year of the infliximab or adalimumab therapy.3,4 The absence of a therapeutic response is often correlated with subtherapeutic drug serum concentrations, which might be due to antidrug antibody (ADA) formation.5–8 In the early years of biopharmaceutical therapies, the lack of therapeutic alternatives made it imperative to develop strategies to deal with primary nonresponse and loss of response. Along with the expanding therapeutic armamentarium, there is a large potential for improved patient care, but it might also open the door for “trial-and-error medicine” with the risk of suboptimal care for a higher price.9 The optimal use of these expensive treatments guided by therapeutic drug monitoring (TDM) can lead to prolonged remission and a better cost-effectiveness.
What is TDM?
TDM is a clinical decision-making tool that enables dosage regimen adjustments based on clinical and laboratory measurements, typically drug blood concentrations, to reach drug exposure that is associated with the highest possible response rate (Figure 1).10 Two fundamental, however not sufficient, requirements to performing TDM are 1) the accessibility of (commercial) assays to measure the concentration of biopharmaceuticals in blood and 2) the availability of studies that correlate drug blood concentrations with clinical effectiveness and with drug-related toxicity, generating recommendations for therapeutic target concentrations. Based on these studies, drug and disease-specific innovative treatment algorithms are to be developed and (cost) effectiveness needs to be compared to standard care in prospective clinical studies.11–23
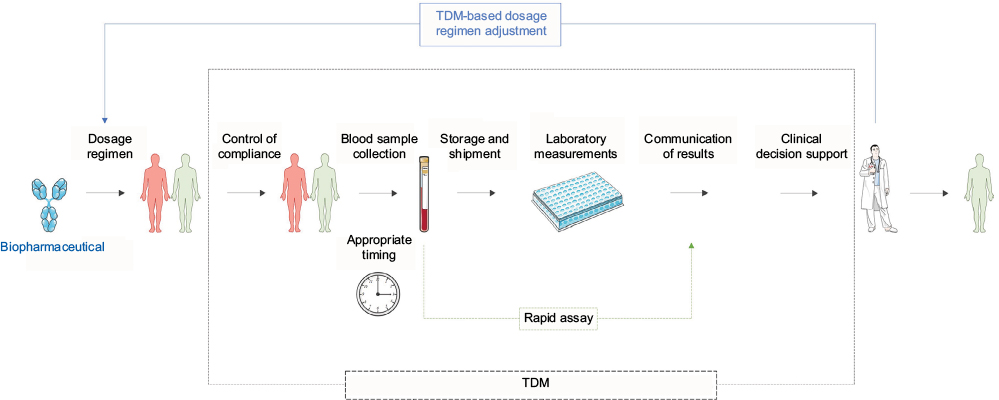 | Figure 1 Summary of the TDM process for optimization of the treatment with anti-inflammatory biopharmaceuticals. Abbreviation: TDM, therapeutic drug monitoring. |
Especially for the older people, more established drugs such as infliximab and adalimumab, the immunogenicity–exposure–response correlations have been extensively demonstrated in IBD, inflammatory rheumatic diseases and psoriasis.5–8 However, for the other biopharmaceuticals such as certolizumab pegol, golimumab, vedolizumab, ustekinumab, secukinumab, alemtuzumab and abatacept, data supporting a role for TDM are still particularly scarce.20,22,24–31
Why perform TDM of biopharmaceuticals?
The main reason to perform TDM of biopharmaceuticals is to provide the clinician with an objective tool to guide the therapeutic procedure. Clinicians and laboratories need to be made aware of the large variability in drug kinetics between patients and even within a patient over time. A more than 10-fold interindividual variation in trough concentrations (ie, the serum or plasma concentration just before a next infusion) has been described.26,32–34 Furthermore, adequate drug trough concentrations have been linked to response (clinical response, biomarker response, endoscopic response, etc) in different inflammatory diseases.18–22 As the correlation between drug blood concentrations and outcome is stronger than between dose and outcome, measuring drug concentrations is an essential part of TDM, and allows optimization of the therapeutic dosage regimen and thereby improvement of the response. Besides its therapeutic benefit, TDM can also avoid unnecessary therapeutic interventions and subsequently reduce costs.12,13,35
When to perform TDM?
Different clinical scenarios for performing TDM are suggested in literature and essentially come down to performing testing for drug and ADA, linking the test results to dosage regimen adaptations to induce (ie, reactive TDM) and maintain (ie, proactive TDM) adequate drug exposure and thereby response (Table 2).36–38
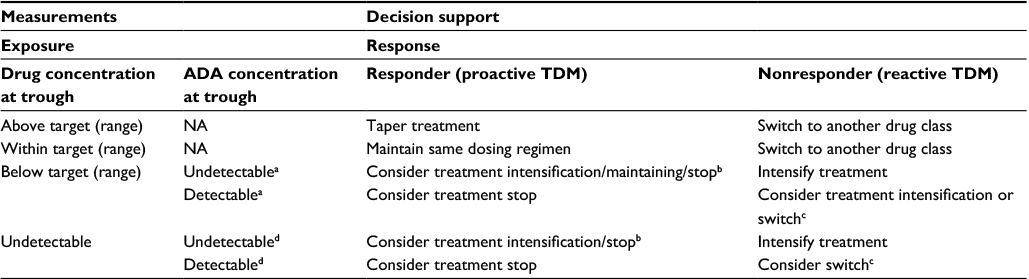 | Table 2 Generic TDM algorithm for biopharmaceutical therapies of patients with inflammatory diseases Notes: TDM algorithms typically provide decision support based on the measurement of drug and ADA concentrations. aUse a drug-tolerant ADA assay. bThe clinical evidence for different decision support options may vary between drugs/indications. cSwitch within drug class or to another drug class. dUse a drug-sensitive ADA assay. Always check for patient compliance in case of self-administered biopharmaceuticals, especially when drug concentrations are below the target (range). Change in dosage regimen is under responsibility of the treating clinician and it is necessary to assess for clinical response and drug concentration thereafter. Abbreviations: ADA, antidrug antibody; NA, not applicable; TDM, therapeutic drug monitoring. |
Subtherapeutic concentrations in the early stages of therapy, possibly as a result of high disease activity and/or to the production of ADA, are often associated with loss of response in the first year of treatment.6,39,40 Hence, performing TDM during induction and early maintenance therapy is useful to alert the clinician about the risk of clinical failure.2,41,42 Moreover, TDM can be used to identify real primary nonresponders having an adequate exposure to the drug.
A single measurement may be insufficient for problem-solving. To gain insight into the pharmacokinetic (PK) evolution over time in each patient, it is helpful to measure consecutive trough concentrations (eg, over three or four administrations). This is because disease activity might influence the drug’s PKs, and therefore trough concentrations may differ within a patient over time.43–46 Measuring consecutive trough samples and interpreting the drug concentrations with regard to the evolution of the therapeutic response provide a patient-specific “reference” trough concentration that is associated with response. Some patients have a good response with lower levels than others and this is intrinsic to each individual. However, this concept of patient-specific targets conflicts with the widely used “one-size-fits-all” target trough concentration concept, but clinical evidence is currently lacking.
One should always be aware of the factors that (may) cause interindividual and inter-occasion variability in drug exposure such as the changes in the dosage regimen (dose and/or dosing interval), changes in absorption and volume of distribution (which cannot be taken into account as this information is not captured in the trough concentration) and changes in drug clearance (which is information that is captured in the trough concentration). Besides trough concentrations, intermediate concentrations might thus be helpful to gain better insight into (the variability of) the PK profile (especially for the subcutaneously administered drugs). However, evidence for intermediate sampling is limited.47
Along the treatment, we recommend to use clinical follow-up with measuring drug concentrations at every visit during induction phase,40,41,46,48 and then once every 3–6 months unless clinical signs of loss of response arise or the clinician decides to perform drug tapering in case of sustained remission.14,15,49,50 The (cost) effectiveness of this recommendation needs to be established.
How to perform TDM of biopharmaceuticals?
We briefly discuss the main steps in the TDM process (Figure 1): 1) the blood sampling, 2) the measurement techniques, 3) the communication and interpretation of the results and 4) the clinical decision-making support. Only then, fully substantiated dosage regimen recommendations can be made.
Blood sampling for TDM
To make drug blood concentration measurements of value, attention must be paid to 1) the timing of blood sampling, 2) the type of blood sample and 3) the storage and shipment conditions of the sample.
Timing of blood sampling
Errors in the timing of sampling are one of the greatest causes of misinterpretation of the results. TDM based on drug blood concentrations obtained at unknown or inappropriate time points is useless. As TDM of biopharmaceuticals is currently based on trough concentrations, the blood sample should be drawn just before the start of the next administration of the drug. At this moment, there are not many data on the therapeutic value of intermediate and peak drug concentration measurements, although the usefulness of intermediate measurements has been suggested to guide dose increase in patients with ADA at the end of the infusion cycle.47
Obtaining trough concentrations of the self-administered biopharmaceuticals is challenging in a way that adequate planning of visits is required. Intermediate blood samples are often collected for these subcutaneously administered drugs, but no data are currently available on the association between intermediate drug concentrations and therapeutic outcomes.
Blood sample collection and preparation
Laboratory measurements of biopharmaceutical concentrations are typically performed on serum, but EDTA, heparin or citrate plasma samples may also be used in these assays.51–54 Serum tubes with clot activator and gel separator are recommended.51,52 To avoid hemolysis, serum should be removed from the clot as soon as possible (within 4 hours).51,52 Depending on the analysis technique and the use of a robot, volumes up to 0.5 mL of serum/plasma are required.
Storage and shipment of samples
If blood samples are to be analyzed within 1 week, they may be stored at room temperature.55 However, recommendations are generally more stringent and may differ between leaflets provided with TDM assays.51,52,56–58 Specimens are expected to be stable for at least 1 year when stored at -20°C, but stability studies are lacking.52 Samples can be aliquoted to avoid repeated freezing and thawing. For specific guidance on sample storage, transport and labeling, we advise to consult the leaflet provided by the laboratory.
Analytical procedures
The availability of assays for measuring biopharmaceutical concentrations is a prerequisite for performing TDM. Since a few years, research groups and companies have started quantifying biopharmaceuticals and ADA in blood samples. Different methods have been developed: fluid-phase radioimmunoassay, solid-phase enzyme-linked immunosorbent assay (ELISA), reporter gene assay, enzyme immunoassay, homogenous mobility shift assay and liquid chromatography–tandem mass spectrometry.53,54,59,60 The most common format for quantifying biopharmaceuticals is ELISA, in which the biopharmaceutical is captured on a plate and detected using a secondary antibody.59 For measuring ADA, different assay formats are commercially available, in which the ADA are detected using the labeled biopharmaceutical itself.60
Currently, commercially available ELISA only quantifies unbound excess of drug and/or ADA and not when in complex with each other. The most often used strategy is to first measure the drug concentration. If the drug concentration is below the cutoff for detection, ADA will be measured in a second step. A preceding acid dissociation step that dissociates drug–ADA complex can be used to quantify total drug and ADA concentrations independently.61 This modified protocol allows earlier detection of ADA using the ELISA format but so far, as the therapeutic action of a biopharmaceutical is due to the presence of free drug, the importance of measuring complexed ADA in clinical routine remains unknown, as long as there is free drug detected in sample.
Although performance is comparable between the different assays, drug and ADA concentrations may show systematic differences.62,63 Only results obtained with the same assay can be compared. The implementation of a universal calibrator for quantifying ADA will eventually facilitate inter-laboratory harmonization of ADA measurements.59,64,65
Assays for TDM should be performed within a clinically acceptable time frame. With reported turnaround times of 3 working days to more than a week, it is not possible to “act upon” the measurement at the time the sample is taken, implying that TDM is always one administration late.56,66 Therefore, the appropriate turnaround time for reporting the analytical results to the physician should allow at least action upon the next administration of the drug and therefore depends on the administration interval and consequently is drug specific.18–22 Turnaround time and therefore TDM are hampered by pre-analytical (eg, transportation of the samples), analytical (eg, sample pretreatment as measurements are performed on serum/plasma and not on full blood) and post-analytical (eg, delays in the reporting to action time) procedures. To improve the analytical turnaround time, several dilutions can be performed in parallel to avoid the need for repeating the assay when a drug concentration is outside the established calibration curve. Still, the classical ELISA-type assay does not allow immediate action upon sampling and a TDM-based therapeutic change can therefore only be made days/weeks after a blood sample is withdrawn. The development of bedside or point-of-care assays will allow on-site availability of the analytical result and therefore improve flexibility of TDM.67–69
Communication and interpretation of the results
Communication of the results
The role of drug assay laboratories is to measure the concentration of a therapeutic drug in a sample. Laboratories might vary in the way they report the results. The unit is usually μg/mL or mg/L. They, however, do not provide dosage recommendations. As trough concentration-based dosing is not always supported by the leaflet of biopharmaceuticals, there is often no legal framework for dosing based on blood measurements. Clinical decision-making based on the measured concentrations is performed by the specialist following evidence from literature or his/her own clinical experience with the patient.11,12 When the drug concentration is below the detection or quantification limit, this limit should then be reported. Furthermore, correct interpretation of the assay result requires the reporting of relevant information such as drug sensitivity of the assay that is used. Ideally, drug assay laboratories participate in an external quality assurance program.62 Nevertheless, reporting of the assay used is important when comparing measurements from different assays.
Interpretation of the results
Appropriate clinical interpretation of the assay results requires information on 1) the dosage regimen (administered doses and time of dosing), 2) the time of blood sampling and 3) assay characteristics (eg, drug sensitive/tolerant ADA assay).
Clinical decision-making about patient treatment
Measuring drug concentrations may guide clinicians to adapt dosing. A therapeutic window that is associated with response is a prerequisite for TDM-based clinical decision-making. If the drug concentration is below the therapeutic range in a patient, dose increase, interval shortening or a combination may be considered. Besides treatment intensification, TDM also includes the possibility of giving insights for reducing the exposure when needed, by reestablishing the standard dosing interval and/or dose de-escalation.14,15,70–72 These interventions have been integrated in TDM algorithms, for example, the Trough concentration Adapted infliXImab Treatment (TAXIT) algorithm, which can be used for optimizing maintenance infliximab therapy in patients with IBD.12 TDM algorithms usually are decision trees/matrices that suggest an intervention based on drug and ADA concentrations (Table 2).73 In a “treat-to-target” setting, blood concentrations are not the target but a guidance to achieve relevant targets such as disease control, mucosal healing or reduction in articular damage.74 The clinician must decide whether to change the treatment strategy or not, taking into account the information given by TDM. However, therapeutic ranges have not been established for all biopharmaceuticals in all anti-inflammatory diseases and prospective trials comparing TDM-based dosing and clinically based dosing are warranted there. The most straightforward situation is when the drug is not measurable. After excluding sampling errors, this can be explained in two ways. First, there can be an “overconsumption” of the drug by the high inflammatory burden or increased metabolization/excretion.44 This necessitates a treatment intensification. Second, there can be the formation of ADA. In this situation, treatment intensification is less successful.75 Moreover, treatment intensification in this setting may lead to severe allergic reactions, certainly when ADA concentrations are high.6,76 When ADA concentrations are low, an attempt may be performed to overcome the ADA.77 However, this must be performed with precaution and under anti-allergic prophylaxis.
Besides ADA, there are more factors that influence the effect of a treatment intensification on the drug exposure. Typically, body composition measures (eg, sex and body weight) and disease activity measures (eg, antigenic target load, C-reactive protein and albumin) are shown to affect the PKs of biopharmaceuticals and should be taken into account for individualized TDM.43–45,78–82 Clinical evidence for pharmacometric-driven TDM algorithms that take into account these patient-specific and time-varying factors is currently lacking, but great potential is expected (eg, ClinicalTrials.gov Identifiers: NCT02453776 and NCT02624037).
As mentioned earlier, TDM-based adaptation of the dosage regimen is typically not supported by the leaflet of biopharmaceuticals and, accordingly, the drug formulations and the reimbursement regulations do typically not allow much flexibility in drug dosage regimen. While fine adjustments of the dose are difficult, especially for subcutaneously administered drugs, it is more convenient to change the dosing interval.
Current status of TDM in inflammatory diseases
IBD
For the oldest biopharmaceuticals on the market, infliximab and adalimumab, the added value of TDM has been demonstrated repeatedly, while evidence for TDM of the more recently marketed golimumab, vedolizumab and ustekinumab is still limited.21 Especially in the context of reactive TDM, clinical decision-making algorithms based on infliximab/adalimumab and ADA measurements have been established.75,77,83–86 The role for proactive TDM of infliximab has been explored in the landmark studies, TAXIT and TAILORIX, but superiority over symptom-based dose optimization could not be demonstrated.12,87 Nevertheless, the TAXIT study shows that targeting patients within the 3–7 mg/mL trough concentration range results in an improved response in patients with CD (due to dose escalations) at a 28% lower drug cost (due to dose de-escalations).
RA
An exposure–response relation has been confirmed for all TNF antagonists that are approved for the treatment of patients with RA.88–92 More recently, an exposure–response relation has been reported for tocilizumab as well.93 For rituximab and abatacept, data are lacking.18 The impact of ADA on exposure and response has been reported for infliximab, adalimumab and golimumab.49,90,94 ADA toward certolizumab pegol were associated with lower drug concentration but not with a lower clinical response.92 Furthermore, ADA have been detected toward etanercept (although non-neutralizing antibodies), rituximab, tocilizumab and abatacept, but no impact on drug exposure and response has been observed.18,31,91,95,96 TDM-based treatment optimization of infliximab, adalimumab and etanercept has been explored in a few studies, overall suggesting a cost-effectiveness.13,14,16,35,97 The utility of TDM of rituximab, tocilizumab and abatacept remains unclear.18
Spondyloarthritis
Positive exposure–response correlations have been described for infliximab, adalimumab and etanercept, although not all studies could confirm this correlation.98–103 The discrepancies may be explained by differences in disease pathophysiology (eg, TNF-driven and non-TNF-driven disease) and by heterogeneity in the quantification of exposure (eg, different sampling times and different assays) and response (eg, different clinical disease scores).19 Furthermore, the clinical response to infliximab, but not to adalimumab, was higher in ADA-negative patients than in ADA-positive patients.50,99 To date, no TDM algorithms have been assessed for biopharmaceutical therapies in spondyloarthritis.
Psoriasis
For infliximab and adalimumab, the immunogenicity–exposure–response correlation has repeatedly been described and therapeutic trough concentration thresholds have been suggested.22 Etanercept, on the other hand, is less immunogenic and trough concentrations vary less.22,104 Detrez et al104 recently observed an age-dependent exposure–response relation for etanercept. For the more recently marketed drugs, ustekinumab, secukinumab and ixekizumab, data supporting a role for TDM are still scarce but are expected in the foreseeable future.22
MS
Currently available data support a role for TDM of natalizumab in the treatment of MS, as low natalizumab concentrations and high ADA are associated with a lack of therapeutic efficacy.7 On the contrary, studies exploring the exposure–response relation for interferon beta-1a and alemtuzumab are lacking.20 Nevertheless, neutralizing ADA against interferon beta-1a (ie, ADA that inhibit the binding between interferon beta-1a and interferon receptor) are shown to abolish the biological activity and subsequently the therapeutic efficacy.105–109 Therefore, TDM guidelines are in place which recommend a therapeutic strategy based on the measurement of neutralizing ADA and of the biological activity of interferon beta.106 This is, however, not the case for alemtuzumab, as one study by Cohen et al30 concluded that the presence and concentration of ADA against alemtuzumab did not influence lymphocyte depletion and repopulation, efficacy and safety.
Aims and position
In this paper, we provide an overview of the TDM process of biopharmaceuticals that are used to treat patients with inflammatory diseases. With the Monitoring of monoclonal Antibodies Group in Europe (MAGE), we aim to educate health care practitioners and thereby hoping to promote the implementation and optimal use of TDM of these anti-inflammatory biopharmaceuticals. The monitoring of anti-inflammatory biopharmaceuticals is of increasing interest for optimizing treatment as therapeutic nonresponse is often reflected in insufficient drug concentrations. TDM is a valuable tool for (cost-effective) treatment optimization of biopharmaceuticals and is to be considered as a clinical decision-support tool in combination with follow-up of clinical performance.
Acknowledgment
This review was funded by Le Studium Loire Valley Institute for Advanced Studies.
Disclosure
PB has served as a speaker for AbbVie and Takeda and as a consultant for Merck Sharp & Dohme (MSD), Janssen Biologicals, Hospira, Mundipharma, Roche, Takeda and AbbVie. DM participated on behalf of his institution in clinical trials sponsored by Abbvie, Roche, Bristol-Myers Squibb, Pfizer, Union Chimique Belge and MSD; his hospital received a grant for research from AbbVie in 2004 and from Nordic Pharma in 2012; he has acted as a consultant and given lectures on behalf of his institution for MSD, Novartis, Union Chimique Belge and Pfizer; and he has been invited to attend international congresses by MSD, Roche, BMS, AbbVie and Janssen-Cilag. AG has served as a speaker for MSD, Janssen Biologicals, Pfizer and AbbVie, as a consultant for Union Chimique Belge and has received investigator-initiated research grants from Pfizer. KU Leuven licensed the infliximab ELISA to apDia and R-Biopharm AG and the use of monoclonal antibody mAb-IFX6B7 in the lateral flow assay to R-Biopharm AG. KU Leuven licensed the anti-infliximab and adalimumab ELISA to apDia. DPS has served as a speaker for MSD, Pfizer, Novartis and AbbVie, as a consultant for AbbVie, Novartis and Takeda and has received research grants from Pfizer, Novartis and Progenika. ED reports no conflicts of interest in this work.
References
Gils A, Bertolotto A, Mulleman D, Bejan-Angoulvant T, Declerck PJ. Biopharmaceuticals: reference products and biosimilars to treat inflammatory diseases. Ther Drug Monit. 2017;39(4):308–315. | ||
Papamichael K, Gils A, Rutgeerts P, et al. Role for therapeutic drug monitoring during induction therapy with TNF antagonists in IBD: evolution in the definition and management of primary nonresponse. Inflamm Bowel Dis. 2015;21(1):182–197. | ||
Gisbert JP, Panés J. Loss of response and requirement of infliximab dose intensification in Crohn’s disease: a review. Am J Gastroenterol. 2009;104(3):760–767. | ||
Billioud V, Sandborn WJ, Peyrin-Biroulet L. Loss of response and need for adalimumab dose intensification in Crohn’s disease: a systematic review. Am J Gastroenterol. 2011;106(4):674–684. | ||
Ben-Horin S, Chowers Y. Review article: loss of response to anti-TNF treatments in Crohn’s disease. Aliment Pharmacol Ther. 2011;33(9):987–995. | ||
Baert F, Noman M, Vermeire S, et al. Influence of immunogenicity on the long-term efficacy of infliximab in Crohn’s disease. N Engl J Med. 2003;348(7):601–608. | ||
Vennegoor A, Rispens T, Strijbis EM, et al. Clinical relevance of serum natalizumab concentration and anti-natalizumab antibodies in multiple sclerosis. Mult Scler. 2013;19(5):593–600. | ||
Menting SP, Coussens E, Pouw MF, et al. Developing a therapeutic range of adalimumab serum concentrations in management of psoriasis: a step toward personalized treatment. JAMA Dermatol. 2015;151(6):616–622. | ||
Dreesen E, Gils A. Blocking the 47 integrin through vedolizumab: necessary but not sufficient? J Crohns Colitis. 2017;1:1–34. | ||
Gross AS. Best practice in therapeutic drug monitoring. Br J Clin Pharmacol. 2001;52(suppl 1(2)):5S–10S. | ||
Steenholdt C, Brynskov J, Thomsen OØ, et al. Individualised therapy is more cost-effective than dose intensification in patients with Crohn’s disease who lose response to anti-TNF treatment: a randomised, controlled trial. Gut. 2014;63(6):919–927. | ||
Vande Casteele N, Ferrante M, Van Assche G, et al. Trough concentrations of infliximab guide dosing for patients with inflammatory bowel disease. Gastroenterology. 2015;148(7):1320–1329.e3. | ||
Pascual-Salcedo D. Dose-tapering of TNF inhibitors in daily rheumatology practice enables the maintenance of clinical efficacy while improving cost-effectiveness. J Pharmacovigil. 2015;3(4):1–7. | ||
Plasencia C, Wolbink G, Krieckaert CLM, et al. Comparing a tapering strategy to the standard dosing regimen of TNF inhibitors in rheumatoid arthritis patients with low disease activity. Clin Exp Rheumatol. 2016;42(9):1638–1646. | ||
Plasencia C, Kneepkens EL, Wolbink G, et al. Comparing tapering strategy to standard dosing regimen of tumor necrosis factor inhibitors in patients with spondyloarthritis in low disease activity. J Rheumatol. 2015;42(9):1638–1646. | ||
Garcês S, Antunes M, Benito-Garcia E, da Silva JC, Aarden L, Demengeot J. A preliminary algorithm introducing immunogenicity assessment in the management of patients with RA receiving tumour necrosis factor inhibitor therapies. Ann Rheum Dis. 2014;73(6):1138–1143. | ||
Sandborn WJ. Tailoring treatment to the individual patient: drug monitoring. Dig Dis. 2014;32(suppl 1):88–91. | ||
Medina F, Plasencia C, Goupille P, Ternant D, Balsa A, Mulleman D. Current practice of therapeutic drug monitoring of biopharmaceuticals in rheumatoid arthritis. Ther Drug Monit. 2017;39(4):364–369. | ||
Medina F, Plasencia C, Goupille P, Paintaud G, Balsa A, Mulleman D. Current practice of therapeutic drug monitoring of biopharmaceuticals in spondyloarthritis. Ther Drug Monit. 2017;39(4):360–363. | ||
Caldano M, Raoul W, Rispens T, Bertolotto A. Drug efficacy monitoring in pharmacotherapy of multiple sclerosis with biological agents. Ther Drug Monit. 2017;39(4):350–355. | ||
Detrez I, Van Stappen T, Martín Arranz MD, Papamichael K, Gils A. Current practice for therapeutic drug monitoring of biopharmaceuticals in inflammatory bowel disease. Ther Drug Monit. 2017;39(4):344–349. | ||
Hermans C, Herranz P, Segaert S, Gils A. Current practice of therapeutic drug monitoring of biopharmaceuticals in psoriasis patients. Ther Drug Monit. 2017;39(4):356–359. | ||
Murias S, Magallares L, Albizuri F, Pascual-Salcedo D, Dreesen E, Mulleman D. Current practice for therapeutic drug monitoring of biopharmaceuticals in paediatrics. Ther Drug Monit. 2017;39(4):370–378. | ||
Sandborn WJ, Schreiber S, Feagan BG, et al. Certolizumab pegol for active Crohn’s disease: a placebo-controlled, randomized trial. Clin Gastroenterol Hepatol. 2011;9(8):670–678.e3. | ||
Colombel J-F, Sandborn WJ, Allez M, et al. Association between plasma concentrations of certolizumab pegol and endoscopic outcomes of patients with Crohn’s disease. Clin Gastroenterol Hepatol. 2014;12(3):423–431.e1. | ||
Detrez I, Dreesen E, Van Stappen T, et al. Variability in golimumab exposure: a “real-life” observational study in active ulcerative colitis. J Crohns Colitis. 2016;10(5):575–581. | ||
Williet N, Boschetti G, Fovet M, et al. Association between low trough levels of vedolizumab during induction therapy for inflammatory bowel diseases with need for additional doses within 6 months. Clin Gastroenterol Hepatol. In press 2016. | ||
Menting SP, van den Reek JM, Baerveldt EM, et al. The correlation of clinical efficacy, serum trough levels and antidrug antibodies in ustekinumab-treated patients with psoriasis in a clinical-practice setting. Br J Dermatol. 2015;173(3):855–857. | ||
Langley RG, Elewski BE, Lebwohl M, et al; The ERASURE and FIXTURE Study Groups. Secukinumab in plaque psoriasis – results of two phase 3 trials. N Engl J Med. 2014;371(4):326–338. | ||
Cohen JA, Coles AJ, Arnold DL, et al; CARE-MS I investigators. Alemtuzumab versus interferon beta 1a as first-line treatment for patients with relapsing-remitting multiple sclerosis: a randomised controlled phase 3 trial. Lancet. 2012;380(9856):1819–1828. | ||
Westhovens R, Robles M, Ximenes AC, et al. Maintenance of remission following 2 years of standard treatment then dose reduction with abatacept in patients with early rheumatoid arthritis and poor prognosis. Ann Rheum Dis. 2015;74(3):564–568. | ||
Takahashi H, Tsuji H, Ishida-Yamamoto A, Iizuka H. Plasma trough levels of adalimumab and infliximab in terms of clinical efficacy during the treatment of psoriasis. J Dermatol. 2013;40(1):39–42. | ||
Gils A, Dreesen E, Compernolle G, et al. OP020 recent anti-TNF exposure predicts lower vedolizumab trough concentrations in patients with Crohn’s disease. J Crohn’s Colitis. 2017;11(suppl_1):S12–S12. | ||
Bartelds GM, Wijbrandts CA, Nurmohamed MT, et al. Clinical response to adalimumab: relationship to anti-adalimumab antibodies and serum adalimumab concentrations in rheumatoid arthritis. Ann Rheum Dis. 2007;66(7):921–926. | ||
Krieckaert CLM, Nair SC, Nurmohamed MT, et al. Personalised treatment using serum drug levels of adalimumab in patients with rheumatoid arthritis: an evaluation of costs and effects. Ann Rheum Dis. 2015;74(2):361–368. | ||
Khanna R, Sattin BD, Afif W, et al. Review article: a clinician’s guide for therapeutic drug monitoring of infliximab in inflammatory bowel disease. Aliment Pharmacol Ther. 2013;38(5):447–459. | ||
Melmed GY, Irving PM, Jones J, et al. Appropriateness of testing for anti-tumor necrosis factor agent and antibody concentrations, and interpretation of results. Clin Gastroenterol Hepatol. 2016;14(9):1302–1309. | ||
Vaughn BP, Sandborn WJ, Cheifetz AS. Biologic concentration testing in inflammatory bowel disease. Inflamm Bowel Dis. 2015;21(6):1435–1442. | ||
Brandse JF, Mathôt RA, van der Kleij D, et al. Pharmacokinetic features and presence of antidrug antibodies associate with response to infliximab induction therapy in patients with moderate to severe ulcerative colitis. Clin Gastroenterol Hepatol. 2016;14(2):251–258.e1–2. | ||
Jurado T, Plasencia C, Martinez Feito A, et al. Predictive value of serum infliximab levels at induction phase in rheumatoid arthritis patients. Open Rheumatol J. 2017;11:75–87. | ||
Kobayashi T, Suzuki Y, Motoya S, et al. First trough level of infliximab at week 2 predicts future outcomes of induction therapy in ulcerative colitis-results from a multicenter prospective randomized controlled trial and its post hoc analysis. J Gastroenterol. 2015;51(3):241–251. | ||
Papamichael K, Van Stappen T, Vande Casteele N, et al. Infliximab concentration thresholds during induction therapy are associated with short-term mucosal healing in patients with ulcerative colitis. Clin Gastroenterol Hepatol. 2016;14(4):543–549. | ||
Ternant D, Ducourau E, Perdriger A, et al. Relationship between inflammation and infliximab pharmacokinetics in rheumatoid arthritis. Br J Clin Pharmacol. 2014;78(1):118–128. | ||
Dotan I, Ron Y, Yanai H, et al. Patient factors that increase infliximab clearance and shorten half-life in inflammatory bowel disease: a population pharmacokinetic study. Inflamm Bowel Dis. 2014;20(12):2247–2259. | ||
Vande Casteele N, Mould DR, Coarse J, et al. Accounting for pharmacokinetic variability of certolizumab pegol in patients with Crohn’s disease. Clin Pharmacokinet. In press 2017. | ||
Ducourau E, Ternant D, Lequerré T, et al. Towards an individualised target concentration of adalimumab in rheumatoid arthritis. Ann Rheum Dis. 2014;73(7):1428–1429. | ||
Plasencia C, Pascual-Salcedo D, Alcocer P, et al. The timing of serum infliximab loss, or the appearance of antibodies to infliximab (ATI), is related with the clinical activity in ATI-positive patients with rheumatoid arthritis treated with infliximab. Ann Rheum Dis. 2013;72(11):1888–1890. | ||
Bendtzen K, Geborek P, Svenson M, Larsson L, Kapetanovic MC, Saxne T. Individualized monitoring of drug bioavailability and immunogenicity in rheumatoid arthritis patients treated with the tumor necrosis factor alpha inhibitor infliximab. Arthritis Rheum. 2006;54(12):3782–3789. | ||
Pascual-Salcedo D, Plasencia C, Ramiro S, et al. Influence of immunogenicity on the efficacy of long-term treatment with infliximab in rheumatoid arthritis. Rheumatology (Oxford). 2011;50(8):1445–1452. | ||
Plasencia C, Pascual-Salcedo D, Nuño L, et al. Influence of immunogenicity on the efficacy of longterm treatment of spondyloarthritis with infliximab. Ann Rheum Dis. 2012;71(12):1955–1960. | ||
Sanquin Blood Supply. Sanquin Infliximab Level ELISA Assay Procedure. 2017. Available from: http://www.sanquin.nl/repository/documenten/en/prod-en-dienst/reagents/M1886_infliximab_20092013.pdf. Accessed February 24, 2017. | ||
apDia. apDia In Vitro Diagnostic Kit Infliximab ELISA. 2017. Available from: http://www.apdiagroup.com/files/ifu/710001_IFU_IFX_96T-vs05-15.pdf. Accessed March 14, 2017. | ||
El Amrani M, van den Broek MPH, Göbel C, van Maarseveen EM. Quantification of active infliximab in human serum with liquid chromatography-tandem mass spectrometry using a tumor necrosis factor alpha-based pre-analytical sample purification and a stable isotopic labeled infliximab bio-similar as internal standard: a target-based, sensitive and cost-effective method. J Chromatogr A. 2016;1454:42–48. | ||
Ouyang Z, Furlong MT, Wu S, et al. Pellet digestion: a simple and efficient sample preparation technique for LC-MS/MS quantification of large therapeutic proteins in plasma. Bioanalysis. 2012;4(1):17–28. | ||
Perry M, Bewshea C, Brown R, So K, Ahmad T, McDonald T. Infliximab and adalimumab are stable in whole blood clotted samples for seven days at room temperature. Ann Clin Biochem. 2015;52(pt 6):672–674. | ||
PROMETHEUS. PROMETHEUS® AnserTM IFX Product Detail. 2017. Available from: https://www.anserifx.com/PDF/AnserIFX_ProductDetail.pdf. Accessed February 24, 2017. | ||
TDM Monografie [webpage on the Internet]. TDM Monografie Infliximab. 2015. Available from: http://tdm-monografie.org/monografie/infliximab. Accessed February 24, 2017. | ||
Labogids [webpage on the Internet]. Labogids Laboratoriumgeneeskunde Infliximab Bloedspiegel. 2016. Available from: https://w1.uzleuven.be/labo/LAG/LAG_Procedureboek/index.html?6146.html. Accessed February 24, 2017. | ||
Darrouzain F, Bian S, Desvignes C, et al. Methods for measuring serum concentrations of monoclonal antibodies and anti-biopharmaceutical antibodies in patients; how to measure accurately and clinically relevant levels. Ther Drug Monit. 2017;39(4):316–321. | ||
Bloem K, Hernández-Breijo B, Martínez-Feito A, Rispens T. Immunogenicity of therapeutic antibodies: monitoring anti-drug antibodies in a clinical context. Ther Drug Monit. 2017;39(4):327–332. | ||
Van Stappen T, Brouwers E, Vermeire S, Gils A. Validation of a sample pretreatment protocol to convert a drug-sensitive into a drug-tolerant anti-infliximab antibody immunoassay. Drug Test Anal. 2016;9(2):243–247. | ||
Vande Casteele N, Buurman DJ, Sturkenboom MG, et al. Detection of infliximab levels and anti-infliximab antibodies: a comparison of three different assays. Aliment Pharmacol Ther. 2012;36(8):765–771. | ||
Steenholdt C, Bendtzen K, Brynskov J, Thomsen OE, Ainsworth MA. Clinical implications of measuring drug and anti-drug antibodies by different assays when optimizing infliximab treatment failure in Crohn’s disease: post hoc analysis of a randomized controlled trial. Am J Gastroenterol. 2014;109(7):1055–1064. | ||
Van Stappen T, Billiet T, Vande Casteele N, et al. An optimized anti-infliximab bridging enzyme-linked immunosorbent assay for harmonization of anti-infliximab antibody titers in patients with inflammatory bowel diseases. Inflamm Bowel Dis. 2015;21(9):2172–2177. | ||
Bian S, Van Stappen T, Baert F, et al. Generation and characterization of a unique panel of anti-adalimumab specific antibodies and their application in therapeutic drug monitoring assays. J Pharm Biomed Anal. 2016;125:62–67. | ||
Exeter Clinical Laboratory [webpage on the Internet]. Exeter Clinical Laboratory Adalimumab Drug Levels. 2017. Available from: http://www.exeterlaboratory.com/test/adalimumab-drug-levels/. Accessed February 27, 2017. | ||
Corstjens PL, Fidder HH, Wiesmeijer KC, et al. A rapid assay for on-site monitoring of infliximab trough levels: a feasibility study. Anal Bioanal Chem. 2013;405(23):7367–7375. | ||
Lu J, Van Stappen T, Spasic D, et al. Fiber optic-SPR platform for fast and sensitive infliximab detection in serum of inflammatory bowel disease patients. Biosens Bioelectron. 2016;79:173–179. | ||
Van Stappen T, Bollen L, Vande Casteele N, et al. Rapid test for infliximab drug concentration allows immediate dose adaptation. Clin Transl Gastroenterol. 2016;7(12):e206. | ||
van der Maas A, Kievit W, van den Bemt BJ, van den Hoogen FH, van Riel PL, den Broeder AA. Down-titration and discontinuation of infliximab in rheumatoid arthritis patients with stable low disease activity and stable treatment: an observational cohort study. Ann Rheum Dis. 2012;71(11):1849–1854. | ||
Mörck B, Pullerits R, Geijer M, Bremell T, Forsblad-d’Elia H. Infliximab dose reduction sustains the clinical treatment effect in active HLAB27 positive ankylosing spondylitis: a two-year pilot study. Mediators Inflamm. 2013;2013:289845. | ||
Navarro-Compán V, Plasencia-Rodríguez C, de Miguel E, et al. Anti-TNF discontinuation and tapering strategies in patients with axial spondyloarthritis: a systematic literature review. Rheumatology (Oxford). 2016;55(7):1188–1194. | ||
Mulleman D, Ducourau E, Paintaud G, Ternant D, Watier H, Goupille P. Should anti-TNF-α drug levels and/or anti-drug antibodies be assayed in patients treated for rheumatoid arthritis? Joint Bone Spine. 2012;79(2):109–112. | ||
Bossuyt P, Vermeire S. Treat to target in inflammatory bowel disease. Curr Treat Options Gastroenterol. 2016;14(1):61–72. | ||
Afif W, Loftus EV, Faubion WA, et al. Clinical utility of measuring infliximab and human anti-chimeric antibody concentrations in patients with inflammatory bowel disease. Am J Gastroenterol. 2010;105(5):1133–1139. | ||
O’Meara S, Nanda KS, Moss AC. Antibodies to infliximab and risk of infusion reactions in patients with inflammatory bowel disease: a systematic review and meta-analysis. Inflamm Bowel Dis. 2014;20(1):1–6. | ||
Vande Casteele N, Gils A, Singh S, et al. Antibody response to infliximab and its impact on pharmacokinetics can be transient. Am J Gastroenterol. 2013;108(6):962–971. | ||
Ternant D, Bejan-Angoulvant T, Passot C, Mulleman D, Paintaud G. Clinical pharmacokinetics and pharmacodynamics of monoclonal antibodies approved to treat rheumatoid arthritis. Clin Pharmacokinet. 2015;54(11):1107–1123. | ||
Fasanmade AA, Adedokun OJ, Blank M, Zhou H, Davis HM. Pharmacokinetic properties of infliximab in children and adults with Crohn’s disease: a retrospective analysis of data from 2 phase III clinical trials. Clin Ther. 2011;33(7):946–964. | ||
Fasanmade AA, Adedokun OJ, Ford J, et al. Population pharmacokinetic analysis of infliximab in patients with ulcerative colitis. Eur J Clin Pharmacol. 2009;65(12):1211–1228. | ||
Xu Z, Seitz K, Fasanmade A, et al. Population pharmacokinetics of infliximab in patients with ankylosing spondylitis. J Clin Pharmacol. 2008;48(6):681–695. | ||
Ng CM, Bruno R, Combs D, Davies B. Population pharmacokinetics of rituximab (anti-CD20 monoclonal antibody) in rheumatoid arthritis patients during a phase II clinical trial. J Clin Pharmacol. 2005;45(7):792–801. | ||
Roblin X, Rinaudo M, Del Tedesco E, et al. Development of an algorithm incorporating pharmacokinetics of adalimumab in inflammatory bowel diseases. Am J Gastroenterol. 2014;109(8):1250–1256. | ||
Karmiris K, Paintaud G, Noman M, et al. Influence of trough serum levels and immunogenicity on long-term outcome of adalimumab therapy in Crohn’s disease. Gastroenterology. 2009;137(5):1628–1640. | ||
Paul S, Del Tedesco E, Marotte H, et al. Therapeutic drug monitoring of infliximab and mucosal healing in inflammatory bowel disease: a prospective study. Inflamm Bowel Dis. 2013;19(12):2568–2576. | ||
Yanai H, Lichtenstein L, Assa A, et al. Levels of drug and antidrug antibodies are associated with outcome of interventions after loss of response to infliximab or adalimumab. Clin Gastroenterol Hepatol. 2014;13(3):522–530.e2. | ||
D’Haens GR, Vermeire S, Lambrecht G, et al. 692 drug-level based dosing versus symptom-based dose adaptation in patients with Crohn’s disease: a prospective, randomized multicenter study (TAILORIX). Gastroenterology. 2016;150(4):S143. | ||
Mulleman D, Chu Miow Lin D, Ducourau E, et al. Trough infliximab concentrations predict efficacy and sustained control of disease activity in rheumatoid arthritis. Ther Drug Monit. 2010;32(2):232–236. | ||
Pouw MF, Krieckaert CL, Nurmohamed MT, et al. Key findings towards optimising adalimumab treatment: the concentration-effect curve. Ann Rheum Dis. 2015;74(3):513–518. | ||
Kneepkens EL, Plasencia C, Krieckaert CL, et al. Golimumab trough levels, antidrug antibodies and clinical response in patients with rheumatoid arthritis treated in daily clinical practice. Ann Rheum Dis. 2014;73(12):2217–2219. | ||
Jamnitski A, Krieckaert CL, Nurmohamed MT, et al. Patients non-responding to etanercept obtain lower etanercept concentrations compared with responding patients. Ann Rheum Dis. 2012;71(1):88–91. | ||
Jani M, Isaacs JD, Morgan AW, et al. High frequency of antidrug antibodies and association of random drug levels with efficacy in certolizumab pegol-treated patients with rheumatoid arthritis: results from the BRAGGSS cohort. Ann Rheum Dis. 2017;76(1):208–213. | ||
Levi M, Grange S, Frey N. Exposure-response relationship of tocilizumab, an anti-IL-6 receptor monoclonal antibody, in a large population of patients with rheumatoid arthritis. J Clin Pharmacol. 2013;53(2):151–159. | ||
Bartelds GM, Krieckaert CLM, Nurmohamed MT, et al. Development of antidrug antibodies against adalimumab and association with disease activity and treatment failure during long-term follow-up. JAMA. 2011;305(14):1460–1468. | ||
Thurlings RM, Teng O, Vos K, et al. Clinical response, pharmacokinetics, development of human anti-chimeric antibodies, and synovial tissue response to rituximab treatment in patients with rheumatoid arthritis. Ann Rheum Dis. 2010;69(2):409–412. | ||
Kneepkens EL, van den Oever I, Plasencia CH, et al. Serum tocilizumab trough concentration can be used to monitor systemic IL-6 receptor blockade in patients with rheumatoid arthritis: a prospective observational cohort study. Scand J Rheumatol. 2017;46(2):87–94. | ||
Mulleman D, Méric J-C, Paintaud G, et al; Centre National de la Recherche Scientifique UMR 6239 GICC. Infliximab concentration monitoring improves the control of disease activity in rheumatoid arthritis. Arthritis Res Ther. 2009;11(6):R178. | ||
Kneepkens EL, Krieckaert CLM, van der Kleij D, et al. Lower etanercept levels are associated with high disease activity in ankylosing spondylitis patients at 24 weeks of follow-up. Ann Rheum Dis. 2015;74(10):1825–1829. | ||
Kneepkens EL, Wei JC-C, Nurmohamed MT, et al. Immunogenicity, adalimumab levels and clinical response in ankylosing spondylitis patients during 24 weeks of follow-up. Ann Rheum Dis. 2015;74(2):396–401. | ||
de Vries MK, Wolbink GJ, Stapel SO, et al. Inefficacy of infliximab in ankylosing spondylitis is correlated with antibody formation. Ann Rheum Dis. 2007;66(1):133–134. | ||
Ternant D, Mulleman D, Lauféron F, et al. Influence of methotrexate on infliximab pharmacokinetics and pharmacodynamics in ankylosing spondylitis. Br J Clin Pharmacol. 2012;73(1):55–65. | ||
Paramarta JE, Baeten DL. Adalimumab serum levels and antidrug antibodies towards adalimumab in peripheral spondyloarthritis: no association with clinical response to treatment or with disease relapse upon treatment discontinuation. Arthritis Res Ther. 2014;16(4):R160. | ||
de Vries MK, van der Horst-Bruinsma IE, Nurmohamed MT, et al. Immunogenicity does not influence treatment with etanercept in patients with ankylosing spondylitis. Ann Rheum Dis. 2009;68(4):531–535. | ||
Detrez I, Van Steen K, Segaert S, Gils A. The association between etanercept serum concentration and psoriasis severity is highly age-dependent. Clin Sci. 2017;131(11):1179–1189. | ||
Sorensen PS, Ross C, Clemmesen KM, et al; Danish Multiple Sclerosis Study Group. Clinical importance of neutralising antibodies against interferon beta in patients with relapsing-remitting multiple sclerosis. Lancet. 2003;362(9391):1184–1191. | ||
Bertolotto A, Capobianco M, Amato MP, et al; Italian Multiple Sclerosis Study Group. Guidelines on the clinical use for the detection of neutralizing antibodies (NAbs) to IFN beta in multiple sclerosis therapy: report from the Italian multiple sclerosis study group. Neurol Sci. 2014;35(2):307–316. | ||
Sørensen PS, Deisenhammer F, Duda P, et al; EFNS Task Force on Anti-IFN-beta Antibodies in Multiple Sclerosis. Guidelines on use of anti-IFN-beta antibody measurements in multiple sclerosis: report of an EFNS task force on IFN-beta antibodies in multiple sclerosis. Eur J Neurol. 2005;12(11):817–827. | ||
Polman CH, Bertolotto A, Deisenhammer F, et al. Recommendations for clinical use of data on neutralising antibodies to interferon-beta therapy in multiple sclerosis. Lancet Neurol. 2010;9(7):740–750. | ||
Paolicelli D, D’Onghia M, Pellegrini F, et al. The impact of neutralizing antibodies on the risk of disease worsening in interferon β-treated relapsing multiple sclerosis: a 5 year post-marketing study. J Neurol. 2013;260(6):1562–1568. | ||
Moore C, Corbett G, Moss AC. Systematic review and meta-analysis: serum infliximab levels during maintenance therapy and outcomes in inflammatory bowel disease. J Crohns Colitis. 2016;10(5):619–625. | ||
Paul S, Moreau AC, Del Tedesco E, et al. Pharmacokinetics of adalimumab in inflammatory bowel diseases: a systematic review and meta-analysis. Inflamm Bowel Dis. 2014;20(7):1288–1295. | ||
Vogelzang EH, Kneepkens EL, Nurmohamed MT, et al. Anti-adalimumab antibodies and adalimumab concentrations in psoriatic arthritis; an association with disease activity at 28 and 52 weeks of follow-up. Ann Rheum Dis. 2014;73(12):2178–2182. | ||
Sandborn WJ, Feagan BG, Marano C, et al; PURSUIT-Maintenance Study Group. Subcutaneous golimumab maintains clinical response in patients with moderate-to-severe ulcerative colitis. Gastroenterology. 2014;146(1):96–109.e1. | ||
Battat R, Kopylov U, Bessissow T, et al. Association among ustekinumab trough concentrations and clinical, biomarker, and endoscopic outcomes in patients with Crohn’s disease. Clin Gastroenterol Hepatol. In press 2017. |
 © 2017 The Author(s). This work is published and licensed by Dove Medical Press Limited. The full terms of this license are available at https://www.dovepress.com/terms.php and incorporate the Creative Commons Attribution - Non Commercial (unported, v3.0) License.
By accessing the work you hereby accept the Terms. Non-commercial uses of the work are permitted without any further permission from Dove Medical Press Limited, provided the work is properly attributed. For permission for commercial use of this work, please see paragraphs 4.2 and 5 of our Terms.
© 2017 The Author(s). This work is published and licensed by Dove Medical Press Limited. The full terms of this license are available at https://www.dovepress.com/terms.php and incorporate the Creative Commons Attribution - Non Commercial (unported, v3.0) License.
By accessing the work you hereby accept the Terms. Non-commercial uses of the work are permitted without any further permission from Dove Medical Press Limited, provided the work is properly attributed. For permission for commercial use of this work, please see paragraphs 4.2 and 5 of our Terms.