")
Back to Journals » International Journal of General Medicine » Volume 15
Potential Role of the Chemotaxis System in Formation and Progression of Intracranial Aneurysms Through Weighted Gene Co-Expression Network Analysis
Authors Zhu H, Tan J, Zhao Y, Wang Z , Wu Z, Li M
Received 3 December 2021
Accepted for publication 22 February 2022
Published 27 February 2022 Volume 2022:15 Pages 2217—2231
DOI https://doi.org/10.2147/IJGM.S347420
Checked for plagiarism Yes
Review by Single anonymous peer review
Peer reviewer comments 2
Editor who approved publication: Dr Scott Fraser
Huaxin Zhu, Jiacong Tan, Yeyu Zhao, Zhihua Wang, Zhiwu Wu, Meihua Li
Department of Neurosurgery, The First Affiliated Hospital of Nanchang University, Nanchang, 330006, Jiangxi, People’s Republic of China
Correspondence: Meihua Li, Email [email protected]
Background: Intracranial aneurysm (IA) is the most common and is the main cause of spontaneous subarachnoid hemorrhage (SAH). The underlying molecular mechanisms for preventing IA progression have not been fully identified. Our research aimed to identify the key genes and critical pathways of IA through gene co-expression networks.
Methods: Gene Expression Omnibus (GEO) datasets GSE13353, GSE54083 and GSE75436 were used in the study. The genetic data were analyzed by weighted gene co-expression network analysis (WGCNA). Then the clinically significant modules were identified and the differentially expressed genes (DEGs) with the genes were intersected in these modules. GO (gene ontology) and KEGG (Kyoto Gene and Genomic Encyclopedia) were used for gene enrichment analysis to determine the function or pathway. In addition, the composition of immune cells was analyzed by CIBERSORT algorithm. Finally, the hub genes and key genes were identified by GSE122897.
Results: A total of 266 DEGs and two modules with clinical significance were identified. The inflammatory response and immune response were identified by GO and KEGG. CCR5, CCL4, CCL20, and FPR3 were the key genes in the module correlated with IA. The proportions of infiltrating immune cells in IA and normal tissues were different, especially in terms of macrophages and mast cells.
Conclusion: The chemotactic system has been identified as a key pathway of IA, and interacting macrophages may regulate this pathological process.
Keywords: intracranial aneurysm, IA, weighted gene co-expression network analysis, WGCNA, Gene Expression Omnibus, GEO, chemotaxis, immune infiltration
Introduction
Cardiovascular disease is still the leading cause of death worldwide. Among cardiovascular diseases, aneurysm is not as widely known and has been studied less well than coronary heart disease, but the serious consequences of aneurysm cannot be underestimated. An aneurysm is an abnormal bulge or swelling in an arterial blood vessel. The underlying disease progression involves weakening of the arterial wall, leading to the risk of progressive expansion or even rupture of the aneurysm.1,2 Intracranial aneurysm (IA) develops in the cerebral artery and is characterized by local dilation of the cerebral artery.3 Saccular aneurysm is the most common, and is the main cause of spontaneous subarachnoid hemorrhage (SAH).4 Multifactorial pathophysiological changes after SAH usually lead to irreversible brain damage, and cause a high incidence of medical complications and mortality.5–7 Individuals affected by SAH are younger than those affected by other forms of stroke, with an average age of 50 years,8,9 and survivors often experience dysfunction and/or cognitive impairment for a long time.10,11
Despite numerous studies over the past several decades, the pathophysiological mechanisms underlying the formation, development, and rupture of aneurysms have yet to be fully elucidated, hindering optimal treatment.12–14 The pathological features of IA are considered to be due to the destruction of extracellular matrix (ECM), leading to damage to the structural integrity of the arteries.15,16 Inflammation is considered to be a core response throughout the occurrence and development of disease.17,18 The complex inflammatory response involves a series of pathological processes, including matrix metalloproteinase (MMP) activation, vascular smooth muscle cell (VSMC) apoptosis, macrophage infiltration, and activation of intracellular oxidative stress.19–22 Macrophages infiltrate the arterial wall due to the actions of inflammatory chemokines.23 Macrophages express and release MMPs, destroying the ECM of the arterial wall, which in turn leads to the recruitment of other inflammatory cells, aggravating the degeneration and weakening of the arterial wall, and ultimately leading to the formation and growth of aneurysms.17,23,24 These data indicate the critical role of immune and inflammatory processes in the formation and development of IA.
With advances in microarrays, high-throughput sequencing, and bioinformatics analysis, the transcriptome changes and molecular mechanisms of many diseases can be readily determined. Through in-depth analysis of differentially expressed genes (DEGs) between different samples, such as using GO (gene ontology) and KEGG (Kyoto Gene and Genomic Encyclopedia) to analyze the functions or pathways enriched by DEGs, using protein–protein interactions (PPI) to predict the interaction between proteins, using CIBERSORT to study the degree of immune cell infiltration, and its like, which enable us to a more comprehensive and profound understanding of the disease.25–27 By constructing a scale-free weighted network, weighted gene co-expression network analysis (WGCNA) can be used to study biologically significant gene sets related to sample characteristics, and explore the core genes of internal modules that are closely related in co-expression modules.28,29 In this study, the microarray data of IA patients and normal arteries from public databases were examined by WGCNA to identify important modules closely related to IA, which may provide a better understanding of the molecular mechanisms underlying IA.
Methods
Data Collection and Preprocessing
This study was performed using transcriptome data of IA patients available from a public database (Gene Expression Omnibus, [GEO], https://www.ncbi.nlm.nih.gov/geo/). Datasets related to IA—GSE13353, GSE54083, and GSE75436—were included in the analysis and downloaded from the GEO database. The three datasets contained a total of 72 samples, including 25 normal samples and 47 IA samples. The raw data were processed by the RMA (Robust Multi-Array Average) method in the affy (version 1.70.0) R package.30 The missing values were filled using the impute (version 1.66.0) R package. After merging the three datasets, the batch effects were removed by limma (version 3.48.1) and sva (version 3.40.0) R packages.31,32 Additionally, approval for this study was obtained from the Ethics Committee of the First Affiliated Hospital of Nanchang University. The workflow of the present study was in Figure 1.
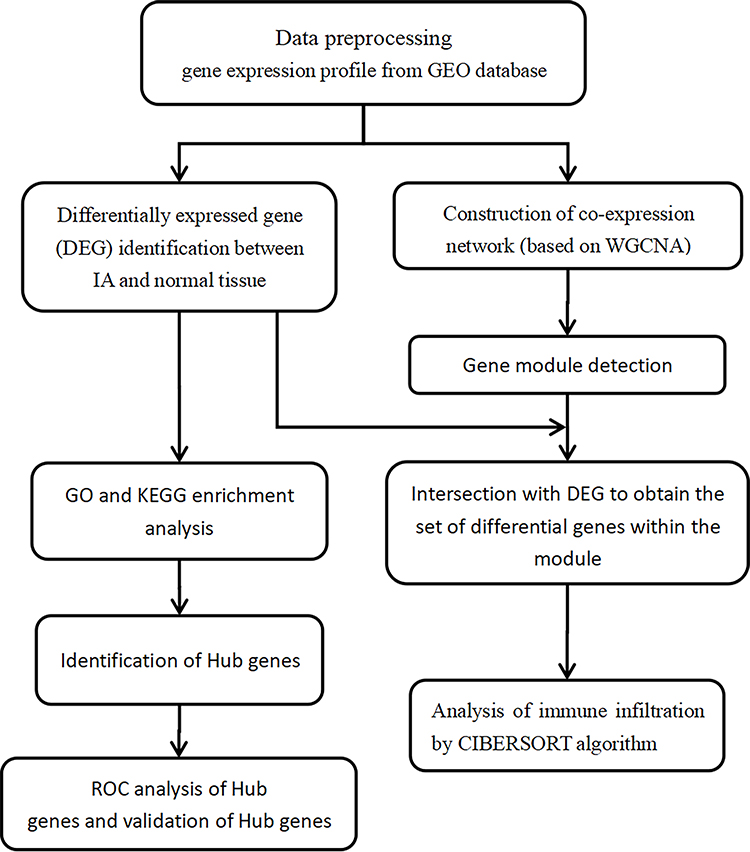 |
Figure 1 Work flow chart of this study. |
Differentially Expressed Gene Analysis
After the above processing of the datasets, we used the limma (version 3.48.1) R package to filter the DEGs between the IA and normal samples.31 The threshold values were set as adjusted, p < 0.05 and |log2FC| > 1.5. Thermogram analysis of DEGs was conducted using the pheatmap (version 1.0.12) R package.33
Functional and Pathway Enrichment Analyses and Principal Component Analysis
GO annotation contains three categories, ie, biological process (BP), cell component (CC), and molecular function (MF), which can be used to identify the biological attributes of genes and gene sets for all organisms.34 The KEGG is a comprehensive database integrating information on genome, chemistry, and system function.35 The KEGG database associates the gene catalogs obtained from completely sequenced genomes with the system functions at the cell, species, and ecosystem levels. To explore the biological functions of the candidate gene modules, the online tool, WebGestalt (version 6.8, http://www.webgestalt.org/), was used for GO and KEGG enrichment analyses, for the genome protein-coding was used as reference set.36 In the analyses, p < 0.05 was taken to indicate significant enrichment of DEGs. The results of the analyses were downloaded from the web and the figures of enrichment analyses were drawn using the ggplot2 (version 3.3.5) and dplyr (version 1.0.7) R packages.37 Principal component analysis (PCA) is a multivariate statistical method to examine the correlations between multiple variables.38 By deriving a few principal components from the original variables, they retained as much information about the original variables as possible and were not related to each other. PCA was conducted on the all genes set and DEGs subset to identify differences in the transcriptome patterns between the IA and normal samples.
Co-Expression Network Construction by Weighted Gene Co-Expression Network Analysis
The WGCNA (version 1.70–3) R package was used to construct the weighted gene co-expression network.29 Genes with the top 25% variance were selected for the subsequent analysis step. The soft power threshold β was determined by the “pickSoftThreshold” function and the screening criterion of β was an R2 of scale-free fit > 0.85. Topological overlap measure (TOM) matrices were obtained from adjacency matrices to detect gene modules of the co-expression networks. Based on the TOM matrices, the average linkage hierarchical clustering method was used to construct clustering dendrograms with a minimum module size of 50. Similar gene modules were merged, with a threshold of 0.25. The expression profiles of each module were summarized using the eigengene (ME) module and the correlation between the module and clinical status was calculated. The Pearson’s correlation and Student’s asymptotic p-value were calculated by the relative functions in the WGCNA (version 1.70–3) R package.29 Key modules will be detected and further analyzed for GO, KEGG and protein–protein interactions (PPI).
Hub Gene Identification and Receiver Operating Characteristic Curve Analysis
The online tool, String (version 11.0, https://string-db.org/), which is designed for predicting protein–protein interactions (PPI) based on the evidence of experiments and database information, was used to construct a PPI network of all the DEGs and DEGs overlapped with the WGCNA modules.39 Cytoscape software (version 3.8.2) was used for further analysis of PPI networks and hub gene selection.40 The top 10 hub genes in DEGs and each module were selected with the maximal clique centrality (MCC) method using the cytoHubba plugin in Cytoscape.41 The genes with the top 10 MCC values were considered hub genes and visualized together with their connected nodes. Hub genes were used to conduct receiver operating characteristic (ROC) curve analysis with GraphPad software (version 8.0) to show the potential diagnostic value of these genes. Hub genes were validated using the GSE122897 dataset.
Evaluation of Aneurysm-Infiltrating Immune Cells
CIBERSORT is a deconvolution algorithm based on gene expression, which can accurately quantify the relative levels of different immune cell types in a complex gene expression mixture through a set of barcode gene expression values.42 The analysis of infiltrating immune cells on the genes set was carried out using R (version 4.1.0) and the signature genes of 22 types of infiltrating immune cells (LM22 (22 immune cell types)) and CIBERSORT software source code in R were downloaded from CIBERSORT (https://cibersort.stanford.edu/). A filter to remove samples with p > 0.05 from the data was deployed to ensure accurate prediction of the samples. After data processing, three normal and 24 IA samples were included in the follow-up analysis.
Statistical Analysis
Data preprocessing, DEG screening, WGCNA, and immune cell infiltration analysis were performed in R (version 4.1.0). Functional annotation analysis was performed by WebGestalt (version 6.8, http://www.webgestalt.org/). PPI network analyses were conducted using String (version 11.0, https://string-db.org/). Hub genes were mined using MCC with CytoHubba in Cytoscape (version 3.8.2). The ROC curves were drawn with GraphPad (version 8.0). In all analyses, p < 0.05 was taken to indicate statistical significance.
Results
DEGs and Related Pathways
According to the adjusted p < 0.05 and |log2FC| > 1.5, we screened 266 DEGs, of which 162 were upregulated and 104 were downregulated in the IA group compared to the normal group (Figure 2A and B). The top 10 DEGs based on fold change are shown in Table 1 (information for all DEGs is listed in Table S1). To investigate the biological functions of these DEGs, we performed enrichment analysis on GO-BP (Figure 2C) and KEGG (Figure 2D) gene sets (GO-BP and KEGG IDs and further detailed information are provided in Table S2, GO-CC and GO-MF are provided in Figure S4A and B). The results of GO-BP enrichment analysis indicated that inflammatory response, defense response, immune response, and leukocyte activation were significantly enriched, suggesting that immune processes may play essential roles in IA formation and development. Correspondingly, KEGG pathway enrichment analysis suggested that the chemokine signaling pathway, Toll-like receptor signaling pathway, and complement and coagulation cascades may participate in the IA process.
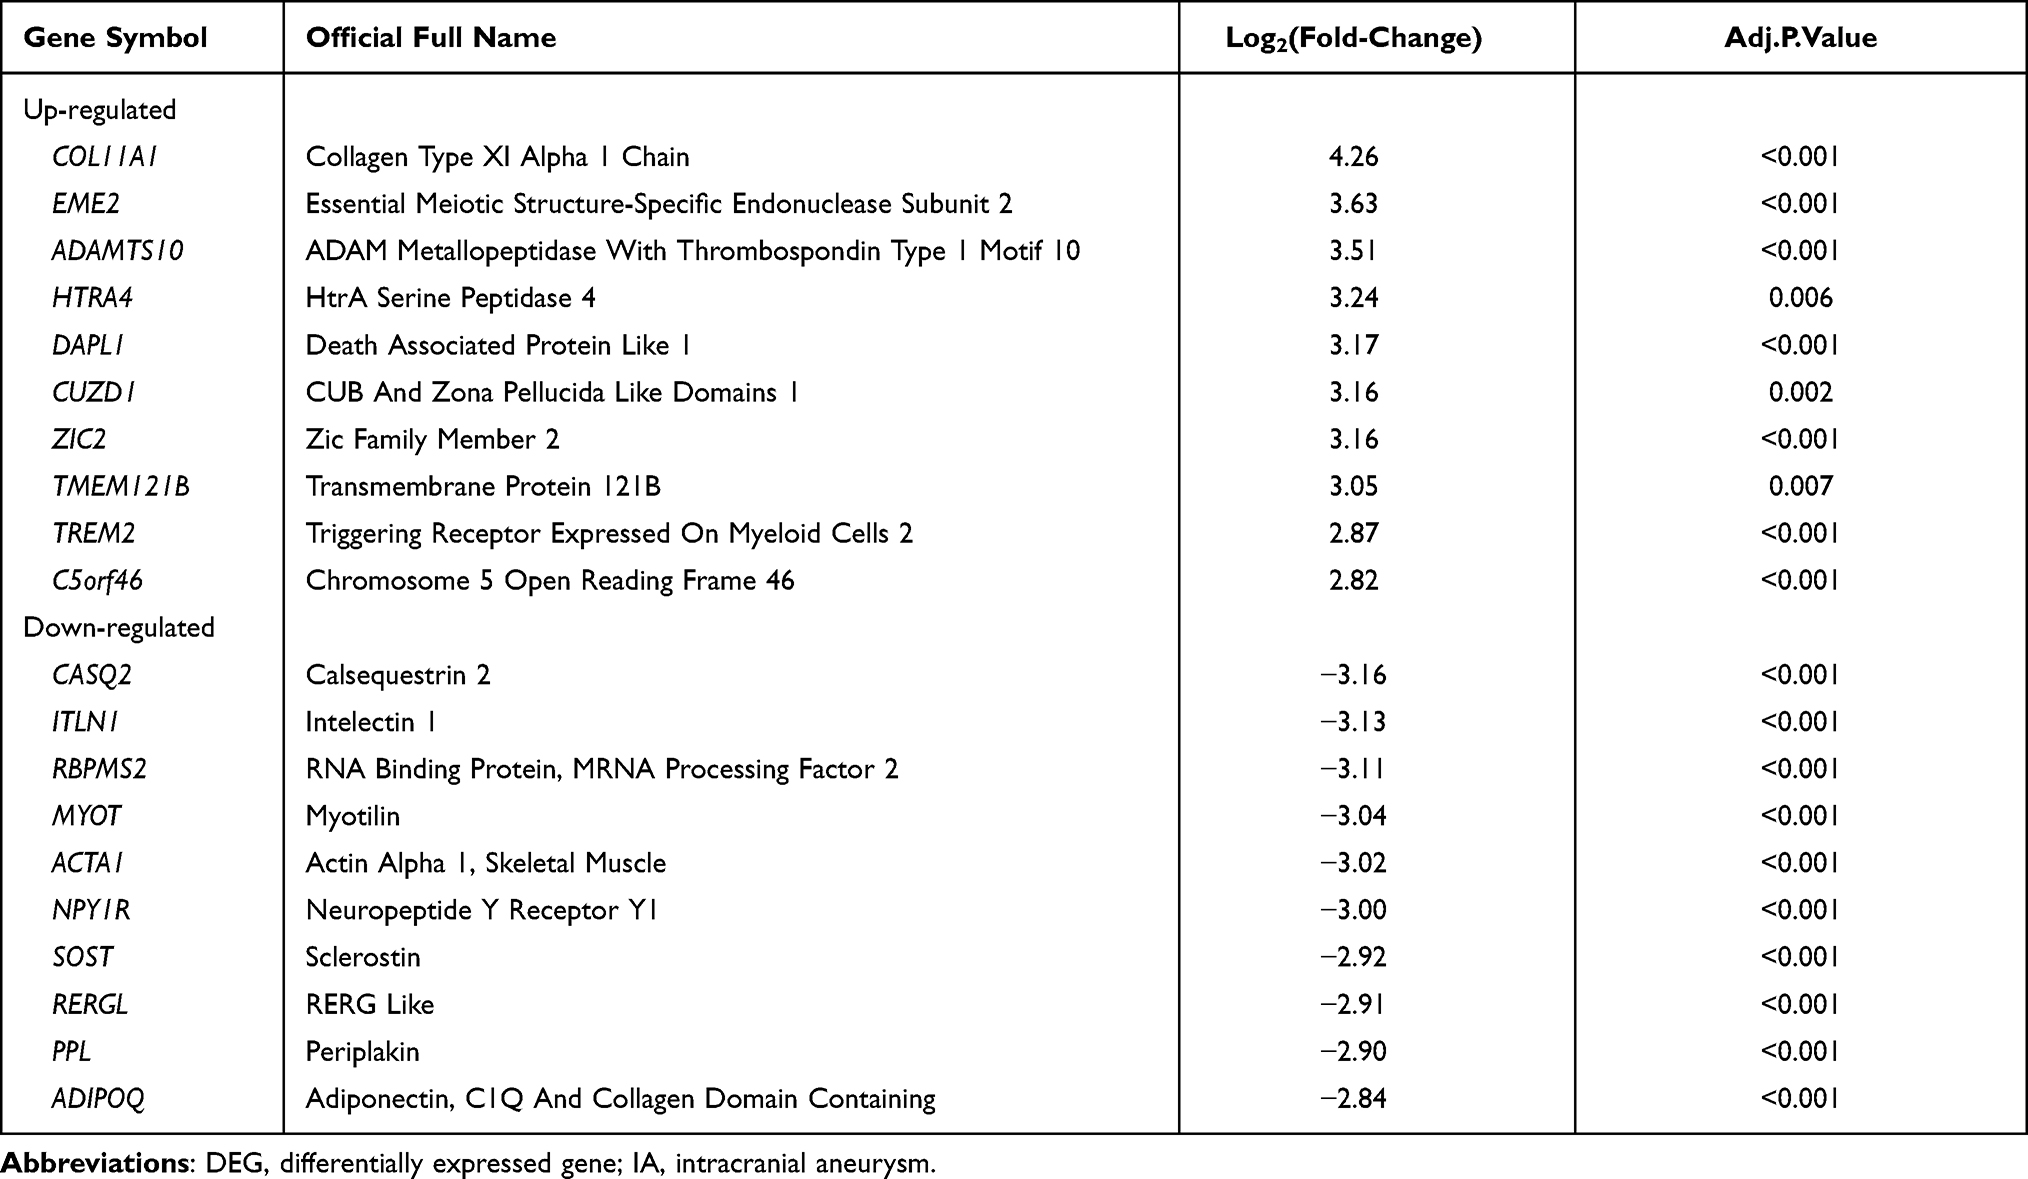 |
Table 1 DEGs with Top-10 Fold-Change Between Normal and IA Samples |
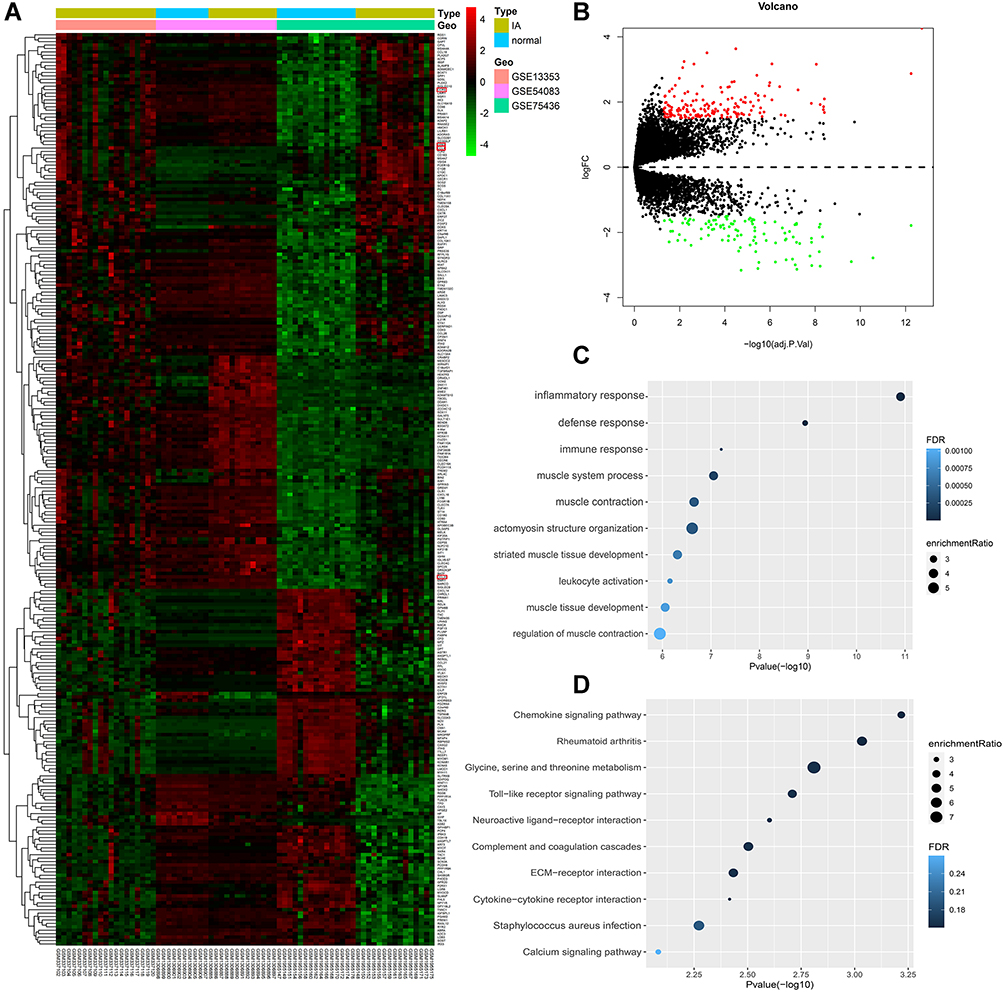 |
Figure 2 Identification and analysis of differentially expressed genes (DEGs). (A) Heatmap for DEGs. (B) Volcano plot for DEGs. (C) Gene set enrichment analysis of Gene Ontology biological process (GO-BP) among all the DEGs. (D) Gene set enrichment analysis of Kyoto Encyclopedia of Genes and Genomes (KEGG) among all the DEGs. |
Principal Component Analysis
PCA was performed on the overall genes and DEGs to determine the expression patterns in IA compared to normal samples. According to PCA on all genes, PC1 and PC2 accounted for 52.1% and 7.7% of gene expression value variation, respectively (Figure S1A, Table S3). The variation proportions of PC1 and PC2 were 44.9% and 20.2%, respectively, in PCA of the DEGs (Figure S1B, Table S3). In addition, the PCA visualization graphs illustrated that there was indeed a difference between the IA and normal groups (Figures 3A, B, S1C and D).
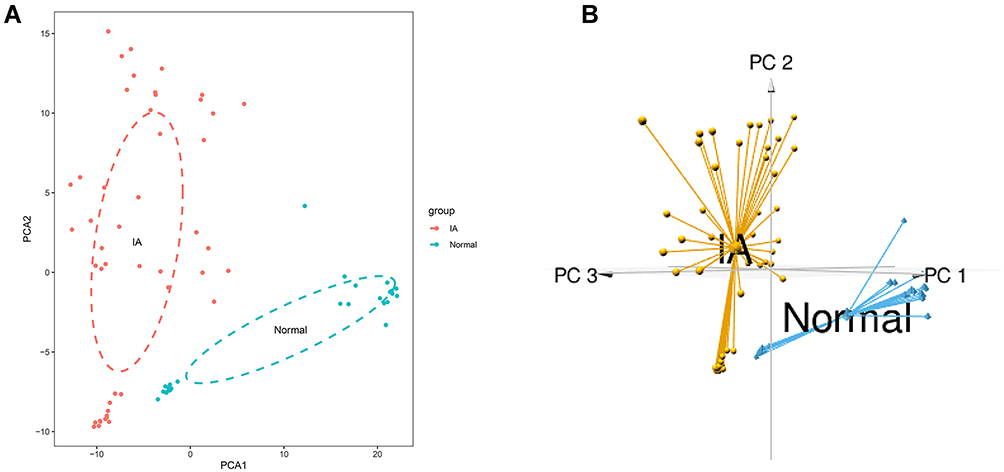 |
Figure 3 Principal Component Analysis (PCA) on the DEGs. (A) 2D-PCA plot of DEGs. (B) 3D-PCA graph of DEGs. |
Weighted Gene Co-Expression Network Construction
WGCNA was performed on 25 normal samples and 47 IA samples. The sample clustering dendrograms are shown in Figure 4A and all samples were located in the clusters and passed the cutoff thresholds. A scale-free network was constructed with a soft threshold of 7 and a correlation coefficient threshold of 0.85 (Figure 4B). The gene modules were detected based on the TOM, and five modules were finally detected (Figure 4C and D). Three modules (red, pink, and blue) were markedly correlated with IA (Figure 4E) (detailed information of genes in each module are provided in Table S4). The genes within blue and pink modules were significantly correlated with IA (Figure 4F–H). Therefore, the blue (1789 genes) and pink (486 genes) modules were defined as the key modules that were highly correlated with IA.
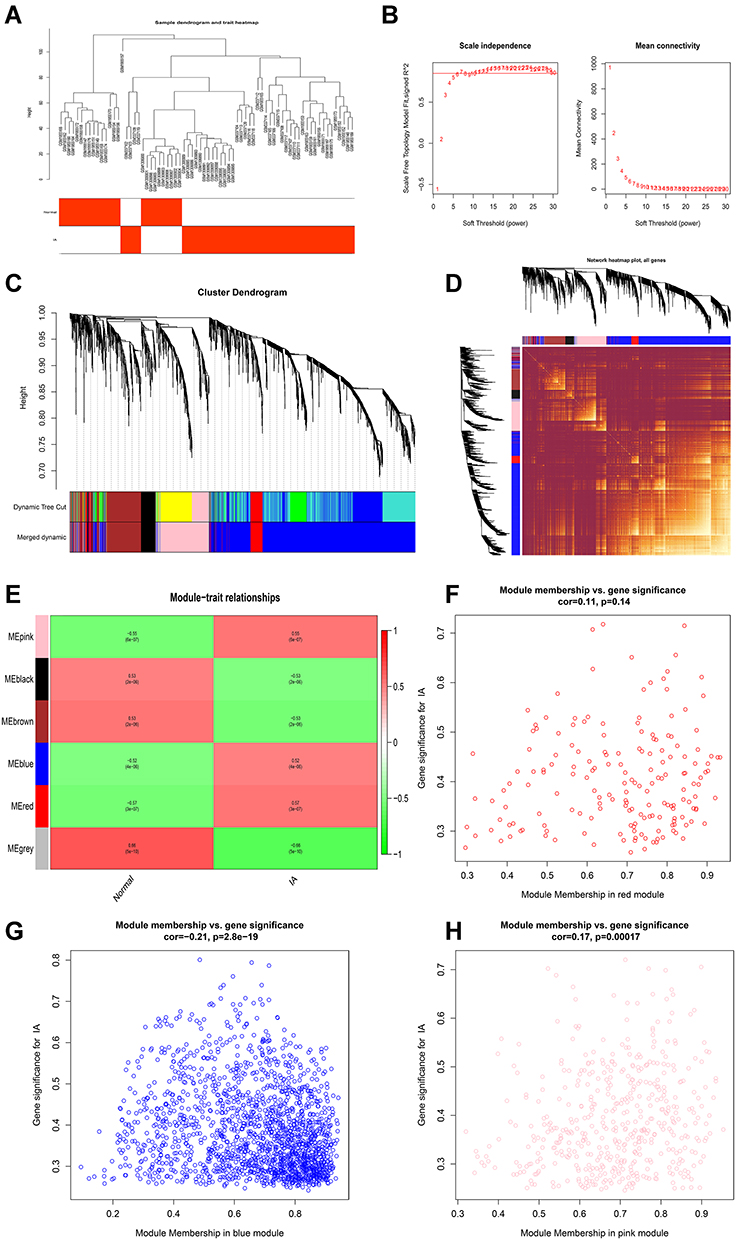 |
Figure 4 Construction of weighted gene co-expression network on IA and normal conditions. (A) Detection of outliers with sample clustering. All samples are located in the clusters and pass the cutoff thresholds. (B) Soft-threshold power analysis implemented to obtain the scale-free fit index of the network topology. (C) Identification of gene modules. (D) Heatmap of the topological overlap matrix (TOM) of genes selected for WGCNA. (E) Correlation heat map of gene modules and phenotypes. (F) Scatter plot of gene and module correlation within red module. (G) Scatter plot of gene and module correlation within blue module. (H) Scatter plot of gene and module correlation within pink module. |
Enrichment Analysis of Key Modules
To explore the physiological and pathological pathways related to IA, the DEGs were intersected with the genes in the blue and pink modules, respectively. GO-BP and KEGG pathway enrichment analysis were performed. The results showed enrichment of immune response, inflammatory response, leukocyte activation, the chemokine signaling pathway, and Toll-like receptor signaling pathway in the blue module (Figure 5A and B, detailed information is shown in Table S5, GO-CC and GO-MF are provided in Figure S4C and D). Enrichment analysis in the pink module suggested that inflammatory response, defense response, myeloid leukocyte cytokine production, cytokine production involved in immune response, regulation of mast cell cytokine production, regulation of inflammatory response, positive regulation of immune system process, leukocyte-mediated immunity, mast cell cytokine production, regulation of interleukin-10 production, and complement and coagulation cascades may be related to IA (Figure 5C and D, detailed information is shown in Table S6, GO-CC and GO-MF are provided in Figure S4E and F).
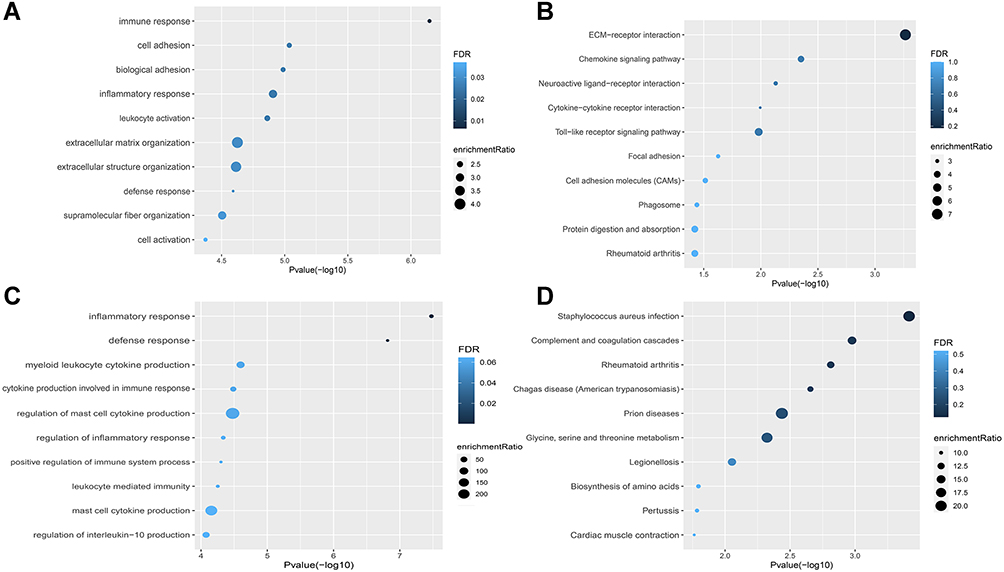 |
Figure 5 Gene set enrichment analysis of GO-BP and KEGG ontologies and pathways among DEGs in blue and pink modules. (A and B) GO-BP and KEGG of DEGs in the blue module. (C and D) GO-BP and KEGG of DEGs in the pink module. |
Identification of the Hub Genes
All DEGs and DEGs in the blue and pink modules were input into the String database to construct PPI networks (Figure S2). The results were downloaded and input into Cytoscape to identify the hub genes using the MCC algorithm in CytoHubba, and the genes with the top 10 MCC values were considered hub genes and visualized together with their connected nodes. Among the hub genes of DEGs and the blue module, CCR5 and CCL20 overlapped (Figure 6A and B), and FPR3 and CCL4 overlapped in the DEGs and the pink module (Figure 6A and C). Therefore, CCR5, CCL20, CCL4, and FPR3 were selected as key genes.
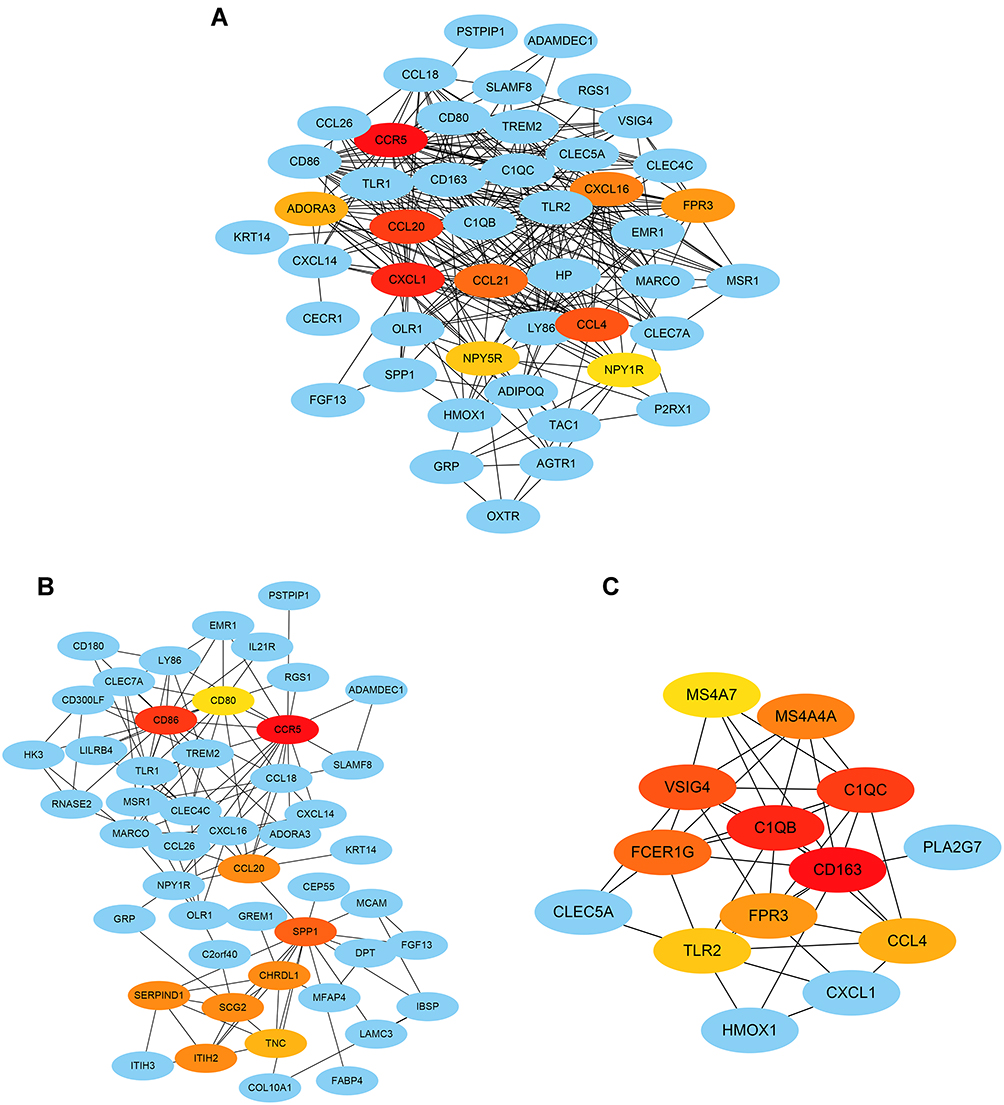 |
Figure 6 Hub genes identification by the CytoHubba algorithm. (A) The top 10 hub genes ranked by the MCC algorithm and their neighbors among all the DEGs. (B) The top 10 hub genes ranked by the MCC algorithm and their neighbors in the blue module. (C) The top 10 hub genes ranked by the MCC algorithm and their neighbors in the pink module. Red-orange-yellow represents key genes, and the darker the color, the stronger the association with other genes. |
Different Immune Infiltrative Patterns Between IA and Normal Conditions
Gene set enrichment analysis of GO-BP and KEGG ontology and pathways indicated that pathways related to the immune process were significantly enriched. Therefore, CIBERSORT was used to evaluate the patterns of immune infiltration between IA and normal conditions. As mentioned in the Methods section, three normal samples and 24 IA samples were included in the CIBERSORT analysis, and the relative proportions of 22 immune cells are shown in Figure 7A and B. The proportion of macrophages was higher in normal samples, while M0 and M2 macrophages showed the opposite trend. The proportion of neutrophils was higher in normal samples and that of activated mast cells was higher in IA samples (Figure 7C).
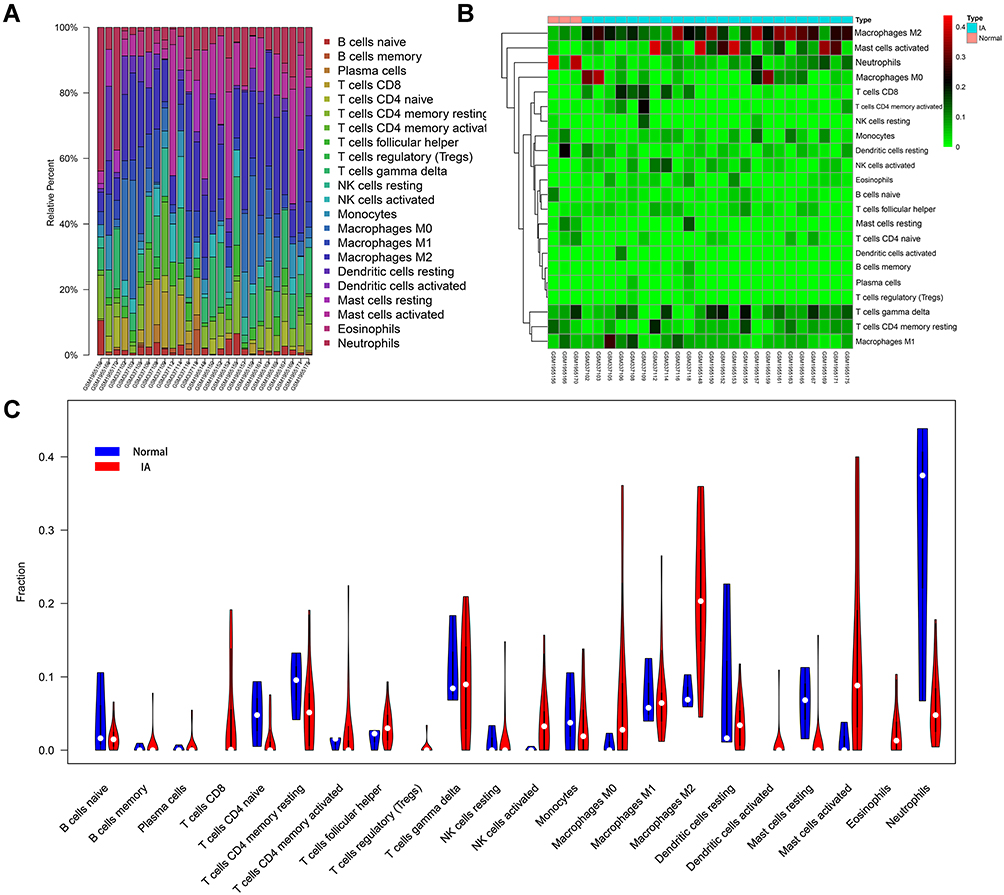 |
Figure 7 Immune infiltrative patterns in IA and normal conditions. (A and B) Histogram of 22 types of immune cells in each IA and normal tissue. (C) Violin chart showing the differences in infiltrating immune cells between the two groups. |
Validation of Key Genes and ROC Analysis
Key genes were validated using the GSE122897 dataset, and the results indicated significant differences in expression levels of all key genes between the normal and IA samples (Figure 8A–D). Finally, ROC analysis was conducted to explore potential biomarkers. The ROC curves for the key genes are shown in Figure 8E–H. The top 10 hub genes of all DEGs were also analyzed by ROC analysis, and the areas under the curves (AUCs) for all of these genes were > 0.7 with p < 0.05. CCL21, NPY1R, and ADORA3 had the highest AUCs (AUCs = 0.907, 0.898, and 0.866, respectively) (Figure S3).
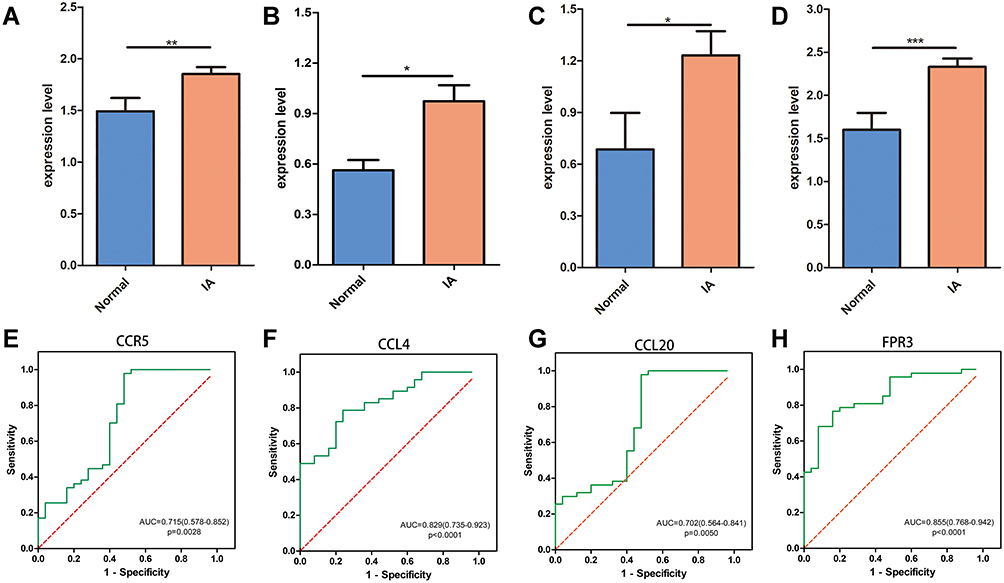 |
Figure 8 ROC analysis and validation of key genes. (A–D) Validation of CCR5, CCL4, CCL20 and FPR3. (E–H) ROC analysis of CCR5, CCL4, CCL20 and FPR3. *P<0.05; **P<0.01; ***P<0.001. |
Discussion
In this study, 266 DEGs were identified, including 162 that were upregulated and 104 that were downregulated in the IA samples. Consistent with previous studies, enrichment analysis of DEGs on GO-BP and KEGG suggested that inflammation and immune-related pathways may be most closely related to IA. To identify the basic modules closely related to IA, we performed WGCNA on IA and normal samples together and obtained two modules related to IA. In addition, functional enrichment analysis of intersecting genes between modules and DEGs also suggested that inflammation and immune processes may play important roles in the development and progression of IA. The hub genes in DEGs and the two modules were identified separately. Among the hub genes, CCR5, CCL4, CCL20, and FPR3 overlapped between the DEGs and the modules, and were selected as key genes. As the key genes were closely related to inflammation and immune processes, we performed immune infiltration analysis in IA and normal samples, and found that the proportions of M2 macrophages and activated mast cells were significantly higher in IA samples. Finally, all of these key genes were validated by another GEO dataset, and ROC analysis indicated that the top ten DEGs have potential diagnostic utility and are potential biomarkers.
A number of studies in human and animal models have confirmed immune cell infiltration dominated by macrophages in IA tissues, which is consistent with the obvious infiltration of macrophages in IA samples observed in the present study.
Chemokines are proinflammatory cytokines, which are the main mediators of macrophage chemotaxis and play a pivotal role in inflammation by activating cell chemotaxis.43 Chemokines can chemoattract inflammatory cells, including macrophages, neutrophils, lymphocytes, fibroblasts, and other inflammatory cells to infiltrate sites of inflammation and exert an inflammatory effect.44 In addition, several chemokines may play different roles in the formation of aneurysms. Abdominal aortic aneurysm (AAA) and IA have similar risk factors, including age, smoking, hypertension, and familial tendencies, and are similar in many of their pathogenic mechanisms and pathological features, including inflammation, oxidative stress, endothelial dysfunction, vascular smooth muscle cell apoptosis, leukocyte infiltration, and MMP-mediated degradation of the ECM leading to weakening of the arterial wall.9,17 CCL2, an effective chemokine for monocytes and macrophages, shows significantly elevated expression in IA, and plays an important role in the formation and development of IA.45–47 Iida et al reported that MKEY, a peptide CXCL4-CCL5 heterodimer inhibitor, suppressed the formation and progression of AAA in mice.48 CCR5, a chemokine G protein-coupled receptor (GPCR) responsible for some of the functions of the chemokines CCL3, CCL4, and CCL5, has mainly been detected in macrophages, T lymphocytes, and dendritic cells.49,50 MacTaggart et al reported that deficiency of CCR5 had no significant effect on the formation or development of AAA,51 while Ishida et al reported that knockout of CCR5 increased the formation of aneurysms in mice, suggesting a preventive effect of CCR5 on aneurysms.52 Another study showed that inhibiting the CCL5/CCR5 axis could reduce macrophage infiltration while suppressing AAA formation and progression, suggesting that CCR5 may have a positive effect on aneurysms.48 The specific role of CCR5 in aneurysms has not yet been definitively elucidated. As the upstream molecule of CCR5, CCL4 is highly expressed in AAA, but further studies are required to determine whether it exerts a role through CRR5 and whether the CCL4/CCR5 axis plays a role in inhibiting or promoting aneurysms.53 CCL20 is expressed in various human tissues and immune cells, mainly observed in the lymph nodes, lungs, and liver, and is produced by cells related to inflammation and autoimmune reactions, such as macrophages, neutrophils, and natural killer (NK) cells, Th17 cells, and B cells.54,55 CCL20 and its specific receptor, CCR6, have been shown to play important roles in autoimmune diseases (rheumatoid arthritis, psoriasis, etc) and tumor diseases (hepatocellular carcinoma, pancreatic cancer, etc).56–58 Co-culture with M2 macrophages was shown to enhance the invasiveness of pancreatic cancer cells, while CCR6 deficiency significantly reduced the invasiveness of the cells, and addition of CCL20 enhanced the epithelial–mesenchymal transition (EMT) of these cells.58 CCL20 expression is also increased in AAA, but further studies are required to determine its role in disease progression.59
Formyl peptide receptor (FPR) belongs to the GPCR family, and three FPRs have been identified, to date, in humans: FPR1–FPR3.60 FPRs are mainly expressed in several types of innate immune cells, including neutrophils and monocytes/macrophages.61 The activation of FPR1 and FPR2 by chemotactic agonists was shown to trigger a series of signaling events, leading to myeloid cell migration, mediator release, increased phagocytosis, and gene transcription, all of which mediate inflammation and immunity.62,63 Although the overall function of FPR3 remains unclear, recent studies have shown that activation of FPR3 can cause the chemotactic migration of neutrophils and improve the survival rate of murine sepsis models, suggesting that FPR3 may play an important role in the inflammatory response.64 However, there have been few studies on the relationship between FPR3 and aneurysms. Further studies are therefore required to determine whether FPR3 is involved in the formation and progression of aneurysms.
Mast cells are the main participants in the inflammatory response and, together with other inflammatory cells, form a specific tissue response to infection and injury. By releasing various mediators, including tryptase, chymotrypsin, cathepsin, and interleukins, activated mast cells can affect vascular inflammation and remodeling.65–67 Zhang et al reported that mast cell tryptase deficiency could attenuate mouse AAA formation.68 Mesenchymal stem cells can suppress the progression of intracranial aneurysms by inhibiting the activation of mast cells.69,70 Furukawa et al suggested that mast cells play a key role in promoting aneurysm rupture but not formation.71 Although mast cells play an important role in the progression of aneurysms, further studies are required to determine the specific underlying molecular mechanisms and whether chemokines are involved in the regulation of mast cells.
This study had several limitations. First, due to the nature of the secondary analysis, it was difficult to assess the reliability of the original samples. Although we included the data of three data sets that were normalized to remove batch effects, the origins of the samples and the processing that had been done previously could not be fully standardized, which would affect subsequent data analysis. For easier filtering of key genes, we only performed follow-up analysis between DEGs in different modules. Although we attempted to avoid this limitation by defining a smaller threshold, to include more candidate genes, we may have lost some information contained in genes that were not significantly differentially expressed. After estimating infiltrating immune cells of aneurysm by CIBERSORT, only three normal and 24 IA samples were included in the follow-up analysis, and this small sample size may have influenced the results of the analysis. Finally, all analyses were based on bioinformatics algorithms, and further experimental and clinical studies are necessary to verify the results. In summary, further studies are needed to confirm the molecular mechanism of IA and its relationship with immune infiltration.
Conclusion
In this study, we introduced an effective method to evaluate the co-expression network of IA and normal conditions. Several DEGs and two modules significantly related to the disease were identified. GO and KEGG functional enrichment analyses showed enrichment of pathways related to inflammatory and immune processes. Hub genes related to chemotaxis may play pivotal roles in the formation and progression of IA. Further analyses suggested that macrophages and mast cells may be the driving factors of IA, which should be examined in further studies.
Data Sharing Statement
All datasets of this study are available in the GEO database (https://www.ncbi.nlm.nih.gov/geo/, accessed on 10 July 2021).
Ethics Statement
The study was conducted in accordance with the Declaration of Helsinki (as revised in 2013). All information from the GEO database is available and free for public and approval was obtained from the Ethics Committee of the First Affiliated Hospital of Nanchang University.
Author Contributions
All authors made a significant contribution to the work reported, whether that is in the conception, study design, execution, acquisition of data, analysis and interpretation, or in all these areas; took part in drafting, revising or critically reviewing the article; gave final approval of the version to be published; have agreed on the journal to which the article has been submitted; and agree to be accountable for all aspects of the work.
Funding
This research was funded by the National Natural Science Foundation of China (NSFC) (No. 81860225), the key research and development plan of Jiangxi Province (No. 20203BBG73060), natural science foundation of Jiangxi Province (No. 20212BAB206029), and young talents research and cultivation foundation of the First Affiliated Hospital of Nanchang University (No. YFYPY202038).
Disclosure
The authors declare no conflicts of interest in this work.
References
1. Brisman JL, Song JK, Newell DW. Cerebral aneurysms. N Engl J Med. 2006;355:928–939. doi:10.1056/NEJMra052760
2. Golledge J, Muller J, Daugherty A, Norman P. Abdominal aortic aneurysm: pathogenesis and implications for management. Arterioscler Thromb Vasc Biol. 2006;26:2605–2613. doi:10.1161/01.ATV.0000245819.32762.cb
3. Vance AZ, Jayaraman MV, Haas RA, Doberstein CE. Intracranial aneurysms: perspectives on the disease and endovascular therapy. Med Health R I. 2009;92:388–393.
4. Macdonald RL, Schweizer TA. Spontaneous subarachnoid haemorrhage. Lancet. 2017;389:655–666. doi:10.1016/S0140-6736(16)30668-7
5. Brouwers PJ, Dippel DW, Vermeulen M, Lindsay KW, Hasan D, van Gijn J. Amount of blood on computed tomography as an independent predictor after aneurysm rupture. Stroke. 1993;24:809–814. doi:10.1161/01.STR.24.6.809
6. van Gijn J, Rinkel GJ. Subarachnoid haemorrhage: diagnosis, causes and management. Brain. 2001;124:249–278. doi:10.1093/brain/124.2.249
7. van Gijn J, Kerr RS, Rinkel GJ. Subarachnoid haemorrhage. Lancet. 2007;369:306–318. doi:10.1016/S0140-6736(07)60153-6
8. Lawton MT, Vates GE. Subarachnoid hemorrhage. N Engl J Med. 2017;377:257–266. doi:10.1056/NEJMcp1605827
9. Vlak MH, Algra A, Brandenburg R, Rinkel GJ. Prevalence of unruptured intracranial aneurysms, with emphasis on sex, age, comorbidity, country, and time period: a systematic review and meta-analysis. Lancet Neurol. 2011;10:626–636. doi:10.1016/S1474-4422(11)70109-0
10. English SW. Long-term outcome and economic burden of aneurysmal subarachnoid hemorrhage: are we only seeing the tip of the iceberg? Neurocrit Care. 2020;33:37–38. doi:10.1007/s12028-020-00943-1
11. Mayer SA, Kreiter KT, Copeland D, et al. Global and domain-specific cognitive impairment and outcome after subarachnoid hemorrhage. Neurology. 2002;59:1750–1758. doi:10.1212/01.WNL.0000035748.91128.C2
12. Turjman AS, Turjman F, Edelman ER. Role of fluid dynamics and inflammation in intracranial aneurysm formation. Circulation. 2014;129:373–382. doi:10.1161/CIRCULATIONAHA.113.001444
13. Starke RM, Chalouhi N, Ali MS, et al. The role of oxidative stress in cerebral aneurysm formation and rupture. Curr Neurovasc Res. 2013;10:247–255. doi:10.2174/15672026113109990003
14. Chalouhi N, Starke RM, Correa T, et al. Differential sex response to aspirin in decreasing aneurysm rupture in humans and mice. Hypertension. 2016;68:411–417. doi:10.1161/HYPERTENSIONAHA.116.07515
15. Soldozy S, Norat P, Elsarrag M, et al. The biophysical role of hemodynamics in the pathogenesis of cerebral aneurysm formation and rupture. Neurosurg Focus. 2019;47:E11. doi:10.3171/2019.4.FOCUS19232
16. Zhang X, Ares WJ, Taussky P, Ducruet AF, Grandhi R. Role of matrix metalloproteinases in the pathogenesis of intracranial aneurysms. Neurosurg Focus. 2019;47:E4. doi:10.3171/2019.4.FOCUS19214
17. Chalouhi N, Hoh BL, Hasan D. Review of cerebral aneurysm formation, growth, and rupture. Stroke. 2013;44:3613–3622. doi:10.1161/STROKEAHA.113.002390
18. Frösen J, Cebral J, Robertson AM, Aoki T. Flow-induced, inflammation-mediated arterial wall remodeling in the formation and progression of intracranial aneurysms. Neurosurg Focus. 2019;47:E21. doi:10.3171/2019.5.FOCUS19234
19. Zou L, Hou Y, Yu B, Li S, Du Y. The effect of intravascular interventional embolization and craniotomy on MMP-2, MMP-9 and caspase3 in serum of intracranial aneurysm patients. Exp Ther Med. 2018;16:4511–4518. doi:10.3892/etm.2018.6740
20. Shi Y, Li S, Song Y, et al. Nrf-2 signaling inhibits intracranial aneurysm formation and progression by modulating vascular smooth muscle cell phenotype and function. J Neuroinflammation. 2019;16:185. doi:10.1186/s12974-019-1568-3
21. Shimizu K, Kushamae M, Mizutani T, Aoki T. Intracranial aneurysm as a macrophage-mediated inflammatory disease. Neurol Med Chir. 2019;59:126–132. doi:10.2176/nmc.st.2018-0326
22. Guo D, Li Y, Wang H, et al. Propofol post-conditioning after temporary clipping reverses oxidative stress in aneurysm surgery. Int J Neurosci. 2019;129:155–164. doi:10.1080/00207454.2018.1483920
23. Aoki T, Kataoka H, Morimoto M, Nozaki K, Hashimoto N. Macrophage-derived matrix metalloproteinase-2 and −9 promote the progression of cerebral aneurysms in rats. Stroke. 2007;38:162–169. doi:10.1161/01.STR.0000252129.18605.c8
24. Etminan N, Buchholz BA, Dreier R, et al. Cerebral aneurysms: formation, progression, and developmental chronology. Transl Stroke Res. 2014;5:167–173. doi:10.1007/s12975-013-0294-x
25. Martino E, Chiarugi S, Margheriti F, Garau G. Mapping, structure and modulation of PPI. Front Chem. 2021;9:718405. doi:10.3389/fchem.2021.718405
26. Liu D, Zhao L, Wang Z, et al. EWASdb: epigenome-wide association study database. Nucleic Acids Res. 2019;47:D989–D993. doi:10.1093/nar/gky942
27. Cao Y, He H, Li R, et al. Latency-associated peptide identifies immunoevasive subtype gastric cancer with poor prognosis and inferior chemotherapeutic responsiveness. Ann Surg. 2022;275:e163–e173. doi:10.1097/SLA.0000000000003833
28. Zhang B, Horvath S. A general framework for weighted gene co-expression network analysis. Stat Appl Genet Mol Biol. 2005;4:e17. doi:10.2202/1544-6115.1128
29. Langfelder P, Horvath S. WGCNA: an R package for weighted correlation network analysis. BMC Bioinform. 2008;9:559. doi:10.1186/1471-2105-9-559
30. Gautier L, Cope L, Bolstad BM, Irizarry RA. Affy–analysis of Affymetrix GeneChip data at the probe level. Bioinformatics. 2004;20:307–315. doi:10.1093/bioinformatics/btg405
31. Ritchie ME, Phipson B, Wu D, et al. Limma powers differential expression analyses for RNA-sequencing and microarray studies. Nucleic Acids Res. 2015;43:e47. doi:10.1093/nar/gkv007
32. Leek JT, Johnson WE, Parker HS, Jaffe AE, Storey JD. The sva package for removing batch effects and other unwanted variation in high-throughput experiments. Bioinformatics. 2012;28:882–883. doi:10.1093/bioinformatics/bts034
33. Kolde R. Pheatmap: pretty heatmaps. 2019.
34. Gene Ontology Consortium. The gene ontology (GO) project in 2006. Nucleic Acids Res. 2006;34:D322–D326. doi:10.1093/nar/gkj021
35. Kanehisa M, Sato Y, Kawashima M, Furumichi M, Tanabe M. KEGG as a reference resource for gene and protein annotation. Nucleic Acids Res. 2016;44:D457–D462. doi:10.1093/nar/gkv1070
36. Liao Y, Wang J, Jaehnig EJ, Shi Z, Zhang B. WebGestalt 2019: gene set analysis toolkit with revamped UIs and APIs. Nucleic Acids Res. 2019;47:W199–W205. doi:10.1093/nar/gkz401
37. Ito K, Murphy D. Application of ggplot2 to pharmacometric graphics. CPT Pharmacometrics Syst Pharmacol. 2013;2:e79. doi:10.1038/psp.2013.56
38. David CC, Jacobs DJ. Principal component analysis: a method for determining the essential dynamics of proteins. Methods Mol Biol. 2014;1084:193–226.
39. Szklarczyk D, Gable AL, Lyon D, et al. STRING v11: protein-protein association networks with increased coverage, supporting functional discovery in genome-wide experimental datasets. Nucleic Acids Res. 2019;47:D607–D613. doi:10.1093/nar/gky1131
40. Doncheva NT, Morris JH, Gorodkin J, Jensen LJ. Cytoscape StringApp: network analysis and visualization of proteomics data. J Proteome Res. 2019;18:623–632. doi:10.1021/acs.jproteome.8b00702
41. Chin CH, Chen SH, Wu HH, Ho CW, Ko MT, Lin CY. CytoHubba: identifying hub objects and sub-networks from complex interactome. Bmc Syst Biol. 2014;8(Suppl 4):S11. doi:10.1186/1752-0509-8-S4-S11
42. Newman AM, Liu CL, Green MR, et al. Robust enumeration of cell subsets from tissue expression profiles. Nat Methods. 2015;12:453–457. doi:10.1038/nmeth.3337
43. Boiardi L, Vaglio A, Nicoli D, et al. CC chemokine receptor 5 polymorphism in chronic periaortitis. Rheumatology. 2011;50:1025–1032. doi:10.1093/rheumatology/keq416
44. Baggiolini M. Chemokines and leukocyte traffic. Nature. 1998;392:565–568. doi:10.1038/33340
45. Aoki T, Kataoka H, Nishimura M, Ishibashi R, Morishita R, Miyamoto S. Ets-1 promotes the progression of cerebral aneurysm by inducing the expression of MCP-1 in vascular smooth muscle cells. Gene Ther. 2010;17:1117–1123. doi:10.1038/gt.2010.60
46. Hoh BL, Fazal HZ, Hourani S, Li M, Lin L, Hosaka K. Temporal cascade of inflammatory cytokines and cell-type populations in monocyte chemotactic protein-1 (MCP-1)-mediated aneurysm healing. J Neurointerv Surg. 2018;10:301–305. doi:10.1136/neurintsurg-2017-013063
47. Zhang HF, Zhao MG, Liang GB, Song ZQ, Li ZQ. Expression of pro-inflammatory cytokines and the risk of intracranial aneurysm. Inflammation. 2013;36:1195–1200. doi:10.1007/s10753-013-9655-6
48. Iida Y, Xu B, Xuan H, et al. Peptide inhibitor of CXCL4-CCL5 heterodimer formation, MKEY, inhibits experimental aortic aneurysm initiation and progression. Arterioscler Thromb Vasc Biol. 2013;33:718–726. doi:10.1161/ATVBAHA.112.300329
49. Mueller A, Strange PG. The chemokine receptor, CCR5. Int J Biochem Cell Biol. 2004;36:35–38. doi:10.1016/S1357-2725(03)00172-9
50. Charo IF, Ransohoff RM. The many roles of chemokines and chemokine receptors in inflammation. N Engl J Med. 2006;354:610–621. doi:10.1056/NEJMra052723
51. MacTaggart JN, Xiong W, Knispel R, Baxter BT. Deletion of CCR2 but not CCR5 or CXCR3 inhibits aortic aneurysm formation. Surgery. 2007;142:284–288. doi:10.1016/j.surg.2007.04.017
52. Ishida Y, Kuninaka Y, Nosaka M, et al. Prevention of CaCl2-induced aortic inflammation and subsequent aneurysm formation by the CCL3-CCR5 axis. Nat Commun. 2020;11:5994. doi:10.1038/s41467-020-19763-0
53. Jones GT, Phillips LV, Williams MJ, van Rij AM, Kabir TD. Two C-C family chemokines, eotaxin and RANTES, are novel independent plasma biomarkers for abdominal aortic aneurysm. J Am Heart Assoc. 2016;5. doi:10.1161/JAHA.115.002993
54. Schutyser E, Struyf S, Van Damme J. The CC chemokine CCL20 and its receptor CCR6. Cytokine Growth Factor Rev. 2003;14:409–426. doi:10.1016/S1359-6101(03)00049-2
55. Meissner A, Zilles O, Varona R, et al. CC chemokine ligand 20 partially controls adhesion of naive B cells to activated endothelial cells under shear stress. Blood. 2003;102:2724–2727. doi:10.1182/blood-2003-01-0007
56. Baba M, Imai T, Nishimura M, et al. Identification of CCR6, the specific receptor for a novel lymphocyte-directed CC chemokine LARC. J Biol Chem. 1997;272:14893–14898. doi:10.1074/jbc.272.23.14893
57. Kadomoto S, Izumi K, Mizokami A. The CCL20-CCR6 axis in cancer progression. Int J Mol Sci. 2020;21:5186. doi:10.3390/ijms21155186
58. Liu B, Jia Y, Ma J, et al. Tumor-associated macrophage-derived CCL20 enhances the growth and metastasis of pancreatic cancer. Acta Biochim Biophys Sin. 2016;48:1067–1074. doi:10.1093/abbs/gmw101
59. Soto B, Gallastegi-Mozos T, Rodríguez C, et al. Circulating CCL20 as a new biomarker of abdominal aortic aneurysm. Sci Rep. 2017;7:17331. doi:10.1038/s41598-017-17594-6
60. Ye RD, Boulay F, Wang JM, et al. International Union of Basic and Clinical Pharmacology. LXXIII. Nomenclature for the formyl peptide receptor (FPR) family. Pharmacol Rev. 2009;61:119–161. doi:10.1124/pr.109.001578
61. Lee HY, Lee M, Bae YS. Formyl peptide receptors in cellular differentiation and inflammatory diseases. J Cell Biochem. 2017;118:1300–1307. doi:10.1002/jcb.25877
62. Cattaneo F, Parisi M, Ammendola R. Distinct signaling cascades elicited by different formyl peptide receptor 2 (FPR2) agonists. Int J Mol Sci. 2013;14:7193–7230. doi:10.3390/ijms14047193
63. Chen K, Bao Z, Gong W, Tang P, Yoshimura T, Wang JM. Regulation of inflammation by members of the formyl-peptide receptor family. J Autoimmun. 2017;85:64–77. doi:10.1016/j.jaut.2017.06.012
64. Lee HY, Kim HS, Jeong YS, et al. A membrane-tethering pepducin derived from formyl peptide receptor 3 shows strong therapeutic effects against sepsis. Biochem Biophys Res Commun. 2020;524:156–162. doi:10.1016/j.bbrc.2020.01.058
65. Iadecola C, Anrather J. The immunology of stroke: from mechanisms to translation. Nat Med. 2011;17:796–808. doi:10.1038/nm.2399
66. Kalesnikoff J, Galli SJ. New developments in mast cell biology. Nat Immunol. 2008;9:1215–1223. doi:10.1038/ni.f.216
67. Company C, Piqueras L, Naim ANY, et al. Contributions of ACE and mast cell chymase to endogenous angiotensin II generation and leukocyte recruitment in vivo. Cardiovasc Res. 2011;92:48–56. doi:10.1093/cvr/cvr147
68. Zhang J, Sun J, Lindholt JS, et al. Mast cell tryptase deficiency attenuates mouse abdominal aortic aneurysm formation. Circ Res. 2011;108:1316–1327. doi:10.1161/CIRCRESAHA.111.243758
69. Liu J, Kuwabara A, Kamio Y, et al. Human mesenchymal stem cell-derived microvesicles prevent the rupture of intracranial aneurysm in part by suppression of mast cell activation via a PGE2-dependent mechanism. Stem Cells. 2016;34:2943–2955. doi:10.1002/stem.2448
70. Kuwabara A, Liu J, Kamio Y, et al. Protective effect of mesenchymal stem cells against the development of intracranial aneurysm rupture in mice. Neurosurgery. 2017;81:1021–1028. doi:10.1093/neuros/nyx172
71. Furukawa H, Wada K, Tada Y, et al. Mast cell promotes the development of intracranial aneurysm rupture. Stroke. 2020;51:3332–3339. doi:10.1161/STROKEAHA.120.030834
 © 2022 The Author(s). This work is published and licensed by Dove Medical Press Limited. The full terms of this license are available at https://www.dovepress.com/terms.php and incorporate the Creative Commons Attribution - Non Commercial (unported, v3.0) License.
By accessing the work you hereby accept the Terms. Non-commercial uses of the work are permitted without any further permission from Dove Medical Press Limited, provided the work is properly attributed. For permission for commercial use of this work, please see paragraphs 4.2 and 5 of our Terms.
© 2022 The Author(s). This work is published and licensed by Dove Medical Press Limited. The full terms of this license are available at https://www.dovepress.com/terms.php and incorporate the Creative Commons Attribution - Non Commercial (unported, v3.0) License.
By accessing the work you hereby accept the Terms. Non-commercial uses of the work are permitted without any further permission from Dove Medical Press Limited, provided the work is properly attributed. For permission for commercial use of this work, please see paragraphs 4.2 and 5 of our Terms.