")
Back to Journals » Diabetes, Metabolic Syndrome and Obesity » Volume 12
Potential role of circulating microRNAs (486-5p, 497, 509-5p and 605) in metabolic syndrome Egyptian male patients
Authors Bakr Zaki M , Abulsoud AI , Elsisi AM, Doghish AS , Mansour OAE , Amin AI , Elrebehy MA, Mohamed MY, Goda MA
Received 3 October 2018
Accepted for publication 27 March 2019
Published 6 May 2019 Volume 2019:12 Pages 601—611
DOI https://doi.org/10.2147/DMSO.S187422
Checked for plagiarism Yes
Review by Single anonymous peer review
Peer reviewer comments 2
Editor who approved publication: Dr Steven F. Abcouwer
Mohamed Bakr Zaki,1 Ahmed Ibrahim Abulsoud,1,2 Ahmed Mohamed Elsisi,2,3 Ahmed Soliman Doghish,2,4 Ossama Abd Elmotaal Mansour,2 Ashraf Ismail Amin,5 Mahmoud Ahmed Elrebehy,4 Mohamed Yousef Mohamed,6 Mohamed Ahmed Goda6
1Biochemistry Department, Faculty of Pharmacy, Heliopolis University, El-Nahda, Cairo Governorate 11777, Egypt; 2Biochemistry Department, Faculty of Pharmacy, Al-Azhar University, Nasr City, Cairo, 13465, Egypt; 3Biochemistry Department, Faculty of Pharmacy, Nahda University, Beni-Suef, Egypt; 4Biochemistry Department, Faculty of Pharmacy, Badr University in Cairo, Badr City, Cairo, Egypt; 5Department of Chemical and Clinical Pathology, National Institute of Diabetes and Endocrinology, Kasr El Ainy, Cairo, Egypt; 6Clinical Pharmacy Department, Faculty of Pharmacy (boys), Al-Azhar University, Nasr City, Cairo 13465, Egypt
Objective: This study aims to evaluate the expression pattern of circulating microRNAs (miR)-486-5p, miR-497, miR-509-5p, and miR-605 in the serum of metabolic syndrome (MetS) Egyptian male patients.
Methods: In this study, the circulating miR-486-5p, miR-497, miR509-5p, and miR-605 were amplified and quantitatively detected by quantitative real-time polymerase chain reaction in sera of 55 MetS male patients in comparison to 20 male controls. The level of fasting plasma glucose and triacylglycerol (TAG) were measured using calorimetric assay. Blood pressure was measured using mercuric sphygmomanometer. Anthropometric measurements were done to each individual. Furthermore, MetS patients were defined according to the criteria proposed by the American Heart Association and divided into three groups according to MetS index.
Results: The study was performed on three groups and a control group defined as follows: group 1: 15 MetS patients who fulfilled all diagnostic criteria of MetS; group 2: 20 MetS patients with normal blood pressure; group 3: 20 MetS patients with normal TAG levels.The levels of miRs are expressed as [median (IQR)]. miR-486-5-p and miR-497 expression were elevated in group 1 [31.9(49), p˂0.0001; 73.1(42.5), p˂0.0001], group 2 [36.4(15.7), p˂0.0001; 68.3(54.8), p˂0.0001], and group (3) [10.8(18.9), p=0.0014; 27.5(39.7), p=0.0012]. MiR-509-5p was elevated in groups 1 and 2 [501(468), p=0.0001], [309(436), p=0.0006], respectively, while normally expressed in group 3 [0.93(0.077), p=0.0001]. miR-605 was elevated in groups 1 and 3 [25.4(20.0), p=0.0018], [54.8(65.8), p˂0.0001], while normally expressed in group 2 [0.84(0.67), p˂0.0001].
Conclusion: miRs (486-5p, 497, 509-5p, and 605) serum levels were higher in MetS patients than in healthy control subjects; therefore, these serum miRs can serve as early biomarkers and can be used to follow-up the prognosis of MetS.
Keywords: metabolic syndrome (MetS), miR-486-5p, miR-497, miR509-5p, miR-605, metabolic syndrome index (MSI)
Introduction
Metabolic syndrome (MetS) is the clustering of numerous inter-related risk factors for cardiovascular (CV) and cerebrovascular disease, consisting of visceral obesity, atherogenic dyslipidemia, insulin resistance (IR), and high blood pressure (BP).1 Not only is MetS an epidemiological clustering of risk factors but it also has a common underlying pathophysiological cause; IR associated with visceral obesity. These are caused by genetic factors and early life influences in addition to a range of lifestyle risk factors, including sleep deprivation and physical dormancy.2
Among American adults aged 18 years or older, the epidemiology of MetS showed an increase by more than 35% from 1988–1994 to 2007–2012, increasing from 25.3% to 34.2%.3 Among Arab populations, the prevalence estimates are 30% in Tunisia, 21% in Saudi Arabia, and 36.3% in Jordan.4 However, In Egypt, the prevalence of the MetS is considerable among adolescents (with overall prevalence of 7.4%), particularly among obese participants.5 An Egyptian study that included 67.3% middle-aged and senior males of the investigated sample, showed that 59.5% of the male participants had MetS.6
The goal of diagnosing MetS is to identify persons at increased risk of CV diseases. Furthermore, the risk of developing type 2 diabetes mellitus (T2DM) is amplified fivefold in the presence of MetS, which is considered to be one of the most costly medical disorders worldwide due to its chronic complications that can drain the health resources of any given country.7 What makes the diagnosis of MetS difficult is the absence of one particular definition for the syndrome, and the difference in lifestyle factors which makes the identification of the genetic component of MetS challenging.8
The appearance of small non-protein-coding RNAs known as microRNAs (miRs); a category of small RNAs encoded in the genomes of human, animals, and plants which are stable in serum and play important roles in metabolic hemostasis has opened new opportunities for early MetS diagnosis and follow-up of case prognosis.9 Furthermore, miRs are involved in highly regulated processes, such as cell proliferation, differentiation, apoptosis, and metabolic processes. The significance of miRs in maintaining metabolic homeostasis has been established, and thus regulation of these miRs could serve as potential therapeutics in metabolic disorders.10
miRs are known to play important roles in the pathogenesis of MetS; upregulation or downregulation of multiple miRs can contribute to MetS by altering many pathways.11 Thus, the use of miRs for clinical testing of diseases is applicable as numerous studies concluded the presence of statistically significant differences between healthy and MetS patients in miRs levels.
Grounded on intensive revising of the scientific literature regarding the role of miRs as metabolic processes regulators, the studied miRs: miR-486-5p, miR-497, miR-509-5p, and miR-605 were nominated according to their biological availability in different human specimens, but with inadequate studies to their role in MetS. The aim of this study was to assess the feasibility of using miRNAs to improve early diagnosis and follow-up the prognosis of MetS when compared to ordinary used laboratory tests as follows:
- Evaluation of expression pattern of miR-486-5p, mir-497, miR-509-5p, and miR-605 in the serum of MetS patients.
- Investigate; if there is a correlation between levels of miRNAs expression and MetS criteria in serum of MetS patients.
- Investigate; if there is a correlation between the expression levels of the abovementioned miRNAs.
Subjects and methods
Subject recruitment and study design
Serum samples from adult males who had been enrolled in this study were collected from the National Institute of Diabetes and Endocrinology under a physician supervision.
Exclusion criteria for MetS patients and normal control subjects included the following: 1) significant clinical neurological or hepatic disease; 2) females; 3) aged above 50 years; 4) smoking; 5) major systemic diseases including malignancy; 6) a major acute or chronic CV event. In our study, we excluded female subjects to avoid the effect of fluctuation of the menstrual cycle that may affect serum miRs concentration.
This study was conducted in accordance with the declaration of Helsinki and reviewed by the ethics committee of National Organization for Teaching Hospitals and Institutes (permit number: IDE00227), and written informed consent was signed by all study subjects.
There were 75 male subjects enrolled in this study, 20 of them were apparently healthy without any MetS criteria, and they served as control subjects. The remaining 55 were diagnosed according to the criteria proposed by the American Heart Association as MetS patients and divided into three groups considering MetS index (MSI) criteria.12 The MSI is a 5-point scale that assigns one point to each of the five MetS components (waist circumference [WC], BP, triacylglycerol [TAG], high-density lipoprotein-cholesterol [HDL-C], and fasting plasma glucose [FPG]). The patient is considered to have MetS in the presence of any three or more of the above components.13
Diagnosis of MetS patients
Anthropometric parameters were taken from all participants, BP had been measured, FPG, serum TAG level, and serum HDL-C level were assayed by enzymatic colorimetric method. The participant was considered as MetS patient if he had three or more of the following criteria: WC≥102 cm, FPG≥100 mg/dL, TAG≥150 mg/dL, BP≥130/85 mmHg, and HDL-C<40 mg/dL.
The diagnosed subjects were divided into three groups:
Group (1): 15 subjects who scored 5 of 5 on MSI scale.
Group (2): 20 subjects who scored 4 of 5 on MSI scale with normal BP-values.
Group (3): 20 subjects who scored 3 of 5 on MSI scale with normal TAG and HDL-C values.
Serum total RNA extraction including miRs
The aim of this study was achieved by using quantitative real-time reverse transcription polymerase chain reaction (qRT-PCR). Total RNA including miRNA from 200 µL serum was isolated using the miRNeasy Mini kit (Cat. No.217004; Qiagen, Hilden, Germany) according to the manufacturer’s protocol. The isolated RNA was eluted in 40 µL of RNase-free water and stored at −80°C until the subsequent step. Concentrations (ng/µL) and purity of all RNA eluted samples were measured using NanoDrop® 1,000 spectrophotometer (Thermo Scientific, Wilmington, DE, USA). Absorbance at 260 nm was used to measure the concentration of RNA in the sample, whereas ratios of absorbance at 260/280 and at 260/230 nm were evaluated to identify RNA purity.
mIRs reverse transcription into complementary DNA
Using a miScript HiSpec buffer supplied in miScript® II RT Kit (Cat. No. 218161; Qiagen, Germany) according to the producer’s directives, 60 ng of total RNA was reverse transcribed. The yielded complementary DNA was stored at −20°C until carrying out the final step.
Quantification of mature miRs using qRT-PCR
After reverse transcription qRT-PCR was used for quantification of mature miR-486-5p, miR-497, miR-509-5p, and miR-605 expressions using miScript SYBR® Green PCR Kit (200) (Cat. No. 218073; Qiagen, Germany) in accordance with the manufacturer’s guidelines. Target-specific miScript Primer Assay for the selected miRs was used in this step (Qiagen, Germany). Primers for miR-486-5p (hsa-miR-486-5p/MIMAT0002177), miR-497 (has-miR-497/MIMAT0002820), miR-509-5p (has-miR-509-5p/MIMAT0004779), miR-605 (has-mir-605/MIMAT0003273), and endogenous control miScript Primer Assay SNORD68 (Hs_SNORD68_11 miScript Primer Assay (MS00033712) were used for data normalization and relative quantification. The reaction was carried out in the Step One qRT-PCR system (Applied Biosystems, CA, USA).
Real-time PCR data interpretation
Fold change of the qualified expression of the mature miRs was calculated by the relative cycle threshold (2−∆∆Ct) method afterward completing qRT-PCR cycles. Upregulation of the target gene was identified by the positive result of the fold change, while negative results indicate downregulation of the target gene. So, the results were expressed as fold change compared to the control sample which was considered the normal value and assumed to be equal 1. A detailed description of the materials and methods used in this study can be found in the online available kits manuals and instructions provided by manufacturers.
Statistical analysis
GraphPad prism® version 6.02 and Microsoft Excel 2016 were used for analysis of all the data and charts construction, values were represented as mean±standard error of the mean, median, IQR numbers, and percentage.
Data of the groups and subgroups were subjected to D’Agostino and Pearson omnibus normality test to determine the normal distribution pattern. However, the data of each miRNA did not pass the normality test, so the Kruskal–Wallis test was used to detect the statistical differences regarding the expression fold change of the studied miRs between the different groups. Moreover, Man–Whitney (U) tests were used to detect the statistical differences regarding the expression fold change of the studied miRs between the different groups and subgroups when appropriate. To find a correlation between two variables, Spearman’s rho (r) was calculated.
Results
MetS patients demographic, anthropometric, and clinical data
Anthropometric and metabolic characteristics of the individuals involved in the study are shown in Table 1.
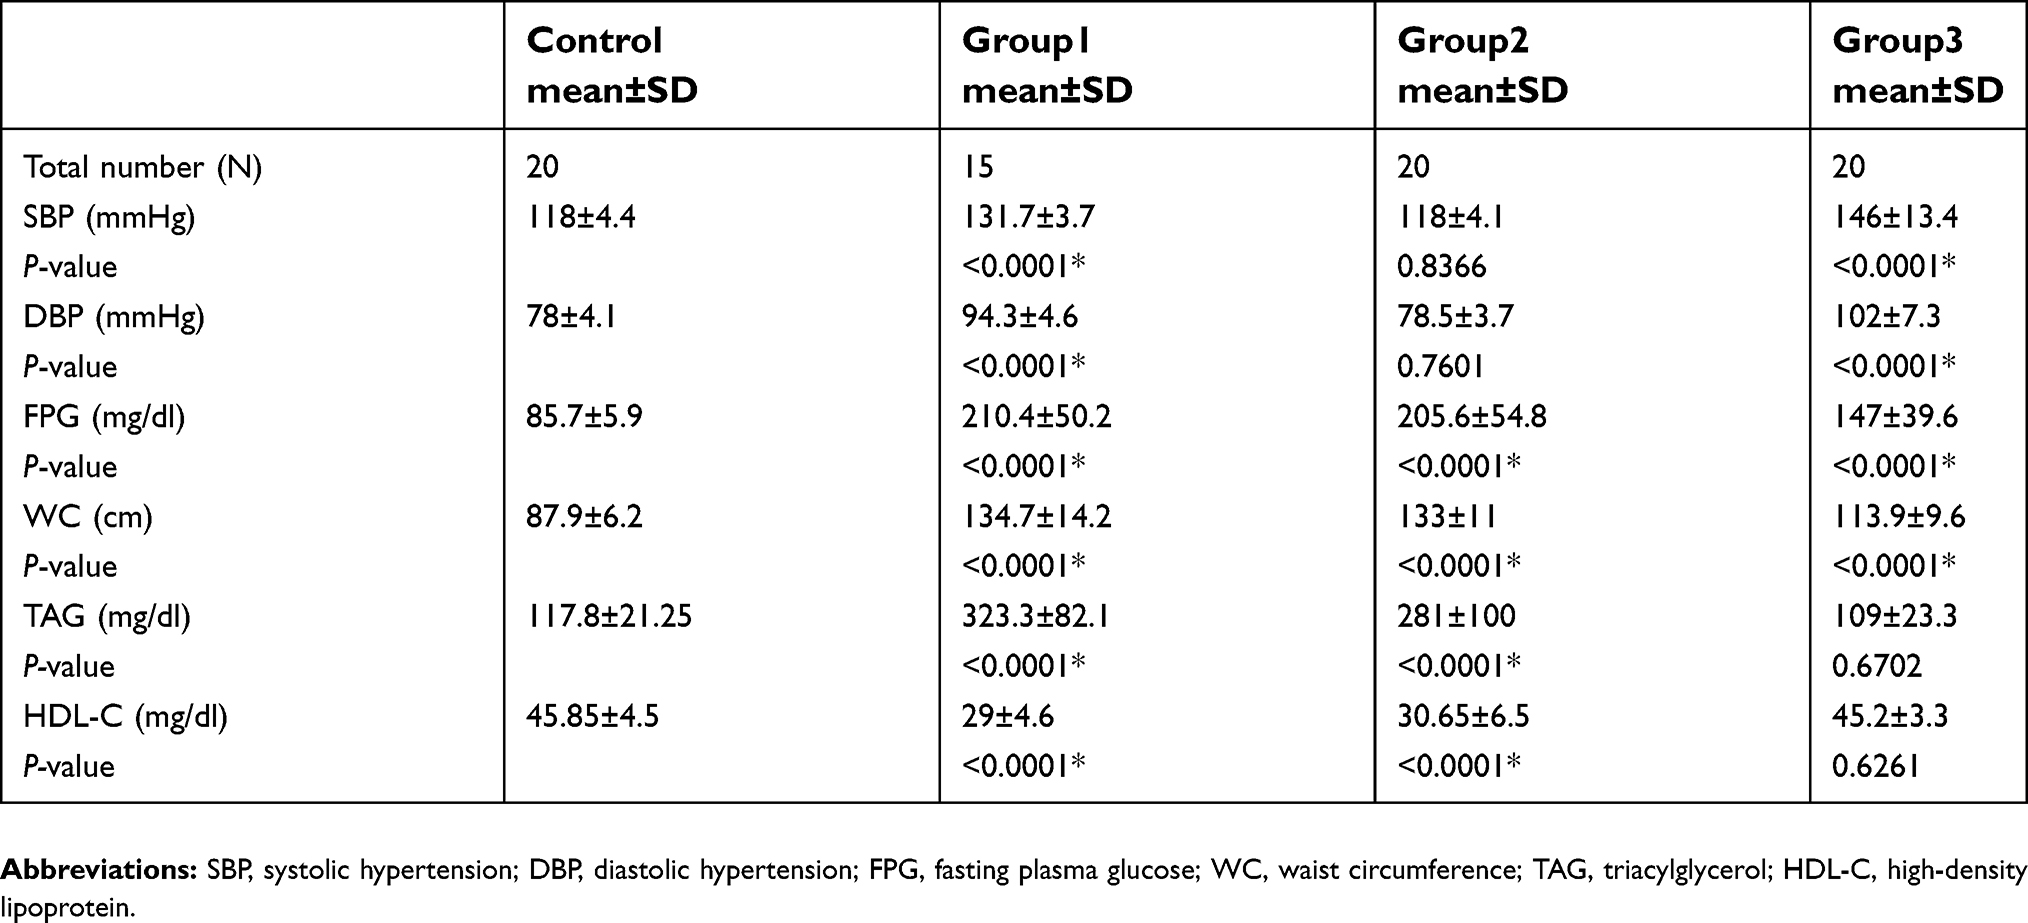 | Table 1 Anthropometric and metabolic characteristics of subjects |
Group (1) 15 subjects who scored 5 of 5 on MSI scale with large WC (cm) (134.7±14.2), elevated FPG level (mg/dL) (210.4±50.2), elevated systolic BP, diastolic BP (mmHg) (131±3.76, 94.3±4.6) respectively, elevated TAG level (mg/dL) (323.3±82.1) and lower HDL-C level (mg/dL) (29±4.6) than normal.
Group (2) 20 subjects who scored 4 of 5 on MSI scale with large WC (cm) (133±11), elevated FPG level (mg/dL) (205.6±54.8), normal systolic BP, diastolic BP (mmHg) (118±4.1, 78.5±3.7) respectively, elevated TAG level (mg/dL) (284±100), and lower HDL-C level (mg/dL) (30.6±6.5) than normal.
Group (3) 20 subjects who scored 3 of 5 on MSI scale with large WC (cm) (113.9±9.6), elevated FPG level (mg/dL) (147±39.6), elevated systolic BP, diastolic BP (mmHg) (146±13.4, 102±7.3) respectively, normal TAG level (mg/dL) (109±23.3), and normal HDL-C level (mg/dL) (45.2±3.3). Overall, there is a significant increase in expression of miR-497 in cases compared to control.
miR-486-5p relative expression in MetS patients
It was found that the expression of miR-486-5p was predominantly upregulated in sera of groups (1), (2), and (3) [31.9(43.9), 36.4(15.7), and 10.8(18.9), respectively] with great statistical significance from control subjects as shown in Figure 1A and Table 2. Overall, there is a significant increase in expression of miR-486-5p in cases compared to control Figure 1B. Not to mention that there was a highly significant positive correlation between miR-486-5p expression fold change and WC in MetS patients and there was no significant correlation between miR-486-5p expression fold change in MetS cases sera and BMI.
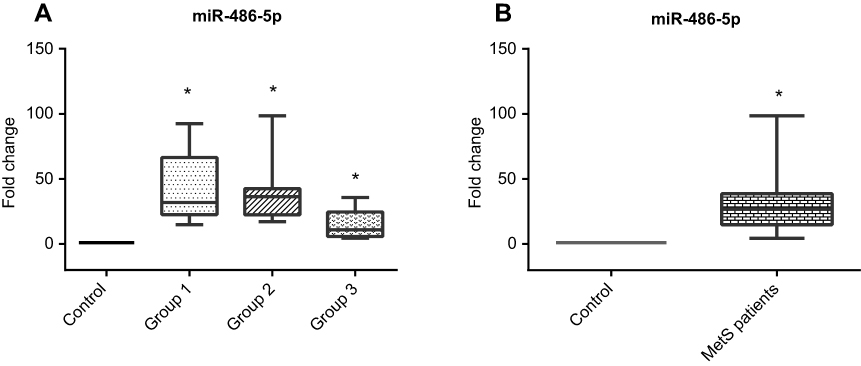 | Figure 1 (A) Serum miR-486-5p relative expression pattern in different MetS groups compared to control group, (B) Serum miR-486-5p relative expression pattern in total MetS cases compared to control group.Note: *Significantly different from control subjects at p<0.05. |
 | Table 2 The relative expression pattern of serum miRs |
miR-497 relative expression in MetS patients
Considering the expression pattern of miR-497, there was a great elevation of circulating miR level in the sera of groups (1), (2), and (3) [73.1(42.5), 68.3(54.8), and 27.5(39.7), respectively] with great statistical significance from control subjects as shown in Figure 2A and Table 2. Overall, there is a significant increase in expression of miR-497 in cases compared to control Figure 2B. Also, there is a highly significant positive correlation between miR-497 expression fold change and FPG in MetS patients.
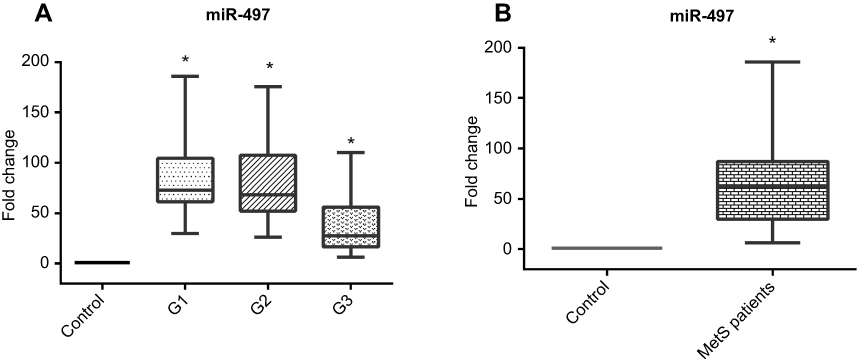 | Figure 2 (A) Serum miR-497 relative expression pattern in different MetS groups compared to control group, (B) Serum miR-497 relative expression pattern in total MetS cases compared to control groupNote: *Significantly different from control subjects at p<0.05. |
miR-509-5p relative expression in MetS patients
MiR-509-5p was highly expressed in groups (1) and (2) [501(468), 309(436)] while normally expressed in group (3) [0.936(0.077)] compared to control subjects and showed a great statistical significant difference for group (3) compared to groups (1) and (2) as shown in Figure 3A and Table 2.
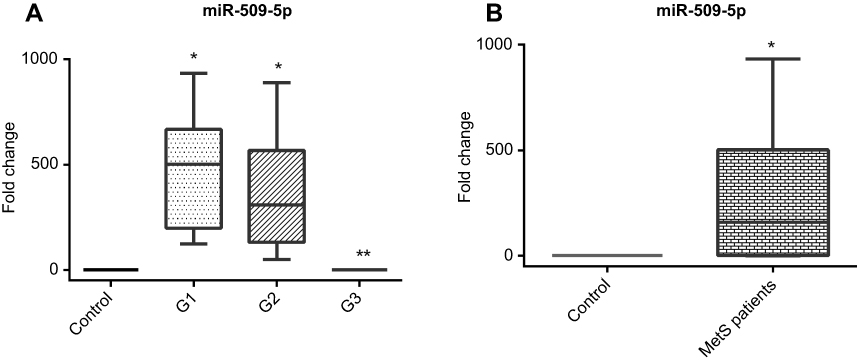 | Figure 3 (A) Serum miR-509-5p relative expression pattern in different MetS groups compared to control group, (B) Serum miR-509-5p relative expression pattern in total MetS cases compared to control group.Notes: *Significantly different from control subjects at p<0.05. **Significantly different from group 1 and 2 at p<0.05. |
Overall, there is a significant increase in expression of miR-509-5p in cases compared to control Figure 3B. Also, there is a highly significant positive correlation between miR-509-5p expression fold change and serum TAG level in groups (1) and (2) while there is no correlation with TAG level in group (3).
miR-605 relative expression in MetS patient
Table 2 and Figure 4A show the relative expression fold change of miR-605 in the different study groups and the control group. The results clearly showed statistical significance in the expression of miR-605 in groups (1) and (3) [25.4 (20.0) and 54.8(65.8)] compared to control while there is no significant expression change between the control and group (2) [0.84 (0.67)] as shown in Figure 4A and Table 2. In general, there is a significant increase in expression of miR-605 in cases compared to control Figure 4B. There is also a significant positive correlation between miR-605 expression and BP in groups (1) and (3). However, there is no statistical correlation between miR-605 expression and BP level in group (2).
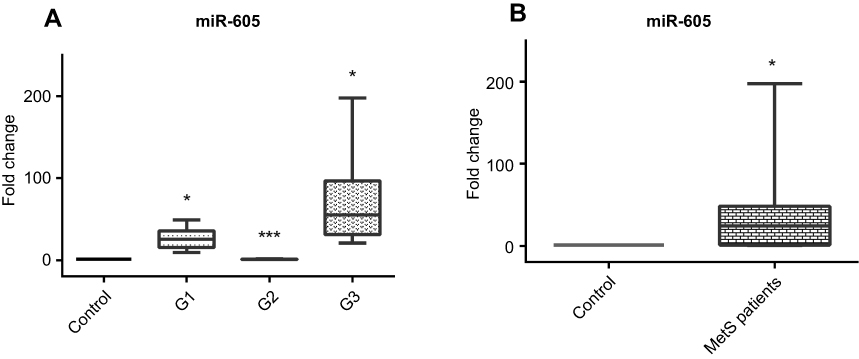 | Figure 4 (A) Serum miR-605 relative expression pattern in different MetS groups compared to control group, (B) Serum miR-605 relative expression pattern in total MetS cases compared to control group.Notes: *Significantly different from control subjects at p<0.05. ***Significantly different from group 1 and 3 at p<0.05. |
Correlations
All correlations are shown in Tables 3 and 4. There is a positive correlation between miR-486-5p, miR-497, miR509-5p and mir-605 FPG level, WC, serum TAG level, and BP, respectively.
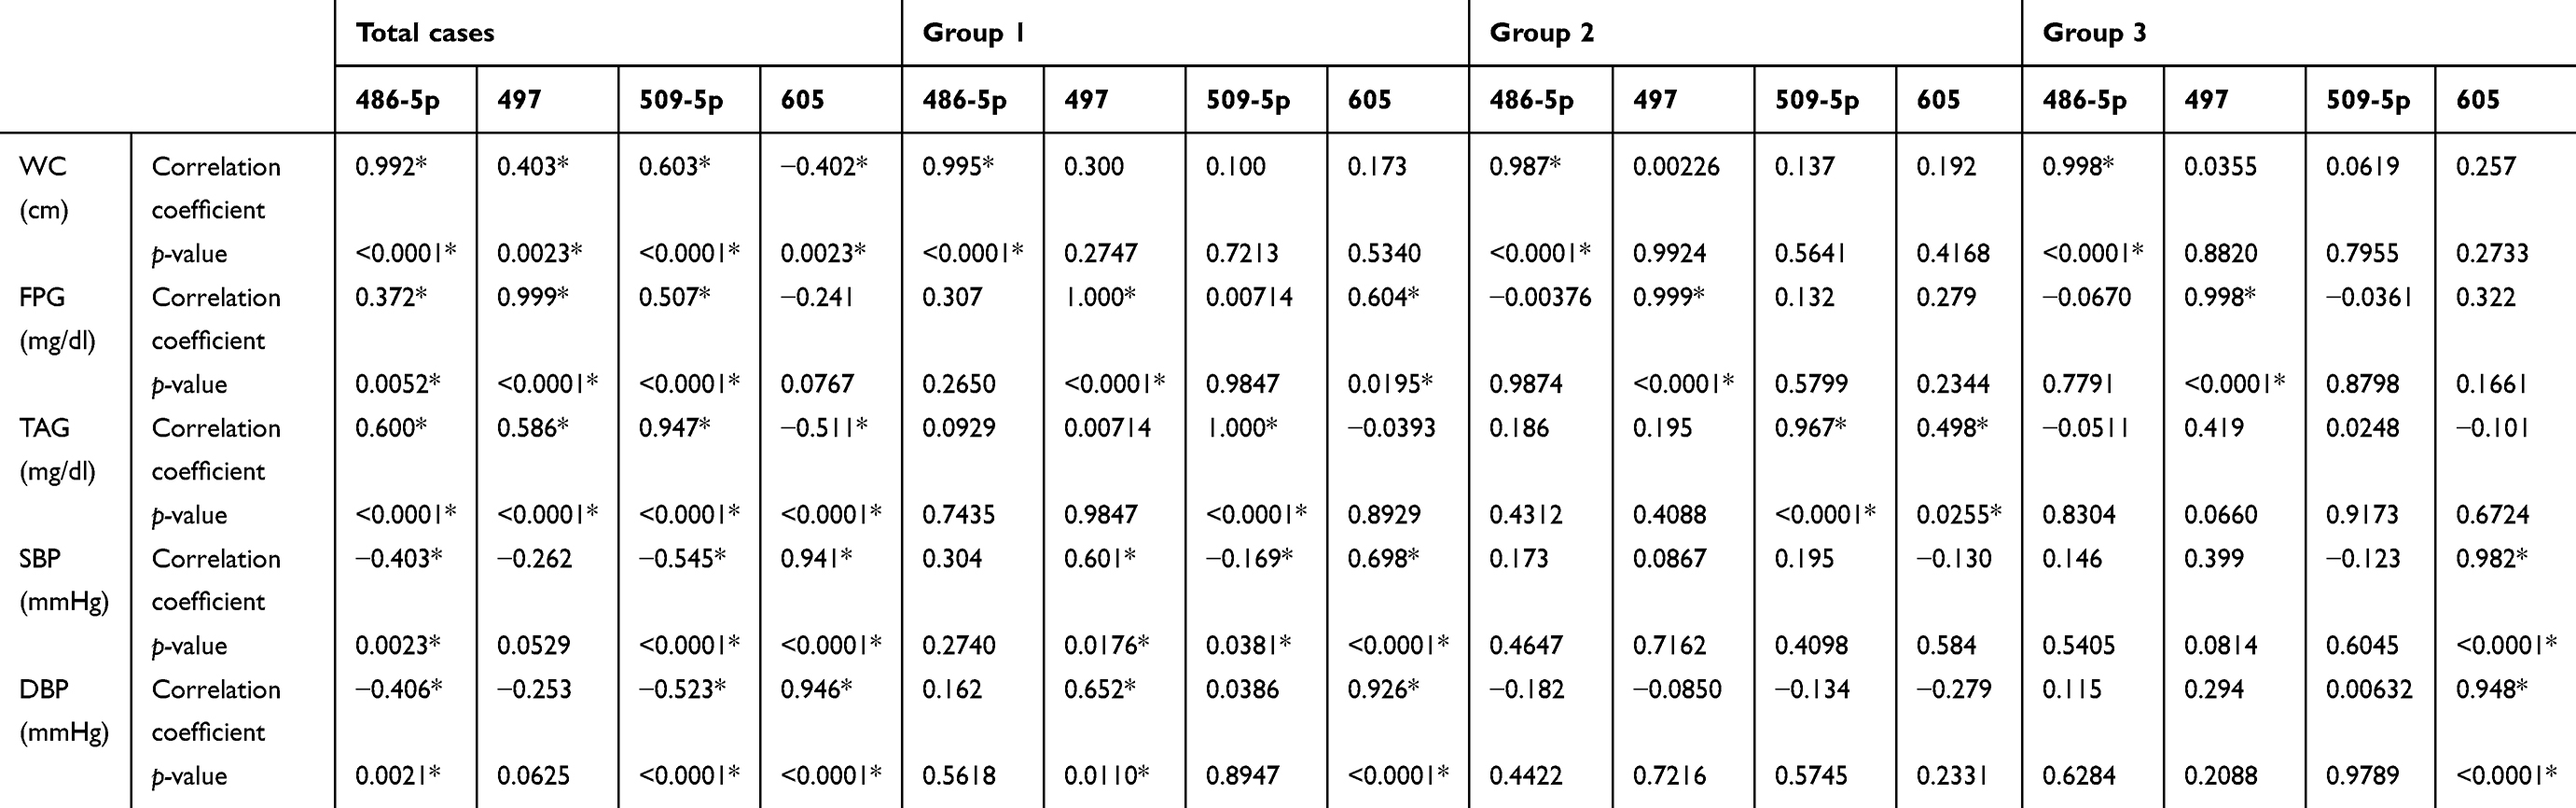 | Table 3 Correlation between miRs and MetS criteria |
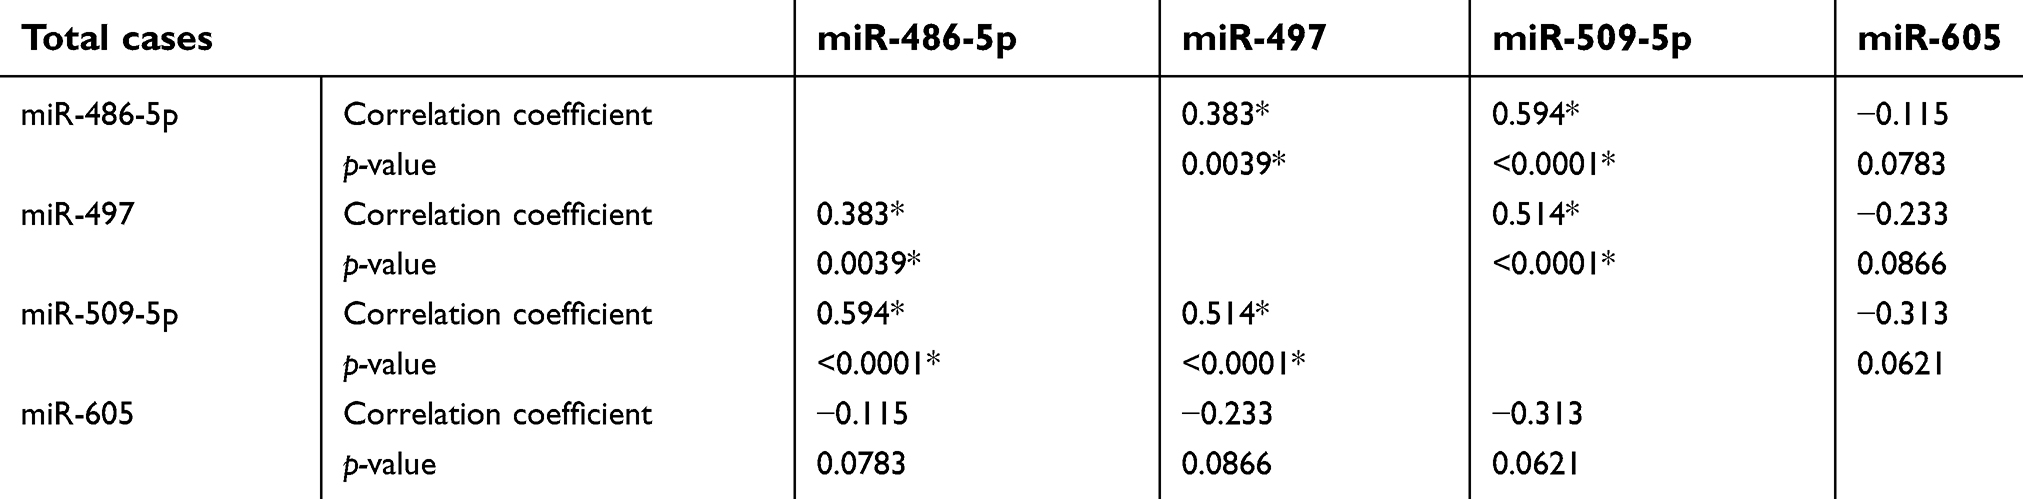 | Table 4 Correlation between miRs each other |
Discussion
MetS has become a public health issue due to its involvement in an increased risk of T2DM, CV complications, and mortality.14
Mature miRs are small noncoding single-stranded RNAs (~21 nucleotides) that suppress target gene expression. miRs have important molecular roles in normal physiology and growth as well as in disease progression, such as cancer and obesity.15 Furthermore, miRs may have roles distant from their cells of origin, possibly like hormones in an endocrine system. Investigations demonstrating dysregulation of miRs in diseases have led to interest in developing miRs-based therapeutics.16
To our knowledge, this study is the first study in Egypt and Arab countries to investigate the combined expression patterns of miRs (486-5p, 497, 509-5p, and 605) in MetS male patients. Here, we identified four circulating serum miRs, miR-486-5p, miR-497, miR-509-5p, and miR-605, whose concentrations were consistently changed in MetS patients compared to healthy controls. We speculated that these four miRs may serve as early biomarkers and can detect the prognosis of MetS in patients.
As one of the most investigated miRs in obese patients, miR-486-5p is incorporated in this study due to the absence of studies that investigate its expression in serum. To our best knowledge, this is the first study that reveals the dysregulation of miR-486-5p in MetS serum samples. We found that the expression of miR-486-5p was significantly upregulated in MetS patients than in control subjects with highly significant correlation with WC. Moreover, former studies revealed that miR-486-5p was overexpressed in plasma of patients with visceral obesity specially children.17,18 Other studies showed that miR-486-5p was overexpressed in human and animal visceral adipose tissue compared to lean subjects.19,20 Cui et al identified miR-486, miR-146b, and miR-15b as potential diagnostic markers to screen obese children at risk for developing adult diabetes in the future.21
Another finding was the lack of significant correlation between miR-486-5p expression pattern and BMI which indicates that the dependence on WC in diagnosis of MetS is better than BMI. High glucose diet, one of the leading causes of visceral obesity, induces overexpression of miR-486. The effect of high glucose media on miR-486-5p expression has been analyzed in human adipose tissue-derived mesenchymal stem cells. Real-time PCR analysis showed that high glucose induced an increase in miR-486-5p expression level.22
We hypothesized that a high carbohydrates diet may be the spark to miR-486 overexpression which leads to visceral obesity and release of inflammatory mediators which contributes to MetS complications. MiR-486-5p promotes the activation of the nuclear factor kappa-light-chain-enhancer of activated B cells (NF-κB) signaling pathway by suppressing multiple NF-κB negative regulators, free NF-κB translocates to the nucleus, binds to DNA, and triggers inflammatory mediators, such as TNFα and IL-6. Thus, increased plasma concentrations of miR-486 in obese subjects may be involved in the development of obesity-related complications, such as subclinical inflammation and IR.17,23 Additionally, the transcription factor forkhead box O1 (FoxO1), one of the main mediators of insulin action and triglyceride metabolism, is also inhibited by miR-486-5p.24
Our study revealed that miR-497 expression in diabetic patients’ serum was significantly higher than control subjects. There is a highly significant positive correlation between miR-497 expression and FPG level which proves that miR-497 upregulation contributes to IR and can be used as predictor of T2DM and indicate its progression. Furthermore, miR-497 is greatly upregulated by DNA hypomethylation which appears clearly in T2DM.25,26
Upregulated miR-497 suppresses insulin signaling by downregulating the expression of insulin receptor substrate 1, leading to decrease of inactive phosphorylated glycogen synthase kinase-3 beta and increase of inactive phosphorylated glycogen synthase that is, increase of active glycogen synthase kinase-3 beta and decrease of active glycogen synthase. As a consequence, hepatic glycogen synthesis deceased significantly.26,27
According to the prediction of scientific databases (TargetScan, miRBase Targets, PicTarget, microRNA.org), insulin-like growth factor-1 receptor (IGF-1R) was considered as a candidate target of miR-497 which was confirmed by a luciferase reporter assay.28
In our study, we found that miR-509-5p expression in sera of groups (1) and (2) is significantly elevated than control subjects and group (3) subjects. MiR-509-5p is normally expressed in group (3) with no significant difference with control subjects. Moreover, there is a significant positive correlation between groups (1) and (2) miR-509-5p expression and serum TAG level of these groups. Thus, these findings indicate the contribution of miR-509-5p among other miRs in dyslipidemia. The HDL-C level of participating subjects supports this finding.
As such, miR-509-5p is an appealing possible biomarker due to earlier detection of impending CV risk than is currently available through routine screening of lipoprotein level.
Dyslipidemia is a complex, multifactorial risk factor for CV disease that arises in the setting of both genetic and environmental exposures. MiRs are an epigenetic mechanism of regulation of gene expression that facilitate dynamic adaptation of organisms to their environment.29 Related to patients having MetS, several circulating miRs were also identified in serum. miR-197, miR-23a, and miR-509-5p appeared as potential contributors of dyslipidemia in MetS.30
Upregulation of mir-509-5p inversely associated with β-catenin activation,31 β-catenin stimulation enhanced FFAs catabolism, whereas genetic knock out of β-catenin gene reduced oleate oxidation coupled with reduced osteoblast maturation and increased glycolytic metabolism. Diminishing of β-catenin expression in vivo led to an increase in white adipose tissue mass, dyslipidemia, and impaired insulin sensitivity.32,33 So, overexpression of mir-509-5p lead to dyslipidemia by reducing β-catenin expression.
Another finding was the positive correlation between miR-509-5p and miR-486-5p, miR-509-5p and miR-497 and miR-486-5p and miR-497, which confirm the idea that MetS has a vicious cycle; not well known from where it started (Table 4).
Earlier researchers studied the differential miRNA expression in hypertensive patients, miRNA expression profiling of the plasma and serum samples were performed using miRNA array and was found that miR-605 among another miRs were overexpressed in hypertension patients.34,35 Our study confirmed the previous results by investigating miR-605 expression using qRT-PCR in MetS patients and comparing the results against control subjects. Among our MetS contributing subjects, miR-605 expression was upregulated in groups (1) and (3) compared to control and group (2) subjects. MiR-605 was normally expressed in group (2) with no significant difference with control subjects. Additionally, there is a significant positive correlation between groups (1) and (3) miR-605 expression and systolic and diastolic BP.
A recent Egyptian study done on hypertensive patients confirmed our results as they found that miR-605 was overexpressed in hypertensive patients.36 There is no clear mechanism on how the upregulation of miR-605 contributes to hypertension but there is some suggestion that obesity increases p53 protein activity.36 Activation of p53 upregulated miR-605 via interacting with the promoter region of the gene,37 so it may contribute to hypertension.
In a nutshell, there is a positive correlation between serum level of selected miRs and MetS criteria so the prognosis of MetS can be followed by detection of these miRs level.
Disclosure
The authors report no conflicts of interest in this work.
References
1. Fernandez-Mendoza J, He F, LaGrotte C, Vgontzas AN, Liao D, Bixler EO. Impact of the metabolic syndrome on mortality is modified by objective short sleep duration. J Am Heart Assoc. 2017;6(5). doi:10.1161/JAHA.117.005479
2. Harris M. The metabolic syndrome. Aust Fam Physician. 2013;42:524–527.
3. Moore JX, Chaudhary N, Akinyemiju T. Metabolic syndrome prevalence by race/ethnicity and sex in the United States, national health and nutrition examination survey, 1988-2012. Prev Chronic Dis. 2017;14:E24. doi:10.5888/pcd14.160287
4. El Brini O, Akhouayri O, Gamal A, Mesfioui A, Benazzouz B. Prevalence of metabolic syndrome and its components based on a harmonious definition among adults in Morocco. Diabetes Metab SyndrObes. 2014;7:341.
5. Aboul Ella NA, Shehab DI, Ismail MA, Maksoud AA. Prevalence of metabolic syndrome and insulin resistance among Egyptian adolescents 10 to 18 years of age. J Clin Lipidol. 2010;4(3):185–195. doi:10.1016/j.jacl.2010.03.007
6. Abd Elaziz KM, Gabal MS, Aldafrawy OA, Abou Seif HA, Allam MF. Prevalence of metabolic syndrome and cardiovascular risk factors among voluntary screened middle-aged and elderly Egyptians. J Public Health (Bangkok). 2015;37(4):612–617. doi:10.1093/pubmed/fdu097
7. Bahijri SM, Al Raddadi RM. The importance of local criteria in the diagnosis of metabolic syndrome in Saudi Arabia. Ther Adv Endocrinol Metab. 2013;4(2):51–59. doi:10.1177/2042018813483165
8. O‘Neill S, O‘Driscoll L. Metabolic syndrome: a closer look at the growing epidemic and its associated pathologies. Obes Rev. 2015;16(1):1–12. doi:10.1111/obr.12229
9. Goguet-Rubio P, Klug RL, Sharma DL, et al. Existence of a strong correlation of biomarkers and miRNA in females with metabolic syndrome and obesity in a population of West Virginia. Int J Med Sci. 2017;14(6):543–553. doi:10.7150/ijms.18988
10. Trajkovski M, Hausser J, Soutschek J, et al. MicroRNAs 103 and 107 regulate insulin sensitivity. Nature. 2011;474(7353):649–653. doi:10.1038/nature10112
11. Karolina S, Tavintharan S, Armugam A, et al. Circulating miRNA Profiles in Patients with Metabolic Syndrome. The Journal of Clinical Endocrinology & Metabolism. 2012;97(12):E2271–E2276.
12. Grundy SM, Cleeman JI, Daniels SR, et al. Diagnosis and management of the metabolic syndrome: an American Heart Association/National Heart, Lung, and Blood Institute scientific statement. Circulation. 2005;112(17):2735–2752. doi:10.1161/CIRCULATIONAHA.105.169404
13. Jin H, Benyshek DC. The ¡°metabolic syndrome index¡±: a novel, comprehensive method for evaluating the efficacy of diabetes prevention programs. J Diabetes Mellitus. 2013;03(02):4. doi:10.4236/jdm.2013.32014
14. Wang Y, Tsai P, Liao Y, Hsu C. Circulating microRNAs have a sex-specific association with metabolic syndrome. Biomed Sci. 2013;1:20–72.
15. Deiuliis JA. MicroRNAs as regulators of metabolic disease: pathophysiologic significance and emerging role as biomarkers and therapeutics. Int J Obes. 2015;40:88. doi:10.1038/ijo.2015.170
16. Karolina DS, Tavintharan S, Armugam A, et al. Circulating miRNA profiles in patients with metabolic syndrome. J Clin Endocrinol Metab. 2012;97(12). E2271–E2276. doi:10.1210/jc.2012-1996
17. Prats-Puig A, Ortega FJ, Mercader JM, et al. Changes in circulating MicroRNAs are associated with childhood obesity. J Clin Endocrinol Metab. 2013;98(10). E1655–E1660. doi:10.1210/jc.2013-1496
18. Kochar Kaur K. An update on Microrna?s and metabolic regulation with future therapeutic potentials regarding diagnosis and treatment of obesity, metabolic syndrome and other related disorders. J Health Med Inform. 2015;06(02). doi:10.4172/2157-7420.1000184
19. Duggineni D. Obesity Modulates microRNA Expression in the Visceral Adipose of Humans and Mice. The Ohio State University; USA, 2013.
20. Deiuliis JA, Syed R, Duggineni D, et al. Visceral adipose MicroRNA 223 is upregulated in human and murine obesity and modulates the inflammatory phenotype of macrophages. PLoS One. 2016;11(11):e0165962. doi:10.1371/journal.pone.0165962
21. Cui X, You L, Zhu L, et al. Change in circulating microRNA profile of obese children indicates future risk of adult diabetes. Metabolism. 2018;78:95–105. doi:10.1016/j.metabol.2017.09.006
22. KimYJ, HwangSH, LeeSY, et al. miR-486-5p induces replicative senescence of human adipose tissue-derived mesenchymal stem cells and its expression is controlled by high glucose. Stem Cells Dev. 2011;21(10):1749–1760. doi:10.1089/scd.2011.0429
23. Patel PS, Buras ED, Balasubramanyam A. The role of the immune system in obesity and insulin resistance. J Obes. 2013;2013. doi:10.1155/2013/616193
24. Yang Y, Ji C, Guo S, et al. The miR-486-5p plays a causative role in prostate cancer through negative regulation of multiple tumor suppressor pathways. Oncotarget. 2017;8(42):72835–72846. doi:10.18632/oncotarget.20427
25. de Mello V, Ferreira VD, Pulkkinen L, Lalli M, Kolehmainen M, Pihlajamäki J, Uusitupa M. DNA Methylation in Obesity and Type 2 Diabetes. Annals of Medicine. 2014; 46(3):103–113.
26. Yang G, Xiong G, Cao Z, et al. miR-497 expression, function and clinical application in cancer. Oncotarget. 2016;7(34):55900.
27. de Mello VDF, Pulkkinen L, Lalli M, Kolehmainen M, Pihlajamäki J, Uusitupa M. DNA methylation in obesity and type 2 diabetes. Ann Med. 2014;46(3):103–113. doi:10.3109/07853890.2013.857259
28. Xu J-W, Wang T-X, You L, et al. Insulin-like growth factor 1 receptor (IGF-1R) as a target of MiR-497 and plasma IGF-1R levels associated with TNM stage of pancreatic cancer. PLoS One. 2014;9(3):e92847. doi:10.1371/journal.pone.0092847
29. Flowers E, Aouizerat BE. MicroRNA associated with dyslipidemia and coronary disease in humans. Physiol Genomics. 2013;45(24):1199–1205. doi:10.1152/physiolgenomics.00106.2013
30. Butz H, Kinga N, Racz K, Patocs A. Circulating miRNAs as biomarkers for endocrine disorders. J Endocrinol Invest. 2016;39(1):1–10. doi:10.1007/s40618-015-0316-5
31. Hassan N, Zhao JT, Sidhu SB. The role of microRNAs in the pathophysiology of adrenal tumors. Mol Cell Endocrinol. 2017;456:36–43. doi:10.1016/j.mce.2016.12.011
32. Frey JL, Kim SP, Li Z, Wolfgang MJ, Riddle RC. beta-catenin directs long-chain fatty acid catabolism in the osteoblasts of male mice. Endocrinology. 2018;159(1):272–284. doi:10.1210/en.2017-00850
33. Rajan S, Puri S, Kumar D, et al. Novel indole and triazole based hybrid molecules exhibit potent anti-adipogenic and antidyslipidemic activity by activating Wnt3a/beta-catenin pathway. Eur J Med Chem. 2018;143:1345–1360. doi:10.1016/j.ejmech.2017.10.034
34. Li S, Zhu J, Zhang W, et al. Signature microRNA expression profile of essential hypertension and its novel link to human cytomegalovirus infection. Circulation. 2011. doi:10.1161/CIRCULATIONAHA.110.012237
35. Ali SS, Kala C, Abid M, Ahmad N, Sharma US, Khan NA. Pathological microRNAs in acute cardiovascular diseases and microRNA therapeutics. J Acute Dis. 2016;5(1):9–15. doi:10.1016/j.joad.2015.08.001
36. Badawy HK, Abo-Elmatty DM, Mesbah NM. Association between serum microRNA-605 and microRNA-623 expression and essential hypertension in Egyptian patients. Meta Gene. 2018;16:62–65. doi:10.1016/j.mgene.2018.01.011
37. Xiao J, Lin H, Luo X, Luo X, Wang Z. miR‐605 joins p53 network to form a p53: miR 605: mdm2 positive feedback loop in response to stress. Embo J. 2011;30(3):524–532. doi:10.1038/emboj.2010.347
 © 2019 The Author(s). This work is published and licensed by Dove Medical Press Limited. The full terms of this license are available at https://www.dovepress.com/terms.php and incorporate the Creative Commons Attribution - Non Commercial (unported, v3.0) License.
By accessing the work you hereby accept the Terms. Non-commercial uses of the work are permitted without any further permission from Dove Medical Press Limited, provided the work is properly attributed. For permission for commercial use of this work, please see paragraphs 4.2 and 5 of our Terms.
© 2019 The Author(s). This work is published and licensed by Dove Medical Press Limited. The full terms of this license are available at https://www.dovepress.com/terms.php and incorporate the Creative Commons Attribution - Non Commercial (unported, v3.0) License.
By accessing the work you hereby accept the Terms. Non-commercial uses of the work are permitted without any further permission from Dove Medical Press Limited, provided the work is properly attributed. For permission for commercial use of this work, please see paragraphs 4.2 and 5 of our Terms.