")
Back to Journals » Diabetes, Metabolic Syndrome and Obesity » Volume 13
Potential Role and Excretion Level of Urinary Transferrin, KIM-1, RBP, MCP-1 and NGAL Markers in Diabetic Nephropathy
Authors Siddiqui K , Joy SS , George TP, Mujammami M, Alfadda AA
Received 15 September 2020
Accepted for publication 13 November 2020
Published 31 December 2020 Volume 2020:13 Pages 5103—5111
DOI https://doi.org/10.2147/DMSO.S282166
Checked for plagiarism Yes
Review by Single anonymous peer review
Peer reviewer comments 2
Editor who approved publication: Professor Ming-Hui Zou
Khalid Siddiqui,1 Salini Scaria Joy,1 Teena Puthiyaparampil George,1 Muhammad Mujammami,1– 3 Assim A Alfadda1,3,4
1Strategic Center for Diabetes Research, College of Medicine, King Saud University, Riyadh, Saudi Arabia; 2University Diabetes Center, King Saud University Medical City, King Saud University, Riyadh, Saudi Arabia; 3Department of Medicine, College of Medicine, and King Saud University Medical City, King Saud University, Riyadh, Saudi Arabia; 4Obesity Research Center, College of Medicine, King Saud University, Riyadh, Saudi Arabia
Correspondence: Khalid Siddiqui
Strategic Center for Diabetes Research, College of Medicine, King Saud University, P.O. Box 245, Riyadh 11411, Kingdom of Saudi Arabia
Tel +966 114724179 ext.1340
Email [email protected]
Background: Analyzing urinary biomarkers may provide better insight into pathophysiological mechanisms of diabetic kidney diseases. The study aimed to analyze the pattern of selected excreted urinary biomarkers and its correlation with albuminuria and estimated glomerular filtration rate (eGFR) in patients with type 2 diabetes.
Methods: A total of 185 patients with type 2 diabetes were categorized according to KDIGO guideline based on albuminuria and eGFR. The urinary markers (transferrin, KIM-1, RBP, MCP-1 and NGAL) were measured by ELISA.
Results: The urinary markers were associated with eGFR (total protein/Cr, p=0.001; RBP/Cr, p=0.007; MCP-1/Cr, p=0.023; NGAL/Cr, p=0.011) and albuminuria (total protein/Cr, p< 0.001; transferrin, p< 0.001; RBP/Cr, p< 0.001; MCP-1/Cr, p< 0.001; NGAL/Cr, p=0.002).
Conclusion: The urinary marker levels (total protein, RBP, MCP-1, and NGAL) are elevated with severity of kidney damage and expressed more in progressive renal impairment.
Keywords: diabetic kidney disease, urinary markers, albuminuria, transferrin, kidney injury molecule-1, retinol-binding protein, monocyte chemoattractant protein-1, neutrophil gelatinase-associated lipocalin
Introduction
Diabetic kidney disease (DKD) is one of the microvascular complications of diabetes with high morbidity and mortality. Approximately, 40% of the diabetic patients develop DKD and it is considered a leading cause of end-stage kidney disease (ESKD).1 According to the Saudi Center for Organ Transplantation (SCOT), in Saudi population, 40% of ESKD were caused by diabetic nephropathy (DN).2
In clinical practice, the albumin-to-creatinine ratio (ACR) is a well-standardized urinary biomarker for the diagnosis of kidney disease in patients with diabetes mellitus. However, estimated glomerular filtration rate (eGFR) is also a standard measure for kidney function and to determine the various stages of renal disease. The combination of both will provide a better understanding on both renal structural and functional changes developed in patients with diabetes. Recently, National Kidney Foundation (NKF) recommended the Kidney Disease: Improving Global Outcomes (KDIGO) guidelines for the classification of chronic kidney disease (CKD) encompassing cause and severity, as expressed by both albuminuria and eGFR.3 However, albuminuria and eGFR are not sensitive enough to determine the renal damage in patients with diabetes. Therefore, exploring novel urinary biomarkers may help to identify renal damage in type 2 diabetes at an early stage.
The glomerular dysfunction might be a major cause for the development and progression of DKD. Moreover, tubulointerstitial damage might have an important role in the pathogenesis of DKD. It has been suggested that the excess albuminuria is not only an indicator of glomerular permeability but also relevant to tubular damage or dysfunction. Therefore, more specific urinary markers are required to identify the tubular or glomerular damage in the diagnosis of kidney diseases.
Urinary total protein is a sensitive biomarker for the prediction of proteinuria in kidney disease, and its diagnostic utility in DKD has been proven.4–6 Recently, several glomerular and tubular damage markers, including transferrin, kidney injury molecule-1 (KIM-1), retinol-binding protein (RBP), monocyte chemoattractant protein-1 (MCP-1) and neutrophil gelatinase-associated lipocalin (NGAL) have been studied in patients with diabetes.7–12 Although these urinary markers are altered in kidney disease, significance of these markers in the cause and severity of DKD have not been compared yet. Furthermore, the variation in the levels of these urinary markers, including both glomerular and tubular markers, in the severity of kidney disease in patients with diabetes has not been evaluated. Therefore, the study aimed to assess the levels of urinary markers (total protein, transferrin, KIM-1, RBP, MCP-1 and NGAL) in DKD and to analyze the association of eGFR and albuminuria with urinary markers.
Materials and Methods
Study Population
The study population was selected from a cohort study conducted at University Diabetes Center, King Abdulaziz University Hospital, King Saud University, Saudi Arabia.13 The study was approved by the Institutional Review Board (IRB) at College of Medicine, King Saud University (IRB# E-19-3969), and was carried out in accordance with ethical principles for medical research involving human patients.14
The exclusion criteria were as follows: 1) patients with a history of smoking; 2) patients with cancer; 3) other causes of renal impairment which includes glomerulonephritis, vasculitis, interstitial nephropathy, malignant hypertension, pelvicalyceal infection, bilateral cortical necrosis, amyloidosis; 4) patients those who take the medications that might affect kidney functions; and 5) dialysis patients. Additionally, pregnant women and the study participants those did not provide either blood samples or urine samples were also excluded.13
Patients with type 2 diabetes, >10 years of duration, aged between 35 and 70 years were included in this study. In total, 185 eligible patients, those having data for the urinary biomarkers (total protein, transferrin, RBP, NGAL, KIM-1, and MCP-1), and clinical parameters were included.
The selected patients were categorized according to three different classifications for the diagnosis of kidney diseases in patients with diabetes. In the first classification, kidney disease was identified according to the Kidney Disease: Improving Global Outcomes (KDIGO) guidelines. The 185 diabetic patients were then subdivided into four groups according to the severity of risk, namely, low, moderately increased, high, and very high risk. In this grouping, G1 represents ≥90, G2 represents 60–89, G3a represents 45–59, G3b represents 30–44, G4 represents 15–29 and G5 represents <15 (mL/min/1.73 m2) of eGFR. Similarly, in ACR category, A1 represents <30 mg/g, A2 represents 30–300 mg/g and A3 represents >300 mg/g of ACR. For risk classification, low-risk group comprises G1A1 and G2A1 categories; G1A2, G2A2 and G3aA1 comes under moderately increased risk group; high-risk group comprises G1A3, G2A3, G3aA2, and G3bA1; and very high-risk group included G3aA3, G3bA2, G3bA3, G4A3, and G5A3 categories.3,15 In the second classification, kidney disease was identified according to the American Diabetes Association (ADA). Based on albuminuria, participants were divided into three groups, namely, normoalbuminuria (ACR <30 mg/g), microalbuminuria (ACR 30–299 mg/g), and macroalbuminuria (ACR ≥300 mg/g).16 In the third classification, kidney disease was identified according to the National Institute of Diabetes and Digestive and Kidney diseases (NIDDK).17 The patients were subdivided into two groups based on eGFR, namely, eGFR ≥60 (mL/min/1.73 m2) and <60 (mL/min/1.73 m2).
Patients with T2DM in this cohort were managed with oral anti-diabetic medications including metformin, sulfonylurea, and sitagliptin, either with or without insulin; anti-hypertensive medications, including beta-blockers, angiotensin II receptor antagonists, calcium channel blockers, thiazide diuretics and angiotensin-converting enzyme inhibitors. The hyperlipidemia was managed with statins. Retinopathy was diagnosed in (52.43%) of patients, hypertension in (72.43%), and hyperlipidemia in (71.9%).
Sample Preparation and Analysis
The blood samples were collected after at least 8 hours of overnight fasting, centrifuged at 2000g for 10 min and stored at −80°C. The clinical biochemistry analyzer (RX Daytona, Randox Laboratories Limited Company, United Kingdom) was used to analyze serum levels of fasting blood glucose (FBG), hemoglobin A1c (HbA1c), lipid parameters including (total cholesterol (TC), low-density lipoprotein (LDL), high-density lipoprotein (HDL) and triglyceride) and creatinine.
The albumin, total protein, creatinine, and biomarkers (Total protein, transferrin, RBP, NGAL, KIM-1, and MCP-1) were analyzed by using random urine samples. The RX Daytona clinical chemistry analyzer was used to analyze urinary albumin, total protein and creatinine. Albuminuria was estimated by calculating the albumin-to-creatinine ratio (ACR) in mg/g. The eGFR levels were calculated by the CKD-EPI creatinine equation.18 Urinary biomarker levels (transferrin, RBP, NGAL) were measured with solid-phase enzyme-linked immunosorbent assay (ELISA) (Abcam, Cambridge, MA, USA). For, urinary KIM-1 and MCP-1 standard ELISA kits from R & D Systems, United Kingdom, were used. The urinary markers including total protein were normalized by urine creatinine concentration levels.
Statistical Analysis
For data analysis, statistical package for Social Sciences (SPSS) version 21.0 (IBM Corp., Armonk, NY, USA) for Windows was used. Continuous variables were presented as mean (standard deviation) for normally distributed variables or median (interquartile range) for non-normally distributed variables. Categorical variables are expressed as percentages. The differences between groups were compared by either the Student’s t-test or analysis of variance (ANOVA). Spearman correlation coefficients were calculated to test the correlations between urinary markers and both ACR and eGFR as dependent variables. In multiple linear regression analysis, both ACR and eGFR were considered as dependent variables and excretion of urinary markers as independent variables. The different combination of confounding factors of kidney disease, including sex, age, duration of diabetes, FBG, hypertension, hyperlipidemia and ACR/eGFR, were used to build several models to adjust. A p<0.05 was considered statistically significant.
Results
Table 1 compares data for clinical and biochemical characteristics of study participants, classified according to the different diagnostic criteria for kidney diseases. Patients’ age and duration of diabetes were similar in all groups, while total cholesterol and SBP were significantly different between groups. The classification according to the KDIGO and albuminuria showed difference between groups in the glycemic parameters: FBG and HbA1c. The urinary biomarkers, such as total protein/Cr, KIM-1/Cr, RBP/Cr, MCP-1/Cr and NGAL/Cr were increased with severity of DKD in each classification, except for KIM-1/Cr in the classification according to the progression of albuminuria. In KDIGO classification, transferrinuria was much less in the low-risk group, while a five-fold increase was found in the moderately increased group and it gradually increased with severity of disease. A similar trend was also shown in the classification according to albuminuria. However, in the KDIGO classification, the urinary KIM-1 was increased in the high-risk group when compared to the moderately increased risk group, although it was decreased in the very high-risk group. Likewise, in albuminuria classification, KIM-1 level elevated in the patients with microalbuminuria, and the level declined with the disease progression.
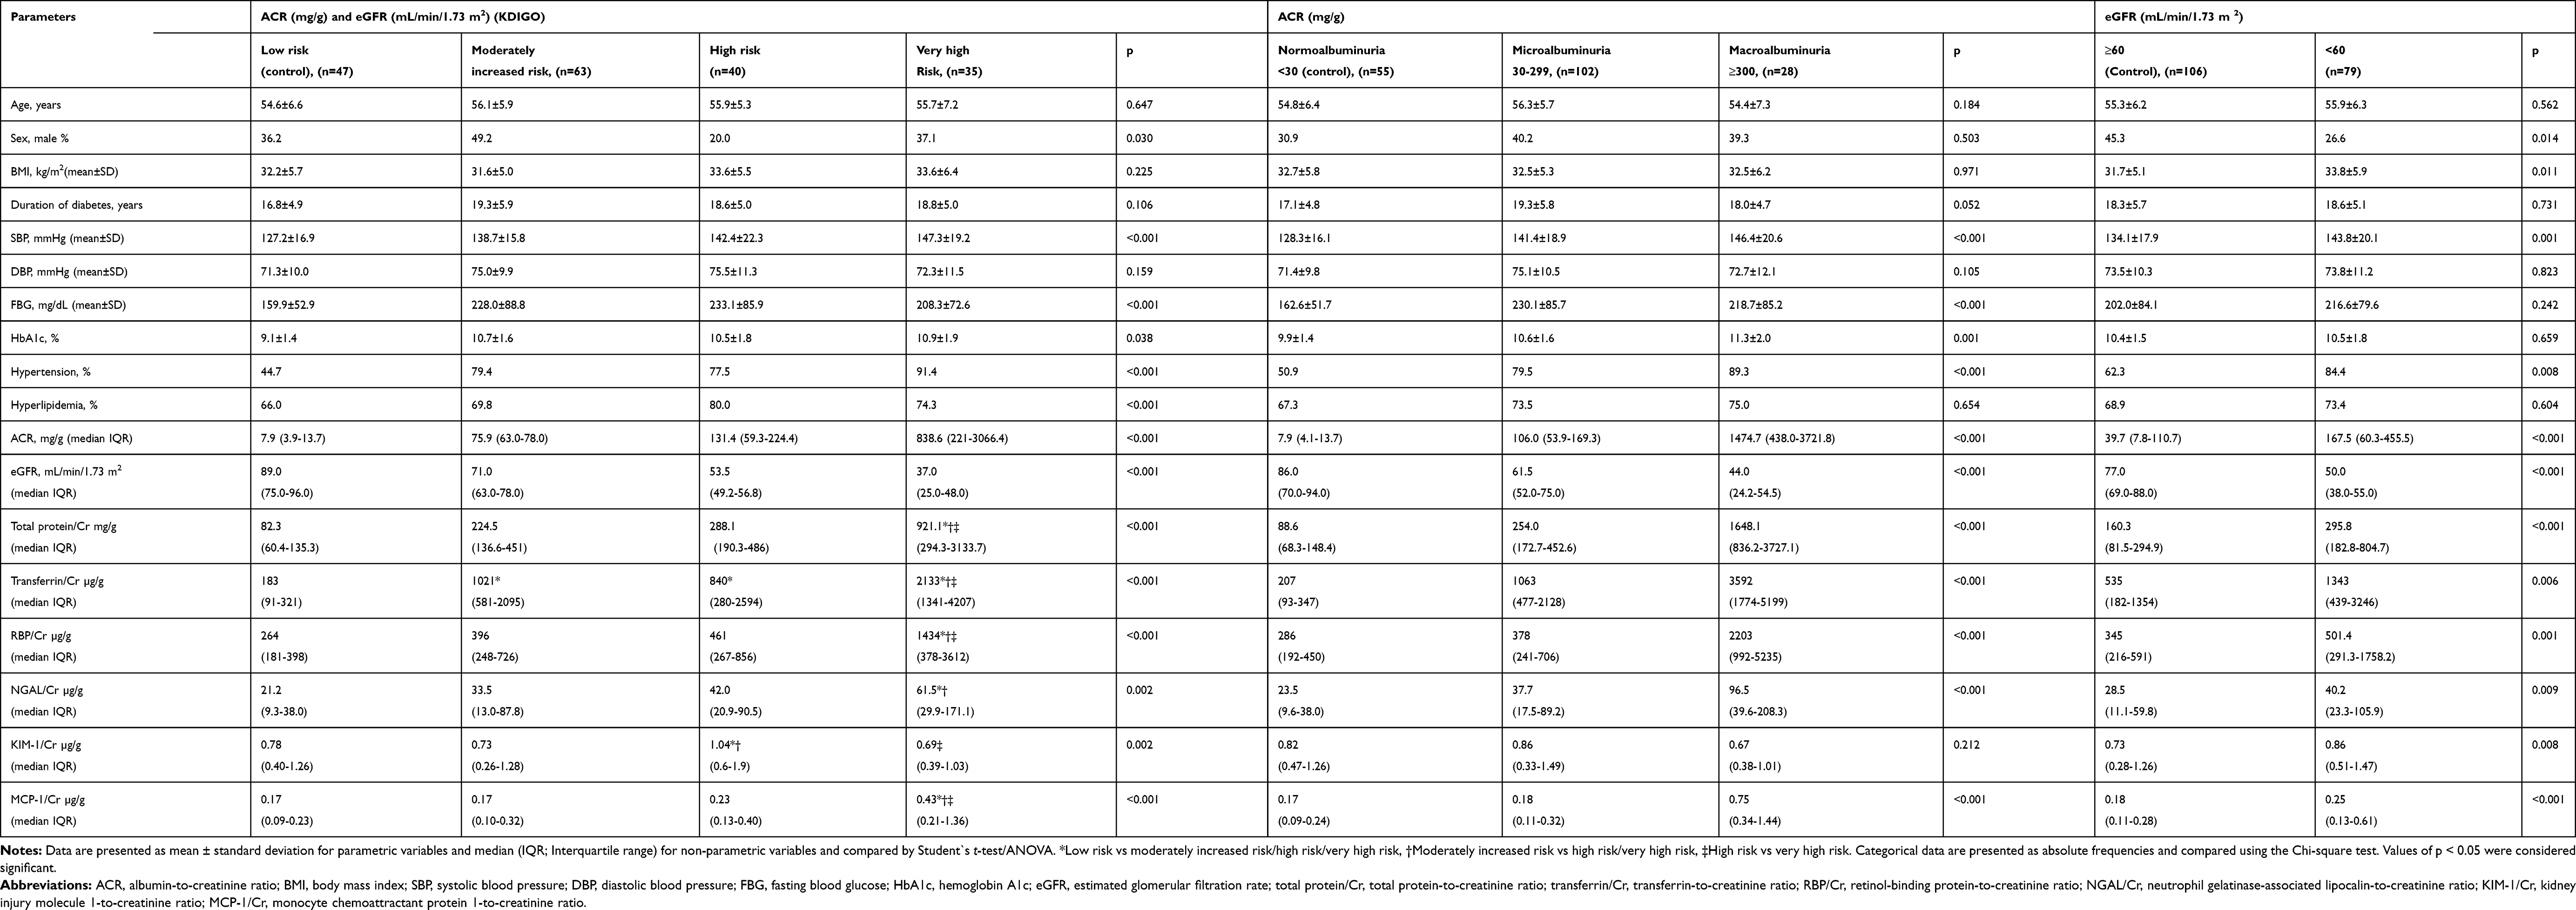 |
Table 1 The Demographic, Clinical and Biochemical Characteristics of Type 2 Diabetic Patients According to the Different Classification for the Diagnosis of Kidney Diseases |
Table 2 shows the correlation analysis of eGFR and ACR with different urinary markers. The urinary markers, total protein/Cr, KIM-1/Cr, transferrin/Cr, RBP/Cr, MCP-1/Cr and NGAL/Cr expressed a significant negative correlation with eGFR. The correlation of urinary markers with ACR was also statistically significant, except for KIM-1/Cr.
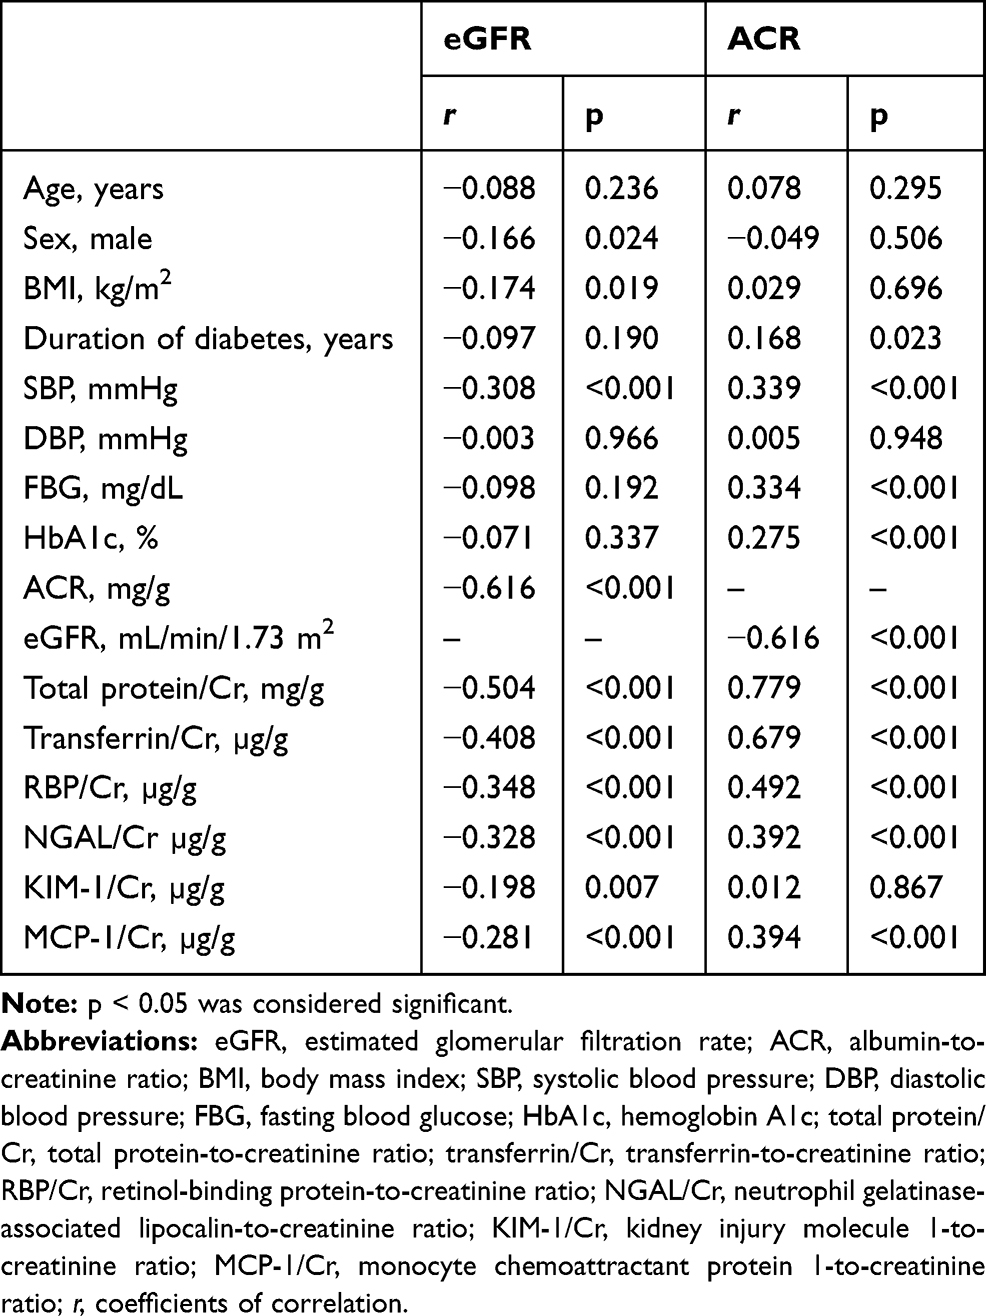 |
Table 2 Correlation of Demographic, Clinical, Biochemical and Urinary Markers with eGFR and ACR in Type 2 Diabetic Patients |
Multiple linear regression analysis of urinary markers with eGFR as dependent variable is shown in Table 3. The urinary markers, total protein/Cr (p=0.001), RBP/Cr (p=0.007), MCP-1/Cr (p=0.023) and NGAL/Cr (p=0.011) were associated with eGFR after adjusting for risk factors for diabetic nephropathy and albuminuria. The transferrin/Cr also showed an association with eGFR after adjusting for the risk factors of kidney disease, includes age, sex, duration of diabetes, but it was no longer significant after adjusting for FBG, hypertension, hyperlipidemia and albuminuria. Although the urinary marker KIM-1/Cr showed a significant association with eGFR in the crude model, it was not significant after adjusting for confounding factors of DKD and albuminuria.
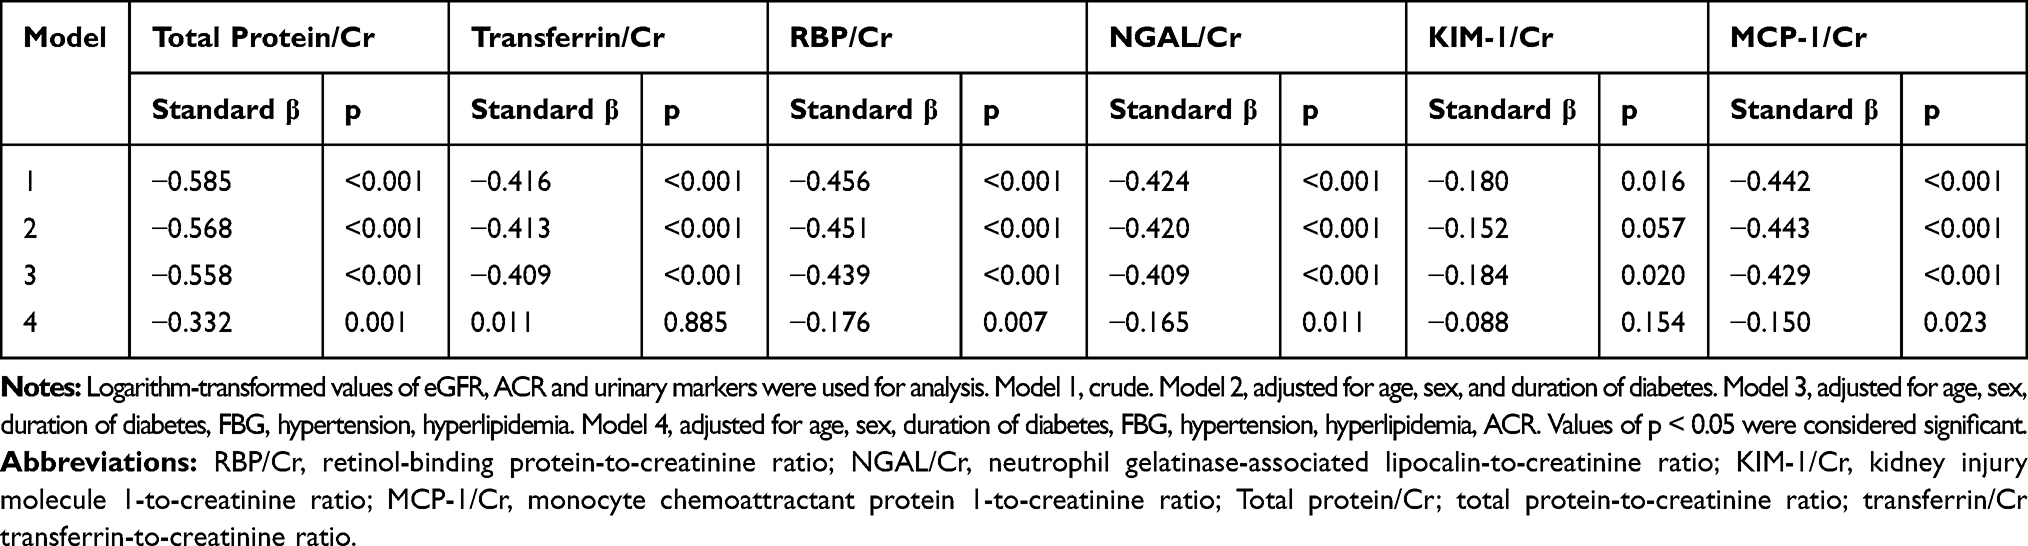 |
Table 3 Multiple Linear Regression Analysis of Urinary Markers with eGFR as Dependent Variable |
Further, these urinary markers were analyzed with ACR as dependent variable in multiple linear regression analysis (Table 4). All the urinary markers, total protein/Cr (p<0.001), transferrin/Cr (p<0.001), RBP/Cr (p<0.001), MCP-1/Cr (p<0.001) and NGAL/Cr (p=0.002), except KIM-1/Cr (p=0.572), showed an association with ACR after adjusting for confounding factors of DKD and eGFR.
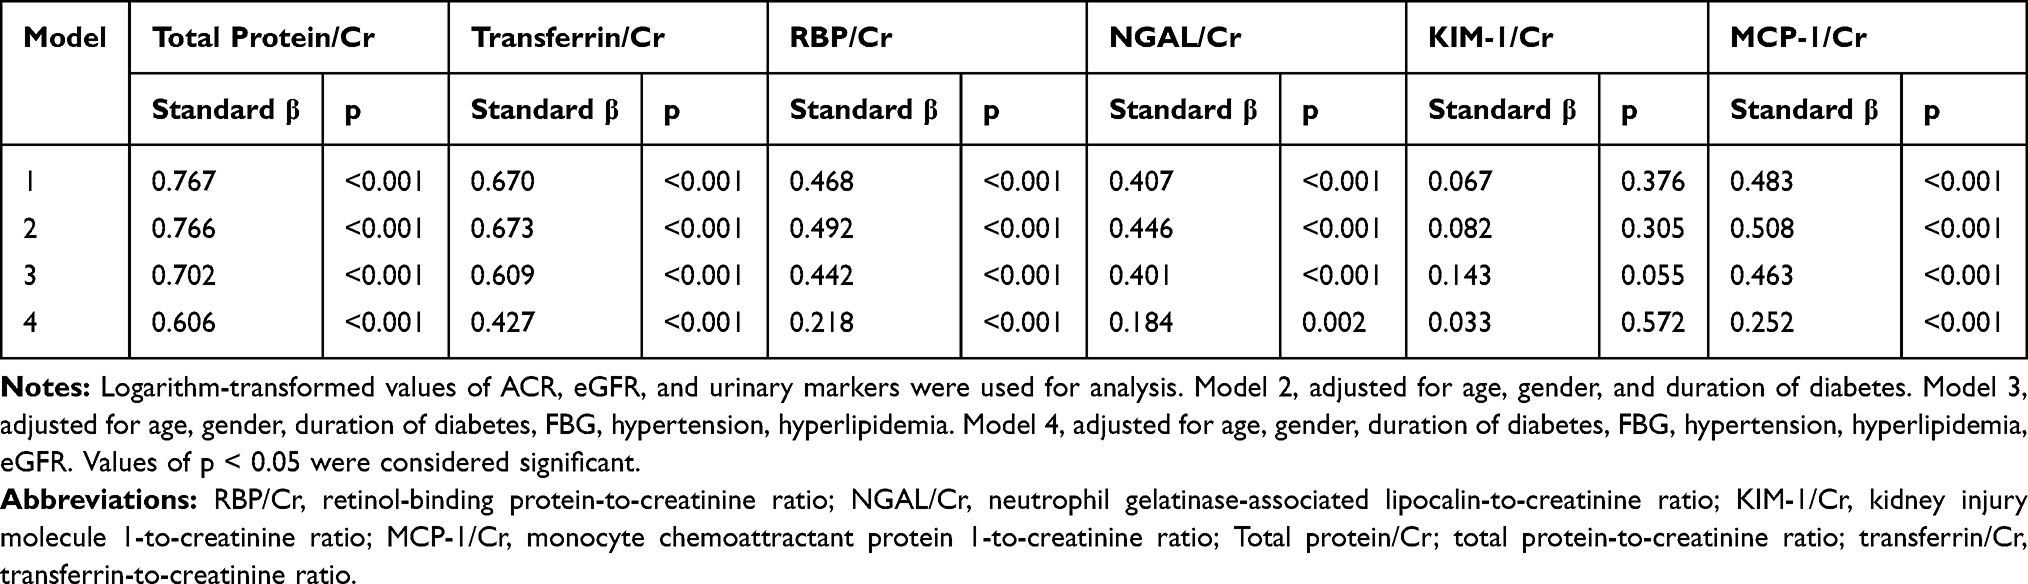 |
Table 4 Multiple Linear Regression Analysis of Urinary Markers with ACR as Dependent Variable |
Discussion
In the present study, urinary markers, total protein/Cr, RBP/Cr, MCP-1/Cr and NGAL/Cr were independently associated with eGFR and albuminuria in patients with DKD. The urinary marker transferrin showed significant association with albuminuria, while it was not associated with eGFR after adjusting for albuminuria. The urinary KIM-1 was not found to be associated with either eGFR or albuminuria.
In general, the major causes of excessive protein excretion may be due to glomerular hyperfiltration accompanied by inadequate tubular absorption or overflow and/or increased tubular secretion. In diabetes, the transit of the proteins through the glomerular filtration barrier might be increased by several factors, such as hemodynamic pressure gradient over the glomerular basement membrane, pore size of filtration barrier, and anionic charge. Some renal structural abnormalities, including increased basement membrane thickening and mesangial expansion, may restrict the capillary filtration area of glomeruli and lead to excessive protein excretion.19 Proteinuria is an indicator of kidney diseases in diabetes, which reflects glomerular dysfunction. Total protein/Cr was reported to be significantly correlated with ACR and considered as a diagnostic marker for nephropathy in patients with type 2 diabetes.20,21 RBP is a low molecular weight protein, identified as a biomarker of proximal tubular dysfunction, filtered freely through glomeruli and completely reabsorbed in the proximal tubule.22 In previous studies, urinary RBP level was reported to be increased with progression of albuminuria, showing a threshold for the increase in RBP with eGFR and proteinuria.9,23 NGAL is a protein that belongs to the lipocalin protein family, mainly released by neutrophils and epithelial cell types, such as kidney tubular cells, which rapidly increases in renal failure.24 NGAL increased with urinary albumin excretion and showed an inverse relation with eGFR in patients with type 2 diabetes.10,25 MCP-1 is a chemokine family protein, influence macrophage accumulation, and is highly expressed in the diabetic glomerular and tubular epithelium.26,27 The increased urinary levels of MCP-1 is an indicator for the progression of albuminuria and linked to renal damage, as reflected by albumin excretion and eGFR level.28,29 In this study, an extensive increase in these markers in the advanced stage (very high risk/macroalbuminuria group) indicated that these markers are more expressed in the stage of progressive glomerular/tubular structural and functional impairment. In addition, the urinary markers, total protein/Cr, RBP/Cr, MCP-1/Cr and NGAL/Cr were associated with eGFR and albuminuria even after adjusting for risk factors of DKD.
Transferrin is a glomerular marker and is found to significantly increase with progression of glomerular diffuse lesions. In general, transferrin is less anionic than albumin, with an isoelectric point one unit higher; therefore, it is expected to be excreted before the development of microalbuminuria in the initial stage of kidney diseases.7 In the advanced stages of kidney damage, transferrin is readily filtered through the glomerular barrier along with albumin and increased transferrin excretion is an indicator of decreased tubular reabsorption. In this study, according to the KDIGO classification, transferrinuria showed a five-fold increase in the moderately increased risk group, where albumin excretion increased, while the decline in the eGFR was not extended to a progressive kidney disease stage. Similarly, in the classification according to albuminuria, transferrinuria increased with albumin excretion. This suggests that transferrinuria mainly depends on changes in glomerular permeability than the glomerular function in patients having uncontrolled diabetes. In a previous study, urinary transferrin significantly increased with severity of diabetic nephropathy and showed a significant correlation with albuminuria.8 Consistently, this study also showed an increase in the level of transferrin with progression of renal damage and observed a significant association with albuminuria, while the association of transferrin with eGFR was no longer significant after adjusting for ACR.
Kidney injury molecule-1 (KIM-1) is a transmembrane protein, expressed in proximal tubular cells. In normal kidneys, urinary KIM-1 levels are found at very low levels; however, its levels are upregulated in kidney injury.30 In this study, according to the KDIGO classification, urinary KIM-1 was increased in the high-risk group, where both ACR and eGFR extended to the progressive diseased state when compared to the moderately increased risk group. However, KIM-1 level was decreased in the very high-risk group. Moreover, in albuminuria classification, KIM-1 level increased in the patients with microalbuminuria and the level declined once the disease progressed. In uncontrolled diabetic participants with longer duration of diabetes, active tubular dysfunction was more prominent in the high-risk/microalbuminuria group, where more expression of KIM-1 was noticed. Timmeren et al reported the expression of urinary KIM-1 in actively damaged renal tubules but no expression was found in atrophic and fibrotic areas.31 In addition, a subsequent reduction in the KIM-1 expression was observed with advancement of fibrosis development as well as tubular atrophy throughout the progression of albuminuria. Similarly, a gradual decrease of urinary KIM-1 with the advancement of CKD was reported in patients with type 2 diabetes.11 Furthermore, this study showed an association of KIM-1 levels with albuminuria and eGFR was not significant after adjusting for confounding factors.
The study limitation includes, (1) We have not assessed patients with shorter duration of diabetes, as most of the patients in this study had diabetes for 10 years or more, this did not allow us to report on the changes that occur at early stages of diabetes. (2) The cross-sectional design of this study did not allow for longitudinal follow up to assess the changes in this biomarker with changes in kidney disease. (3) The interference of medications on urinary markers was not ruled out.
Conclusions
The urinary levels of total protein/Cr, transferrin/Cr, RBP/Cr, MCP-1/Cr and NGAL/Cr were elevated in patients with T2DM and renal impairment, with a positive correlation with progressive glomerular/tubular structural and functional impairment. However, KIM-1 was not elevated with advanced kidney disease. Furthermore, total protein/Cr, RBP/Cr, MCP-1/Cr and NGAL/Cr were associated with eGFR and albuminuria even after adjusting for risk factors of DKD. This reveals the usefulness of these markers in assessing the severity of kidney disease in patients with diabetes.
Data Sharing Statement
The supporting documents for this study can be available from the corresponding author upon request.
Ethical Conduct
The research was conducted in accordance with the Declaration of Helsinki 2013, World Medical Association. The study protocol was approved by the Research Ethics Committee, College of Medicine, King Saud University.
Acknowledgments
This Work was funded by the National Plan for Science, Technology and Innovation (MAARIFAH), King Abdul-Aziz City for Science and Technology, Kingdom of Saudi Arabia, grant to the Strategic Center for Diabetes Research at the College of Medicine, King Saud University.
Author Contributions
All authors made substantial contributions to conception and design, acquisition of data, or analysis and interpretation of data; took part in drafting the article or revising it critically for important intellectual content; agreed to submit to the current journal; gave final approval of the version to be published; and agree to be accountable for all aspects of the work.
Disclosure
The authors report no conflicts of interest for this work and declare that the research was conducted in the absence of any commercial or financial relationships that could be construed as a potential conflict of interest.
References
1. International Diabetes Federation. IDF diabetes atlas 8th Ed. International diabetes federation. 2017. Available from: http://www.diabetesatlas.org.
2. Saudi Center for Organ Transplantation. Dialysis in the Kingdom of Saudi Arabia. SJKDT. 2017;28(4):949–957.
3. International Society of Nephrology. Chapter 1: definition and classification of CKD. Kidney Int Suppl. 2013;3(1):19–62. doi:10.1038/kisup.2012.64
4. Hashemipour S, Charkhchian M, Javadi A, et al. Urinary total protein as the predictor of albuminuria in diabetic patients. Int J Endocrinol Metab. 2012;10(3):523–526. doi:10.5812/ijem.4236
5. Yamamoto K, Yamamoto H, Yoshida K, et al. The total urine protein-to-creatinine ratio can predict the presence of microalbuminuria. PLoS One. 2014;9(3):e91067. doi:10.1371/journal.pone.0091067
6. Atkins RC, Briganti EM, Zimmet PZ, Chadban SJ. Association between albuminuria and proteinuria in the general population: the AusDiab Study. Nephrol Dial Transplant. 2003;18(10):2170–2174. doi:10.1093/ndt/gfg314
7. Cohen-Bucay A, Viswanathan G. Urinary markers of glomerular injury in diabetic nephropathy. Int J Nephrol. 2012;2012:146987. doi:10.1155/2012/146987
8. Kanauchi M, Nishioka H, Hashimoto T, Dohi K. Diagnostic significance of urinary transferrin in diabetic nephropathy. Nihon Jinzo Gakkai Shi. 1995;37(11):649–654.
9. Titan SM, Vieira JM, Dominguez WV, et al. Urinary MCP-1 and RBP: independent predictors of renal outcome in macroalbuminuric diabetic nephropathy. J Diabetes Complicat. 2012;26(6):546–553. doi:10.1016/j.jdiacomp.2012.06.006
10. Al-Refai AA, Tayel SI, Ragheb A, Dala AG, Zahran A. Urinary neutrophil gelatinase associated lipocalin as a marker of tubular damage in type 2 diabetic patients with and without albuminuria. Open J Nephrol. 2014;2014.
11. Kin Tekce B, Tekce H, Aktas G, Sit M. Evaluation of the urinary kidney injury molecule-1 levels in patients with diabetic nephropathy. Clin Invest Med. 2014;37(6):E377–E383. doi:10.25011/cim.v37i6.22242
12. Shoukry A, Bdeer SE-A, El-Sokkary RH. Urinary monocyte chemoattractant protein-1 and vitamin D-binding protein as biomarkers for early detection of diabetic nephropathy in type 2 diabetes mellitus. Mol Cell Biochem. 2015;408(1–2):25–35. doi:10.1007/s11010-015-2479-y
13. Al-Rubeaan K, Siddiqui K, Alghonaim M, Youssef AM, AlNaqeb D. The Saudi Diabetic Kidney Disease study (Saudi-DKD): clinical characteristics and biochemical parameters. Ann Saudi Med. 2018;38(1):46–56. doi:10.5144/0256-4947.2018.03.01.1010
14. World Medical Association. World Medical Association Declaration of Helsinki: ethical principles for medical research involving human subjects. JAMA. 2013;310(20):2191–2194. doi:10.1001/jama.2013.281053
15. Ketteler M, Block GA, Evenepoel P, et al. Diagnosis, evaluation, prevention, and treatment of chronic kidney disease-mineral and bone disorder: synopsis of the kidney disease: improving global outcomes 2017 clinical practice guideline update. Ann Intern Med. 2018;168(6):422–430. doi:10.7326/M17-2640
16. American Diabetes Association. Nephropathy in diabetes. Diabetes Care. 2004;27(suppl 1):s79–s83. doi:10.2337/diacare.27.2007.S79
17. National Institute of Diabetes and Digestive and Kidney Diseases. Quick reference on UACR & GFR | NIDDK. National Institute of Diabetes and Digestive And Kidney Diseases. Available from: https://www.niddk.nih.gov/health-information/professionals/clinical-tools-patient-education-outreach/quick-reference-uacr-gfr.
18. Levey AS, Stevens LA, Schmid CH, et al. A new equation to estimate glomerular filtration rate. Ann Intern Med. 2009;150(9):604–612. doi:10.7326/0003-4819-150-9-200905050-00006
19. Williams ME. Diabetic nephropathy: the proteinuria hypothesis. Am J Nephrol. 2005;25(2):77–94. doi:10.1159/000084286
20. Fatrinawati W, Sianipar O. Sensitivity of total protein creatinine ratio in urine for diagnosis diabetic nephropathy. J Med Sci. 2017;49(2):64–71. doi:10.19106/JMedSci004902201703
21. Kulasooriya PN, Bandara SN, Priyadarshani C, et al. Prediction of microalbuminuria by analysing total urine protein-to-creatinine ratio in diabetic nephropathy patients in rural Sri Lanka. Ceylon Med J. 2018;63(2):72–77. doi:10.4038/cmj.v63i2.8687
22. Fiseha T, Tamir Z. Urinary markers of tubular injury in early diabetic nephropathy. Int J Nephrol. 2016;2016:4647685. doi:10.1155/2016/4647685
23. Hong CY, Chia KS, Ling SL. Urinary protein excretion in type 2 diabetes with complications. J Diabetes Complicat. 2000;14(5):259–265. doi:10.1016/S1056-8727(00)00119-7
24. Mori K, Nakao K. Neutrophil gelatinase-associated lipocalin as the real-time indicator of active kidney damage. Kidney Int. 2007;71(10):967–970. doi:10.1038/sj.ki.5002165
25. Assal HS, Tawfeek S, Rasheed EA, El-Lebedy D, Thabet EH. Serum cystatin C and tubular urinary enzymes as biomarkers of renal dysfunction in type 2 diabetes mellitus. Clin Med Insights Endocrinol Diabetes. 2013;6:7–13. doi:10.4137/CMED.S12633
26. Segerer S, Nelson PJ, Schlöndorff D. Chemokines, chemokine receptors, and renal disease: from basic science to pathophysiologic and therapeutic studies. J Am Soc Nephrol. 2000;11(1):152–176.
27. Wada T, Furuichi K, Sakai N, et al. Up-regulation of monocyte chemoattractant protein-1 in tubulointerstitial lesions of human diabetic nephropathy. Kidney Int. 2000;58(4):1492–1499. doi:10.1046/j.1523-1755.2000.00311.x
28. Mahfouz MH, Ellakwa DE, Bassyoni AA. Assessment of monocyte chemoattractant protein-1 (MCP-1) in type 2 diabetic patients with nephropathy. Int J Adv Health Sci. 2015;2(5):606–623.
29. Ibrahim S, Rashed L. Correlation of urinary monocyte chemo-attractant protein-1 with other parameters of renal injury in type-II diabetes mellitus. Saudi J Kidney Dis Transpl. 2008;19(6):911–917.
30. Han WK, Bailly V, Abichandani R, Thadhani R, Bonventre JV. Kidney Injury Molecule-1 (KIM-1): a novel biomarker for human renal proximal tubule injury. Kidney Int. 2002;62(1):237–244. doi:10.1046/j.1523-1755.2002.00433.x
31. van Timmeren MM, van den Heuvel MC, Bailly V, Bakker SJL, van Goor H, Stegeman CA. Tubular kidney injury molecule-1 (KIM-1) in human renal disease. J Pathol. 2007;212(2):209–217. doi:10.1002/path.2175
 © 2020 The Author(s). This work is published and licensed by Dove Medical Press Limited. The full terms of this license are available at https://www.dovepress.com/terms.php and incorporate the Creative Commons Attribution - Non Commercial (unported, v3.0) License.
By accessing the work you hereby accept the Terms. Non-commercial uses of the work are permitted without any further permission from Dove Medical Press Limited, provided the work is properly attributed. For permission for commercial use of this work, please see paragraphs 4.2 and 5 of our Terms.
© 2020 The Author(s). This work is published and licensed by Dove Medical Press Limited. The full terms of this license are available at https://www.dovepress.com/terms.php and incorporate the Creative Commons Attribution - Non Commercial (unported, v3.0) License.
By accessing the work you hereby accept the Terms. Non-commercial uses of the work are permitted without any further permission from Dove Medical Press Limited, provided the work is properly attributed. For permission for commercial use of this work, please see paragraphs 4.2 and 5 of our Terms.