")
Back to Journals » International Journal of General Medicine » Volume 14
Potential Novel Modules and Hub Genes as Prognostic Candidates of Thyroid Cancer by Weighted Gene Co-Expression Network Analysis
Authors Shi Z, Li X, Zhang L, Luo Y, Shrestha B, Hu X
Received 11 August 2021
Accepted for publication 28 October 2021
Published 7 December 2021 Volume 2021:14 Pages 9433—9444
DOI https://doi.org/10.2147/IJGM.S329128
Checked for plagiarism Yes
Review by Single anonymous peer review
Peer reviewer comments 3
Editor who approved publication: Dr Scott Fraser
Zhiqiang Shi,1 Xinghui Li,2 Long Zhang,1 Yilang Luo,1 Bikal Shrestha,3 Xuegang Hu1
1Department of Stomatology, University of Chinese Academy of Sciences - Shenzhen Hospital, Shenzhen, Guangdong, 518107, People’s Republic of China; 2Department of Dermatology, University of Chinese Academy of Sciences - Shenzhen Hospital, Shenzhen, Guangdong, 518107, People’s Republic of China; 3Department of Conservative and Endodontics, Nepal Police Hospital, Kathmandu, 44600, Nepal
Correspondence: Xuegang Hu
Department of Stomatology, University of Chinese Academy of Sciences - Shenzhen Hospital, 4253 Songbai Road, Matian Street, Guangming District, Shenzhen, Guangdong, 518107, People’s Republic of China
Tel +86 27165666-80581
Email [email protected]
Background: Although thyroid cancer (THCA) is one of the most common type of endocrine malignancy, its highly complex molecular mechanisms of carcinogenesis are not completely known.
Materials and Methods: In this study, weighted gene co-expression network analysis (WGCNA) was utilized to construct gene co-expression networks and evaluate the relations between modules and clinical traits to identify potential prognostic biomarkers for THCA patients. RNA-seq data and clinical data were downloaded from The Cancer Genome Atlas (TCGA). Other independent datasets from the Gene Expression Omnibus (GEO) database and the Human Protein Atlas database were performed to validate findings.
Results: Finally, 11 co-expression modules were constructed and four hub genes, CCDC146, SLC4A4, TDRD9 and MUM1L1, were identified and validated statistically, which were considerably interrelated to worse survival of THCA patients.
Conclusion: This research study revealed four hub genes may be considered candidate prognostic biomarkers and potential therapeutic targets for THCA patients in the future.
Keywords: thyroid cancer, THCA, weighted gene co-expression network analysis, WGCNA, hub gene, prognosis
Introduction
Thyroid cancer (THCA) is one of the most common malignant tumors in human endocrine system and head and neck.1,2 The most common pathological type of thyroid carcinoma is papillary thyroid carcinoma (PTC), accounting for about 80% of the total number of THCA.3–5 Most thyroid cancers have good prognosis, the 5-year survival rate is more than 95%.6,7 Although the incidence rate of THCA is increasing year by year, the molecular biological mechanism of thyroid carcinogenesis and development is not clear.8,9 At present, the gold standard of preoperative diagnosis of THCA is fine needle aspiration biopsy (FNAB), but 20–30% of FNAB results are uncertain or suspicious, and these patients need diagnostic surgery to identify the characteristics of tumors.10,11 The application of molecular markers is expected to help FNAB improve the ability of preoperative diagnosis of THCA.
Weighted gene co expression network analysis (WGCNA) is considered to be an effective network-based method, which can highlight the co-expressed gene modules and study the relationship between gene modules and phenotypes more effectively.12–14 WGCNA has been successfully applied to explore the functional co expression modules and central genes of different diseases, such as pancreatic cancer,15 breast cancer16 and oral squamous cell carcinoma.17
In this study, we used WGCNA and other analytical methods to explore RNA data and clinical information of patients with thyroid tumor. Finally, four hub genes (CCDC146, SLC4A4, TDRD9 and MUM1L1) related to prognosis and transcription level were identified and verified, which showed good diagnostic potential and clinical relevance, and could be used as molecular markers in clinical diagnosis, treatment and prognosis of THCA.
Materials and Methods
Data Acquisition and Data Preprocessing
The RNA‐seq expression data and related clinical traits of THCA were obtained from TCGA database (https://portal.gdc.cancer.gov/) and GEO database (http://www.ncbi.nlm.nih.gov/geo/). A total of 568 patient samples were obtained from TCGA data, including 568 samples, 510 THCA samples and 58 normal samples. Data preprocessing were used to process the raw data for perform background correction and quantile normalization, including robust multi-array average (RMA) background correction and the “affy” R package. The false discovery rate (FDR) <0.05 and log2FC≥ 2 were used as the cut-off value to screen differentially expressed genes, which laid the foundation for further construction of co-expression network.
Weighted Gene Co-Expression Network Construction
Co-expression modules are gene sets with high topological overlap similarity. The “WGCNA” package of R software was used to construct gene co-expression network of differentially expressed genes.11,12 This analysis procedure can identify highly related genes of differentially expressed genes, and genes with the same pathway or function can be clustered in similar gene modules. The cut-off value of co-expression module was set as P < 0.05. In order to further explore the dissimilarity of gene modules and visualize them, we select a cutting line for the module dendrogram and merge a few modules.
Construction of Module-Trait Relationships
In order to explore the gene modules related to clinical features of THCA, the correlation between phenotype and module eigengenes was calculated, and the significance of each gene module was evaluated.18 The gene modules significantly related to clinical features (P < 0.05) were selected for further study.
Enrichment Analysis of Key Co-Expression Modules
To further explore potential function of the key modules, Gene Ontology (GO) term analysis and Kyoto Encyclopedia of Genes and Genomes (KEGG) pathway enrichment analysis were conducted to be described and visualized (DAVID, http://david.abcc.ncifcrf.gov/).19–21 The significance level was set as p-value <0.01 and FDR <0.05.
Identification and Validation of Hub Genes
Hub genes usually have important biological functions and are highly associated with other nodes of the module. The module membership of each gene is calculated, and the module membership value of the hub gene is higher. To verify the reliability of the hub gene, GSE33630, GSE29265, GSE6004 and the Human Protein Atlas database (https://www.proteinatlas.org/)22 were used for further validation. Kaplan-Meier plotter was used for survival analysis.
Results
Co-Expression Module Construction and Identification of Key Modules
Based on the differential analysis, a total of 3712 genes from TCGA for co-expression analysis were calculated. We also excluded cases with incomplete clinical information. The Pearson’s correlation coefficient was used to cluster the sample. We draw a sample clustering tree after removing outliers (Figure 1A). Moreover, we selected the power of β = 18 as the soft‐thresholding (Figures 1B and C). Finally, 11 modules were screened out based on average hierarchical clustering and dynamic tree clipping (Figure 2). As shown in Figure 3A, the interaction between the 11 co-expression modules indicates that each gene module is independently verified in the network. Cyan module and grey module were highly correlated with sample type by Pearson’s correlation analysis (Figure 3B). Therefore, these two modules were selected as clinically important modules for further analysis. In addition, the eigengene dendrogram and heatmap plotted were drawn to explore groups of related eigengenes and the dendrogram of all modules (Figures 3C and D).
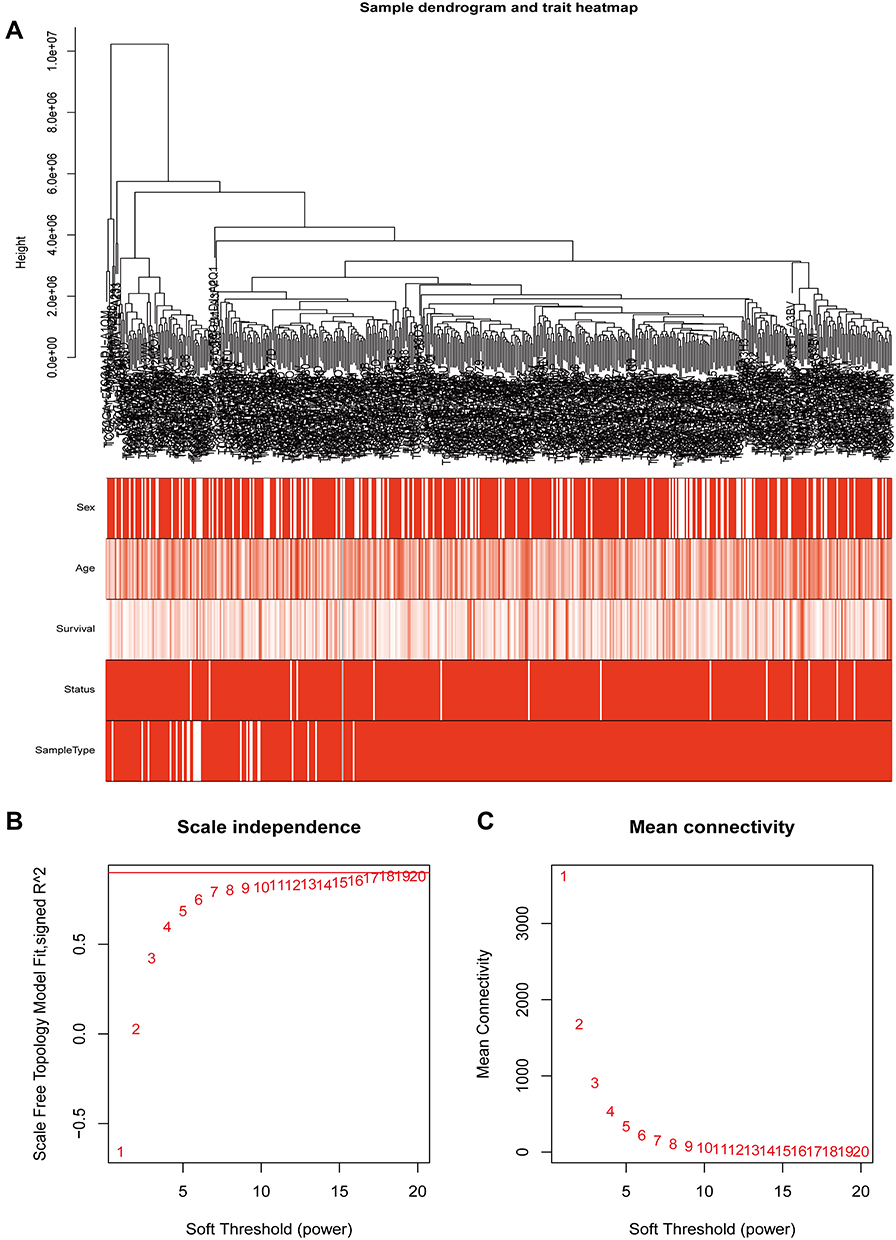 |
Figure 1 Clustering of samples and determination of soft-thresholding power. (A)The clustering was based on the expression data of TCGA, which contained 568 samples, 510 THCA and 58 normal samples. The color intensity was proportional to sample type (normal and THCA), sex, age and disease status. (B) analysis of the scale-free fit index for various soft-thresholding powers (β). (C) Analysis of the mean connectivity for various soft-thresholding powers. |
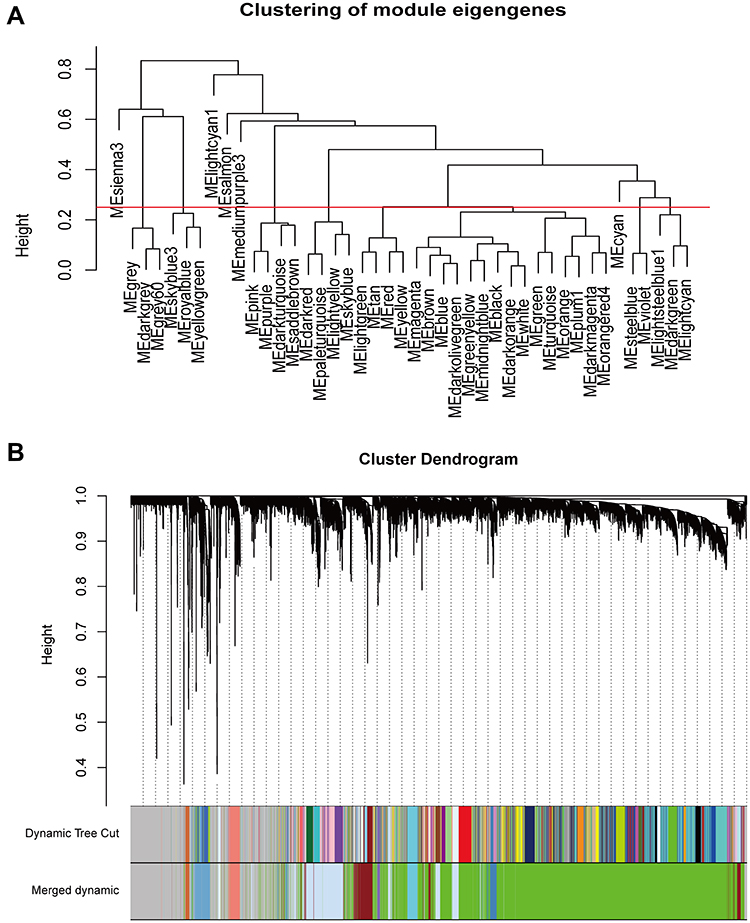 |
Figure 2 Construction of co-expression modules by WGCNA package in R. (A) The cluster dendrogram of module eigengenes. (B) The cluster dendrogram of genes in TCGA. Each branch in the figure represents one gene, and every color below represents one co-expression module. |
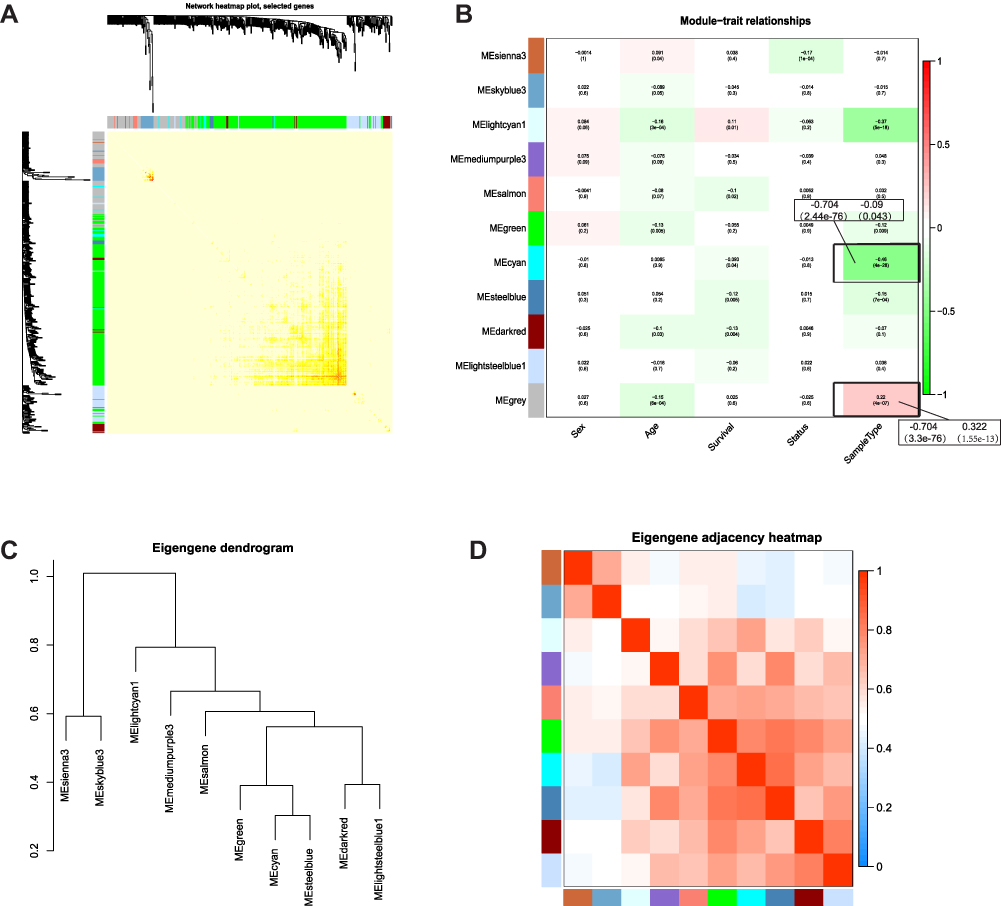 |
Figure 3 Identification of Key Modules. (A) Interaction relationship analysis of co-expression genes. Different colors of horizontal axis and vertical axis represent different modules. (B) Heatmap of the correlation between module eigengenes and the sample type of THCA. (C) Hierarchical clustering of module hub genes that summarize the modules yielded in the clustering analysis. (D) Heatmap plot of the adjacencies in the hub gene network. |
Functional Enrichment Analysis of Key Modules
Moreover, GO and KEGG analysis were conducted for the two key co-expression modules. The results show that the MEcyan module was involved in the important biological functions and signaling pathways related to tumorigenesis and development, such as protein binding, thyroid hormone synthesis, autophagy-animal, Insulin resistance, cell proliferation (Figures 4A and B). In the MEgrey module, functions are mainly enriched in transcriptional misregulation in cancer, cell adhesion molecules (CAMs), complexity and coagulation cascades, and ECM-receptor interaction and signal transduction (Figures 4C and D).
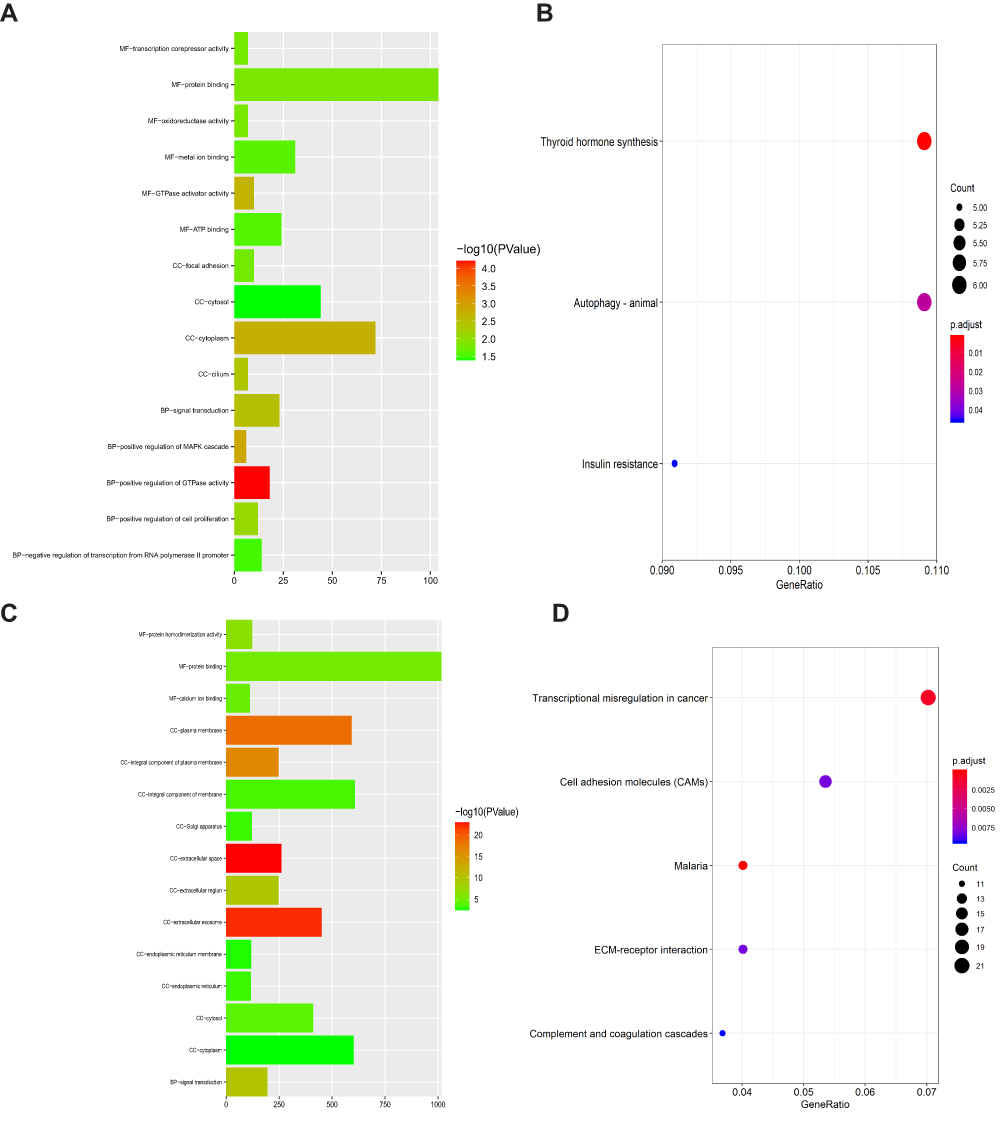 |
Figure 4 Plot of the enriched GO and KEGG terms in two key co-expression modules. (A) GO enrichment analysis of MEcyan module. (B) KEGG pathway enrichment analysis of MEcyan module. (C) GO enrichment analysis of MEgrey module. (D) KEGG pathway enrichment analysis of MEgrey module. |
Identification and Validation of Hub Genes
We screened the Mecyan module and MEgrey module as candidate prognosis genes. Through the Log rank test (p < 0.05) for further overall survival analysis, 4 hub genes (CCDC146, SLC4A4, TDRD9 and MUM1L1) were identified (Figure 5). Kaplan Meier survival curve of overall survival analysis showed that THCA patients with low expression levels of 4 hub genes had poor prognosis. Then, GSE33630, GSE29265, GSE6004 and the Human Protein Atlas database were used to validate the expression status of the 4 hub genes. As shown in Figures 6A and B, the volcano map and expression heat map of the differential RNAs in GSE33630 (45 normal samples and 60 THCA). The common genes between differential RNAs and the MEcyan and MEgrey module were identified by overlapping them in GSE33630 were presented in Figures 6C and D. The results showed that 4 hub genes in two key modules were also differential RNAs in GEO33630. Moreover, the transcriptional level of hub genes were verified in GSE29265 (Figure 7) and GSE6004 (Figure 8). In addition, the translational level of 4 hub genes also were verified by the human protein atlas database (IHC) (Figure 9).
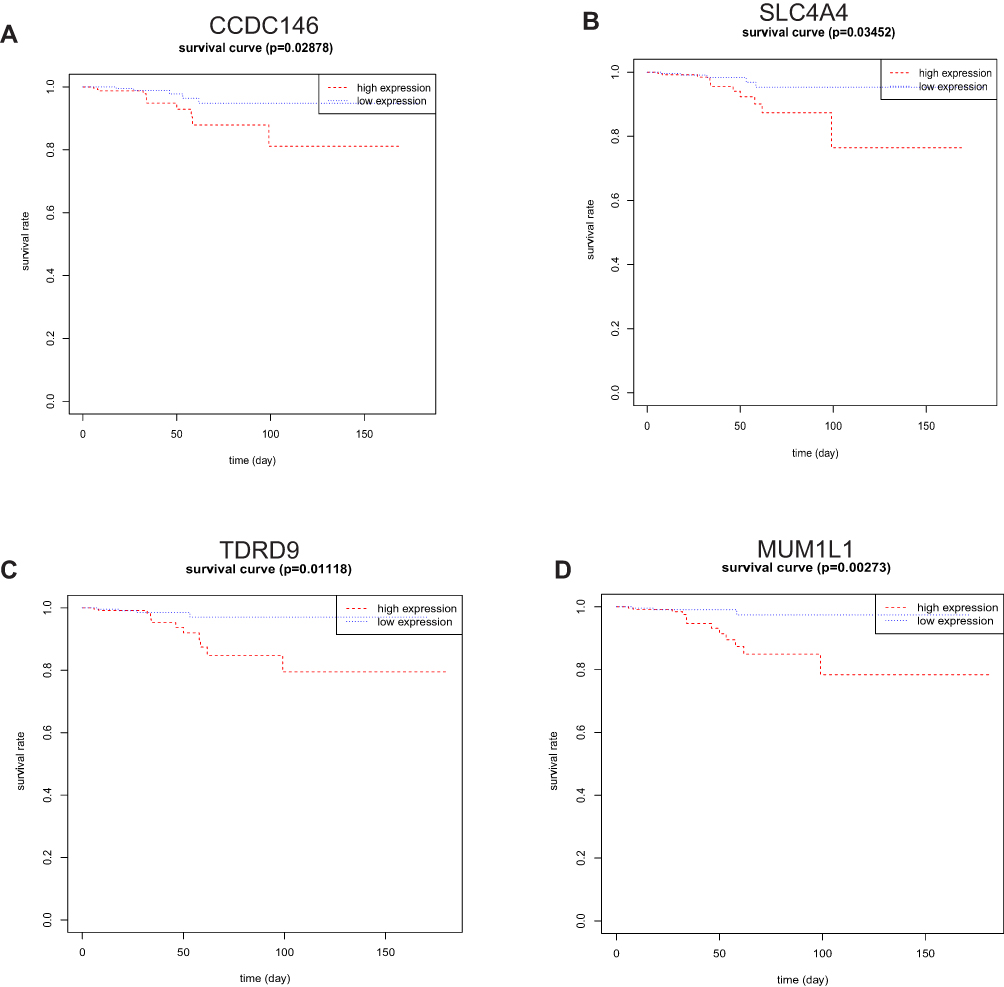 |
Figure 5 Survival analysis of 4 hub genes based on the Kaplan-Meier plotter. The patients were stratified into high- and low- expression groups according to the median expression. (A) CCDC146. (B) SLC4A4. (C) TDRD9. (D) MUM1L1. |
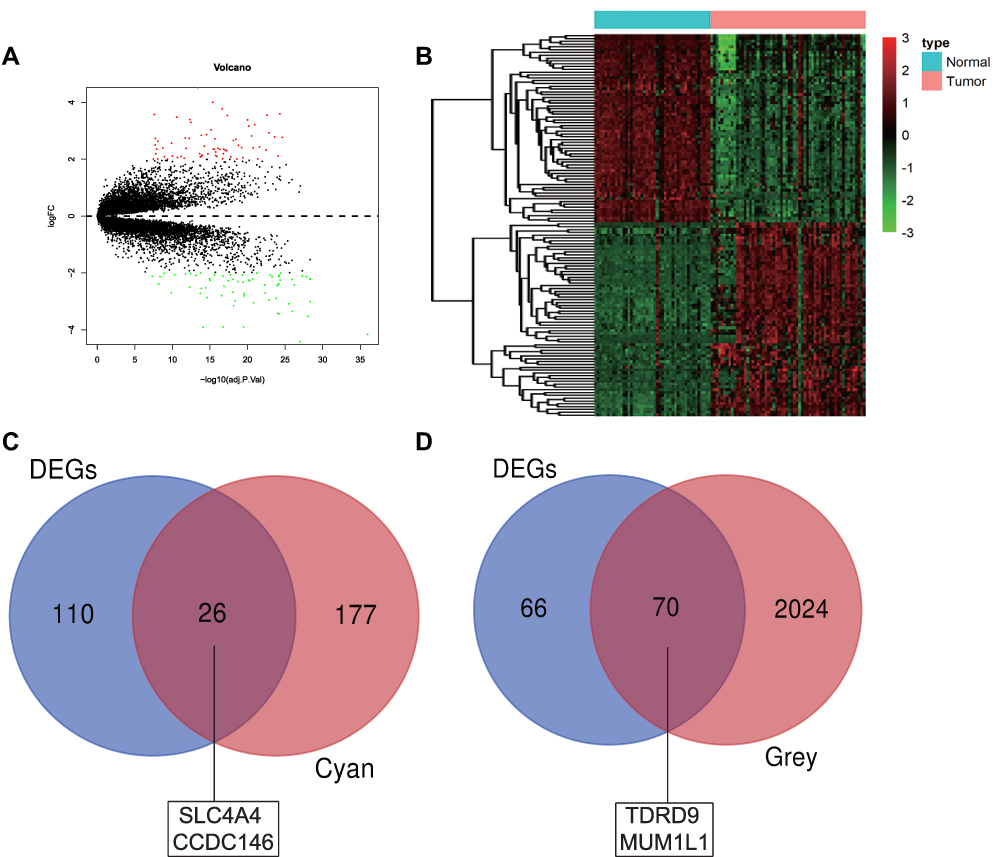 |
Figure 6 Validation of hub genes in GSE33630. (A) Volcano plot visualizing DEGs in GSE33630 (45 normal samples and 60 THCA). Fold Change=2, adj P=0.05. (B) heatmap hierarchical clustering reveals DEGs in cancer groups compared with those in control groups. (C) Identification of common genes between DEGs and the MEcyan module by overlapping them. The two hub genes in the MEcyan module were also DEGs in GSE33630 (D) Identification of common genes between DEGs and the MEgrey module by overlapping them. The two hub genes in the MEgrey module were also DEGs in GSE33630. |
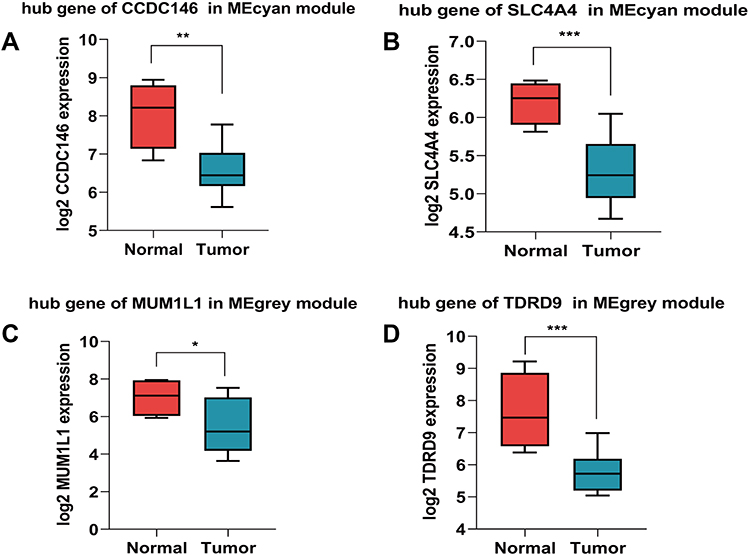 |
Figure 7 Validation of 4 hub genes in the transcriptional level. (A–D) Validation of hub genes in GSE29265.(*P < 0.05, **P < 0.01, ***P < 0.001). |
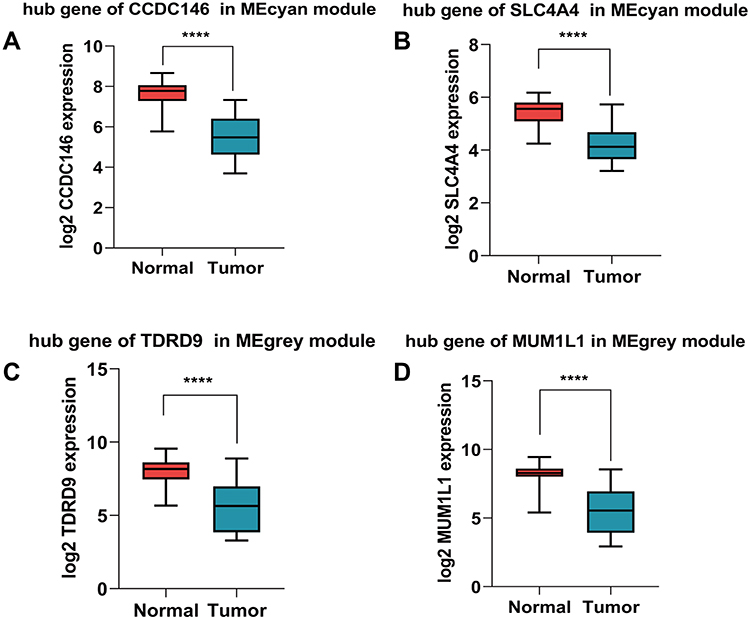 |
Figure 8 Validation of 4 hub genes in the transcriptional level. (A–D) Validation of hub genes in GSE6004 (****P < 0.0001). |
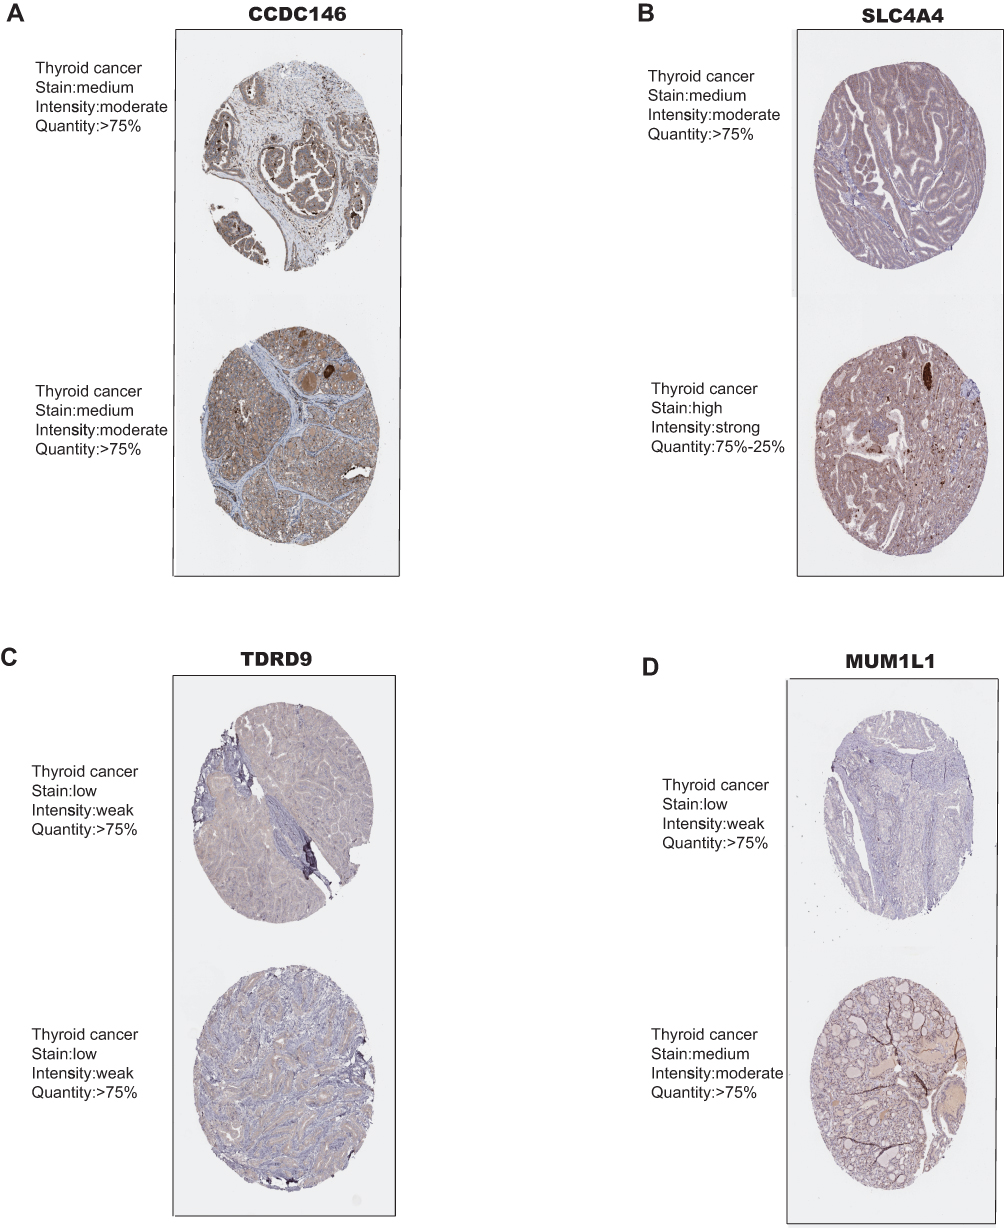 |
Figure 9 Validation of 4 hub genes in the translational level. (A–D) Validation of 4 hub genes by The Human Protein Atlas database (IHC). |
Discussion
THCA is a rare malignant tumor, accounting for less than 1% of human malignant tumors.1–3 However, it is the most common cancer in the endocrine system and the cause of death for most endocrine cancers.4,5 The occurrence and development of THCA is a multifactorial disease process, involving a variety of molecular mechanisms.2 At present, many published studies mainly focus on the molecular mechanism of single gene in THCA, but ignore the interaction between genes due to its limitations.23–26 Due to the development of big data, gene network is used to analyze the origin and development of various cancers. Therefore, in order to further explore novel and accurate molecular biomarkers for prognosis, we use RNA sequencing data and clinical information from TCGA and GEO databases to explore and verify potential key modules and hub genes through bioinformatics analysis of WGCNA.
In this study, we screened 2 key modules (MEcyan module and MEgrey module) from TCGA dataset by WGCNA analysis. 4 hub genes (CCDC146, SLC4A4, TDRD9 and MUM1L1) were then further screened and verified using the GEO database and survival analysis. Considering the functional and pathway enrichment analysis, the two key co-expression modules were significantly enriched in thyroid hormone synthesis, autophagy-animal, cell proliferation, transcriptional misregulation in cancer, cell adhesion molecules (CAMs), and ECM-receptor interaction and signal transduction. At the same time, we also found that these significantly expressed functional annotations and signaling pathways have been reported in THCA and many other cancers.27–30
At present, studies on these five hub genes have been reported, and a large number of studies have shown that their expression plays an important role in the occurrence, development and prognosis of many tumors. It has been found that SLC4A4 contributes to the occurrence and development of tumors, and its involvement in tumor biological processes is specific.31 It is reported that mir-223-3p promotes tumor cell proliferation and metastasis by reducing the expression of SLC4A4 in renal clear cells.32 Gerber et al. Confirmed that the low expression of SLC4A4 in thyroid carcinoma and its diagnostic value.31 SLC4A4 has been reported to be associated with poor prognosis in patients with colon adenocarcinoma. The low expression of SLC4A4 is associated with lymph node invasion and distant metastasis of colon adenocarcinoma. At the same time, SLC4A4 expression is associated with the invasion of immune cells in colon adenocarcinoma. It may be a biomarker and therapeutic target for the diagnosis and prognosis of colon adenocarcinoma.33 Another study have reported that downregulation of expression in TDRD9-positive cell lines causes a decrease in cell proliferation, S-phase cell cycle arrest, and apoptosis, which can be used as a marker for prognosis and as a potential therapeutic target in a subset of lung carcinomas.34 More importantly, one study by Wang et al suggested that TDRD9 was significantly related to the prognosis of THCA. CCDC146 was a potential therapeutic strategy for lymph node metastasis of breast cancer.35 MUM1L1 has not been previously reported to be associated with cancer. The results show that the occurrence and development of tumor may be regulated by multiple genes, which may provide more research strategies for the diagnosis and treatment of THCA.
There are two deficiencies in this study. First, the results were not verified in clinical samples. Considering the high reliability of high-throughput sequencing expression data and the sufficient number of samples included in the study, this deficiency can be made up to a certain extent, but it can not completely replace the significance of clinical sample verification. Second, the selected molecules have no functional validation. Although the signal pathway of differential genes was analyzed by KEGG pathway in this study, the newly discovered molecules that have not been reported should be functional verified.
Conclusion
In summary, based on the TCGA database, we analyzed the gene expression profile of THCA and successfully identified four hub genes associated with THCA prognosis, which showed good diagnostic potential and clinical relevance as molecular markers for clinical diagnosis, treatment and prognosis of THCA.
Abbreviations
THCA, thyroid cancer; WGCNA, weighted gene co-expression network analysis; TCGA, The Cancer Genome Atlas; GEI, Gene Expression Omnibus; PTC, papillary thyroid carcinoma; FNAB, fine needle aspiration biopsy; FMA, robust multi-array average; FDR, false discovery rate; GO, Gene Ontology; KEGG, Kyoto Encyclopedia of Genes and Genomes; CAMs, cell adhesion molecules.
Ethics Approval and Consent to Participate
This study was approved in accordance with the Ethical Standards of the Institutional Ethics Committee of University of Chinese Academy of Sciences - Shenzhen Hospital and with the 1964 Helsinki declaration and its later amendments or comparable Ethical Standards.
Acknowledgments
The results of this study are based on the data from TCGA (https://www.cancer.gov/tcga) and GEO database (http://www.ncbi.nlm.nih.gov/geo/). We thank all the authors who provided the data for this study.
Funding
This work was supported by the Startup Fund for scientific research, University of Chinese Academy of Sciences–Shenzhen Hospital (Grant No. HRF-2020012); and Guangming District Soft Science Research Project (Grant No. 2021R01063).
Disclosure
The authors declare that the research was conducted in the absence of any commercial or financial relationships that could be construed as a potential conflict of interest.
References
1. Kitahara CM, Sosa JA. The changing incidence of thyroid cancer. Nat Rev Endocrinol. 2016;12(11):646–653. doi:10.1038/nrendo.2016.110
2. Hu J, Yuan IJ, Mirshahidi S, Simental A, Lee SC, Yuan X. Thyroid carcinoma: phenotypic features, underlying biology and potential relevance for targeting therapy. Int J Mol Sci. 2021;22(4):1950. doi:10.3390/ijms22041950
3. Patel S, Pappoppula L, Guddati AK, et al. Analysis of race and gender disparities in incidence-based mortality in patients diagnosed with thyroid cancer from 2000 to 2016. Int J Gen Med. 2020;13:1589–1594. doi:10.2147/IJGM.S280986
4. Siegel RL, Miller KD, Fuchs HE, Jemal A. Cancer statistics, 2021. CA Cancer J Clin. 2021;71(1):7–33. doi:10.3322/caac.21654
5. Davies L, Hoang JK. Thyroid cancer in the USA: current trends and outstanding questions. Lancet Diabetes Endocrinol. 2021;9(1):11–12. doi:10.1016/S2213-8587(20)30372-7
6. Chen W, Zheng R, Zuo T, Zeng H, Zhang S, He J. National cancer incidence and mortality in China, 2012. Chin J Cancer Res. 2016;28:1–11.
7. Davies L, Welch HG. Current thyroid cancer trends in the United States. JAMA Otolaryngol Head Neck Surg. 2014;140(4):317–322. doi:10.1001/jamaoto.2014.1
8. Schlumberger MJ. Papillary and follicular thyroid carcinoma. N Engl J Med. 1998;338(5):297–306. doi:10.1056/NEJM199801293380506
9. Mazzaferri EL, Kloos RT. Clinical review 128: current approaches to primary therapy for papillary and follicular thyroid cancer. J Clin Endocrinol Metab. 2001;86(4):1447–1463. doi:10.1210/jcem.86.4.7407
10. LiVolsi VA. Papillary thyroid carcinoma: an update. Mod Pathol. 2011;24(S2):S1–S9. doi:10.1038/modpathol.2010.129
11. Nikiforov YE, Nikiforova MN. Molecular genetics and diagnosis of thyroid cancer. Nat Rev Endocrinol. 2011;7(10):569–580. doi:10.1038/nrendo.2011.142
12. Giulietti M, Occhipinti G, Principato G, Piva F. Weighted gene co-expression network analysis reveals key genes involved in pancreatic ductal adenocarcinoma development. Cell Oncol. 2016;39(4):379–388. doi:10.1007/s13402-016-0283-7
13. Langfelder P, Horvath S. WGCNA: an R package for weighted correlation network analysis. BMC Bioinform. 2008;9(1):559. doi:10.1186/1471-2105-9-559
14. Zhang B, Horvath S. A general framework for weighted gene co-expression network analysis. Stat Appl Genet Mol Biol. 2005;4:Article17. doi:10.2202/1544-6115.1128
15. Zhou Z, Cheng Y, Jiang Y, et al. Ten hub genes associated with progression and prognosis of pancreatic carcinoma identified by co-expression analysis. Int J Biol Sci. 2018;14:124–136. doi:10.7150/ijbs.22619
16. Tang J, Yang Q, Cui Q, et al. Weighted gene correlation network analysis identifies RSAD2, HERC5, and CCL8 as prognostic candidates for breast cancer. J Cell Physiol. 2020;235(1):394–407. doi:10.1002/jcp.28980
17. Hu X, Sun G, Shi Z, Ni H, Jiang S. Identification and validation of key modules and hub genes associated with the pathological stage of oral squamous cell carcinoma by weighted gene co-expression network analysis. PeerJ. 2020;8:e8505. doi:10.7717/peerj.8505
18. Shi K, Bing ZT, Cao GQ, et al. Identify the signature genes for diagnose of uveal melanoma by weight gene co-expression network analysis. Int J Ophthalmol. 2015;8:269–274.
19. Dennis G
20. Ashburner M, Ball CA, Blake JA, et al. Gene ontology: tool for the unification of biology. The gene ontology consortium. Nat Genet. 2000;25:25–29. doi:10.1038/75556
21. Kanehisa M, Goto S, Sato Y, Furumichi M, Tanabe M. KEGG for integration and interpretation of large-scale molecular data sets. Nucleic Acids Res. 2002;40:D109–D114. doi:10.1093/nar/gkr988
22. Uhlén M, Fagerberg L, Hallström BM, et al. Proteomics. Tissue-based map of the human proteome. Science. 2015;347(6220):1260419. doi:10.1126/science.1260419
23. Li H, Tian Z, Qu Y, et al. SIRT7 promotes thyroid tumorigenesis through phosphorylation and activation of Akt and p70S6K1 via DBC1/SIRT1 axis. Oncogene. 2019;38(3):345–359. doi:10.1038/s41388-018-0434-6
24. Li X, Ruan X, Zhang P, et al. TBX3 promotes proliferation of papillary thyroid carcinoma cells through facilitating PRC2-mediated p57KIP2 repression. Oncogene. 2018;37(21):2773–2792. doi:10.1038/s41388-017-0090-2
25. Li Y, Yang Q, Guan H, Shi B, Ji M, Hou P. ZNF677 suppresses Akt phosphorylation and tumorigenesis in thyroid cancer. Cancer Res. 2018;78(18):5216–5228. doi:10.1158/0008-5472.CAN-18-0003
26. Ock S, Ahn J, Lee SH, et al. Thyrocyte-specific deletion of insulin and IGF-1 receptors induces papillary thyroid carcinoma-like lesions through EGFR pathway activation. Int J Cancer. 2018;143(10):2458–2469. doi:10.1002/ijc.31779
27. Ren Z, Zhang L, Ding W, et al. Development and validation of a novel survival model for head and neck squamous cell carcinoma based on autophagy-related genes. Genomics. 2021;113(1):1166–1175. doi:10.1016/j.ygeno.2020.11.017
28. Xiao H, Zhang Y, Li Z, et al. Periostin deficiency reduces diethylnitrosamine -induced liver cancer in mice by decreasing hepatic stellate cell activation and cancer cell proliferation. J Pathol. 2021;255(2):212–223. doi:10.1002/path.5756
29. Yuan Y, Cao W, Zhou H, Qian H, Wang H. H2A.Z acetylation by lincZNF337-AS1 via KAT5 implicated in the transcriptional misregulation in cancer signaling pathway in hepatocellular carcinoma. Cell Death Dis. 2021;12(6):609. doi:10.1038/s41419-021-03895-2
30. Pogorzelska-Dyrbus J, Szepietowski JC. Adhesion molecules in non-melanoma skin cancers: a comprehensive review. In Vivo (Brooklyn). 2021;35:1327–1336. doi:10.21873/invivo.12385
31. Gerber JM, Gucwa JL, Esopi D, et al. Genome-wide comparison of the transcriptomes of highly enriched normal and chronic myeloid leukemia stem and progenitor cell populations. Oncotarget. 2013;4(5):715–728. doi:10.18632/oncotarget.990
32. Xiao W, Wang X, Wang T, Xing J. MiR-223-3p promotes cell proliferation and metastasis by downregulating SLC4A4 in clear cell renal cell carcinoma. Aging. 2019;11(2):615–633. doi:10.18632/aging.101763
33. Chen X, Chen J, Feng Y, Guan W. Prognostic value of SLC4A4 and its correlation with immune infiltration in colon adenocarcinoma. Med Sci Monit. 2020;26:e925016. doi:10.12659/MSM.925016
34. Guijo M, Ceballos-Chávez M, Gómez-Marín E, Basurto-Cayuela L, Reyes JC. Expression of TDRD9 in a subset of lung carcinomas by CpG island hypomethylation protects from DNA damage. Oncotarget. 2018;9(11):9618–9631. doi:10.18632/oncotarget.22709
35. Wang Z, Liu W, Chen C, Yang X, Luo Y, Zhang B. Low mutation and neoantigen burden and fewer effector tumor infiltrating lymphocytes correlate with breast cancer metastasization to lymph nodes. Sci Rep. 2019;9(1):253. doi:10.1038/s41598-018-36319-x
 © 2021 The Author(s). This work is published and licensed by Dove Medical Press Limited. The full terms of this license are available at https://www.dovepress.com/terms.php and incorporate the Creative Commons Attribution - Non Commercial (unported, v3.0) License.
By accessing the work you hereby accept the Terms. Non-commercial uses of the work are permitted without any further permission from Dove Medical Press Limited, provided the work is properly attributed. For permission for commercial use of this work, please see paragraphs 4.2 and 5 of our Terms.
© 2021 The Author(s). This work is published and licensed by Dove Medical Press Limited. The full terms of this license are available at https://www.dovepress.com/terms.php and incorporate the Creative Commons Attribution - Non Commercial (unported, v3.0) License.
By accessing the work you hereby accept the Terms. Non-commercial uses of the work are permitted without any further permission from Dove Medical Press Limited, provided the work is properly attributed. For permission for commercial use of this work, please see paragraphs 4.2 and 5 of our Terms.