")
Back to Journals » Diabetes, Metabolic Syndrome and Obesity » Volume 14
Possible Regulation of bFGF Expression by Mast Cells in Osteoarthritis Patients with Obesity: A Cross-Sectional Study
Authors Takata K, Uchida K , Takano S, Mukai M, Inoue G , Sekiguchi H, Aikawa J , Miyagi M, Iwase D, Takaso M
Received 10 May 2021
Accepted for publication 9 July 2021
Published 16 July 2021 Volume 2021:14 Pages 3291—3297
DOI https://doi.org/10.2147/DMSO.S319537
Checked for plagiarism Yes
Review by Single anonymous peer review
Peer reviewer comments 2
Editor who approved publication: Dr Konstantinos Tziomalos
Ken Takata, Kentaro Uchida, Shotaro Takano, Manabu Mukai, Gen Inoue, Hiroyuki Sekiguchi, Jun Aikawa, Masayuki Miyagi, Dai Iwase, Masashi Takaso
Department of Orthopedic Surgery, Kitasato University School of Medicine, Sagamihara City, Kanagawa, 252-0374, Japan
Correspondence: Kentaro Uchida
Department of Orthopedic Surgery, Kitasato University School of Medicine, 1-15-1 Minami-Ku Kitasato, Sagamihara City, Kanagawa, 252-0374, Japan
Tel/Fax +81-042-778-9217
Email [email protected]
Purpose: Obesity is associated with the risk of developing knee osteoarthritis (KOA). Furthermore, synovial basic fibroblast growth factor (bFGF) is linked to the severity of KOA. We previously demonstrated that bFGF and mast cell (MC) marker expression were elevated in the synovial tissues (ST) of KOA patients with obesity. However, it remains unclear whether MCs contribute to bFGF expression and regulation.
Patients and Methods: Radiographically diagnosed KOA patients (n=249) were assigned to groups based on the body mass index (BMI) classifications used by the World Health Organization: normal-weight (NW, BMI < 25 kg/m2, n=95), overweight (OW, BMI ≥ 25 and < 30, n=109) and obese (OB, ≥ 30 kg/m2, n=45). BFGF expression in the ST was examined using quantitative polymerase chain reaction and compared across the BMI groups. Additionally, BFGF and interleukin (IL) 13 expression were examined in freshly extracted MC-rich (THY-1-, CD3-, CD14-, and CD19-) and MC-poor (THY-1+, CD3+, CD14+, or CD19+) fractions from ST. Moreover, regulation of BFGF expression by IL-13 was studied in CD14-negative (fibroblast-rich) and CD14-positive (M&phis;-rich) and cells in culture.
Results: BFGF expression was significantly higher in OB than in NW patients. Furthermore, although IL13 was significantly higher in the MC-rich than the MC-poor fraction, BFGF expression was comparable. Recombinant human IL-13 stimulated expression of BFGF in synovial fibroblast cells.
Conclusion: BFGF expression is higher in the ST of KOA patients with obesity. Increased numbers of MCs may contribute to the elevated BFGF expression through IL-13 in KOA patients with obesity.
Keywords: obesity, mast cell, osteoarthritis, BFGF, IL13, synovial tissues
Introduction
Obesity has been shown to increase the prevalence and development of osteoarthritis (OA) in weight-bearing as well as non-weight-bearing joints.1,2 This suggests that other factors apart from mechanical loading may explain the association between obesity and OA. Such other factors may also contribute to OA pathology. However, these factors remain elusive.
Basic fibroblast growth factor (bFGF) regulates cell proliferation and contributes to the matrix metalloproteinase production and breakdown of the extracellular matrix in articular cartilage.3 Furthermore, bFGF contributes to the pathology of joint destruction,4 with bFGF levels in synovial fluid having been shown to be associated with radiographic severity of knee OA (KOA).5 In our previous report, we found that BFGF mRNA expression was increased in the synovial tissues (ST) of KOA patients with obesity.6 However, the mechanisms underlying the rise in bFGF in patients with obesity remain unclear.
Mast cells (MCs) are present in the ST, and are elevated in patients with rheumatoid arthritis (RA)7,8 and OA,9–11 where they are suggested to play a pivotal role in both acute and chronic inflammation. Recent evidence indicates a possible link between MCs and KOA severity.10 bFGF is among a range of growth factors generated by MCs under inflammatory conditions.12,13 We previously reported that BFGF expression was correlated with the MC marker expression.6 However, bFGF expression in MCs remains to be studied.
Interleukin (IL)-13 is an MC-secreted cytokine.14–16 Increased IL-13 levels are observed in the synovial fluid of patients with KOA and rheumatoid arthritis.17,18 IL-13 level in synovial fluid is correlated with OA pain and function.19 Interestingly, IL-13 has been shown to regulate bFGF in airway smooth muscle cells.20 We hypothesized that MCs express IL-13 and that IL-13 regulates bFGF in the ST of KOA patients.
We investigated BFGF and IL13 expressions in MCs, and the effect of IL-13 on BFGF expression in KOA patients.
Patients and Methods
Total knee arthroplasty (TKA) was performed on all participating subjects at our hospital. A total of 249 ST specimens were harvested from patients diagnosed with radiographic KOA during TKA. A small section of each specimen was immediately frozen in liquid nitrogen and placed at −80°C until RNA extraction. Specimens taken from 10 patients were subjected to experiments aimed at determining BFGF expression in MCs, and samples taken from 8 patients to experiments aimed at examining whether IL-13 regulates BFGF expression.
The study protocol received approval from Kitasato University Hospital institutional Ethics Review Board (approval number: KMEO B19–259). All participants provided written informed consent to participate and for removal of their synovial tissue the day prior to surgery. This study complied with the principles of the Declaration of Helsinki.
Patients were assigned to groups based on the body mass index (BMI) classifications used by the World Health Organization: normal-weight (BMI <25 kg/m2, n=95), overweight (BMI ≥25 and <30, n=109) and obese (≥30 kg/m2, n=45). The patients’ clinical characteristics are summarized in Table 1 by BMI group. MC marker (CD117, CD203c, TPSB2 (β-tryptase)) and BFGF expression in the ST were compared across the BMI groups using RT-PCR.
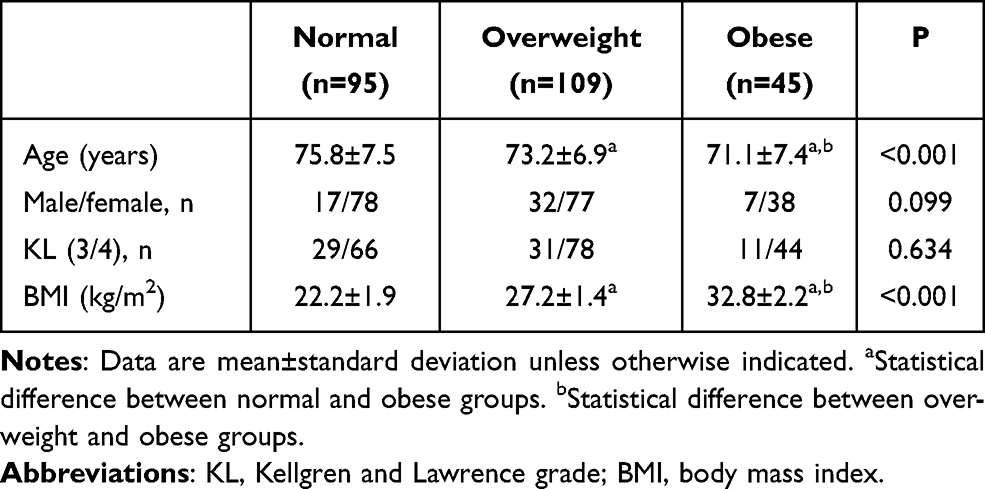 |
Table 1 Patients’ Clinical Characteristics |
qPCR
Details of RNA extraction, cDNA synthesis and qPCR using SYBR Green are published elsewhere.8,21 qPCR primer sequences are shown in Table 2. All gene expression was normalized to that of GAPDH.
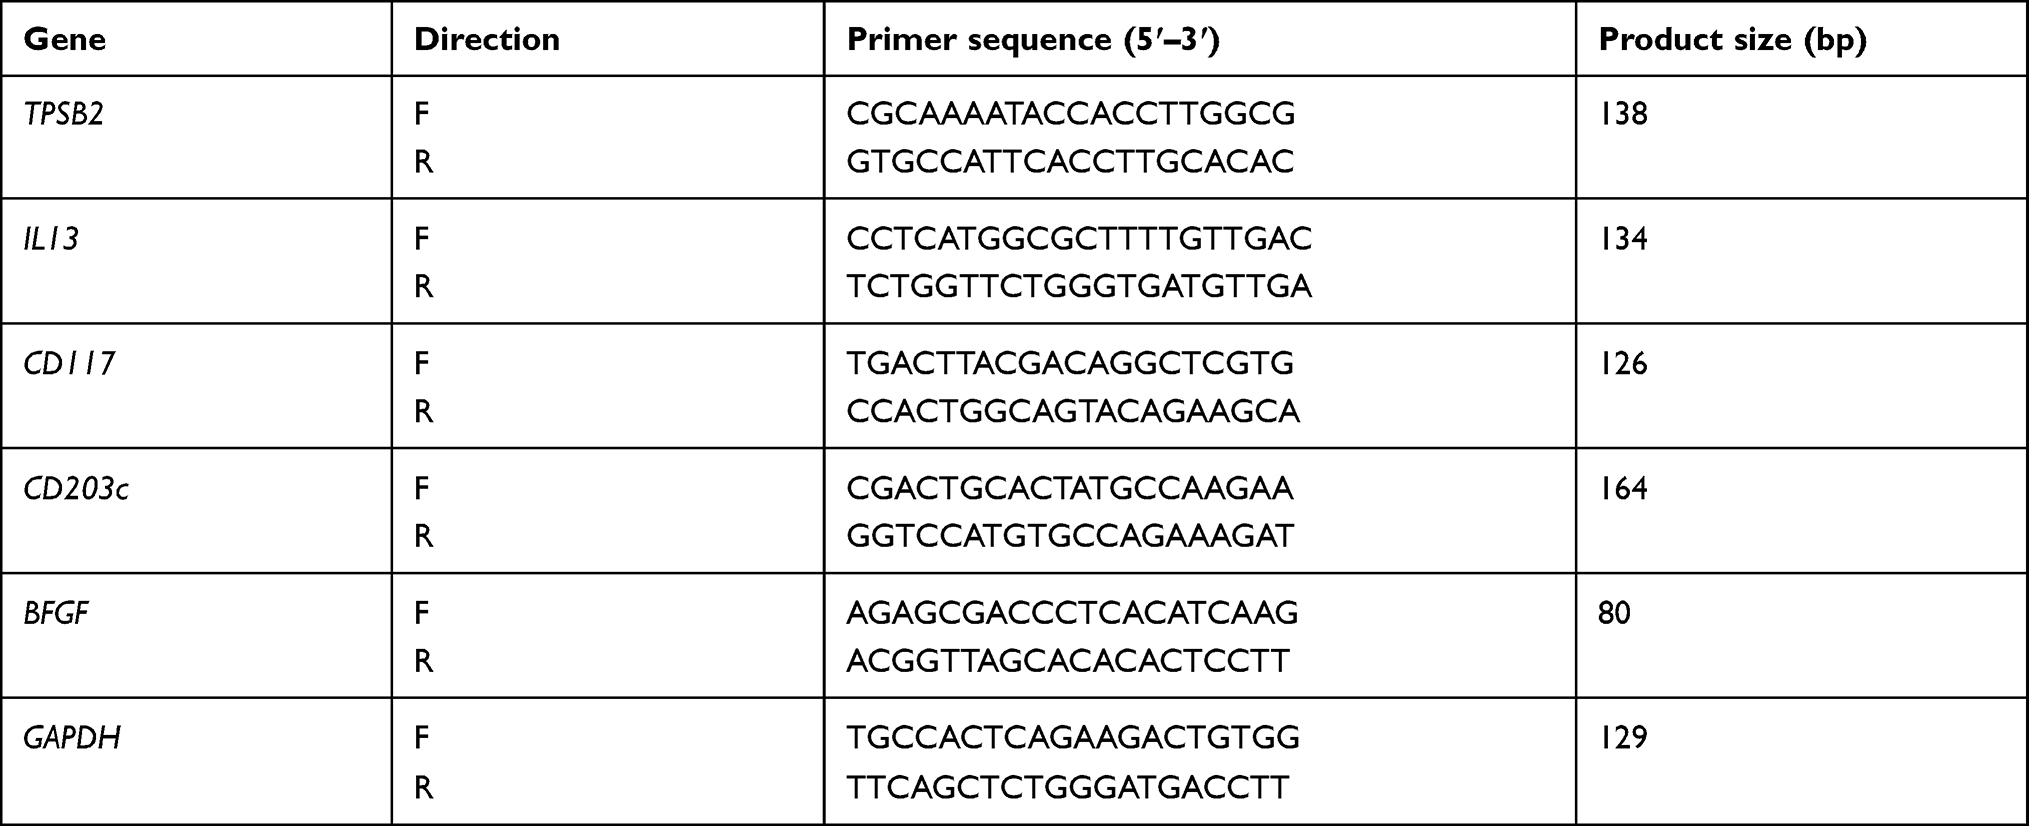 |
Table 2 Primer Sequences |
Expression of BFGF and IL13 in MCs
Cells isolated from synovial tissue were separated into MC-rich and MC-poor fractions as described previously,21 and examined for BFGF and IL13 expression. To digest ST, samples were immediately immersed in collagenase solution at 37°C for 2 h. Extracted cells reacted with the following antibodies for 30 minutes at 4°C: biotin-conjugated anti-THY-1 (fibroblast marker), anti-CD3 (T cell marker), anti-CD14 (Mφ marker), and anti-CD19 (B cell marker). The cells were subsequently washed twice with Hanks’ balanced salt solution, and exposed to streptavidin-conjugated magnetic particles (BD Biosciences, CA, USA). A magnetic separation system (BD Biosciences) was used to separate the cells into negative (MC-rich; THY-1-, CD3-, CD14-, and CD19-) and positive (MC-poor; THY-1+, CD3+, CD14+, or CD19+) fractions. qPCR was used to determine the BFGF and IL13 expression in negative (MC-rich) and positive fractions.
Effect of IL-13 on Synovial Fibroblasts and Mφ
Synovial fibroblasts and Mφ were isolated from ST samples harvested from 8 KOA patients to study the role of IL-13 in the synovium. CD14-positive (Mφ-rich) and CD14-negative (fibroblast-rich) cells were separated using the magnetic separation technique described in a previous protocol.22 CD14-negative and CD14-positive cells were seeded in α-MEM in six-well plates and cultured for 7 days. Thereafter, the cells were exposed to vehicle (serum-free media) or 100 ng/mL of recombinant human IL-13 (rh-IL13; BioLegend) for 6 hours. The IL-13 concentration was chosen based on a protocol reported previously.20 Following stimulation, qPCR was conducted to measure BFGF expression.
Statistical Analyses
All analyses were conducted based on a pre-specified statistical analysis plan. All analyses were performed using SPSS 25.0. Continuous variables were compared between two groups using the Wilcoxon signed-rank test and among three groups using the Kruskal–Wallis test followed by the Mann–Whitney U-test using Bonferroni correction. Categorical variables were compared using the Fisher's exact test. P<0.05 was indicative of statistical significance.
Results
Clinical Characteristics by BMI
OB patients were significantly younger than NW and OW patients (Table 1). The proportion of male to female patients (P=0.099) and those with Kellgren and Lawrence grade 3 and 4 (P=0.634) was comparable across the BMI groups (Table 1).
Expression of Synovial MC Markers (CD117, CD203c, TPSB2) and BFGF by BMI
OB patients had significantly higher levels of CD117 than NW patients (P=0.011), while NW- and OW patients had comparable levels (P=0.535) (Figure 1A). OB patients also had significantly higher levels of CD203c than NW patients (P=0.027) but comparable levels to OW patients (P=0.161) (Figure 1B). Likewise, OB patients had significantly higher levels of TPSB2 than NW patients (P=0.002) but comparable levels to OW patients (P=0.247) (Figure 1C).
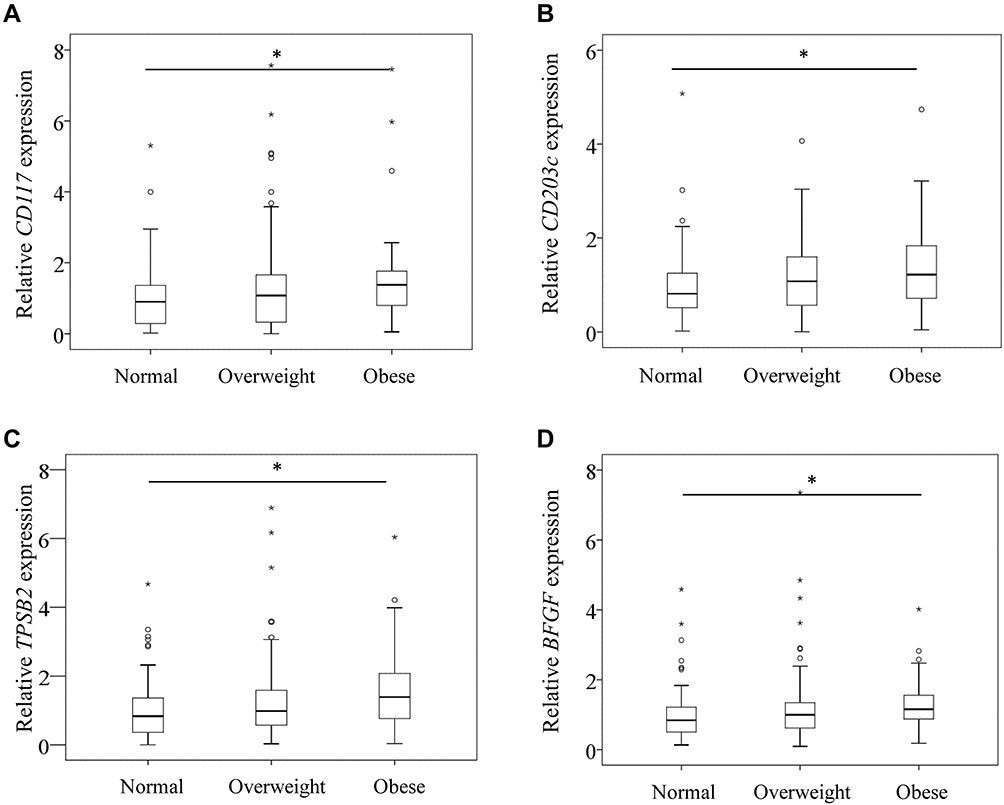 |
Figure 1 CD117 (A), CD203c (B), TPSB2 (C), and BFGF (D) mRNA expression in the synovium of normal, overweight, and obese patients with knee osteoarthritis. *P<0.05. P values are indicated. |
Similarly, OB patients had significantly higher levels of BFGF expression than NW patients (P=0.020) but comparable levels to OW patients (P=0.283) (Figure 1D).
Correlation Between MC Markers and BFGF Expression
Since our results indicated that KOA patients with obesity had higher expression levels of MC markers (CD117, CD203c, TPSB2) and BFGF, we next investigated the correlation between MC marker and BFGF expression. BFGF expression was significantly correlated with CD117 (ρ=0.273, P<0.001; Figure 2A) CD203c (ρ=0.432, P<0.001; Figure 2B) and TPSB2 (ρ=0.164, P<0.001; Figure 2C) levels.
 |
Figure 2 Correlation between expression of BFGF and MC markers. Correlation between expression of BFGF and CD117 (A), CD203c (B), and TPSB2 (C). |
MC Markers, BFGF and IL13 in MCs
Next, we measured the expression of MC markers (CD117, CD203c, TPSB2), BFGF and IL13 in MCs in MC-rich and MC-poor fractions isolated from ST specimens of KOA patients. The MC-rich fraction expressed significantly higher levels of MC markers (P=0.005; Figure 3A–C) and IL13 (P=0.009; Figure 3D) than the MC-poor fraction. Meanwhile, MC-rich and MC-poor fractions expressed comparable levels of BFGF (P=0.285; Figure 3E).
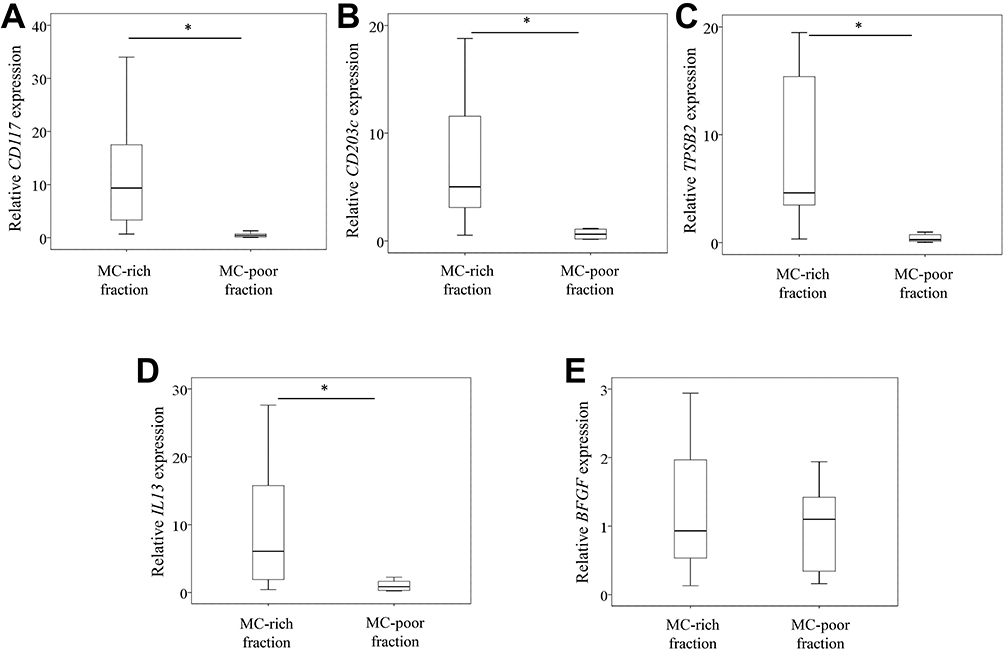 |
Figure 3 Expression of MC markers, BFGF and IL13 in mast cells. CD117 (A), CD203c (B), TPSB2 (C), IL13 (D), and BFGF (E) expression levels in mast cell (MC)-rich (THY-1-CD3-CD14-CD19-) and MC-poor (THY-1+, CD3+, CD14+, or CD19+) fractions. *P<0.05. P values are indicated. |
Effect of IL-13 on BFGF Expression in Synovial Fibroblasts and Mφ
Given that BFGF expression was comparable between MC-poor and MC-rich fractions, we next studied the effect of rh-IL13 on BFGF expression in fibroblast- and Mφ-rich fractions isolated from the ST of KOA patients. Exposure to rh-IL13 induced BFGF expression in synovial fibroblast-rich fractions (P=0.043; Figure 4A) but not Mφ-rich fractions (P=0.093; Figure 4B) at 6 h following stimulation.
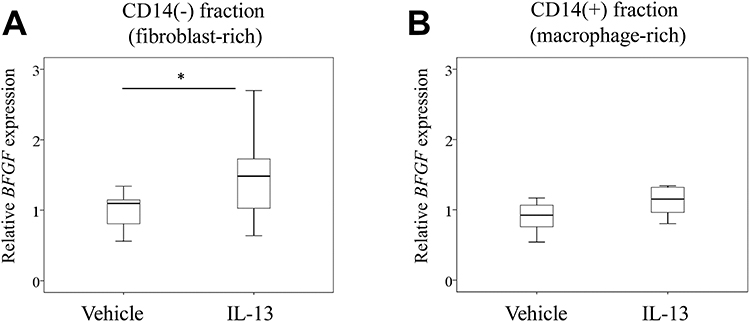 |
Figure 4 Effect of IL-13 on BFGF expression in synovial fibroblasts and Mφ. BFGF expression in CD14-negative (fibroblast-rich) (A) and CD14-positive (Mφ-rich) (B) fractions at 6 h after stimulation with vehicle or IL-13. *P<0.05. P values are indicated. |
Discussion
Obesity alters local and systemic bFGF levels. Furthermore, high levels of plasma FGF2 have been shown to be correlated with fat mass in Han Chinese populations.23 In our previous study, we reported that KOA patients with obesity had higher expression of synovial bFGF and MC markers than normal-weight patients with OA.6 Consistent with our previous results, we found that KOA patients with obesity had elevated bFGF and MC marker expression in the present study. Accumulating evidence indicates that bFGF contributes to OA pathology and cartilage destruction. bFGF stimulates the expression of MMP-13 expression in human articular chondrocytes.24 Thus, elevation of bFGF may contribute to OA pathology in KOA patients with obesity.
Immunohistochemical studies have reported increased bFGF staining in hyperplastic lining synoviocytes, and vascular cells in ST derived from rheumatoid arthritis patients.7 To investigate the potential role of MCs in bFGF expression, we measured bFGF expression in MCs isolated from osteoarthritic ST. However, we found no differences between MC and non-MC populations. Thus, although MCs express bFGF, whether MCs contribute to the elevation of bFGF in the osteoarthritic ST remains unclear.
Previous studies have reported that IL-13 is released by several immune cells including T cells,25 MCs,15,26 eosinophils,27 and basophils.28 We found that MCs expressed higher IL-13 levels than non-MC populations. In addition, IL-13 stimulated BFGF expression in synovial fibroblasts. Thus, increased MC numbers may induce BFGF expression in OA pathology by activating synovial fibroblasts in KOA patients with obesity.
There were main two limitations in the present study. First, we lack data on non-OA patients. Second, we did not examine protein levels.
In conclusion, KOA patients with obesity showed higher BFGF expression than normal- and overweight patients. Increased MC numbers may contribute to the elevation of BFGF expression through IL-13 in KOA patients with obesity.
Acknowledgments
This investigation was supported by Grant-in-Aid for Early-Career Scientists Grant No. 20K18073.
Disclosure
The authors report no conflicts of interest regarding this work.
References
1. Grotle M, Hagen KB, Natvig B, Dahl FA, Kvien TK. Obesity and osteoarthritis in knee, hip and/or hand: an epidemiological study in the general population with 10 years follow-up. BMC Musculoskelet Disord. 2008;9:132. doi:10.1186/1471-2474-9-132
2. Oliveria SA, Felson DT, Cirillo PA, Reed JI, Walker AM. Body weight, body mass index, and incident symptomatic osteoarthritis of the hand, hip, and knee. Epidemiology. 1999;10(2):161–166. doi:10.1097/00001648-199903000-00013
3. Im HJ, Muddasani P, Natarajan V, et al. Basic fibroblast growth factor stimulateSTatrix metalloproteinase-13 via the molecular cross-talk between the mitogen-activated protein kinases and protein kinase Cdelta pathways in human adult articular chondrocytes. J Biol Chem. 2007;282(15):11110–11121. doi:10.1074/jbc.M609040200
4. Li X, Ellman MB, Kroin JS, et al. Species-specific biological effects of FGF-2 in articular cartilage: implication for distinct roles within the FGF receptor family. J Cell Biochem. 2012;113(7):2532–2542. doi:10.1002/jcb.24129
5. Honsawek S, Yuktanandana P, Tanavalee A, Saetan N, Anomasiri W, Parkpian V. Correlation between plaSTa and synovial fluid basic fibroblast growth factor with radiographic severity in primary knee osteoarthritis. Int Orthop. 2012;36(5):981–985. doi:10.1007/s00264-011-1435-z
6. Uchida K, Takano S, Inoue G, et al. Increase in mast cell marker expression in the synovium of obese patients with osteoarthritis of the knee. DiabeteSTetab Syndr Obes. 2019;12:377–382. doi:10.2147/DMSO.S201523
7. Ramirez J, Celis R, Usategui A, et al. Immunopathologic characterization of ultrasound-defined synovitis in rheumatoid arthritis patients in clinical remission. Arthritis Res Ther. 2016;18:74. doi:10.1186/s13075-016-0970-9
8. Rivellese F, Rossi FW, Galdiero MR, Pitzalis C, de Paulis A. Mast Cells in Early Rheumatoid Arthritis. Int J Mol Sci. 2019;20(8):2040. doi:10.3390/ijms20082040
9. Buckley MG, Gallagher PJ, Walls AF. Mast cell subpopulations in the synovial tissue of patients with osteoarthritis: selective increase in numbers of tryptase-positive, chymase-negative mast cells. J Pathol. 1998;186(1):67–74. doi:10.1002/(SICI)1096-9896(199809)186:1<67::AID-PATH132>3.0.CO;2-D
10. de Lange-brokaar BJ, Kloppenburg M, Andersen SN, et al. Characterization of synovial mast cells in knee osteoarthritis: association with clinical parameters. Osteoarthritis Cartilage. 2016;24(4):664–671. doi:10.1016/j.joca.2015.11.011
11. Dean G, Hoyland JA, Denton J, Donn RP, Freemont AJ. Mast cells in the synovium and synovial fluid in osteoarthritis. Br J Rheumatol. 1993;32(8):671–675. doi:10.1093/rheumatology/32.8.671
12. Inoue Y, King TE, Tinkle SS, Dockstader K, Newman LS. Human mast cell basic fibroblast growth factor in pulmonary fibrotic disorders. Am J Pathol. 1996;149(6):2037–2054.
13. Qu Z, Liebler JM, Power STR, et al. Mast cells are a major source of basic fibroblast growth factor in chronic inflammation and cutaneous hemangioma. Am J Pathol. 1995;147(3):564–573.
14. Cameron L, Hamid Q, Wright E, et al. Local synthesis of epsilon germline gene transcripts, IL-4, and IL-13 in allergic nasal mucosa after ex vivo allergen exposure. J Allergy Clin Immunol. 2000;106(1 Pt 1):46–52. doi:10.1067/mai.2000.107398
15. McLeod JJ, Baker B, Ryan JJ. Mast cell production and response to IL-4 and IL-13. Cytokine. 2015;75(1):57–61. doi:10.1016/j.cyto.2015.05.019
16. Pawankar R, Okuda M, Yssel H, Okumura K, Ra C. Nasal mast cells in perennial allergic rhinitics exhibit increased expression of the Fc epsilonRI, CD40L, IL-4, and IL-13, and can induce IgE synthesis in B cells. J Clin Invest. 1997;99(7):1492–1499. doi:10.1172/JCI119311
17. Isomaki P, Luukkainen R, Toivanen P, Punnonen J. The presence of interleukin-13 in rheumatoid synovium and its antiinflammatory effects on synovial fluid Mφ from patients with rheumatoid arthritis. Arthritis Rheum. 1996;39(10):1693–1702. doi:10.1002/art.1780391012
18. Moue T, Tajika Y, Ishikawa S, et al. Influence of IL13 on Periostin Secretion by Synoviocytes in Osteoarthritis. Vivo. 2017;31(1):79–85. doi:10.21873/invivo.11028
19. Nees TA, Rosshirt N, Zhang JA, et al. Synovial Cytokines Significantly Correlate with Osteoarthritis-Related Knee Pain and Disability: inflammatory Mediators of Potential Clinical Relevance. J Clin Med. 2019;8(9):1343. doi:10.3390/jcm8091343
20. Lee JH, Kaminski N, Dolganov G, et al. Interleukin-13 induces dramatically different transcriptional programs in three human airway cell types. Am J Respir Cell Mol Biol. 2001;25(4):474–485. doi:10.1165/ajrcmb.25.4.4522
21. Noordenbos T, Yeremenko N, Gofita I, et al. Interleukin-17-positive mast cells contribute to synovial inflammation in spondylarthritis. Arthritis Rheum. 2012;64(1):99–109. doi:10.1002/art.33396
22. Takano S, Uchida K, Miyagi M, et al. Nerve Growth Factor Regulation by TNF-alpha and IL-1beta in Synovial Mφ and Fibroblasts in Osteoarthritic Mice. J Immunol Res. 2016;2016:5706359. doi:10.1155/2016/5706359
23. Hao RH, Guo Y, Dong SS, et al. Associations of PlaSTa FGF2 Levels and PolymorphiSTs in the FGF2 Gene with Obesity Phenotypes in Han Chinese Population. Sci Rep. 2016;6:19868. doi:10.1038/srep19868
24. Im HJ, Sharrocks AD, Lin X, et al. Basic fibroblast growth factor induceSTatrix metalloproteinase-13 via ERK MAP kinase-altered phosphorylation and sumoylation of Elk-1 in human adult articular chondrocytes. Open Access Rheumatol. 2009;1:151–161. doi:10.2147/oarrr.s7527
25. Corry DB. IL-13 in allergy: home at last. Curr Opin Immunol. 1999;11(6):610–614.
26. Burd PR, Thompson WC, Max EE, Mills FC. Activated mast cells produce interleukin 13. J Exp Med. 1995;181(4):1373–1380. doi:10.1084/jem.181.4.1373
27. Schmid-Grendelmeier P, Altznauer F, Fischer B, et al. Eosinophils express functional IL-13 in eosinophilic inflammatory diseases. J Immunol. 2002;169(2):1021–1027. doi:10.4049/jimmunol.169.2.1021
28. Li H, Sim TC, Alam R. IL-13 released by and localized in human basophils. J Immunol. 1996;156(12):4833–4838.
 © 2021 The Author(s). This work is published and licensed by Dove Medical Press Limited. The full terms of this license are available at https://www.dovepress.com/terms.php and incorporate the Creative Commons Attribution - Non Commercial (unported, v3.0) License.
By accessing the work you hereby accept the Terms. Non-commercial uses of the work are permitted without any further permission from Dove Medical Press Limited, provided the work is properly attributed. For permission for commercial use of this work, please see paragraphs 4.2 and 5 of our Terms.
© 2021 The Author(s). This work is published and licensed by Dove Medical Press Limited. The full terms of this license are available at https://www.dovepress.com/terms.php and incorporate the Creative Commons Attribution - Non Commercial (unported, v3.0) License.
By accessing the work you hereby accept the Terms. Non-commercial uses of the work are permitted without any further permission from Dove Medical Press Limited, provided the work is properly attributed. For permission for commercial use of this work, please see paragraphs 4.2 and 5 of our Terms.