")
Back to Journals » OncoTargets and Therapy » Volume 7
Positron emission tomographic monitoring of dual phosphatidylinositol-3-kinase and mTOR inhibition in anaplastic large cell lymphoma
Authors Graf N, Li Z, Herrmann K, Weh D, Aichler M, Slawska J, Walch A, Peschel C, Schwaiger M, Buck A, Dechow T, Keller U
Received 17 December 2013
Accepted for publication 7 February 2014
Published 23 May 2014 Volume 2014:7 Pages 789—798
DOI https://doi.org/10.2147/OTT.S59314
Checked for plagiarism Yes
Review by Single anonymous peer review
Peer reviewer comments 2
Nicolas Graf,1 Zhoulei Li,2 Ken Herrmann,2,4 Daniel Weh,2 Michaela Aichler,3 Jolanta Slawska,2 Axel Walch,3 Christian Peschel,1 Markus Schwaiger,2 Andreas K Buck,2,4 Tobias Dechow,1,* Ulrich Keller1,*
1III Medical Department, 2Department of Nuclear Medicine, Technische Universität München, Munich, Germany; 3Research Unit Analytical Pathology, Helmholtz Zentrum München, Munich, Germany; 4Department of Nuclear Medicine, Universitätsklinikum Würzburg, Würzburg, Germany
*These authors contributed equally to this work
Background: Dual phosphatidylinositol-3-kinase (PI3K)/mammalian target of rapamycin (mTOR) inhibition offers an attractive therapeutic strategy in anaplastic large cell lymphoma depending on oncogenic nucleophosmin-anaplastic lymphoma kinase (NPM-ALK) signaling. We tested the efficacy of a novel dual PI3K/mTOR inhibitor, NVP-BGT226 (BGT226), in two anaplastic large cell lymphoma cell lines in vitro and in vivo and performed an early response evaluation with positron emission tomography (PET) imaging using the standard tracer, 2-deoxy-2-[18F]fluoro-D-glucose (FDG) and the thymidine analog, 3'-deoxy-3'-[18F]fluorothymidine (FLT).
Methods: The biological effects of BGT226 were determined in vitro in the NPM-ALK positive cell lines SU-DHL-1 and Karpas299 by 3-[4,5-Dimethylthiazol-2-yl]-2,5-diphenyltetrazolium bromide assay, propidium iodide staining, and biochemical analysis of PI3K and mTOR downstream signaling. FDG-PET and FLT-PET were performed in immunodeficient mice bearing either SU-DHL-1 or Karpas299 xenografts at baseline and 7 days after initiation of treatment with BGT226. Lymphomas were removed for immunohistochemical analysis of proliferation and apoptosis to correlate PET findings with in vivo treatment effects.
Results: SU-DHL-1 cells showed sensitivity to BGT226 in vitro, with cell cycle arrest in G0/G1 phase and an IC50 in the low nanomolar range, in contrast with Karpas299 cells, which were mainly resistant to BGT226. In vivo, both FDG-PET and FLT-PET discriminated sensitive from resistant lymphoma, as indicated by a significant reduction of tumor-to-background ratios on day 7 in treated SU-DHL-1 lymphoma-bearing animals compared with the control group, but not in animals with Karpas299 xenografts. Imaging results correlated with a marked decrease in the proliferation marker Ki67, and a slight increase in the apoptotic marker, cleaved caspase 3, as revealed by immunostaining of explanted lymphoma tissue.
Conclusion: Dual PI3K/mTOR inhibition using BGT226 is effective in ALK-positive anaplastic large cell lymphoma and can be monitored with both FDG-PET and FLT-PET early on in the course of therapy.
Keywords: lymphoma, phosphatidylinositol-3-kinase, mammalian target of rapamycin, inhibition, positron emission tomography
Introduction
Anaplastic large cell lymphoma (ALCL) is an aggressive subtype of non-Hodgkin lymphoma originating from the T/null lineage. Initially it is a curable disease, but refractory and relapsed patients have a much worse prognosis. Therefore, there is an urgent need for new therapies in this disease.
The majority of ALCL is associated with the t(2;5)(p23;q53) chromosomal translocation which results in expression of the oncogenic fusion protein nucleophosmin-anaplastic lymphoma kinase (NPM-ALK).1 NPM-ALK has a constitutive active tyrosine kinase function leading to activation of several signal transduction pathways, of which the phosphatidylinositol-3-kinase (PI3K)/Akt pathway is of particular interest in tumor biology.2,3 It is well established that oncogenic activation of the PI3K/Akt pathway contributes to a malignant phenotype in both solid and hematological malignancies due to its effects on various cellular functions, including cell survival, growth, proliferation, angiogenesis, metabolism, and migration.4 Accordingly, inhibition of this signaling cascade has been a focus in developmental therapeutics. One important component of the PI3K/Akt signaling network in relation to carcinogenesis is the enzyme target mammalian target of rapamycin (mTOR), which is present in at least two distinct cellular complexes termed mTOR-raptor (mTORC1) and mTOR-rictor (mTORC2), respectively.5 Briefly, mTORC2 activates Akt by phosphorylation, whereas mTORC1 promotes mRNA translation of multiple proteins, including Mcl-1 (a prosurvival factor), cyclin D3 (a cell cycle regulator), the proangiogenic vascular endothelial growth factor, and glucose transporter 1, as well as proteins involved in lipid and protein metabolism via its substrates, ie, eukaryotic initiating factor-4e binding protein 1 and S6 kinase (S6K). Importantly, S6K exerts strong negative feedback control on the activity of PI3K. Consequently, inhibition of mTORC1 releases the S6K-mediated negative feedback loop, resulting in a paradoxical increase of PI3K and Akt activity.5 Therefore, there is legitimate concern that the efficacy of selective mTORC1 inhibitors, which include rapamycin and its analogs (rapalogs), eg, everolimus, is limited. This has already been shown in clinical trials.6 Concomitant PI3K and mTOR inhibition, however, offers the theoretical advantage of effective abrogation of the PI3K/Akt/mTOR pathway.6 In a large in vitro study, the two dual PI3K/mTOR inhibitors, NVP-BEZ235 (BEZ235) and NVP-BGT226 (BGT226), showed efficacy in a broad set of hematological malignancies, including aggressive lymphoma, multiple myeloma, and acute leukemia.7 However, there was considerable variability in the response to each drug within any individual lymphoma histology. In fact, the heterogeneity in drug response within a particular histology was generally comparable with that observed between different histologies. These findings support the demand for predictive markers enabling clinicians to evaluate treatment response early in the course of therapy, thus preventing unnecessary toxicity and costs in the event of refractory disease. In addition, these tools would help to accelerate evaluation of new drugs in the preclinical and clinical setting.
Imaging modalities provide an attractive option. Positron emission tomography (PET) with the glucose analog 2-deoxy-2-[18F]fluoro-D-glucose (FDG) has significant value for diagnosis, staging, and post-treatment assessment in aggressive lymphoma.8 However, clinical studies regarding interim FDG-PET to assess early treatment response, ie, after two or four cycles of chemotherapy, have yielded mixed results.9–11 One important limitation of FDG is its nonspecific uptake in inflammatory lesions, leading to false-positive results.12 In contrast with FDG, which tracks general cellular metabolism, 3′-deoxy-3′-[18F]fluorothymidine (FLT) has been developed for visualizing tumor cell proliferation.13 After uptake by nucleoside transporters, FLT is phosphorylated by thymidine kinase 1, a cytosolic enzyme which represents the rate-limiting step for retention of FLT within the cell. Thymidine kinase 1 expression and activity is closely related to the S-phase of the cell cycle, making FLT an excellent surrogate marker for proliferation.14,15 We have previously shown that FLT is suitable for prediction of the early response to chemotherapy in aggressive lymphoma,16,17 and that it offers advantages over the standard tracer FDG in monitoring early response to targeted and dose-dependent chemotherapy.18,19
The objective of this study was to assess the efficacy of BGT226, a novel dual PI3K/mTOR inhibitor, in a xenograft mouse model of human ALCL and to monitor the response to treatment noninvasively using FDG-PET and FLT-PET imaging.
Materials and methods
Cell lines and animal model
SU-DHL-1 and Karpas299 cells, derived from human ALCL harboring the t(2;5) translocation, were obtained from the German Collection of Microorganisms and Cell Cultures. All cells were cultured in Roswell Park Memorial Institute 1640 medium containing 10% fetal bovine serum, 1 mM L-glutamine, and 1% penicillin/streptomycin (Life Technologies, Carlsbad, CA, USA). Female immunodeficient mice (CB-17 SCID) aged 6–8 weeks were obtained from the Charles River Laboratories (Wilmington, MA, USA). For induction of tumors, 10×106 SU-DHL-1 or 5×10⁶ Karpas299 cells suspended in 100 μL of sterile phosphate-buffered saline were injected subcutaneously into the right shoulder region. All animal experiments were authorized by the regional government agency (Regierung von Oberbayern).
Inhibitor
BGT226 (a dual PI3K/mTOR inhibitor) was provided by Novartis (Basel, Switzerland). The inhibitor was solubilized in 0.01% HCl to 1 μM stock solution and stored at −20°C. The primary solution was diluted to 0–100 nM with Roswell Park Memorial Institute 1640 medium for cell culture.
MTT assay
MTT (3-[4,5-Dimethylthiazol-2-yl]-2,5-diphenyltetrazolium bromide) assays were performed according to the manufacturer’s instructions (Promega Corporation, Madison, WI, USA). Briefly, 1×10⁴ SU-DHL-1 or Karpas299 cells per well (96-well plate) were incubated at 37°C with different concentrations of BGT226 for 24 and 48 hours. Next, 20 μL of MTT dilution in phosphate-buffered saline were added to each well, and the cells were incubated for 90 minutes. Absorbance was measured at 570 nm using a Bio-Tek EL×800™ Series universal microplate reader (Progen Scientific, Kuala Lumpur, Malaysia).
Flow cytometry
Lymphoma cells (5×10⁵ per well in 12-well plates) were incubated with different concentrations of BGT226 at 37°C. After 24 and 48 hours, the cells were centrifuged (1,700 U per minute for 7 minutes) and stored in 3 mL of ethanol (70%) at −20°C. On the day of analysis, cells were centrifuged and resuspended in 300 μL of phosphate-buffered saline. After RNA digestion by ribonuclease A (95%, Sigma-Aldrich, St Louis, MO, USA), propidium iodide (Sigma-Aldrich) was added at a dilution of 1:500. Cells were incubated for 30 minutes at 37°C and analyzed (Beckman Coulter, Fullerton, CA, USA).
Immunoblotting
Cells were incubated with different concentrations of BGT226 at 37°C. After 6 hours, cells were washed, pelleted, and stored at −80°C. After lysis, the protein concentration was determined using protein assay dye reagent (Bio-Rad Laboratories, Inc., GmbH, Munich, Germany) with bovine serum albumin as standard. For immunoblotting, 50 μg of protein per lane was separated on 7.5% gradient ready-made sodium dodecyl sulfate gel (Bio-Rad Laboratories, Inc.) and transferred to a polyvinylidene difluoride membrane (EMD Millipore Corporation, Billerica, MA, USA). Primary antibodies (AKT or p-AKT, p70S6K or p-p70S6K; all from Cell Signaling Technology Inc., Danvers, MA, USA) were diluted 1:200 into blocking buffer and incubated overnight at 4°C, and then washed and incubated with secondary antibody. Blots were developed using a Pierce Fast Western blot kit (Thermo Fisher Scientific, Waltham, MA, USA) and exposed to film (Thermo Fisher Scientific).
Tumor volume and therapeutic regimens
Tumor diameters were measured daily with a shifting caliper by the same person followed by tumor volume calculation using the formula (length × [width]2)/2. When xenotransplants reached a size of approximately 300 mm3 (day 0), ie, about 4 weeks after injection of SU-DHL-1 cells and one week after injection of Karpas299 cells, the animals were treated with BGT226 (7.5 mg/kg orally) for 4 consecutive days. Treatment was then stopped for 3 days and resumed on day 7 (ie, “4 days on, 3 days off”). The control group received 0.01% HCl only.
PET imaging
FLT and FDG were synthesized as previously described,20 and were obtained from the Radiopharmacy Unit of the Technische Universität München. Imaging was performed using a micro PET system (Inveon™, Siemens Preclinical Solutions, Knoxville, TN, USA). FLT or FDG was administered via tail vein injection (100 μL) at an activity dose of 5–10 MBq per mouse. Accumulation of radiotracer in the tumor was allowed for 60 minutes. The mice were then imaged using a 15-minute static acquisition.
PET data analysis
Tumor-to-background ratios (TBRs) were calculated for semiquantitative assessment of tracer accumulation in the tumor. Circular three-dimensional regions of interest were placed manually in the area with the highest tumor activity. The diameters did not cover the entire tumor volume to avoid partial volume effects. For determination of background activity, two three-dimensional regions of interest were placed in the spinal muscle at the level of the kidneys. Corresponding TBR, meantumor/meanmuscle, were calculated.
Histological and immunohistochemical analysis
Formalin-fixed, paraffin-embedded sections (5 μm) of resected tumor tissue were dewaxed, rehydrated, and microwaved for 30 minutes in 0.01 M citrate buffer (pH 6.0) containing 0.1% Tween 20. Sections were washed in Tris-buffered saline (pH 7.6) containing 5% fetal calf serum (Life Technologies, Carlsbad, CA, USA) for 20 minutes. The primary antibodies used were: anti-Ki67 antigen antibody solution (MIB-1, M7240, Dako; 1:75 diluted with Antibody Diluent [Dako ChemMate; Dako, Glostrup, Denmark]) and anti-cleaved caspase-3 rabbit monoclonal antibody solution (Asp175, Cell Signaling Technology Inc.). The remainder of the procedure was performed on an automated immunostainer (Discovery XT, Ventana Medical Systems Inc., Oro Valley, AZ, USA). Diaminobenzidine (Ventana Medical Systems Inc.) liquid served as the chromogen.
Statistical analysis
Statistical analyses were performed using the statistical function of Excel 2007 (Microsoft, Redmond, WA, USA) or GraphPad Prism 5 (GraphPad Software Inc., La Jolla, CA, USA). A P-value <0.05 as assessed by two-tailed Student’s t-test was considered to be statistically significant.
Results
SU-DHL-1 cell line is sensitive to BGT226 in vitro
We first investigated the in vitro efficacy of dual PI3K/mTOR inhibition with BGT226 in a cell line-based lymphoma model comprising two ALCL cell lines, ie, SU-DHL-1 and Karpas299, both of which depend on constitutive NPM-ALK signalling18 and therefore seemed to be suitable for testing BGT226. Viability of SU-DHL-1 cells was impaired by BGT226 in a dose-dependent and to some degree time-dependent manner, as shown by MTT assay, with a maximum effect at the 100 nM dose level and an IC50 of less than 10 nM (Figure 1A). Cell cycle analysis using propidium iodide staining showed induction of cell cycle arrest, as demonstrated by a significant decrease of the S phase fraction and a marked increase of the G0/G1 fraction, as well as proapoptotic effects at higher dose levels, as indicated by an increase of the subG1 fraction (Figure 1B). At the protein level, expression of phosphorylated p70S6K, one of the downstream targets of mTOR,6 was virtually undetectable at the 10 nM dose level after 6 hours of incubation with BGT226. In addition, the phosphorylated form of the PI3K downstream signaling molecule Akt6 was reduced in a dose-dependent manner (Figure 1C). Thus, SU-DHL-1 is an NPM-ALK+ cell line with high sensitivity to BGT226, and is suitable as a responder cell line.
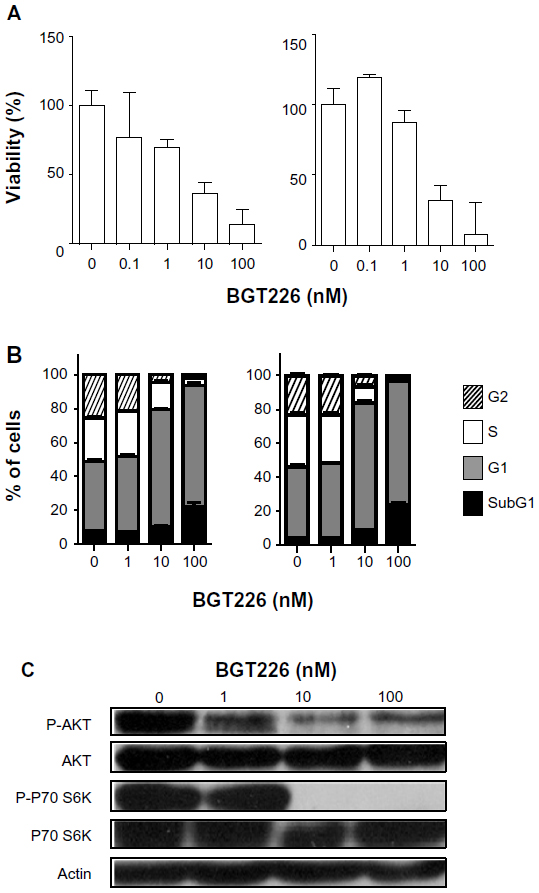 | Figure 1 SU-DHL-1 is sensitive to phosphatidylinositol-3-kinase/mammalian target of rapamycin inhibition in vitro. |
Karpas299 cell line is mainly resistant to BGT226 in vitro
In contrast with SU-DHL-1 cells, Karpas299 cells did not respond to BGT226 in the low nanomolar range. In fact, about 10-fold higher concentrations of BGT226 as compared with SU-DHL-1 cells were necessary to observe inhibitory effects. MTT assay revealed an IC50 of about 100 nM that was independent of incubation time (Figure 2A). Accordingly, a relevant decrease of the S phase fraction and an increase of the G0/G1 fraction was only seen at the same high dose level using propidium iodide cell cycle analysis, whereas the subG1 fraction indicating apoptosis was unaffected at any dose level or time point tested (Figure 2B). Consistent with viability and cell cycle assays, Western blot analysis revealed virtually unchanged Akt phosphorylation and incomplete inhibition of p70S6 kinase phosphorylation at 100 nM (Figure 2C). Thus, Karpas299 is an NPM-ALK+ cell line with low sensitivity to BGT226, and is suitable as a low/nonresponder cell line.
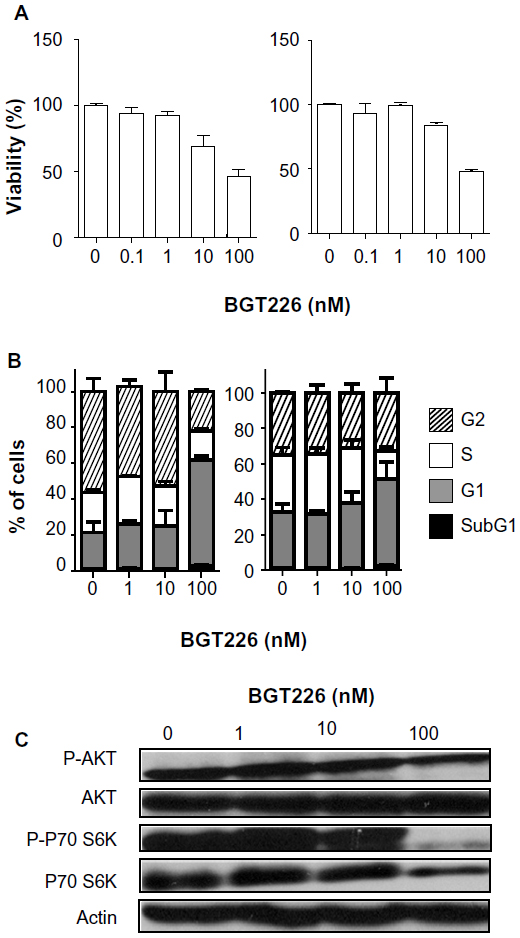 | Figure 2 Karpas299 is mainly resistant to phosphatidylinositol-3-kinase/mammalian target of rapamycin inhibition in vitro. |
PET imaging distinguishes BGT226-sensitive from BGT226-resistant lymphoma in vivo
Since SU-DHL-1 cells, but not Karpas299 cells, were sensitive to BGT226, we evaluated whether PET imaging was able to visualize therapeutic sensitivity and resistance, respectively, early on in vivo. To this end, PET using the glucose analog FDG and the thymidine analog FLT as radiotracers was performed before and 7 days after initiation of treatment with BGT226 in mice bearing either SU-DHL-1 or Karpas299 lymphoma xenografts.
SU-DHL-1 tumors treated with BGT226 showed a marked reduction in growth and only a modest increase in tumor volume until day 7 (n=10, mean 2.0-fold increase, standard deviation [SD] 0.22) followed by stabilization until day 14 (n=5; mean 2.1-fold increase, SD 0.20), whereas vehicle-treated control animals showed rapid growth of lymphomas on day 7 (n=7, mean 6.1-fold increase, SD 0.16) and day 14 (n=3; mean 11.6-fold increase, SD 0.17; P<0.001, Figure 3A). In contrast, Karpas299 cells gave rise to lymphomas that were mainly resistant to BGT226 (n=4, mean 5.3-fold increase, SD 0.21) resulting in a tumor volume on day 14 similar to that of control tumors (n=4, mean 6.2-fold increase, SD 0.40; P=0.08, Figure 4A).
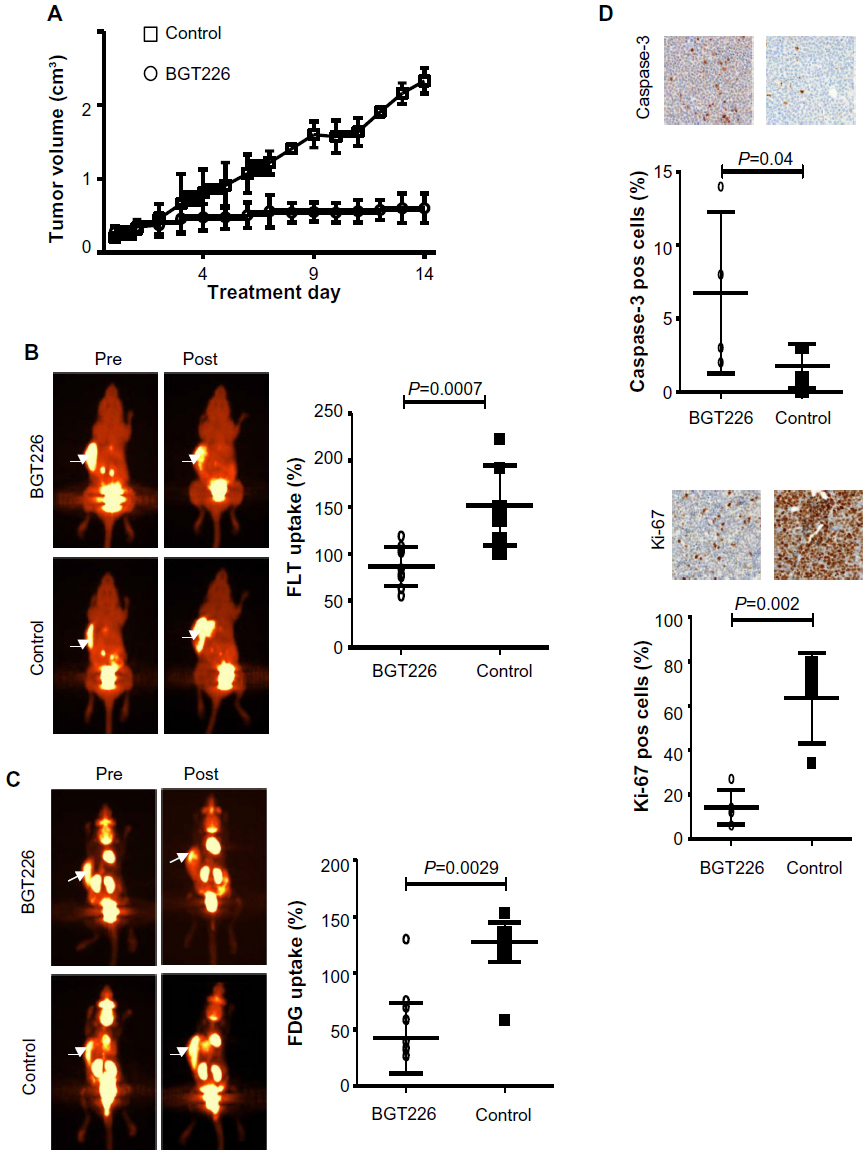 | Figure 3 Both FLT-PET and FDG-PET monitored the response to PI3K/mTOR inhibition in SU-DHL-1 xenografts in vivo. |
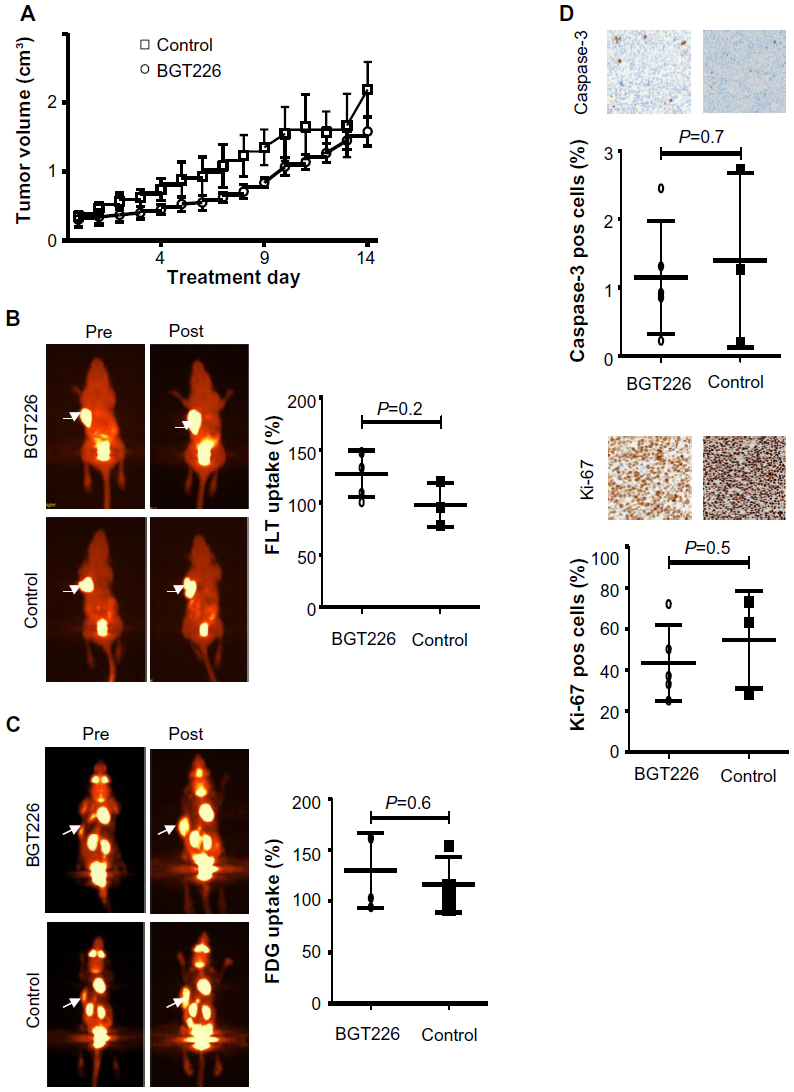 | Figure 4 FLT-PET and FDG-PET imaging for response prediction in vivo allows early detection of refractory disease in Karpas299 xenografts. Treatment with BGT226 7.5 mg/kg (n=9) or placebo (n=7) started when tumors reached a volume of approximately 300 mm3 (day 0). Mice received BGT226 or placebo for 4 consecutive days followed by a 3-day intermission after which therapy was resumed. Some mice were sacrificed on day 7 to explant lymphomas for immunohistochemical analysis (therapy group, n=5; control group, n=3) and the remaining animals were monitored for tumor growth until day 14. (A) Tumor growth measurements. In this setting, either FLT-PET ([B] therapy group, n=5; control, n=3) or FDG-PET ([C] therapy group, n=4; control group, n=4) was performed on days 0 and 7. Left: representative PET scans showing change in tumor tracer uptake (arrows). Right: TBR was calculated and served as an indicator of tracer uptake. TBR on day 0 was defined as 100%. Change in TBR compared with pretreatment values is shown for treated (BGT226) and control animals. (D) Immunohistochemistry of explanted lymphomas using the apoptosis marker, cleaved caspase-3, and the proliferation marker, Ki-67. Mean values ± standard deviation are shown. |
To test the suitability of PET imaging for very early response assessment, the TBR of both FLT-PET and FDG-PET was determined before therapy and defined as 100%. A second PET scan was performed on day 7 of treatment, and change in TBR (ie, relative TBR) was calculated. In mice carrying SU-DHL-1 lymphoma, treatment with BGT226 led to a significant TBR reduction on day 7 for both FLT-PET (n=10, mean ± SD TBR 87%±20.8%, range 55%–119%, P=0.0007; Figure 3B) and FDG-PET (n=10, mean TBR 81%±31.3%, range 35%–130%, P=0.0029; Figure 3C) compared with the control group (FLT, n=7, mean TBR 152%±42.6%, range 100%–223%; FDG, n=7, mean TBR 128%±17.4%, range 97%–153%). In contrast, PET imaging of resistant Karpas299 xenografts revealed no significant differences in relative TBR between the therapy and control groups for either FLT-PET (therapy, n=5, mean TBR 127%±22.0%, range 100%–148%; control group, n=3, mean TBR 98%±21.1%, range 78%–120%, P=0.2; Figure 4B) or FDG-PET (therapy, n=4, mean TBR 130%±36.6%, range 94%–162%; control group, n=4, mean TBR 116%±27.2%, range 91%–154%, P=0.6; Figure 4C). Thus, PET imaging with both tracers, FDG depicting tumor metabolism and FLT reflecting proliferation, were suitable for determining response as early as 7 days after initiation of treatment.
PET results correlate with proliferation marker Ki67 in treated xenograft lymphomas
In order to determine the correlation between PET data and in vivo treatment effects, we performed immunohistochemical analysis on explanted tumors for the proliferation marker, Ki67, and the apoptosis marker, cleaved caspase-3. In SU-DHL-1 lymphomas, treatment with BGT226 led to a small but significant increase in apoptosis as quantified by cleaved caspase-3-positive cells (n=4, mean 7.0%±5.3%) compared with untreated mice (n=4, mean 2.0%±1.4%; P=0.04, Figure 3D). Importantly, proliferation was substantially decreased by BGT226, with a mean of 14% Ki67-positive cells (n=5; SD 7.5%) for the treated tumors and 64% (n=4; SD 20.3%) for the control tumors (P=0.002). In contrast, no significant changes in apoptotic cells (therapy group, n=5, mean 1%, SD 0.8%; control group, n=3, mean 1%, SD 1.3%; P=0.7) or proliferating cells (therapy group, n=5, mean 44%, SD 18.2%; control group, n=3, mean 55%, SD 23.9%; P=0.5) could be observed in explanted Karpas299 xenografts (Figure 4D). Based on the strong concordance between tumor growth and response evaluation by PET imaging in vivo as well as effective in vitro pathway inhibition, our data suggest that both FLT- and FDG-PET are suitable for early differentiation between sensitive and refractory ALCL during BGT226 treatment.
Discussion
Constitutive activation of the PI3K/Akt/mTOR pathway occurs in many human cancers due to a variety of genetic aberrations leading to increased cell survival, growth and proliferation, protein synthesis and glucose metabolism, angiogenesis, and migration.4 Dual PI3K/mTOR inhibitors, eg, BEZ235 and BGT226, have shown antitumor activity in several preclinical solid and hematological tumor models.3,7,21–23 In addition, Phase I clinical trials are underway to investigate safety and efficacy of PI3K/mTOR inhibitors, mainly in solid tumors.24–26 Various pharmacodynamic and predictive biomarkers have been incorporated in these studies to assess target inhibition, ie, biochemical assessment of tumor tissue and prediction of efficacy by imaging, eg, with FDG-PET. However, neither pathway downregulation22 nor metabolic response as assessed by FDG-PET24 necessarily correlate with clinical response. In contrast, early reduction of FLT uptake has been shown to be linked with in vivo sensitivity to PI3K/mTOR inhibition.22
In this study, two high-grade lymphoma cell lines representing ALCL, ie, SU-DHL-1 and Karpas299, characterized by NPM-ALK-dependent PI3K/Akt/mTOR pathway activation,18 were used as cell line-based models to evaluate FDG-PET and FLT-PET as early response markers of combined PI3K/mTOR inhibition using BGT226. We found that SU-DHL-1 cells, but not Karpas299 cells, were sensitive to BGT226 and that the TBRs of both FDG-PET and FLT-PET were significantly reduced in mice bearing BGT226-sensitive SU-DHL-1 xenografts compared with the control group, but not in BGT226-resistant Karpas299-induced lymphomas. Thus, PET imaging was able to discriminate between sensitive and resistant lymphoma and correlated with in vitro antitumor activity as well as immunohistochemistry of explanted lymphomas, revealing the antiproliferative and proapoptotic effects of BGT226 in vivo. In line with previous reports for other malignancies,21,23,27 treatment of sensitive ALCL cells (SU-DHL-1) with BGT226 in vitro resulted in a dose-dependent and to some extent time-dependent decrease of cell viability in the low nanomolar range. Whereas mTORC1-dependent phosphorylation of S6K was completely abrogated with concentrations as low as 10 nM, PI3K-dependent phosphorylation of AKT was still present to a lower degree at 100 nM, suggesting that BGT226 suppresses mTORC1 activity more effectively than PI3K activity and that the release of the negative feedback loop exerted by p70S6K leading to Akt reactivation is not completely abolished. Similar observations have also been reported for BEZ235, another PI3K/mTOR inhibitor.22 The predominant mode of antiproliferative activity of BGT226 in vitro was a dose-dependent shift of cells from the G2/M and S phase to the G0/G1 phase. The difference between SU-DHL-1 and Karpas299 cells with regard to susceptibility to BGT226 could therefore be explained by the different sensitivity of these cell lines to the antiproliferative effect of the cyclin-dependent kinase 1 inhibitor, p27kip1.28 A considerable increase in apoptosis was only observed with high doses in a time-independent manner. The impact of BGT226 on the cell cycle seems to differ markedly depending on the tumor model assessed, ranging from highly proapoptotic23 to solely cytostatic effects.21,22
In vivo sensitivity to BGT226 correlated with the in vitro data and could be assessed noninvasively by both FDG-PET and FLT-PET on day 7. The observation that FLT-PET reflects the antiproliferative activity of inhibitors of the NPM-ALK/PI3K/mTOR pathway early in the course of therapy has been reported for other lymphomas.18,29,30 In contrast with some of these studies, reduction of the TBR of FLT-PET seen in the present study was not that pronounced and moreover not significantly reduced when compared with the baseline TBR on day 0 in treated animals. Recent publications addressing the limitations of FLT-PET imaging have suggested that the mode of thymidine synthesis within the tumor cell could be a confounding factor in that the proliferative index of tumors driven by de novo thymidine synthesis is not adequately “lightened up” by FLT.31–33 However, it seems unlikely that predominant de novo thymidine synthesis under BGT226 therapy contributes to the less marked reduction of FLT-PET given that we have already used both cell lines in a previous study18 without observing any limitations. However, inhibition of proliferation can be a transient phenomenon, especially when drugs are given on an intermittent basis, like BGT226 in our study, ie, “4 days on, 3 days off”. Western blot analysis of PI3K downstream targets after withdrawal of BGT226 showed that its inhibitory effect was relieved as early as 16 hours after the last dose.34 Thus, FLT-PET on day 7 after a 72-hour drug-free interval might underestimate the long-term antiproliferative activity as tumor cells temporarily regain their proliferative capacity. Accordingly, an unexpected increase in FLT uptake has been seen in mantle cell lymphoma one week after single-shot mTOR inhibition.29 Taking pharmacodynamic issues into account, we assume that FLT-PET would reflect an antiproliferative response more accurately when performed soon after drug administration.
Interestingly, FDG-PET also discriminated between sensitive and resistant lymphoma. This was unexpected since many reports have demonstrated limitations of FDG-PET in monitoring response to targeted therapy,18,35,36 which has been attributed mainly to an influx of inflammatory cells resulting in increased FDG uptake.19,29 Of note, the PI3K/Akt/mTOR network stimulates cellular glucose uptake via glucose transporter 1 and phosphorylation to glucose-6-phosphate by hexokinase,4 both representing the limiting steps in FDG uptake.37 It has therefore been proposed that reduction of FDG uptake during PI3K/Akt and mTOR inhibition visualizes disruption of glucose metabolism rather than antiproliferative activity, given that FDG-PET failed to predict the clinical response to the rapalog temsirolimus35 and BGT22624 in clinical studies. Still, FDG-PET and FLT-PET predicted the response to BGT226, suggesting equally strong concomitant inhibition of both proliferation and glucose metabolism in our model of ALCL.
Conclusion
In summary, we have shown that the promising therapeutic efficacy of dual PI3K/mTOR inhibition can be monitored in an in vivo model of ALCL with either FDG-PET or FLT-PET early in the course of therapy. Our results should contribute to the design of preclinical and clinical studies incorporating PET imaging into pathway-directed treatments.
Acknowledgments
This work was supported by the Deutsche Forschungsgemeinschaft (SFB 824 and SFB TRR54) and the German Consortium for Cancer Research (DKTK). We appreciate the excellent contributions made by our colleague Petra Watzlowik and the ongoing support of our technical staff members, Alexander Hildebrandt, Sybille Reder, Coletta Kruschke, and Brigitte Dzewas.
Author contributions
NG, KH, AKB, TD, and UK designed the experiments. NG, ZL, DW, MA and AW performed the experiments. NG, ZL, DW, MA, KH, AKB, TD, UK and AW analyzed the data. NG, ZL, KH, CP, MS, AKB, TD, and UK wrote and reviewed the paper. All authors contributed toward data analysis, drafting and revising the paper and agree to be accountable for all aspects of the work.
Disclosure
The authors report no conflicts of interests in this work.
References
Morris SW, Kirstein MN, Valentine MB, et al. Fusion of a kinase gene, ALK, to a nucleolar protein gene, NPM, in non-Hodgkin’s lymphoma. Science. 1994;263:1281–1284. | |
Bai RY, Ouyang T, Miething C, Morris SW, Peschel C, Duyster J. Nucleophosmin-anaplastic lymphoma kinase associated with anaplastic large-cell lymphoma activates the phosphatidylinositol 3-kinase/Akt antiapoptotic signaling pathway. Blood. 2000;96:4319–4327. | |
Vega F, Medeiros LJ, Leventaki V, et al. Activation of mammalian target of rapamycin signaling pathway contributes to tumor cell survival in anaplastic lymphoma kinase-positive anaplastic large cell lymphoma. Cancer Res. 2006;66:6589–6597. | |
Manning BD, Cantley LC. AKT/PKB signaling: navigating downstream. Cell. 2007;129:1261–1274. | |
Vu C, Fruman D. Target of rapamycin signaling in leukemia and lymphoma. Clin Cancer Res. 2010;16:5374–5380. | |
Markman B, Dienstmann R, Tabernero J. Targeting the PI3K/Akt/mTOR pathway-beyond rapalogs. Oncotarget. 2010;1:530–543. | |
Walsh K, McKinney MS, Love C, et al. PAK1 mediates resistance to PI3K inhibition in lymphomas. Clin Cancer Res. 2013;19:1106–1115. | |
Juweid ME, Stroobants S, Hoekstra OS, et al. Use of positron emission tomography for response assessment of lymphoma: consensus of the Imaging Subcommittee of International Harmonization Project in Lymphoma. J Clin Oncol. 2007;25:571–578. | |
Moskowitz CH, Schöder H, Teruya-Feldstein J, et al. Risk-adapted dose-dense immunochemotherapy determined by interim FDG-PET in Advanced-stage diffuse large B-Cell lymphoma. J Clin Oncol. 2010;28:1896–1903. | |
Pregno P, Chiappella A, Bellò M, et al. Interim 18-FDG-PET/CT failed to predict the outcome in diffuse large B-cell lymphoma patients treated at the diagnosis with rituximab-CHOP. Blood. 2012;119:2066–2073. | |
Casasnovas RO, Meignan M, Berriolo-Riedinger A, et al. SUVmax reduction improves early prognosis value of interim positron emission tomography scans in diffuse large B-cell lymphoma. Blood. 2011;118:37–43. | |
Kazama T, Faria SC, Varavithya V, Phongkitkarun S, Ito H, Macapinlac HA. FDG PET in the evaluation of treatment for lymphoma: clinical usefulness and pitfalls. Radiographics. 2005;25:191–207. | |
Shields AF, Grierson JR, Dohmen BM, et al. Imaging proliferation in vivo with [F-18]FLT and positron emission tomography. Nat Med. 1998;4:1334–1336. | |
Buck AK, Bommer M, Stilgenbauer S, et al. Molecular imaging of proliferation in malignant lymphoma. Cancer Res. 2006;66:11055–11061. | |
Wagner M, Seitz U, Buck A, et al. 3′-[18F]fluoro-3′-deoxythymidine ([18F]-FLT) as positron emission tomography tracer for imaging proliferation in a murine B-Cell lymphoma model and in the human disease. Cancer Res. 2003;63:2681–2687. | |
Herrmann K, Wieder HA, Buck AK, et al. Early response assessment using 3′-deoxy-3′-[18F]fluorothymidine-positron emission tomography in high-grade non-Hodgkin’s lymphoma. Clin Cancer Res. 2007;13:3552–3558. | |
Graf N, Herrmann K, den Hollander J, et al. Imaging proliferation to monitor early response of lymphoma to cytotoxic treatment. Mol Imaging Biol. 2008;10:349–355. | |
Li Z, Graf N, Herrmann K, et al. FLT-PET is superior to FDG-PET for very early response prediction in NPM-ALK-positive lymphoma treated with targeted therapy. Cancer Res. 2012;72:5014–5024. | |
Graf N, Herrmann K, Numberger B, et al. [18F]FLT is superior to [18F]FDG for predicting early response to antiproliferative treatment in high-grade lymphoma in a dose-dependent manner. Eur J Nucl Med Mol Imaging. 2013;40:34–43. | |
Machulla HJ, Blocher A, Kuntzsch M, Piert M, Wei R, Grierson J. Simplified labeling approach for synthesizing 3-deoxy-3[18F]fluorothymidine ([18F] FLT). Journal of Radioanalytical and Nuclear Chemistry. 2000;243:843–846. | |
Chang KY, Tsai SY, Wu CM, Yen CJ, Chuang BF, Chang JY. Novel phosphoinositide 3-kinase/mTOR dual inhibitor, NVP-BGT226, displays potent growth-inhibitory activity against human head and neck cancer cells in vitro and in vivo. Clin Cancer Res. 2011;17:7116–7126. | |
Fuereder T, Wanek T, Pflegerl P, et al. Gastric cancer growth control by BEZ235 in vivo does not correlate with PI3K/mTOR target inhibition but with [18F]FLT uptake. Clin Cancer Res. 2011;17:5322–5332. | |
Kampa-Schittenhelm KM, Heinrich MC, Akmut F, et al. Cell cycle-dependent activity of the novel dual PI3K-MTORC1/2 inhibitor NVP-BGT226 in acute leukemia. Mol Cancer. 2013;12:46. | |
Markman B, Tabernero J, Krop I, et al. Phase I safety, pharmacokinetic, and pharmacodynamic study of the oral phosphatidylinositol-3-kinase and mTOR inhibitor BGT226 in patients with advanced solid tumors. Ann Oncol. 2012;23:2399–2408. | |
Burris H, Rodon J, Sharma S, et al. First-in-human phase I study of the oral PI3K inhibitor BEZ235 in patients (pts) with advanced solid tumors. J Clin Oncol. 2010;28 Suppl:3005. | |
Dolly S, Wagner AJ, Bendell JC, et al. A first-in-human, phase l study to evaluate the dual PI3K/mTOR inhibitor GDC-0980 administered QD in patients with advanced solid tumors or non-Hodgkin’s lymphoma. J Clin Oncol. 2010;28 Suppl:3079. | |
Baumann P, Schneider L, Mandl-Weber S, Oduncu F, Schmidmaier R. Simultaneous targeting of PI3K and mTOR with NVP-BGT226 is highly effective in multiple myeloma. Anticancer Drugs. 2012;23:131–138. | |
Turturro F, Frist AY, Arnold MD, Seth P, Pulford K. Biochemical differences between SUDHL-1 and Karpas299 cells derived from t(2;5)-positive anaplastic large cell lymphoma are responsible for the different sensitivity to the antiproliferative effect of p27kip1. Oncogene. 2001;20:4466–4475. | |
Brepoels L, Stroobants S, Verhoef G, De Groot T, Mortelmans L, De Wolf-Peeters C. (18)F-FDG and (18)F-FLT uptake early after cyclophosphamide and mTOR inhibition in an experimental lymphoma model. J Nucl Med. 2009;50:1102–1109. | |
Saint-Hubert MD, Brepoels L, Devos E, et al. Molecular imaging of therapy response with (18)F-FLT and (18)F-FDG following cyclophosphamide and mTOR inhibition. Am J Nucl Med Mol Imaging. 2012;2:110–121. | |
McKinley ET, Ayers GD, Smith RA, et al. Limits of [18F]-FLT PET as a biomarker of proliferation in oncology. PLoS One. 2013;8:e5893. | |
Zhang CC, Yan Z, Li W, et al. [(18)F]FLT-PET imaging does not always “light up” proliferating tumor cells. Clin Cancer Res. 2012;18:1303–1312. | |
Moroz MA, Kochetkov T, Cai S, et al. Imaging colon cancer response following treatment with AZD1152: a preclinical analysis of [18F]fluoro-2-deoxyglucose and 3′-deoxy-3′-[18F]fluorothymidine imaging. Clin Cancer Res. 2011;17:1099–1110. | |
Fokas E, Yoshimura M, Prevo R, et al. NVP-BEZ235 and NVP-BGT226, dual phosphatidylinositol 3-kinase/mammalian target of rapamycin inhibitors, enhance tumor and endothelial cell radiosensitivity. Radiat Oncol. 2012;7:48. | |
Ma WW, Jacene H, Song D, et al. [18F]fluorodeoxyglucose positron emission tomography correlates with Akt pathway activity but is not predictive of clinical outcome during mTOR inhibitor therapy. J Clin Oncol. 2009;27:2697–2704. | |
Jensen MM, Erichsen KD, Björkling F, et al. Early detection of response to experimental chemotherapeutic Top216 with [18F]FLT and [18F]FDG PET in human ovary cancer xenografts in mice. PLoS One. 2010;5:e12965. | |
Aloj L, Caracó C, Jagoda E, Eckelman WC, Neumann RD. Glut-1 and hexokinase expression: relationship with 2-fluoro-2-deoxy-D-glucose uptake in A431 and T47D cells in culture. Cancer Res. 1999;59:4709–4714. |
 © 2014 The Author(s). This work is published and licensed by Dove Medical Press Limited. The full terms of this license are available at https://www.dovepress.com/terms.php and incorporate the Creative Commons Attribution - Non Commercial (unported, v3.0) License.
By accessing the work you hereby accept the Terms. Non-commercial uses of the work are permitted without any further permission from Dove Medical Press Limited, provided the work is properly attributed. For permission for commercial use of this work, please see paragraphs 4.2 and 5 of our Terms.
© 2014 The Author(s). This work is published and licensed by Dove Medical Press Limited. The full terms of this license are available at https://www.dovepress.com/terms.php and incorporate the Creative Commons Attribution - Non Commercial (unported, v3.0) License.
By accessing the work you hereby accept the Terms. Non-commercial uses of the work are permitted without any further permission from Dove Medical Press Limited, provided the work is properly attributed. For permission for commercial use of this work, please see paragraphs 4.2 and 5 of our Terms.