")
Back to Journals » International Journal of Chronic Obstructive Pulmonary Disease » Volume 12
Positive correlation of airway resistance and serum asymmetric dimethylarginine level in COPD patients with systemic markers of low-grade inflammation
Authors Tajti G, Gesztelyi R , Pak K, Papp C, Keki S, Szilasi ME, Mikaczo A , Fodor A, Szilasi M, Zsuga J
Received 11 November 2016
Accepted for publication 16 January 2017
Published 14 March 2017 Volume 2017:12 Pages 873—884
DOI https://doi.org/10.2147/COPD.S127373
Checked for plagiarism Yes
Review by Single anonymous peer review
Peer reviewer comments 2
Editor who approved publication: Dr Richard Russell
Gabor Tajti,1,2 Rudolf Gesztelyi,3 Krisztian Pak,3 Csaba Papp,1 Sandor Keki,4 Magdolna Emma Szilasi,2 Angela Mikaczo,2 Andrea Fodor,2 Maria Szilasi,2 Judit Zsuga1
1Department of Health Systems Management and Quality Management for Health Care, Faculty of Public Health, 2Department of Pulmonology, Faculty of Medicine, 3Department of Pharmacology and Pharmacotherapy, Faculty of Medicine, 4Department of Applied Chemistry, Faculty of Science and Technology, University of Debrecen, Debrecen, Hungary
Abstract: The major feature of COPD is a progressive airflow limitation caused by chronic airway inflammation and consequent airway remodeling. Modified arginase and nitric oxide synthase (NOS) pathways are presumed to contribute to the inflammation and fibrosis. Asymmetric dimethylarginine (ADMA) may shunt L-arginine from the NOS pathway to the arginase one by uncoupling and competitive inhibition of NOS and by enhancing arginase activity. To attest the interplay of these pathways, the relationship between ADMA and airflow limitation, described by airway resistance (Raw), was investigated in a cohort of COPD patients. Every COPD patient willing to give consent to participate (n=74) was included. Case history, laboratory parameters, serum arginine and ADMA, pulmonary function (whole-body plethysmography), and disease-specific quality of life (St George’s Respiratory Questionnaire) were determined. Multiple linear regression was used to identify independent determinants of Raw. The final multiple model was stratified based on symptom control. The log Raw showed significant positive correlation with log ADMA in the whole sample (Pearson’s correlation coefficient: 0.25, P=0.03). This association remained significant after adjusting for confounders in the whole data set (β: 0.42; confidence interval [CI]: 0.06, 0.77; P=0.022) and in the worse-controlled stratum (β: 0.84; CI: 0.25, 1.43; P=0.007). Percent predicted value of forced expiratory flow between 25% and 75% of forced vital capacity showed that significant negative, elevated C-reactive protein exhibited significant positive relationship with Raw in the final model. Positive correlation of Raw with ADMA in COPD patients showing evidence of a systemic low-grade inflammation implies that ADMA contributes to the progression of COPD, probably by shunting L-arginine from the NOS pathway to the arginase one.
Keywords: ADMA, airway resistance, nitric oxide, SGRQ, whole-body plethysmography
Introduction
COPD is projected to become the third most common cause of death and the seventh leading cause of disability-adjusted life years by 2030.1 Furthermore, COPD poses great direct economic burden, as 3.36% of total health care budget is estimated to be allocated for covering the direct costs of COPD management.2 Despite immense efforts, the complex pathological mechanisms underlying COPD are incompletely understood yet.
The key symptom of COPD is a persistent airflow limitation that progresses over time paralleled by prolonged and abortive inflammatory response in the airways given inhaled irritant particles (eg, smoke)3 and low-grade systemic inflammation.4 Chronic inflammation causes oxidative stress and mostly irreversible structural changes manifested in emphysema and small airway fibrosis,5 both of which lead to persistent and progressive lower airway obstruction, the cause of airflow limitation (and consequent hypoxia).6 This altered tissue microenvironment enhances the metabolism of extracellular matrix components such as collagen. Given its high turnover, even small changes in collagen production may cause significant collagen accumulation.3
Modified arginase and nitric oxide synthase (NOS) pathways may contribute to the increased collagen formation and fibrosis in COPD (Figure 1). Expression of both arginase and inducible NOS (iNOS) was shown to be increased in COPD. Arginase inhibition was reported to prevent airway inflammation and remodeling in animal models of COPD.7 Accordingly, arginase activity exhibited significant negative correlation with spirometry parameters descriptive of airway flow (pre- and post-bronchodilator forced expiratory volume in 1 s as a percent of predicted value [FEV1% pred]).8
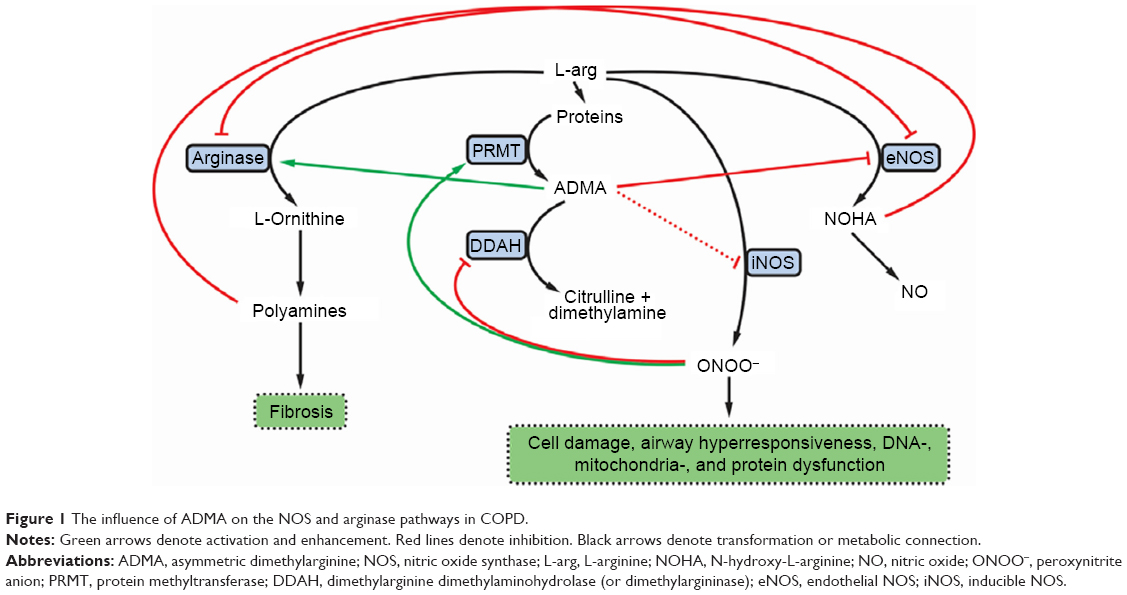 | Figure 1 The influence of ADMA on the NOS and arginase pathways in COPD. |
Asymmetric dimethylarginine (ADMA), an end product of degradation of methylated nuclear proteins, has diverse effects influential of the arginase and NOS pathways. ADMA has been shown to shunt L-arginine away from the NOS pathway toward the arginase path. In addition, ADMA induces uncoupling of NOS. The uncoupled NOS transfers electrons to ferrous-dioxygen, which eventually results in the formation of reactive oxygen and nitrogen species.9,10 Previously, increased production of these reactive agents in response to ADMA was demonstrated in airway epithelium.11 ADMA, administered in vitro, was reported to increase oxidative stress and induce apoptosis.12 In addition, ADMA competitively inhibits NOS, thus limiting nitric oxide (NO) liberation. This latter effect is more pronounced for the constitutive isoforms, the endothelial and neuronal NOSs (eNOS and nNOS, respectively), than for iNOS, an effect reflected by a weak iNOS inhibition in cytokine-stimulated lung epithelial cells.13 Furthermore, ADMA was reported to enhance arginase activity and consequent collagen formation in lung fibroblasts. Moreover, ADMA infusion significantly increased airway resistance (Raw) and diminished dynamic compliance in response to methacholine in a murine model.14 The reciprocal regulation of arginase and NOS12 is further augmented by the interplay of intermediary products of these pathways: spermine, a byproduct of the arginase path, inhibits NOS,8 and N-hydroxy-L-arginine, a metabolite in the NOS pathway, blunts the arginase enzyme (Figure 1).15
Starting from the above-mentioned complex interactions among pathways, we set out to investigate the relationship between ADMA and airflow limitation described by Raw in a cohort of COPD patients.
Methods
Study design and protocol
The present study was planned in line with the STROBE statement for cross-sectional studies16 and was approved by the Ethical Committee of the University of Debrecen (DEOEC RKEB/IKEB 3632-2012). Informed consent was obtained from each participant. The investigation conforms to the principles outlined in the Declaration of Helsinki.
The current study is based on an investigation of patients who attended the outpatient unit of the Department of Pulmonology (University of Debrecen) between September 1, 2012 and October 15, 2013 for the management of any of the following chronic inflammatory airway diseases: bronchial asthma (BA), COPD, asthma–COPD overlap syndrome (ACOS), and allergic rhinitis (AR). All patients who did not have any acute inflammatory disease over the preceding 1 month and either benign or malignant tumors in the history were invited to participate in the study. Overall, 319 patients were recruited (BA: n=167, COPD: n=74, ACOS: n=21, and AR: n=56).
For the present study, data of patients who were treated for COPD (n=74) were analyzed. At the time of recruitment, patients were already diagnosed with COPD and were managed according to the relevant Hungarian practice guideline17 and the Global initiative for chronic Obstructive Lung Disease (GOLD).18 Airway limitation was defined using the lower limit of normal.19–21 Patients received therapy at the time of inclusion as clinically warranted. Whole-body plethysmography was performed for every patient to determine lung function parameters including Raw, which was selected as the main outcome measure. Raw is reflective of alterations in alveolar pressure over changes in flow and is highly dependent on state of airways, and thus, it is an optimal parameter for the quantification of airflow limitation.22 Demographic, anthropometric, anamnestic, laboratory, and quality-of-life data were also acquired. Cumulative measure of smoking exposure was described by pack-years (accounted for both past and current smoking exposure). To assess disease-specific quality of life, the official Hungarian version of St George’s Respiratory Questionnaire (SGRQ)23 was used with the permission of the proprietor (Paul Jones, University of London, London, UK).
Pulmonary function testing
Whole-body plethysmography was performed according to the American Thoracic Society/European Respiratory Society criteria24,25 with Piston whole-body plethysmograph (PDT-111/p; Piston Medical, Budapest, Hungary) equipped with automatic body temperature- and pressure-saturated correction for cabin temperature, humidity, and pressure and with full automatic calibration and leakage test. Patients were directed to take their usual medication on the morning of their examination, so plethysmography was performed while patients were receiving long-term therapy for COPD. The best of three technically sound maneuvers was selected for each participant. Regarding resistance curves, at least two separate and technically appropriate measurements were performed (each measurement consisted of recordings of at least five resistance loops), and results were accepted only if these were the same for both measurements. Lung function data and, if algorithms of the manufacturer were available, percent predicted of normal reference values were obtained: Raw, airway conductance (Gaw = 1/Raw), FEV1% pred, forced vital capacity as a percent of predicted value (FVC% pred), ratio of FEV1 to FVC (FEV1/FVC = FEV1% = Tiffeneau index), forced expiratory flow between 25% and 75% of FVC as a percent of predicted value (FEF25–75%% pred), residual volume as a percent of predicted value (RV% pred), total lung capacity as a percent of predicted value (TLC% pred), ratio of RV to TLC as a percent of predicted value (RV/TLC% pred), ratio of inspiratory capacity to TLC (IC/TLC), inspiratory vital capacity as a percent of predicted value (IVC% pred), ratio of FEV1 to IVC as a percent of predicted value (FEV1/IVC% pred), thoracic gas volume as a percent of predicted value (TGV% pred), peak expiratory flow as a percent of predicted value (PEF% pred), maximal expiratory flow at 50% of FVC as a percent of predicted value (MEF50%% pred). Parameters showing Gaussian distribution were used in their raw forms, whereas those not normally distributed were appropriately transformed to obtain normal distribution.
Blood samples
After an overnight fast, blood samples were drawn on the morning of the examination. Routine laboratory investigations were done according to the standard clinical practice of the Department of Laboratory Medicine (University of Debrecen). Serum or plasma samples were used for determining measures descriptive of carbohydrate homeostasis (glucose, insulin, hemoglobin A1c [HgA1c]), lipid homeostasis (total cholesterol, triglyceride, low-density lipoprotein [LDL]-cholesterol, high-density lipoprotein [HDL]-cholesterol, lipoprotein(a), apolipoprotein A1 [ApoA1], apolipoprotein B [ApoB]), metabolism of L-arginine (folic acid, vitamin B12, urea), kidney function (glomerular filtration rate, urea, creatinine), liver function (glutamate–oxaloacetate transaminase, glutamate–pyruvate transaminase, gamma-glutamyltransferase), status of skeletal muscles (creatine kinase [CK], lactate dehydrogenase), and systemic inflammation (C-reactive protein [CRP], procalcitonin, fibrinogen). In addition to the use of serum CRP concentration, patients were dichotomized as having high vs normal CRP level with the cutoff being 4.6 mg/L and 5.2 mg/L for female and male patients, respectively (these are the reference values used in routine clinical practice by the Department of Laboratory Medicine, University of Debrecen). Serum samples used to determine L-arginine, ADMA, and symmetric dimethylarginine (SDMA) were frozen within 60 min and stored at −80°C until further analysis.
Determination of ADMA and other arginine derivatives
Arginine and its derivatives were measured as previously.26,27 Briefly, 250 μL of serum was mixed with the internal standard (50 μL of 1,000 μmol/L L-homoarginine hydrochloride from Sigma-Aldrich Co., St Louis, MO, USA) and borate buffer (700 μL, pH 9.0). This mixture was passed through solid-phase extraction cartridges (OASIS MCX 3cc) applying a 12-column manifold (J.T. Baker, Phillipsburg, NJ, USA). After successive washing with borate buffer (pH 9.0), deionized water, and methanol (Scharlau, Sentmenat, Spain), the sample (containing the arginine derivatives) was eluted with 1 mL of ammonia–water–methanol solution (10/40/50, v/v/v) (Reanal, Budapest, Hungary). The solvent was evaporated in vacuum under nitrogen atmosphere to dryness at 60°C, and then the residue was dissolved in 200 μL of deionized water. This solution was used for derivatization.
For derivatization, the sample (200 μL) was mixed with 63 μL of ortho-phthaldialdehyde/3-mercaptopropionic acid fluorescent reagent solution, incubated at 22°C for 10 min, and then kept at 5°C until the measurements. Chromatographic system of a Waters 2695 Separations Module equipped with thermostable autosampler (5°C) and column module (35°C), a Waters 2745 Fluorescence Detector (Waters, Milford, MA, USA), and a C-18 (4.6×150 mm, 3.5 μm) column were used for analysis. A sample (10 μL) was injected into the chromatographic system. Gradient elution at 1 mL/min flow rate was applied using mobile phase A (20 mmol/L of (NH4)2CO3 in water, pH adjusted to 7.5±0.05 with formic acid) and mobile phase B (acetonitrile). The gradient condition was as follows: 0–13 min: 91% A and 9% B; 13–15 min: linear change to 70% A and 30% B holding this setting for additional 5 min; and 20–20.1 min: linear change to 91% A and 9% B holding this for 35 min.
Analytes were detected at λex=337 nm, while λem=520 nm was used for arginine and homoarginine and λem=454 nm for ADMA and SDMA.
St George’s Respiratory Questionnaire
The official Hungarian version of SGRQ, validated for a 1-month recall period reflective of the patients’ recollection of their symptoms, was used according to the SGRQ manual supplied by the proprietor.28 SGRQ quantifies health impairment with three component scores and one total score. The Symptoms score describes the effect, frequency, and severity of respiratory symptoms based on the patients’ perception of their recent respiratory problems; Activity score quantifies the impairment in the daily physical activity; Impacts score includes a wide array of disturbances related to the psychosocial function; and the Total score sums up the significance of the disease on overall health status. All scores are expressed as a percentage, with 100% representing the worst and 0% indicating the best subjective health status. Differences in scores were considered clinically meaningful if they exceeded 4% points.29 The questionnaire was self-administered under supervision. Data entry was performed by two independent raters who diligently followed the data entry guidelines. Interrater variability assessed by Spearman’s correlation was 0.99 (P<0.001), 0.988 (P<0.001), 0.999 (P<0.001), and 0.999 (P<0.001) for the Symptoms, Activity, Impacts, and Total scores, respectively. The mean of scores provided by the two raters was used for statistical analysis.
To assess the extent of symptom control, data were dichotomized with respect to the Symptoms score component. Patients with a Symptoms score <32.66% were put in the better-controlled group, while patients with a Symptoms score ≥32.66% formed the worse-controlled group (32.66% was the median Symptoms score of the whole cohort). This dichotomization was used for stratification of the final multiple regression model.
Statistical analysis
Normality of continuous variables was checked by the Shapiro–Wilk test. In case of Gaussian distribution, Student’s t-test was used for the comparison of two data sets; if not, Mann–Whitney U test was carried out. Frequencies were compared using Pearson’s χ2 test.
Demographic, anthropometric, anamnestic, laboratory, and SGRQ data were divided into two groups with lower and higher Raw (using the median value of Raw as a cutoff level) for comparison. Thus, patients with Raw<0.27 kPa·s/L formed the lower Raw group (n=34), while the higher Raw group (n=40) contained patients with Raw≥0.27 kPa·s/L. In addition, demographic, anthropometric, pulmonary function, and SGRQ data were compared in terms of symptom control achieved in our cohort (herein n=73; SGRQ data were missing for one patient). Dichotomy of patients based on the median of Symptoms scores as a cutoff level provided a better-controlled (<32.66) group (n=37) and a worse-controlled (≥32.66) one (n=36) (loss of one patient in this approach was due to the lack of the SGRQ result for this patient).
The relationship between Raw and serum ADMA level was investigated with Pearson’s correlation as well as with simple and multiple linear regression. To ensure normal distribution of variables for these analyses, CK, total cholesterol, LDL-cholesterol, HDL-cholesterol, ApoA1, ApoB, insulin, HgA1c, folate, thyroid-stimulating hormone (sensitive), ADMA, homeostatic model assessment index, Raw, FEF25–75%, RV, and RV% pred were log-transformed, and reciprocal of square of glucose concentration was computed.
To identify determinants of Raw as well as ADMA, simple linear regression was carried out including traditional confounding factors (age, gender, height, disease duration in years), lung function parameters, laboratory parameters characteristic of carbohydrate, lipid, and arginine homeostasis, hepatic, kidney, and skeletal muscle function, and furthermore, systemic markers of inflammation. Missing data were omitted. Then, in order to eliminate effects of potential confounders, multiple linear regression modeling was performed including all significant regressors determined with the simple linear regression as well as age and gender (as a priori variables). Inclusion of the defined daily dose of steroids into the initial model should be noted. Variables were introduced into the initial multiple model simultaneously, and then factors not contributing significantly to the model were deleted. In addition, the final model was stratified with respect to the better or worse symptom control dichotomized by the median of Symptoms scores of SGRQ. Heteroskedasticity and goodness of fit for the model were assessed by Cook–Weisberg and Ramsey test.
Statistical analysis was performed with Stata 13.0 software (Stata Corporation). Values are given as mean ± standard deviation (SD) or median (with the interquartile range [IQR]), and regression coefficients are presented with their 95% confidence interval (CI).
Results
Patients
Of the 74 COPD patients involved in the present study, two were treatment-naïve at the time of inclusion. Overall, 64 patients received inhaled anticholinergics either alone (n=63) or in fixed combination with a beta adrenoceptor agonist (ipratropium with fenoterol) (n=6). Furthermore, 60 patients received inhaled corticosteroids in fixed combination with long-acting beta agonists. Overall, 24 patients received inhaled short-acting beta agonists, and three patients received inhaled long-acting beta agonists as a monotherapy. Other medications included oral use of methylxanthines (n=30) and montelukast (n=3).
Comparison of patients with lower and higher airflow resistance
The two groups, dichotomized with respect to the median of Raw values, were proved to be homogenous regarding most of the parameters investigated. However, the average of patient’s age was moderately higher, while the average of years of smoking, pack-years, and all SGRQ scores was substantially higher in the patient group with higher Raw. Nevertheless, there was no significant difference in the prevalence of smoking at the time of the investigation. The height of patients was slightly but statistically significantly smaller in the higher Raw group. Although the median of CRP level among patients with higher Raw was only on the verge of statistical significance (P=0.052), frequency of elevated CRP was significantly greater in the higher Raw group than in the lower Raw group (Table 1).
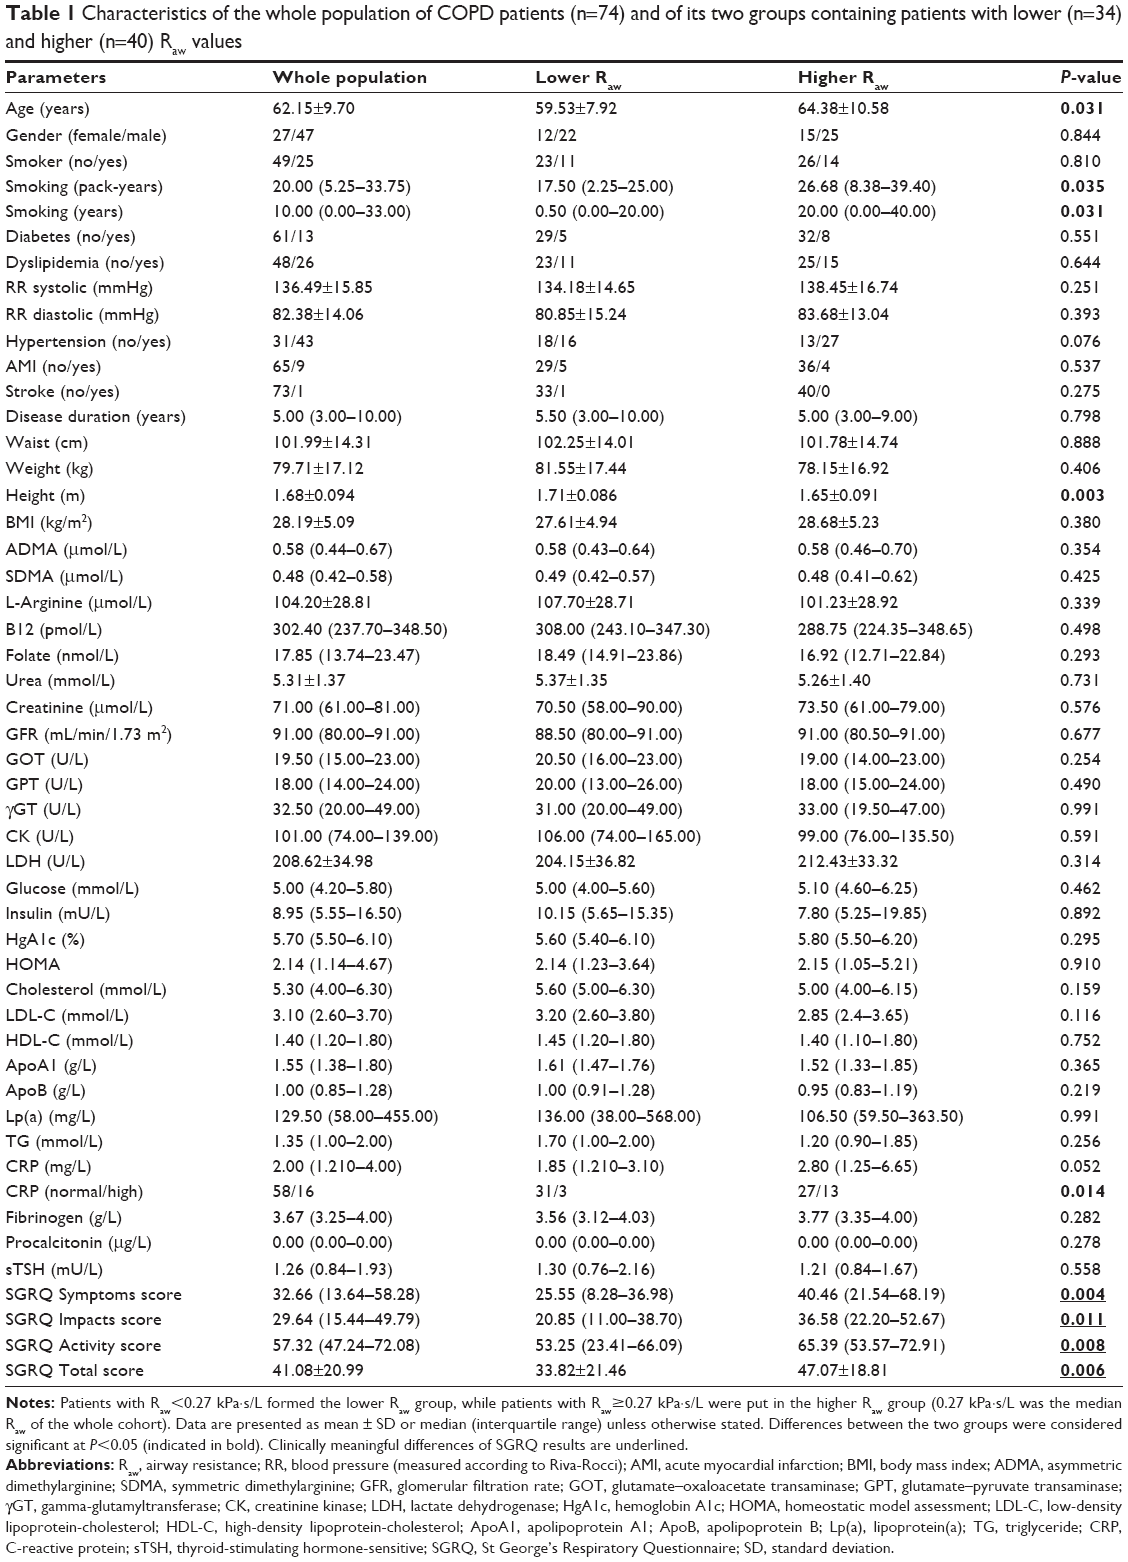 | Table 1 Characteristics of the whole population of COPD patients (n=74) and of its two groups containing patients with lower (n=34) and higher (n=40) Raw values |
Comparison of the better-controlled and worse-controlled patients
Demographic and anthropometric parameters did not differ significantly when the patient cohort was compared across level of disease control (better-controlled vs worse-controlled) (Table 2). Lung function parameters describing the flow in the airways and Gaw were significantly lower in the worse-controlled group. Consistent with this, TGV% pred, RV% pred, RV/TLC% pred, and Raw were significantly higher among patients in the worse-controlled group. All SGRQ scores were substantially higher in the worse-controlled group (showing greater health impairment and poorer quality of life) (Table 2).
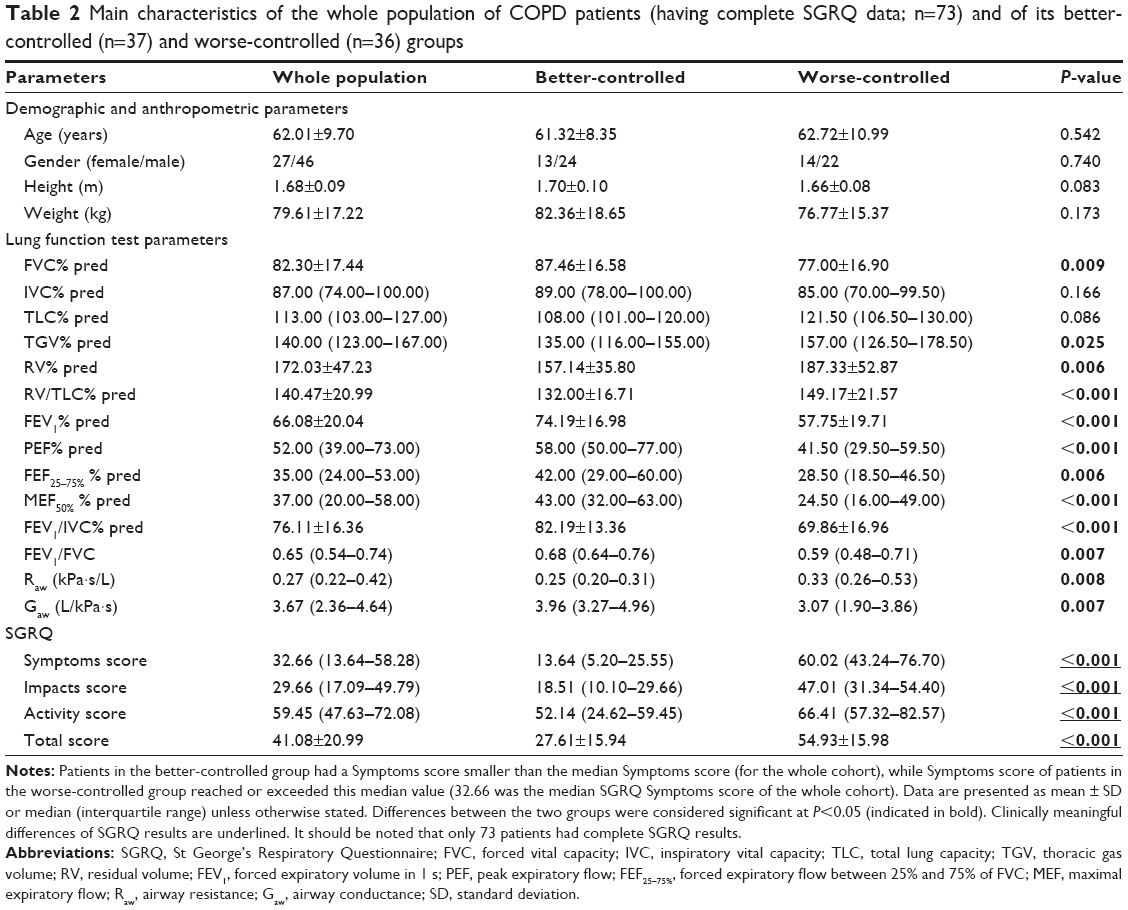 | Table 2 Main characteristics of the whole population of COPD patients (having complete SGRQ data; n=73) and of its better-controlled (n=37) and worse-controlled (n=36) groups |
Significant predictors of Raw and serum ADMA concentration
The median serum ADMA levels were practically the same in all patient groups, that is, 0.58 (IQR: 0.44–0.67) μmol/L, 0.58 (IQR: 0.43–0.64) μmol/L, and 0.58 (IQR: 0.46–0.7) μmol/L in the whole data set and in strata of patients with lower and higher Raw, respectively. Upon assessing the linear relationship between log Raw and log ADMA, we found significant positive correlation in the whole data set (Figure 2) and in the worse-controlled stratum (Pearson’s correlation coefficient: 0.25 and 0.35; P=0.03 and P=0.04, respectively). However, there was a considerably weaker and statistically nonsignificant correlation in the better-controlled stratum (Pearson’s correlation coefficient: 0.08, P=0.61).
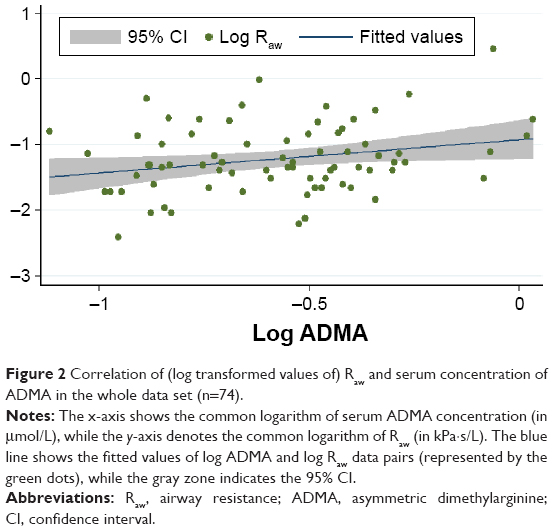 | Figure 2 Correlation of (log transformed values of) Raw and serum concentration of ADMA in the whole data set (n=74). |
In accordance with results of the correlation analysis, simple linear regression (used to identify factors significantly determining Raw as well as ADMA) revealed that log Raw and log ADMA are mutually significant predictors of each other (Table 3). After adjusting for all significant predictors and a priori determinants by means of multiple linear regression, the positive association between log Raw and log ADMA remained significant (β: 0.42; CI: 0.06, 0.77; P=0.022) (Table 3). This positive association of log Raw with log ADMA became even more pronounced in the worse-controlled stratum of COPD patients (β: 0.84; CI: 0.25, 1.43; P=0.007), while only a weak and statistically nonsignificant association was present in the better-controlled stratum (β: −0.17; CI: −0.61, 0.27; P=0.45). The Cook–Weisberg test showed no heteroskedasticity for the full model, the worse-controlled stratum, and the better-controlled stratum (P=0.18, P=0.74, and P=0.39, respectively). Furthermore, all three models showed good fit reflected by the locally weighted scatterplot smoothing (Figure 3) as well as by the Ramsey test (P=0.75, P=0.67, and P=0.15 for the whole data set, the worse-controlled stratum, and the better-controlled stratum, respectively).
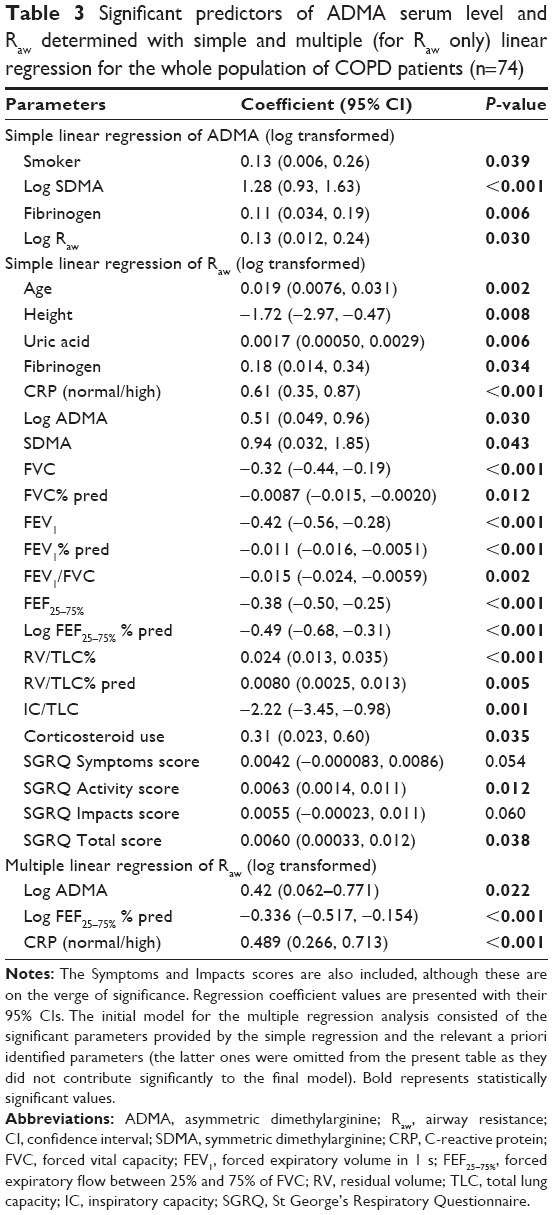 | Table 3 Significant predictors of ADMA serum level and Raw determined with simple and multiple (for Raw only) linear regression for the whole population of COPD patients (n=74) |
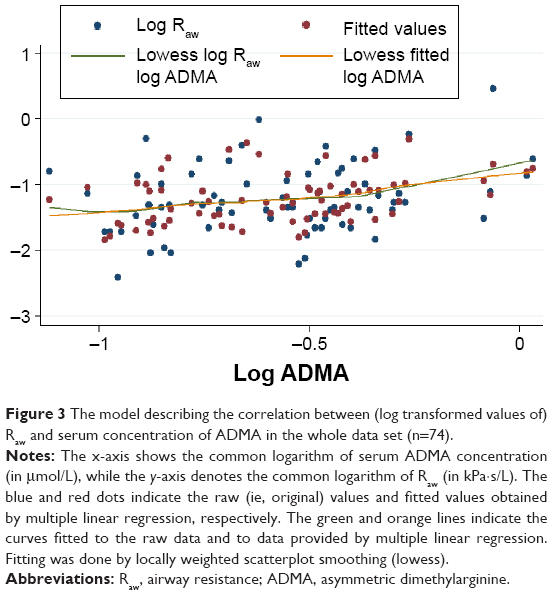 | Figure 3 The model describing the correlation between (log transformed values of) Raw and serum concentration of ADMA in the whole data set (n=74). |
In addition, the final multiple linear regression model (built for Raw) indicated that presence of elevated CRP confers significant impact on COPD (ie, elevated CRP is associated with higher Raw). We also found that log FEF25–75% % pred, the lung function parameter descriptive of small airway dysfunction, showed negative association with log Raw (β: −0.33; CI: −0.51, −0.15; P<0.001) (Table 3). Consistent with this latter finding, there was a strong significant positive correlation between log Gaw and log FEF25–75% % pred in the whole sample, in the worse-controlled stratum and in the better-controlled stratum too (Pearson’s correlation coefficient: 0.53, 0.40, and 0.57; P<0.001, P=0.017, and P<0.001, respectively).
Furthermore, all SGRQ scores (including the Total score) showed clinically meaningful differences with respect to the extent of airflow limitation (lower Raw group vs higher Raw group) as well as symptom control (worse-controlled stratum vs better-controlled stratum). Moreover, the Total score showed significant negative correlation with FEV1% pred (Pearson’s correlation coefficient: −0.43, P<0.001).
Discussion
The major finding of our study is that serum ADMA level of COPD patients shows significant positive correlation with airflow limitation indicated by Raw. Due to the numerous confounders, inherent of a clinically diverse population, multiple linear regression modeling was implemented. We found that the said strong positive correlation remained significant after the elimination of confounders. We identified two other influential parameters concerning airflow limitation: CRP, a serum marker of systemic inflammation, and FEF25–75% % pred, a dynamic pulmonary function parameter describing the function of small airways.30
CRP is an acute-phase reactant that is known as a stable biomarker for systemic inflammation.31 Analysis of the Lung Health Study with 4803 participants suffering from mild-to-moderate COPD concluded that serum CRP level is a significant predictor of future risk of death and cardiovascular events in COPD, and it affords additional information beyond knowledge provided by traditional measures such as FEV1 and smoking habits.32 The clinical relevance of elevated CRP is undisputed, with serum levels above 1 mg/L being indicative of increased cardiovascular risk in healthy individuals.31 In our patient cohort, the serum CRP level was an independent predictor of Raw, and it remained significant even after the multiple linear regression (Table 3). Moreover, CRP proved to be significant in both strata of multiple linear regression (ie, worse-controlled and better-controlled groups). These results underline the fundamental role of inflammation in the evolution of COPD. It is worthy to note that the effect of elevated CRP was not influenced by the use of corticosteroids which is reflected by the lack of contribution to the model, leading to the omission of corticosteroid use from the final multiple regression model (Table 3).
Involvement of small airways in COPD is a central phenomenon that is critical regarding the progression of this disease. Infiltration of the wall of small airways with immune cells produces inflammatory exudate and airway wall thickening called remodeling.33 Accordingly, our result that FEF25–75% % pred was a significant independent predictor of Raw (provided by both the simple and multiple linear regression; Table 3) reflects the strong involvement of the small airways in the evolution of airflow limitation in our COPD patient cohort. This finding corroborates the findings of others reporting that increase in resistance of small airways plays a significant role in airflow limitation developed in obstructive airway diseases.34
The major finding of the present study is that, in our cohort of COPD patients, there is a pronounced positive association between Raw and serum ADMA level (Table 3), the extent of which exhibits an inverse relationship with the level of symptom control (ie, a stronger positive relationship between Raw and ADMA accompanies with more severe symptoms according to the patient’s self-report). This result was presented by the final model of multiple regression, where data were stratified using the median of SGRQ Symptoms scores (containing information about the perception of symptoms over the preceding 4 weeks by quantifying responses with regard to wheezing, shortness of breath, sputum production, and exacerbations). During the analysis, the significant relationship between log Raw and log ADMA seen in the whole patient cohort became even stronger in the worse-controlled group of patients, while it became weaker and statistically nonsignificant in the better-controlled group. It may also be noted that, in agreement with prior reports,35,36 the Total score of SGRQ showed a strong negative relationship with FEV1%.
Based on the significant positive association between Raw and ADMA, as well as on the interaction between ADMA’s influence on Raw and disease severity, we propose that ADMA contributes to the progression of COPD by shunting L-arginine toward the arginase pathway, by inducing uncoupling and competitive inhibition of iNOS (activated by the inflammation) as well as eNOS and nNOS (being active constitutively). As a result, increased polyamine formation producing cellular proliferation and fibrosis ensues parallel to spermine’s inhibitory action of the constitutive NOS isoforms. The activity of uncoupled iNOS yields reactive agent formation that, in turn, has the propensity to induce expression of protein arginine methyltransferases (enzymes responsible for demethylation of L-arginine side chains in proteins) and to decrease the expression of dimethylarginine dimethylaminohydrolase (an enzyme responsible for ADMA degradation). These processes lead to a further increase of ADMA levels. Moreover, decrease of NO synthesis will lead to NO deficiency contributing to decreased mucociliary clearance and bactericidal activity, increased smooth muscle cell proliferation, and resultant increase of bronchial tone and hyperresponsiveness (Figure 1).3,8,37
Limited number of reports deal with the L-arginine–ADMA homeostasis in context of COPD. Nonetheless, the ADMA level in our cross-sectional study (0.58 [IQR: 0.44–0.66] μmol/L) is comparable with that found by others. In a recent study of elderly patients suffering from COPD, serum ADMA levels did not show significant alteration when compared with age- and gender-matched controls, as ADMA levels were 0.319±2.87 μmol/L and 0.318±0.389 μmol/L for COPD and control patients, respectively.4 Others reported somewhat higher ADMA levels in COPD (and ACOS): (0.70±0.35 μmol/L,38 0.766±0.01 μmol/L,3 and 0.63 [IQR: 0.57–0.72] μmol/L6). Results of the two latter patient groups were contrasted with serum ADMA levels of age-matched control groups (0.479±0.06 μmol/L3 and 0.41 [IQR: 0.38–0.46] μmol/L6). It may be argued that these systemic levels are in the range considered to be normal (0.4–1.0 μmol/L).3,4,6,8 Regardless, ADMA may assume central importance in the etiopathogenesis of COPD if one considers that serum ADMA levels may be considerably lower than the intracellular levels, while ADMA exerts its above-mentioned effects intracellularly. This assumption is corroborated by the finding that lung ADMA concentration is one of the highest in the body, and thus, it is likely that even a small increase in the systemic ADMA level reflects significant changes in the pulmonary compartment,39 leading to potentially deleterious effects in the airways and lung parenchyma.
Upon comparing these findings to the results obtained by analyzing the relationship between Raw and ADMA in a larger (n=154) cohort of BA patients (Tajti et al, unpublished data, 2017) receiving adequate asthma controller therapy, several conclusions may be drawn. Although the final multiple linear regression model did show significant correlation between Raw and ADMA, the correlation coefficient was considerably lower in the BA cohort (β: 0.22; CI: 0.054, 0.383; P=0.01) than in the COPD cohort (β: 0.42; CI: 0.06, 0.77; P=0.022). Moreover, the final model of BA patients did not contain CRP, a ubiquitous marker of inflammation. These findings apparently corroborate the previous proposition that the nature of inflammation differs in these two chronic inflammatory diseases which is reflected by a distinct cytokine profile.40 For example, enhanced activity of nuclear factor (NF)-κB, a corticosteroid-responsive transcriptional factor,41 was shown in BA.40 In COPD, however, although reports showed that the expression profile of NF-κB is altered, its resistance to inhaled corticosteroid therapy was also proposed.42 In the case of the BA patients receiving inhaled corticosteroids, we could not detect signs of systemic inflammation; that is CRP, fibrinogen, and procalcitonin levels were in the normal range (Tajti et al, unpublished data, 2017). To explain this finding, we presumed that inhibition of NF-κB expression with corticosteroid therapy suppressed the induction of iNOS and the consequent abundant peroxynitrite formation. Thus, the effect of ADMA on processes affecting Raw was limited to the inhibition of constitutive NOS isoforms that led to NO deficiency and an increased Raw. In COPD, however, we found evidence of a systemic low-grade inflammation that may induce iNOS in a manner independent of NF-κB activation (increase of interferon-γ is known in COPD, and it may induce iNOS by activating a distinct enhancer region)41 that leads to enhanced oxidative stress. The resulting peroxynitrite can further increase the activity of arginase43,44 that impairs the balance of arginase and NOS pathways as reported by others (Figure 1).6,14 These synergistic processes present in COPD all contribute to the evolution of pulmonary inflammation, oxidative stress, airway remodeling, and consequent airflow limitation. This may possibly be reflected by the more pronounced relationship between Raw and ADMA.
A possible limitation of the present study is stemming from its cross-sectional design that inherently limits the possibility to draw cause-and-effect conclusions. Meticulous care was taken to overcome this shortcoming by collecting information regarding the possible confounders and using multiple linear regression to correct for them. Lack of post-bronchodilator whole-body plethysmography may be further considered as a shortcoming. Nevertheless, this patient population was enrolled in a COPD management program for a median of 5 (IQR: 3–10) years. Accordingly, all patients were receiving some form of bronchodilator therapy and were instructed to take their medications as usual on the morning of the examinations. Therefore, these results should be interpreted as on-treatment result. Furthermore, the current study does not have the means to offer a comprehensive overview of relevant biochemical properties and regulatory processes related to the NOS and arginase pathways of L-arginine. Starting from this, further prospective studies are needed to corroborate the hypothetical notions made based on the results of our current study. Nevertheless, this investigation has several merits like the relatively large clinical patient sample, the use of special tools (whole-body plethysmography enabling direct assessment of Raw, and SGRQ, a validated disease-specific questionnaire), and furthermore, the stringent data analysis resulting in powerful findings.
Conclusion
We found a significant positive linear relationship between Raw and ADMA in a cohort of COPD patients who had evidence of a persistent low-grade systemic inflammation. The strong correlation between Raw and ADMA was even more explicit in the group experiencing worse COPD control leading to more severe symptoms. Based on our results, we proposed that ADMA influences the evolution and progression of COPD. Mechanisms of ADMA’s effect on Raw in COPD may consist of an increase in oxidative stress mediated by products of uncoupled NOS (especially iNOS upregulated by inflammation), by NO deficiency resulting from a competitive inhibition of NOS, and by an increase of arginase activity leading to fibrosis and airway remodeling.
Acknowledgments
This study was supported by the University of Debrecen, TÁMOP 4.2.4.A/2-11-1-2012-0001, TÁMOP-4.2.2.A-11/1/KONV-2012-0045, Scientific Research Grant of the Hungarian Foundation for Pulmonology (awarded in 2015), and Hungarian Brain Research Program (KTIA_13_NAP-A-V/2).
Disclosure
The authors report no conflicts of interest in this work.
References
Mathers CD, Loncar D. Projections of global mortality and burden of disease from 2002 to 2030. PLoS Med. 2006;3(11):e442. | ||
Loddenkemper R, Gibson GJ, Sibille Y; European Respiratory Society; European Lung Foundation. European Lung White Book: The First Comprehensive Survey on Respiratory Health in Europe. Sheffield: European Respiratory Society; 2003. | ||
Aydin M, Altintas N, Cem Mutlu L, et al. Asymmetric dimethylarginine contributes to airway nitric oxide deficiency in patients with COPD. Clin Respir J. Epub 2015 Jun 16. | ||
Costanzo L, Pedone C, Battistoni F, Chiurco D, Santangelo S, Antonelli-Incalzi R. Relationship between FEV1 and arterial stiffness in elderly people with chronic obstructive pulmonary disease. Aging Clin Exp Res. Epub 2016 Mar 21. | ||
Barnes PJ. Cellular and molecular mechanisms of chronic obstructive pulmonary disease. Clin Chest Med. 2014;35(1):71–86. | ||
Ruzsics I, Nagy L, Keki S, et al. L-arginine pathway in COPD patients with acute exacerbation: a new potential biomarker. COPD. 2016;13(2):139–145. | ||
Pera T, Zuidhof AB, Smit M, et al. Arginase inhibition prevents inflammation and remodeling in a guinea pig model of chronic obstructive pulmonary disease. J Pharmacol Exp Ther. 2014;349(2):229–238. | ||
Scott JA, Duongh M, Young AW, Subbarao P, Gauvreau GM, Grasemann H. Asymmetric dimethylarginine in chronic obstructive pulmonary disease (ADMA in COPD). Int J Mol Sci. 2014;15(4):6062–6071. | ||
Gielis JF, Lin JY, Wingler K, Van Schil PE, Schmidt HH, Moens AL. Pathogenetic role of eNOS uncoupling in cardiopulmonary disorders. Free Radic Biol Med. 2011;50(7):765–776. | ||
Ritz T, Trueba AF. Airway nitric oxide and psychological processes in asthma and health: a review. Ann Allergy Asthma Immunol. 2014;112(4):302–308. | ||
Wells SM, Holian A. Asymmetric dimethylarginine induces oxidative and nitrosative stress in murine lung epithelial cells. Am J Respir Cell Mol Biol. 2007;36(5):520–528. | ||
Ahmad T, Mabalirajan U, Ghosh B, Agrawal A. Altered asymmetric dimethyl arginine metabolism in allergically inflamed mouse lungs. Am J Respir Cell Mol Biol. 2010;42(1):3–8. | ||
Klein E, Weigel J, Buford MC, Holian A, Wells SM. Asymmetric dimethylarginine potentiates lung inflammation in a mouse model of allergic asthma. Am J Physiol Lung Cell Mol Physiol. 2010;299(6):L816–L825. | ||
Wells SM, Buford MC, Migliaccio CT, Holian A. Elevated asymmetric dimethylarginine alters lung function and induces collagen deposition in mice. Am J Respir Cell Mol Biol. 2009;40(2):179–188. | ||
Reczkowski RS, Ash DE. Rat liver arginase: kinetic mechanism, alternate substrates, and inhibitors. Arch Biochem Biophys. 1994;312(1):31–37. | ||
von Elm E, Altman DG, Egger M, et al. The Strengthening the Reporting of Observational Studies in Epidemiology (STROBE) statement: guidelines for reporting observational studies. Prev Med. 2007;45(4):247–251. | ||
Kollégium TS. Az Egészségügyi Minisztérium szakmai irányelve a krónikus obstruktiv légúti betegség (chronic obstructive pulmonary disease – COPD) diagnosztikájáról és kezeléséről (1. módosított változat) [Clinical practice guidelines of the Ministry of Health on diagnosis and management of chronic obstructive pulmonary disease (COPD) (first modified version)]. Magyar Közlöny. 2009;21:3661–3692. Hungarian. | ||
Vestbo J, Hurd SS, Agustí AG, et al. Global strategy for the diagnosis, management, and prevention of chronic obstructive pulmonary disease: GOLD executive summary. Am J Respir Crit Care Med. 2013;187(4):347–365. | ||
Celli BR, MacNee W; ATS/ERS Task Force. Standards for the diagnosis and treatment of patients with COPD: a summary of the ATS/ERS position paper. Eur Respir J. 2004;23(6):932–946. | ||
Swanney MP, Ruppel G, Enright PL, et al. Using the lower limit of normal for the FEV1/FVC ratio reduces the misclassification of airway obstruction. Thorax. 2008;63(12):1046–1051. | ||
Nathell L, Nathell M, Malmberg P, Larsson K. COPD diagnosis related to different guidelines and spirometry techniques. Respir Res. 2007;8:89. | ||
Topalovic M, Derom E, Osadnik CR, Troosters T, Decramer M, Janssens W; Belgian Pulmonary Function Study Investigators. Airways resistance and specific conductance for the diagnosis of obstructive airways diseases. Respir Res. 2015;16:88. | ||
Meguro M, Barley EA, Spencer S, Jones PW. Development and validation of an improved, COPD-specific version of the St George Respiratory Questionnaire. Chest. 2007;132(2):456–463. | ||
Miller MR, Hankinson J, Brusasco V, et al; ATS/ERS Task Force. Standardisation of spirometry. Eur Respir J. 2005;26(2):319–338. | ||
Wanger J, Clausen JL, Coates A, et al. Standardisation of the measurement of lung volumes. Eur Respir J. 2005;26(3):511–522. | ||
Zsuga J, Torok J, Magyar MT, et al. Serum asymmetric dimethylarginine negatively correlates with intima-media thickness in early-onset atherosclerosis. Cerebrovasc Dis. 2007;23(5–6):388–394. | ||
Zsuga J, Török J, Magyar MT, et al. Dimethylarginines at the crossroad of insulin resistance and atherosclerosis. Metabolism. 2007;56(3):394–399. | ||
Jones PW, Quirk FH, Baveystock CM. The St George’s respiratory questionnaire. Respir Med. 1991;85 Suppl B:25–31; discussion 33–37. | ||
Jones PW. St George’s respiratory questionnaire: MCID. COPD. 2005;2(1):75–79. | ||
Contoli M, Bousquet J, Fabbri L, et al. The small airways and distal lung compartment in asthma and COPD: a time for reappraisal. Allergy. 2010;65(2):141–151. | ||
Windgassen EB, Funtowicz L, Lunsford TN, Harris LA, Mulvagh SL. C-reactive protein and high-sensitivity C-reactive protein: an update for clinicians. Postgrad Med. 2011;123(1):114–119. | ||
Man SF, Connett JE, Anthonisen NR, Wise RA, Tashkin DP, Sin DD. C-reactive protein and mortality in mild to moderate chronic obstructive pulmonary disease. Thorax. 2006;61(10):849–853. | ||
Hogg JC, Chu F, Utokaparch S, et al. The nature of small-airway obstruction in chronic obstructive pulmonary disease. N Engl J Med. 2004;350(26):2645–2653. | ||
Sturton G, Persson C, Barnes PJ. Small airways: an important but neglected target in the treatment of obstructive airway diseases. Trends Pharmacol Sci. 2008;29(7):340–345. | ||
Ferrer M, Villasante C, Alonso J, et al. Interpretation of quality of life scores from the St George’s Respiratory Questionnaire. Eur Respir J. 2002;19(3):405–413. | ||
Stojkovic J, Stevcevska G. Quality of life, forced expiratory volume in one second and body mass index in patients with COPD, during therapy for controlling the disease. Prilozi. 2009;30(1):129–142. | ||
Maziak W, Loukides S, Culpitt S, Sullivan P, Kharitonov SA, Barnes PJ. Exhaled nitric oxide in chronic obstructive pulmonary disease. Am J Respir Crit Care Med. 1998;157(3 Pt 1):998–1002. | ||
Nural S, Günay E, Halici B, Celik S, Ünlü M. Inflammatory processes and effects of continuous positive airway pressure (CPAP) in overlap syndrome. Inflammation. 2013;36(1):66–74. | ||
Zakrzewicz D, Eickelberg O. From arginine methylation to ADMA: a novel mechanism with therapeutic potential in chronic lung diseases. BMC Pulm Med. 2009;9:5. | ||
Chung KF. Cytokines in chronic obstructive pulmonary disease. Eur Respir J Suppl. 2001;34:50s–59s. | ||
Ricciardolo FL, Nijkamp FP, Folkerts G. Nitric oxide synthase (NOS) as therapeutic target for asthma and chronic obstructive pulmonary disease. Curr Drug Targets. 2006;7(6):721–735. | ||
Hart LA, Krishnan VL, Adcock IM, Barnes PJ, Chung KF. Activation and localization of transcription factor, nuclear factor-kappaB, in asthma. Am J Respir Crit Care Med. 1998;158(5 Pt 1):1585–1592. | ||
Sankaralingam S, Xu H, Davidge ST. Arginase contributes to endothelial cell oxidative stress in response to plasma from women with preeclampsia. Cardiovasc Res. 2010;85(1):194–203. | ||
Chandra S, Romero MJ, Shatanawi A, Alkilany AM, Caldwell RB, Caldwell RW. Oxidative species increase arginase activity in endothelial cells through the RhoA/Rho kinase pathway. Br J Pharmacol. 2012;165(2):506–519. |
 © 2017 The Author(s). This work is published and licensed by Dove Medical Press Limited. The full terms of this license are available at https://www.dovepress.com/terms.php and incorporate the Creative Commons Attribution - Non Commercial (unported, v3.0) License.
By accessing the work you hereby accept the Terms. Non-commercial uses of the work are permitted without any further permission from Dove Medical Press Limited, provided the work is properly attributed. For permission for commercial use of this work, please see paragraphs 4.2 and 5 of our Terms.
© 2017 The Author(s). This work is published and licensed by Dove Medical Press Limited. The full terms of this license are available at https://www.dovepress.com/terms.php and incorporate the Creative Commons Attribution - Non Commercial (unported, v3.0) License.
By accessing the work you hereby accept the Terms. Non-commercial uses of the work are permitted without any further permission from Dove Medical Press Limited, provided the work is properly attributed. For permission for commercial use of this work, please see paragraphs 4.2 and 5 of our Terms.