")
Back to Journals » Journal of Pain Research » Volume 13
Population Pharmacokinetics of Tapentadol in Children from Birth to <18 Years Old
Authors Khalil F , Choi SL, Watson E , Tzschentke TM, Lefeber C , Eerdekens M , Freijer J
Received 26 June 2020
Accepted for publication 23 September 2020
Published 24 November 2020 Volume 2020:13 Pages 3107—3123
DOI https://doi.org/10.2147/JPR.S269549
Checked for plagiarism Yes
Review by Single anonymous peer review
Peer reviewer comments 3
Editor who approved publication: Dr Michael Schatman
Feras Khalil, Siak Leng Choi, Estelle Watson, Thomas M Tzschentke, Claudia Lefeber, Mariëlle Eerdekens, Jan Freijer
Grünenthal GmbH, Aachen, Germany
Correspondence: Feras Khalil
Grünenthal GmbH, Zieglerstraße 6, 52078 Aachen, Germany
Tel +49 241 569 3295
Email [email protected]
Objective: The main aim of this analysis was to characterize the pharmacokinetics (PK) of tapentadol in pediatric patients from birth to < 18 years old who experience acute pain, requiring treatment with an opioid analgesic.
Patients and Methods: Data from four clinical trials and 148 pediatric patients who received a single dose of tapentadol oral or intravenous solution were included. Population PK analysis was performed to determine the contribution of size-related (bodyweight) and function-related (maturation) factors to the changes in oral bioavailability (F), volume of distribution (V), and clearance (CL) with age. Simulations were carried out to compare pediatric exposures to reference adult values.
Results: A one-compartment model with allometric scaling on disposition parameters (using theoretical or estimated exponents) and maturation functions on CL and F best described tapentadol PK. The estimated allometric exponents for CL (0.603) and V (0.820) differed slightly from the theoretical values of 0.75 for CL and 1 for V. A maximum in CL/F was observed at about 2– 3 years when expressed on a bodyweight basis. Results for younger children as well as the F estimate were sensitive to the scaling approach, but CL/F and V/F as a function of age for the two scaling approaches led to similar curves within the bioequivalence range except below 5 weeks of age. Model-based simulations indicated that the doses used in the included clinical trials lead to exposures within the lower half of the targeted adult exposure.
Conclusion: The development of tapentadol is one of the first examples following a systematic approach for analgesic drug development for children. Our analysis enabled a full characterization and robust understanding of tapentadol PK in children from birth to < 18 years, including preterm infants, and showed the importance of evaluating the sensitivity of the inferences of the PK parameters to the selected scaling approach.
Keywords: tapentadol, pediatric, maturation, allometric scaling, pain management, nonlinear mixed effects modeling
Introduction
The opioid analgesic tapentadol exhibits two synergistic mechanisms of action as a µ-opioid receptor agonist and a norepinephrine reuptake inhibitor.1 In the European Union (EU), tapentadol immediate release (IR) and oral solution (OS) are indicated in adults for the relief of moderate to severe acute pain, which can be adequately managed only with opioid analgesics.2–4
It is well known that children of all age groups including preterm neonates can perceive pain and that there is an absolute need to treat their pain safely and effectively. The approved treatment options for children, particularly preterm neonates and young infants, are very limited with only few medications specifically labelled for this population.5 A development program was set up to determine the pharmacokinetics (PK), efficacy, safety and tolerability profile of tapentadol OS in the pediatric population. The program included 327 patients <18 years old affected by acute pain such as that following surgical procedures.6–9 Based on this program, tapentadol OS has recently obtained approval for use in children from 2 years of age in the EU. In this clinical pediatric program, the premise was that the predictable pharmacokinetic profile of tapentadol as established in adults would facilitate development in children.
Tapentadol pharmacokinetics have been extensively studied in adults.10–12 The absorption of tapentadol IR/OS is almost complete (99% absorbed), with mean absolute bioavailability of approximately 32% due to extensive first-pass metabolism.10 Tapentadol is primarily metabolized through conjugation to glucuronide by different uridine 5ʹ-diphospho-glucuronosyltransferase (UGT) enzymes, mainly UGT2B7, UGT1A9 and UGT1A6, and to sulfate by sulfotransferases.11 Only a small portion of tapentadol metabolism (~15%) is mediated by cytochrome P450 (CYP450) enzymes, CYP2C9, CYP2C19, and CYP2D6.13 After oral administration, around 70% of the dose is excreted in urine in the conjugated form (55% as a glucuronide and 15% as a sulfate), whereas about 3% of the drug is urinary excreted as unchanged drug.12 The remaining amount is metabolized via Phase 1 oxidative pathways. The metabolites do not contribute to the analgesic activity of tapentadol.11
The pharmacokinetics of tapentadol in children 2 years of age and above were recently published.14 The latter publication discussed the development of a population PK (popPK) model that was used to find a suitable dose to take forward in a multiple-dose efficacy trial in children aged 2 to <18 years of age. The popPK model used for this recommendation required bodyweight-based allometric scaling to fully describe the clearance in children 2 years of age and above assuming a fully matured metabolizing capacity in this population.
The pediatric population is a very heterogenous population due to many dynamic and rapid changes, especially in neonates and infants below 2 years of age, where the body is not only quickly growing in size but also maturing in functionality. The ontogeny and maturation of the different drug-metabolizing enzymes as well as other age-dependent changes such as those in body composition, organ/tissues volume, cardiac output and organ/tissue blood flow, and gastrointestinal physiology can all affect the observed drug PK.15 These factors could subsequently impact drug dosing especially in the very young patients, as developing elimination pathways may result in different clearance than expected based on bodyweight alone. Consequently, the dose required reflects not only the size of the child but also their age and maturational state, which can vary between different children even of the same age and weight.
In the current work, we expand the knowledge and the effort done in the previous popPK model for children 2 years of age and above14 by also including younger children down to birth. Furthermore, we discuss the development of a popPK model covering the full pediatric age range based on collected PK data after IV as well as OS administration with the objective to determine the contribution of size-related (bodyweight) and function-related (maturation) factors on oral bioavailability (F), volume of distribution (V), and clearance (CL). Two approaches are applied in assessing these contributions: (1) use of theoretical allometric scaling exponents, an approach that assumes that the size effects are governed by constant exponents of 0.75 for CL and 1 for V,16,17 and (2) use of exponents that are estimated based on the modeled drug data.18 This work will also address how the results of these 2 approaches differ when inferring the apparent clearance and volume of distribution across the studied age groups.
Patients and Methods
Clinical Trial Design and Patient Population
Data derived from a total of four single-dose, open-label, Phase II PK trials administering tapentadol OS or IV were used in this popPK analysis (Table 1). The supplemental material provides a list of participating trial sites. These trials included pediatric patients with acute pain severe enough to require opioid treatment as defined in the trial protocols. In the majority of the patients, the experienced pain was acute postsurgical or procedural pain.6–9
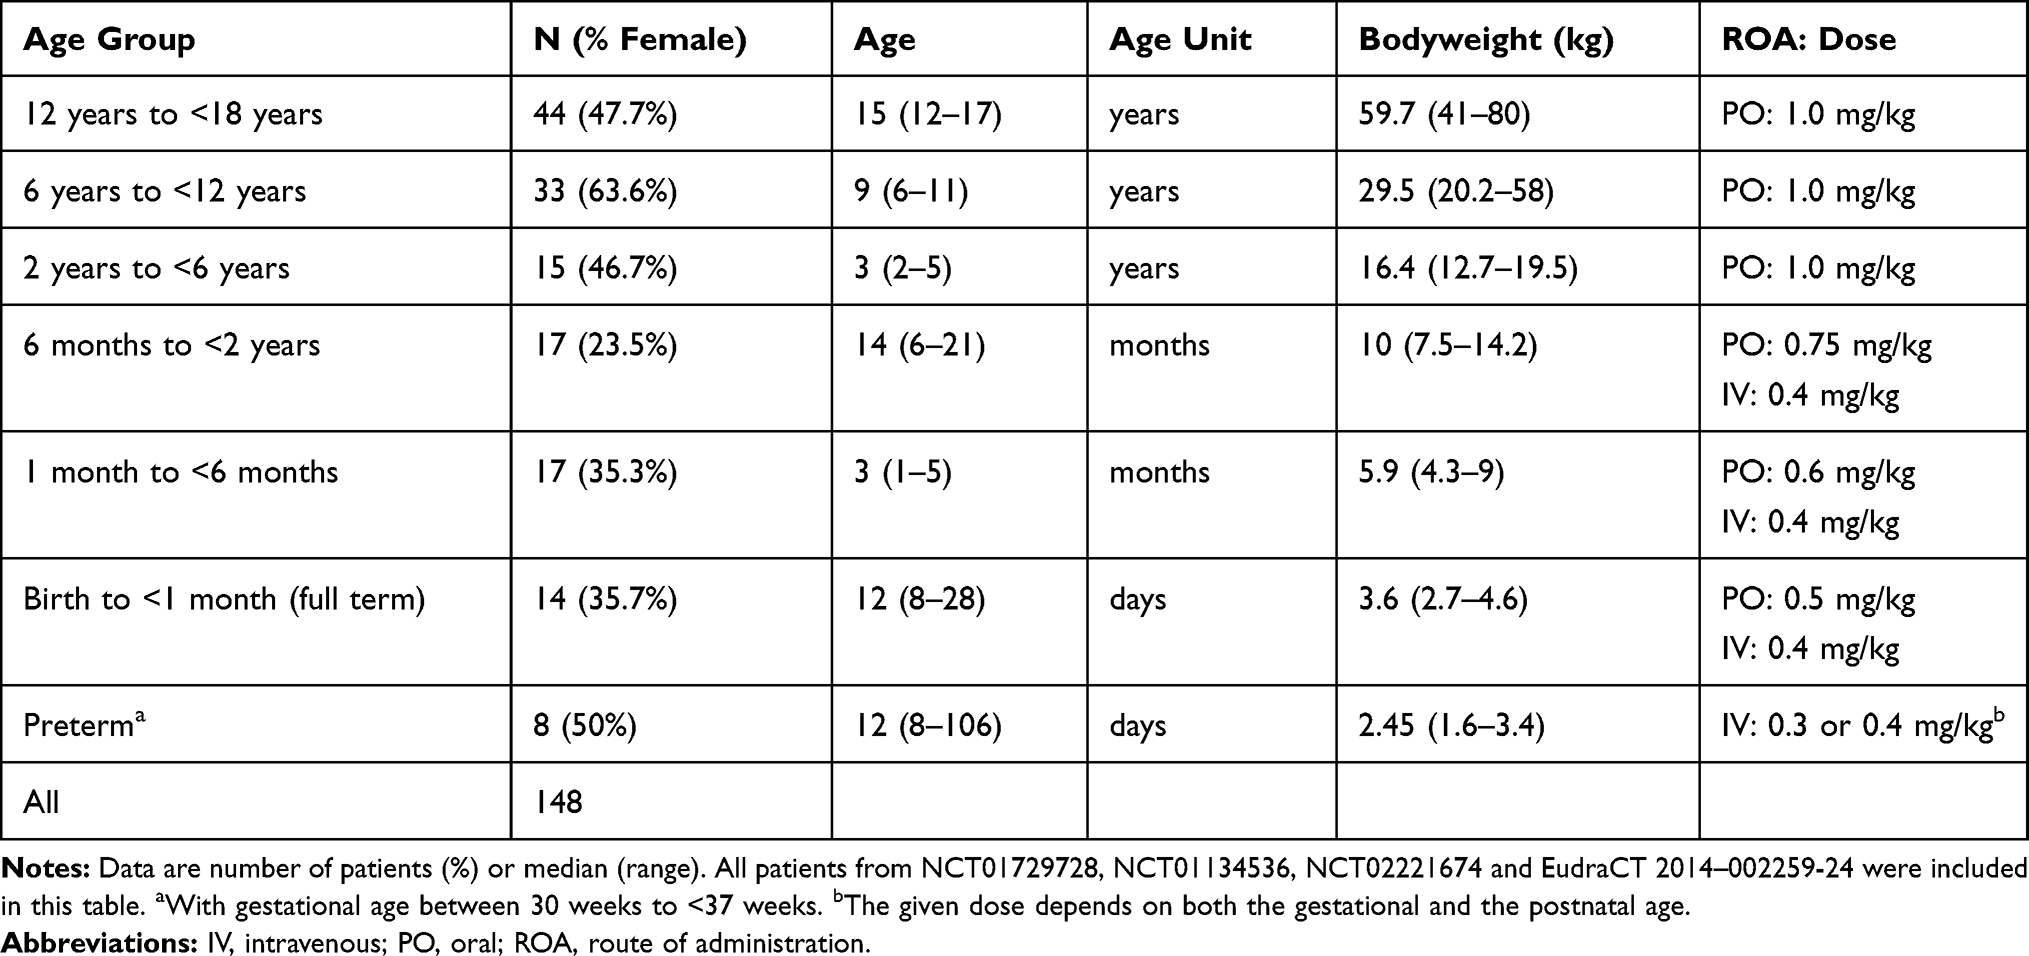 |
Table 1 Overview of Age, Bodyweight and Tapentadol Dosing in the Different Age Groups of the Tapentadol PK Analysis Population |
Two tapentadol OS studies in children 2 years of age and above (NCT011345366 and NCT017297287), one tapentadol OS trial in children less than 2 years (NCT022216749), and one tapentadol IV trial in children less than 2 years (EudraCT 2014–002259-249) have already been reported. The latter two studies assessed PK, safety and efficacy after administration of a single dose of either tapentadol OS or tapentadol IV infusion. The OS trial included children from birth to <2 years (n=19; gestational age of ≥37 weeks), whereas the IV trial included pediatric patients from preterm neonates (≥24 weeks gestational age) to <2 years (n=38). Both trial populations were stratified by age: preterm neonates (for the IV trial only; postmenstrual age of ≤41 weeks and gestational age between 24 and <37 weeks), neonatal patients from birth to <1 month, patients aged 1 month to <6 months, and patients aged 6 months to <2 years. In order to ensure patient safety, enrolment was staggered starting with the oldest age group. All trials were conducted in accordance with the Declaration of Helsinki, Good Clinical Practice, national regulations, and applicable local laws. The protocol, amendments, patient information sheet and applicable informed consent forms were reviewed and approved by independent ethics committees or institutional review boards at the participating trial sites. Parents/legal guardians provided written informed consent for trial participation of their children.
Table 1 gives an overview of the doses administered to the different age groups in the different trials. Tapentadol OS was given as a single oral dose with those below 2 years receiving a dose differentiated based on age. Tapentadol IV was administered by a 1 hour constant rate infusion (1 mg/mL solution) and subjects received either 0.3 or 0.4 mg/kg depending on their gestational and postnatal age.
PK Assessments
In the two tapentadol OS trials in children 2 years of age and above (NCT01134536 and NCT01729728), eight samples were taken in the oldest age group (12 years to <18 years), whereas four were taken in the intermediate age group (6 years to <12 years), and 2–4 samples in the youngest age group (2 years to <6 years). The PK sampling times in subjects from 2 years and above have been fully documented by Watson et al.14
In the tapentadol OS trial (NCT02221674) in subjects <2 years of age, 2 PK samples per subject were taken at dedicated times. Two subjects from each age group had samples taken at 0.5 and 4.0 hours or 2.0 and 8.0 hours and 1 subject per age group had samples taken at 1.0 and 6.0 hours. In the tapentadol IV trial (EudraCT 2014–002259-24), 3 samples per subject were taken at dedicated times. Two subjects from each age group had samples taken from one of 4 sampling schedules; A: 0.25, 1.0 and 6 hours, B: 0.5, 2.0 and 8.0 hours, C: 1.25, 4.0 and 10 hours or D: 1.5, 3.0 and 7.0 hours.
Modeling Support for Clinical Trial Design in Tapentadol Acute Pediatric Program
During the planning of the clinical trials in this comprehensive pediatric development program, intermediate models based on partial data and different modeling approaches were used to inform the dose levels to be studied as well as the optimal sampling time points.
The dose levels were optimized to establish exposures that would fall into the range of adult reference exposures obtained after the administration of 50, 75, or 100 mg tapentadol IR given every 4 hours, while avoiding the highest end of this distribution as a precaution for adverse events. Sampling time points were designed to cover the full PK curve of tapentadol at the trial population level in order to be able to estimate oral clearance (CL/F) and apparent volume of distribution (V/F), while taking into account the limitations of the number and volume of blood samples that could be collected in children, which led to just 2–4 samples in children younger than 6 years old.
First, an adult popPK model19 was extended with allometric scaling exponents fixed to the theoretical values of 0.75 and 1 for CL/F and V/F, respectively, to perform simulations and recommend doses to be used in the very first pediatric trials in subjects 2 years of age and above (NCT01134536 and NCT01729728). As a result, a dose of 1.0 mg/kg was selected in order to match adult exposure. For the very young children <2 years of age (NCT02221674 and EudraCT 2014–002259-24), a physiologically based pharmacokinetic model was developed in order to account for both organ maturation and development and to recommend a starting dose for this vulnerable group (data on file). As a result, the OS dosages applied in children younger than 2 years were decreased to 0.75 mg/kg (6 months to <2 years), 0.6 mg/kg (≥1 month to <6 months), and 0.5 mg/kg (birth to <1 month), anticipating expected lower clearance due to incomplete maturation. The IV dosages were lowered to 0.4 mg/kg for the whole age range, except for preterm, where 0.3 mg/kg could be applied based on the gestational age and the postnatal age, reflecting the expected full bioavailability compared with oral administration.
After the completion of the first 2 clinical trials with single-dose OS tapentadol, an intermediate popPK model was developed based on the available data and simulations indicated that the optimal dose level could be increased to 1.25 mg/kg in a subsequent clinical trial studying the efficacy and safety in children 2 years of age and above.14 The results of the confirmatory efficacy trial showed that the proposed dose led to a tapentadol exposure that was both safe and efficacious.8
The current article describes the development of an integrated popPK model based on all collected data after the completion of all 4 pediatric PK trials in the pediatric development program, which included subjects from the entire pediatric age range after oral and intravenous drug administration.
Population Pharmacokinetic Modeling
Data Set
All subjects with at least one serum concentration above the lower limit of quantification (LLOQ) were considered for the analysis. A total of 569 quantifiable tapentadol serum concentrations from 148 subjects were included in the analysis. The majority of these samples (~75%) were collected from children above 2 years of age who received oral tapentadol, whereas only 33 quantifiable tapentadol serum concentrations were obtained from 18 subjects <2 years of age after oral administration. However, the tapentadol IV trial in subjects <2 years of age provided additional 113 quantifiable tapentadol serum concentrations from 38 subjects. As a result, approximately 25% of the analyzed samples were collected in subjects below 2 years of age. A total of 38 samples (representing 7% of total samples) collected from 17 patients after oral (PO) administration were excluded from the analysis as these patients either vomited within 3 hours of tapentadol intake or did not take the complete dose. Additionally, one sample collected after IV administration was excluded because of sample contamination.
Modeling Strategy
Two popPK modeling approaches were explored for the analysis of the totality of pediatric PK data. The first approach utilizes the common standard theoretical allometric scaling exponents of 0.75 and 1 for CL and V, respectively. This approach assumes that the scaling exponents are universal constants across species and/or age for CL and V and is based on the observations that biological structures and processes from cellular metabolism to population dynamic scale with size and follow a simple power law behavior.16,17 This method often provides an adequate explanation for bodyweight relationships in pediatric patients.18,20 A potential advantage of this approach is that it could facilitate the identification of the parameters of any additionally incorporated and simultaneously fitted maturation functions. The second approach estimates allometric scaling exponents on CL and V based on the available data. This estimation is not always supported, eg, in case of too sparse data, especially when additional maturation functions are fitted simultaneously, but has the potential advantage to better describe the experimental data as it provides higher flexibility. Taking into account the existing scientific debate of which approach provides superior results,18 the decision was taken to explore tapentadol PK by both approaches with focus on their inference on the concluded age-related changes in CL and V.
Model Development
PopPK modeling was performed with a nonlinear mixedeffects approach, as implemented in NONMEM (version 7.2, ICON Development Solutions, Ellicott City, MD, USA), and using similar model acceptance criteria and toolset21,22 as described by Watson et al.14
The model developed from tapentadol OS data obtained from children aged 2 to <18 years of age14 was used as the base model. This model was further developed by testing various age-dependent maturation functions in addition to the size effect on CL. The most appropriate function was the sigmoidal Emax.23 Due to the availability of IV and oral data, tapentadol oral bioavailability was estimated and a variety of maturation functions on F were also tested to capture any age-related changes in this parameter. This included maturation functions that allowed F to be 100% in newborns; however, the simplest of the tested maturation functions was retained in the final model, if the complexity was not rewarded by a significant reduction in the objective function value (OFV). In addition, as the IV trial included subjects born preterm, both postmenstrual age (PMA) and postnatal age (PNA) were tested in functions using age as a variable. The simplest model that would describe the data based on reduction of the OFV by more than 3.84 (chi-square distribution; p<0.05; 1 degree of freedom) and sufficiently narrow parameter uncertainty and adequate model acceptance criteria was selected. The implemented equations for CL, V, and F in the final models are as follows:
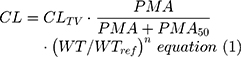
where CL is the clearance for a specified age and weight, CLTV the typical clearance at a reference weight (WTREF 70 kg) and full maturation, PMA is postmenstrual age (weeks), PMA50 the PMA at 50% of maximum maturation (weeks), WT is total bodyweight (kg), and n is the allometric exponent.
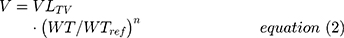
where V is the volume of distribution for a specified age and weight, VTV the typical volume of distribution at a reference weight (WTREF 70 kg), WT is total bodyweight (kg), and n is the allometric exponent.

where F is the oral bioavailability at a specified age, Fadult the bioavailability at full maturation, PNA is postnatal age (weeks), and k is a rate constant (week−1).
All model parameters were assumed to be log-normally distributed as given in equation (4).

where Pi is the estimated parameter value for individual i, PTV is the typical population value of the parameter at given age and weight, and ηi are inter-individual random effects for individual i. The random effects matrix for all parameters together is assumed to be normally distributed according to a multivariate Gaussian distribution with an all-zero mean vector and a between-subject variance-covariance matrix Ω. The diagonal elements of Ω are the variances  of the inter-individual random effects ηi. Initially, the off-diagonal elements were all set to zero but were later evaluated if deemed appropriate and supported by the data.
The residual error model was tested as proportional or as a combination of an additive and proportional error as in equation (5):
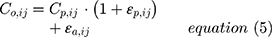
where Co,ij is the jth measured observation (compound concentration) in individual i, Cp,ij is the jth model-predicted value (compound concentration) in individual i,  and
and  are the proportional and additive residual error for each individual i and measurement j, assumed to be normally distributed according to a Gaussian distribution with zero mean and variance
  or
or  for the proportional and additive error components, respectively.
No formal covariate analysis was performed. Instead, the covariates sex and creatinine clearance were additionally tested for a univariate influence on CL or V. To be noted, Watson et al examined several covariates in their model such as sex, aspartate transaminase, alanine transaminase, alkaline phosphatases, total phosphate, bilirubin, and creatinine clearance but none of them were found to be statistically significant.14
Model Evaluation
The final popPK model was validated by visual predictive checks (VPC) and by bootstrap to ensure adequate predictive power, model stability, and to assess the uncertainty in the parameter estimates. The VPC was performed with 1000 replicates of model-based simulations using the final model and the original dataset. Summary statistics on the variability of each of the dependent variables per time point were calculated, including the 2.5%, 50%, and 97.5% quantiles (Prediction Interval [PI]). The VPC results were stratified by age group and route of administration and then compared to the observed concentration data. For the bootstrap, 1000 new datasets were generated by randomly sampling subjects with replacement from the original dataset. Model parameters were estimated for each bootstrap dataset and summary statistics were computed based on successful model minimizations. The uncertainty of each parameter estimate was expressed as the 95% confidence interval (CI), based on the 2.5% and 97.5% quantiles of the distributions of the bootstrap estimates.
Simulation of Virtual Pediatric Population and Investigation of Clearance and Distribution as a Function of Age
Monte Carlo simulations were performed to explore tapentadol exposure in steady-state at the various dose levels used in the four pediatric PK trials and to investigate age-related changes in tapentadol clearance and volume of distribution across the whole pediatric age range. For this purpose, a virtual pediatric population was created by randomly sampling an age (uniform distribution between 0 and <18 years – for the exposure simulations n=250 for each age group and route of administration), a gender (random male/female sampling – with replacement), and a z-score (normal distribution with mean=0 and SD=1) for each virtual child. Subsequently, the LMS parameters reported in the Centers for Disease Control and Prevention (CDC) weight-for-age growth charts were used to calculate the weight of each virtual child based on its age, gender, and z-score.24 The postmenstrual age was calculated as gestational age plus the postnatal age, where gestational age was set to 40 for full terms. For preterms, a gestational age was randomly sampled (uniform distribution between 24 and <37 weeks), to be in line with subjects recruited for EudraCT 2014–002259-24. For the exposure simulations, reference exposure ranges were generated for adults using a previously published popPK model upon the administration of 50, 75, and 100 mg IR every 4 h for 5 days.19
Results
Tables 1 and 2 give an overview of the characteristics of the analysis population, stratified by age group (Table 1) and by trial and age group (Table 2). The analysis population contains a good representation of all pediatric ages and bodyweights, including very low bodyweights in preterms (1.6–3.4 kg) to bodyweights close to the adult weight (41–80 kg) in the age group 12 to <18 years. Additionally, there was a good balance in the proportion of males and females throughout the studies for the different age groups (Table 2). Table 1 also lists the route of administration and the doses that were studied. Patients in the age group above 2 years were always orally dosed with 1.0 mg/kg. Below 2 years of age, both the IV and PO routes were studied, with gradually lower doses in the younger children (lowest dose in preterms 0.3 mg/kg). Preterm patients were exclusively dosed by IV administration.
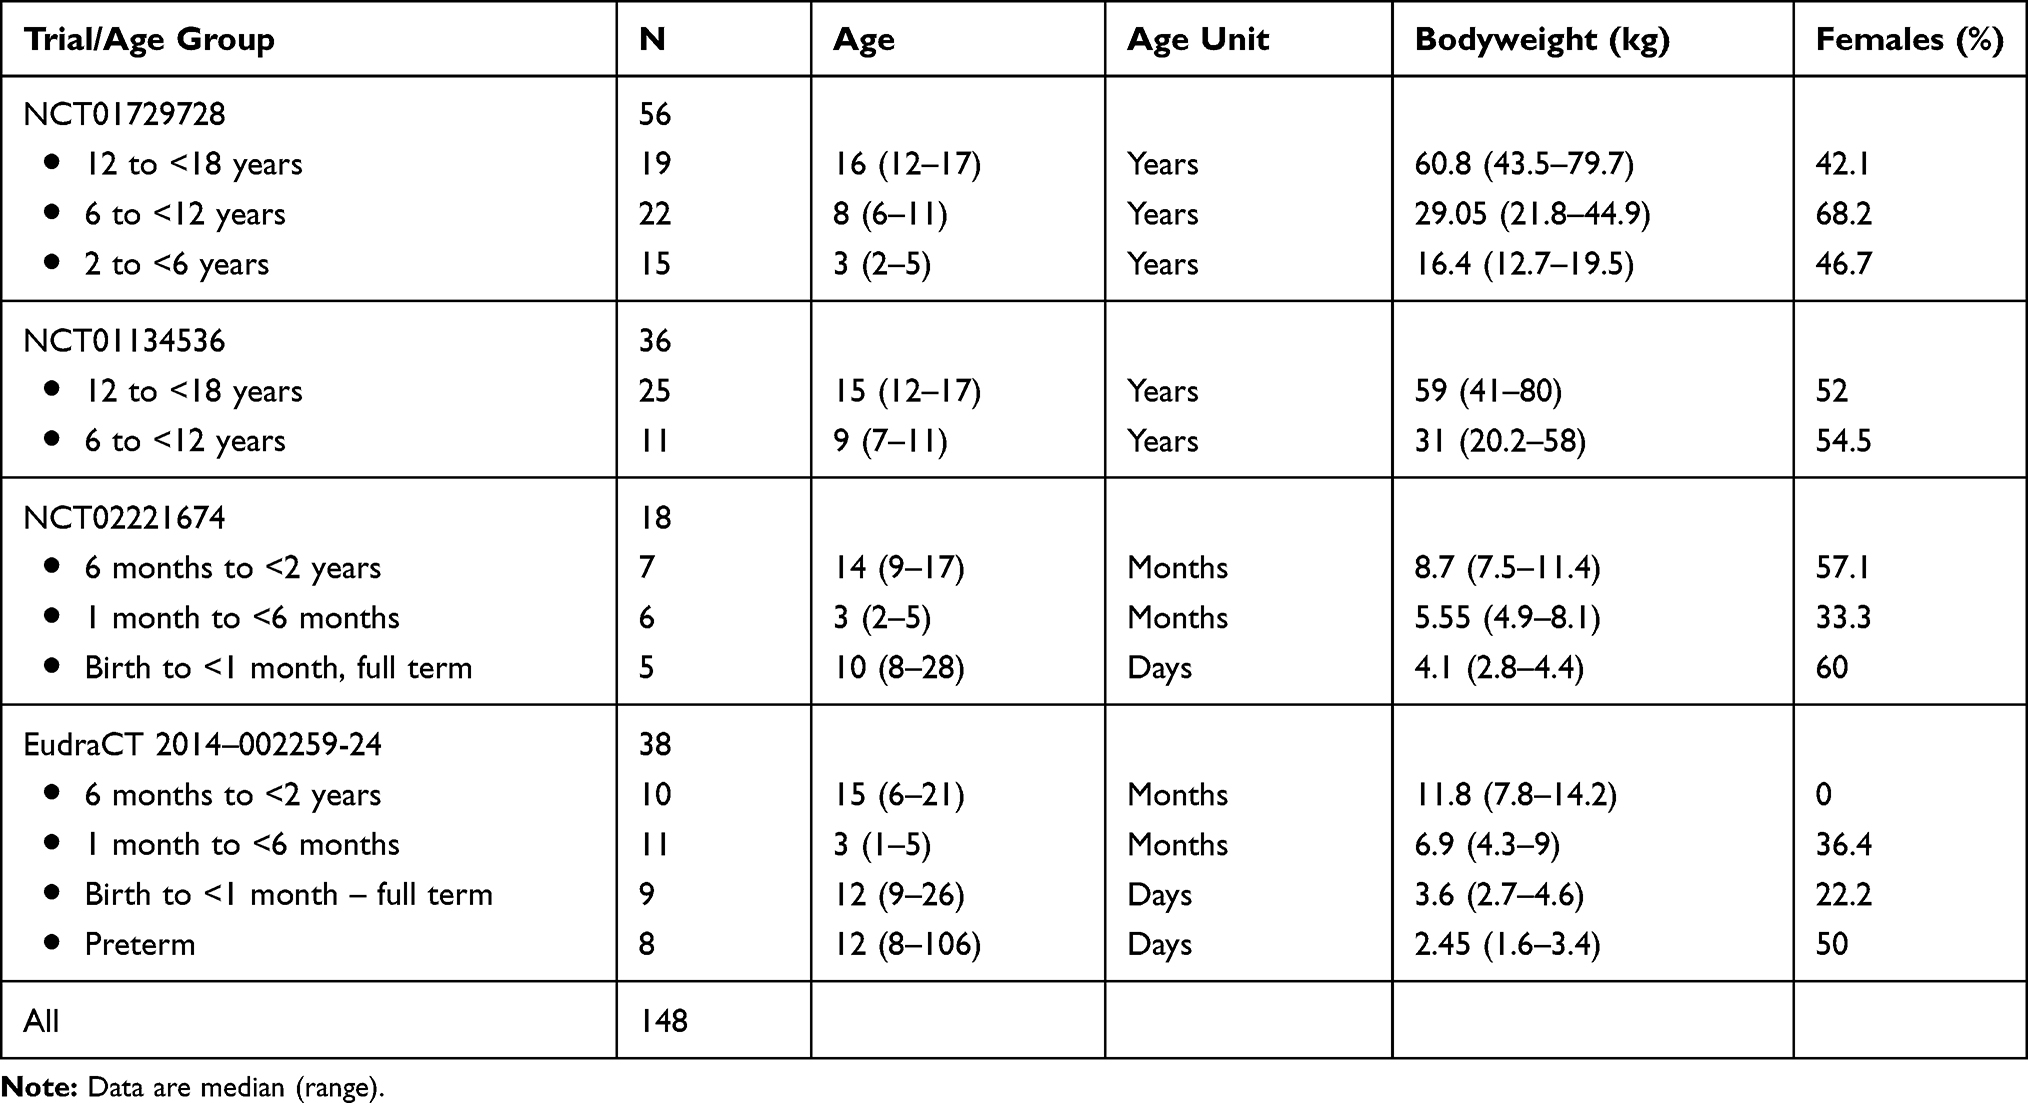 |
Table 2 Overview of Age, Bodyweight, and Sex (% Females) of the Analysis Population Stratified by Trial and Age Group |
Figure 1 displays the observed concentration-time data stratified by age group and administration route. Children older than 6 years provided very dense data until 15 hours after dosage, while fewer observations were available in the younger children due to the sparse sampling schedule, which extended until 10 hours after dosage. The median concentration–time curves were very similar between the age groups for each of the administration routes with slightly lower maximum concentrations in the younger children. A few high individual concentrations were observed directly after IV administration that deviated from the majority of the observations, which could be attributed to non-mixing conditions that may exist directly after IV administration.
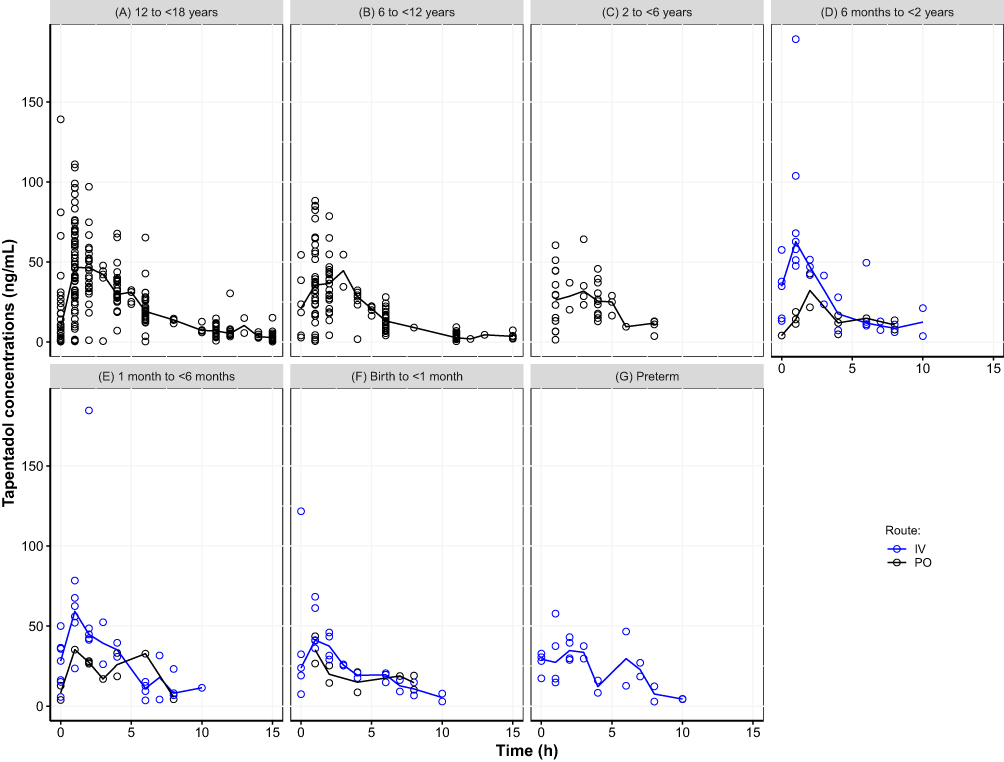 |
Figure 1 Scatter plot of observed tapentadol concentrations versus time. (A) 12 to <18 years, (B) 6 to <12 years, (C) 2 to <6 years, (D) 6 months to <2 years, (E) 1 month to <6 months, (F) Birth to <1 month, (G) Preterm. The open circles represent the observed tapentadol concentrations and the lines represent the observed median concentrations. |
The two models that were fit to the totality of data, with assumed or estimated allometric scaling exponents, both provided an adequate fit. The objective function value of the model with estimated exponents (2 additional parameters) was lower (ΔOFV=−13.12) than the model that assumed the universal values of 0.75 and 1 for CL and V, respectively. Figures 2 and 3 provide the simulated concentration–time curves for the population stratified by age and administration route. Additional plots are provided as supplemental material including goodness of fit plots (Figures S1 to S2), histograms of the random effects (Figures S3 to S4), and visual predictive check (Figures S5 to S6). Results showed that both models captured the central trend as well as the variability without any biases or shrinkage related to model misspecification or over-parameterization. Other than weight and age, none of the investigated covariates, ie, sex and creatinine clearance, were found to be statistically significant.
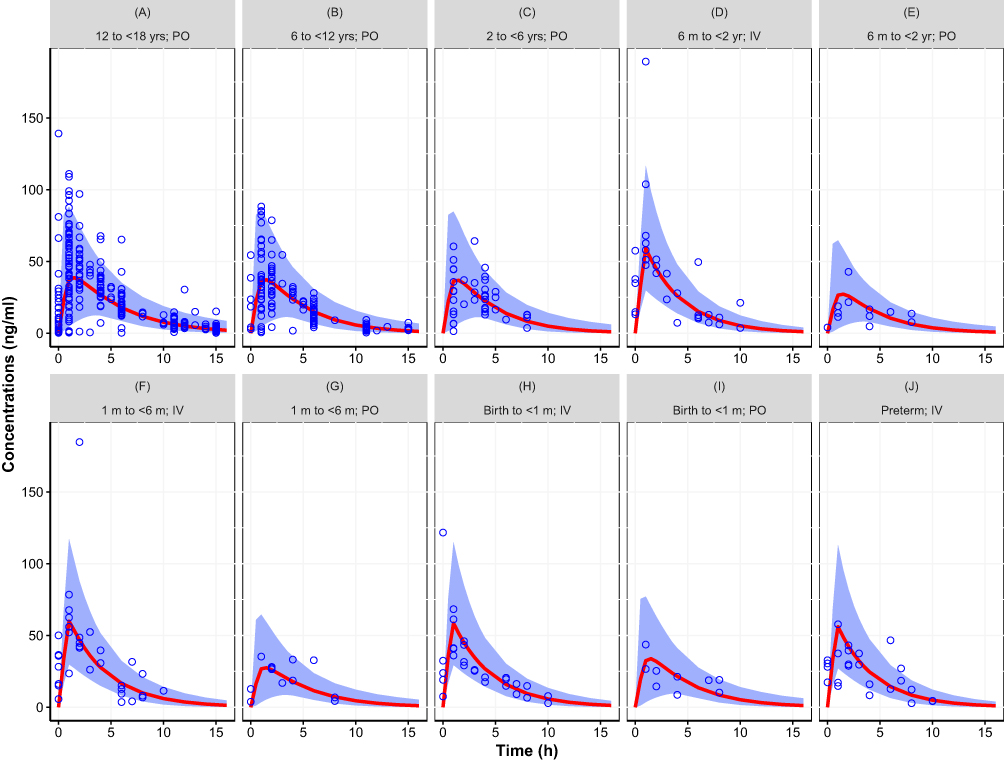 |
Figure 2 Simulated concentration–time curve for the pediatric population (birth to <18 years) using final parameter estimates from the population pharmacokinetic model with assumed allometric scaling exponents (0.75 and 1 for CL and V, respectively), showing the variability (blue area, representing the 95% prediction interval) and central trend (red line: median prediction), together with the observations (open circles). (A) 12 to <18 yrs; PO, (B) 6 to <12 yrs; PO, (C) 2 to <6 yrs; PO, (D) 6 m to <2 yr; IV, (E) 6 m to <2 yr; PO, (F) 1 m to <6 m; IV, (G) 1 m to <6 m; PO, (H) Birth to <1 m; IV, (I) Birth to <1 m; PO, (J) Preterm; IV. Results stratified by age group and route of administration. |
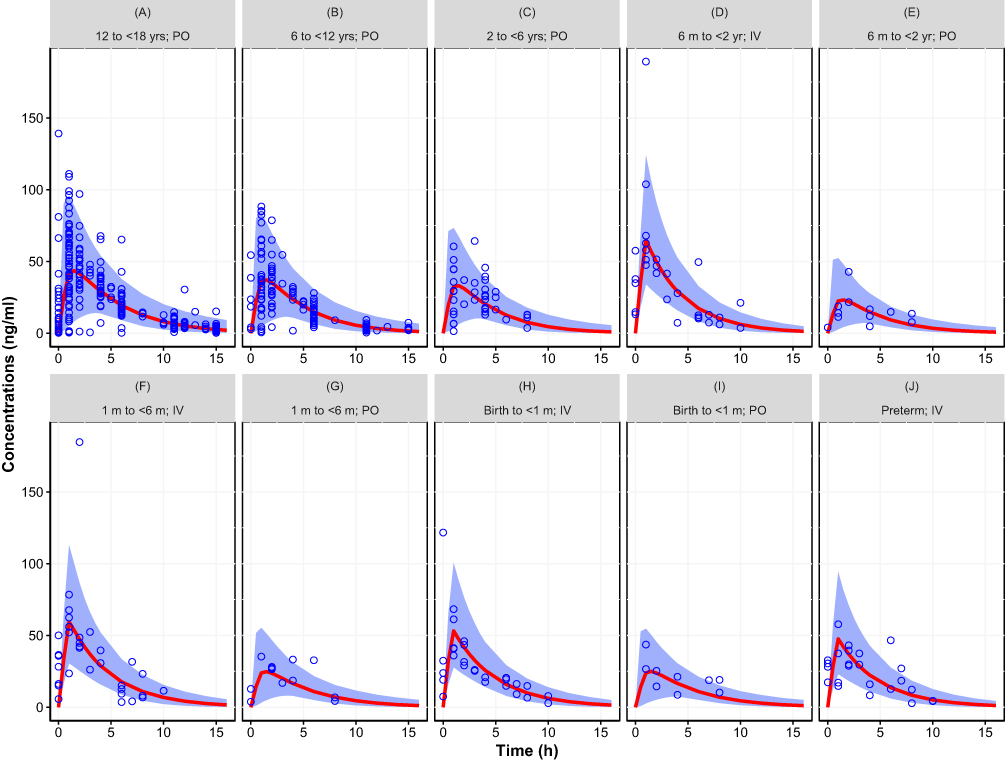 |
Figure 3 Simulated concentration–time curve for the pediatric population (birth to <18 years) using final parameter estimates from the population pharmacokinetic model with estimated allometric scaling exponents, showing the variability (blue area, representing the 95% prediction interval) and central trend (red line: median prediction), together with the observations (open circles). (A) 12 to <18 yrs; PO, (B) 6 to <12 yrs; PO, (C) 2 to <6 yrs; PO, (D) 6 m to <2 yr; IV, (E) 6 m to <2 yr; PO, (F) 1 m to <6 m; IV, (G) 1 m to <6 m; PO, (H) Birth to <1 m; IV, (I) Birth to <1 m; PO, (J) Preterm; IV. Results stratified by age group and route of administration. |
Table 3 provides the parameter estimates of the 2 models. The models were similar from the perspective of statistical uncertainty (relative standard error and bootstrap confidence interval), random effects, and shrinkage. Differences occurred mainly in the estimated population parameters. The estimated allometric exponents differed slightly from the assumed values of 0.75 for CL (estimated 0.603) and 1 for V (estimated 0.820). This difference has an impact on the estimates of CL and V at their reference weight (32% lower for CL and 35% lower for V when estimated). Differences were also seen in the estimated F and its maturation. The estimated F at full maturation was 24% lower with estimated exponents. Combining the latter result with the estimated differences in CL and V shows that for CL/F and V/F the difference vanishes (10% and 14% difference for CL/F and V/F, respectively). The exponent in the bioavailability maturation function was also different between the 2 models, 51% lower for the model with estimated exponents, suggesting a slower maturation rate than when derived with assumed allometric exponents. The parameter that governs the maturation function, the PMA at 50% of full maturation (PMA50) was very close for the two models (34.8 weeks with assumed exponents versus 36.7 weeks with estimated exponents); however, the uncertainty in the estimated value was higher for the model with estimated allometric scaling exponents.
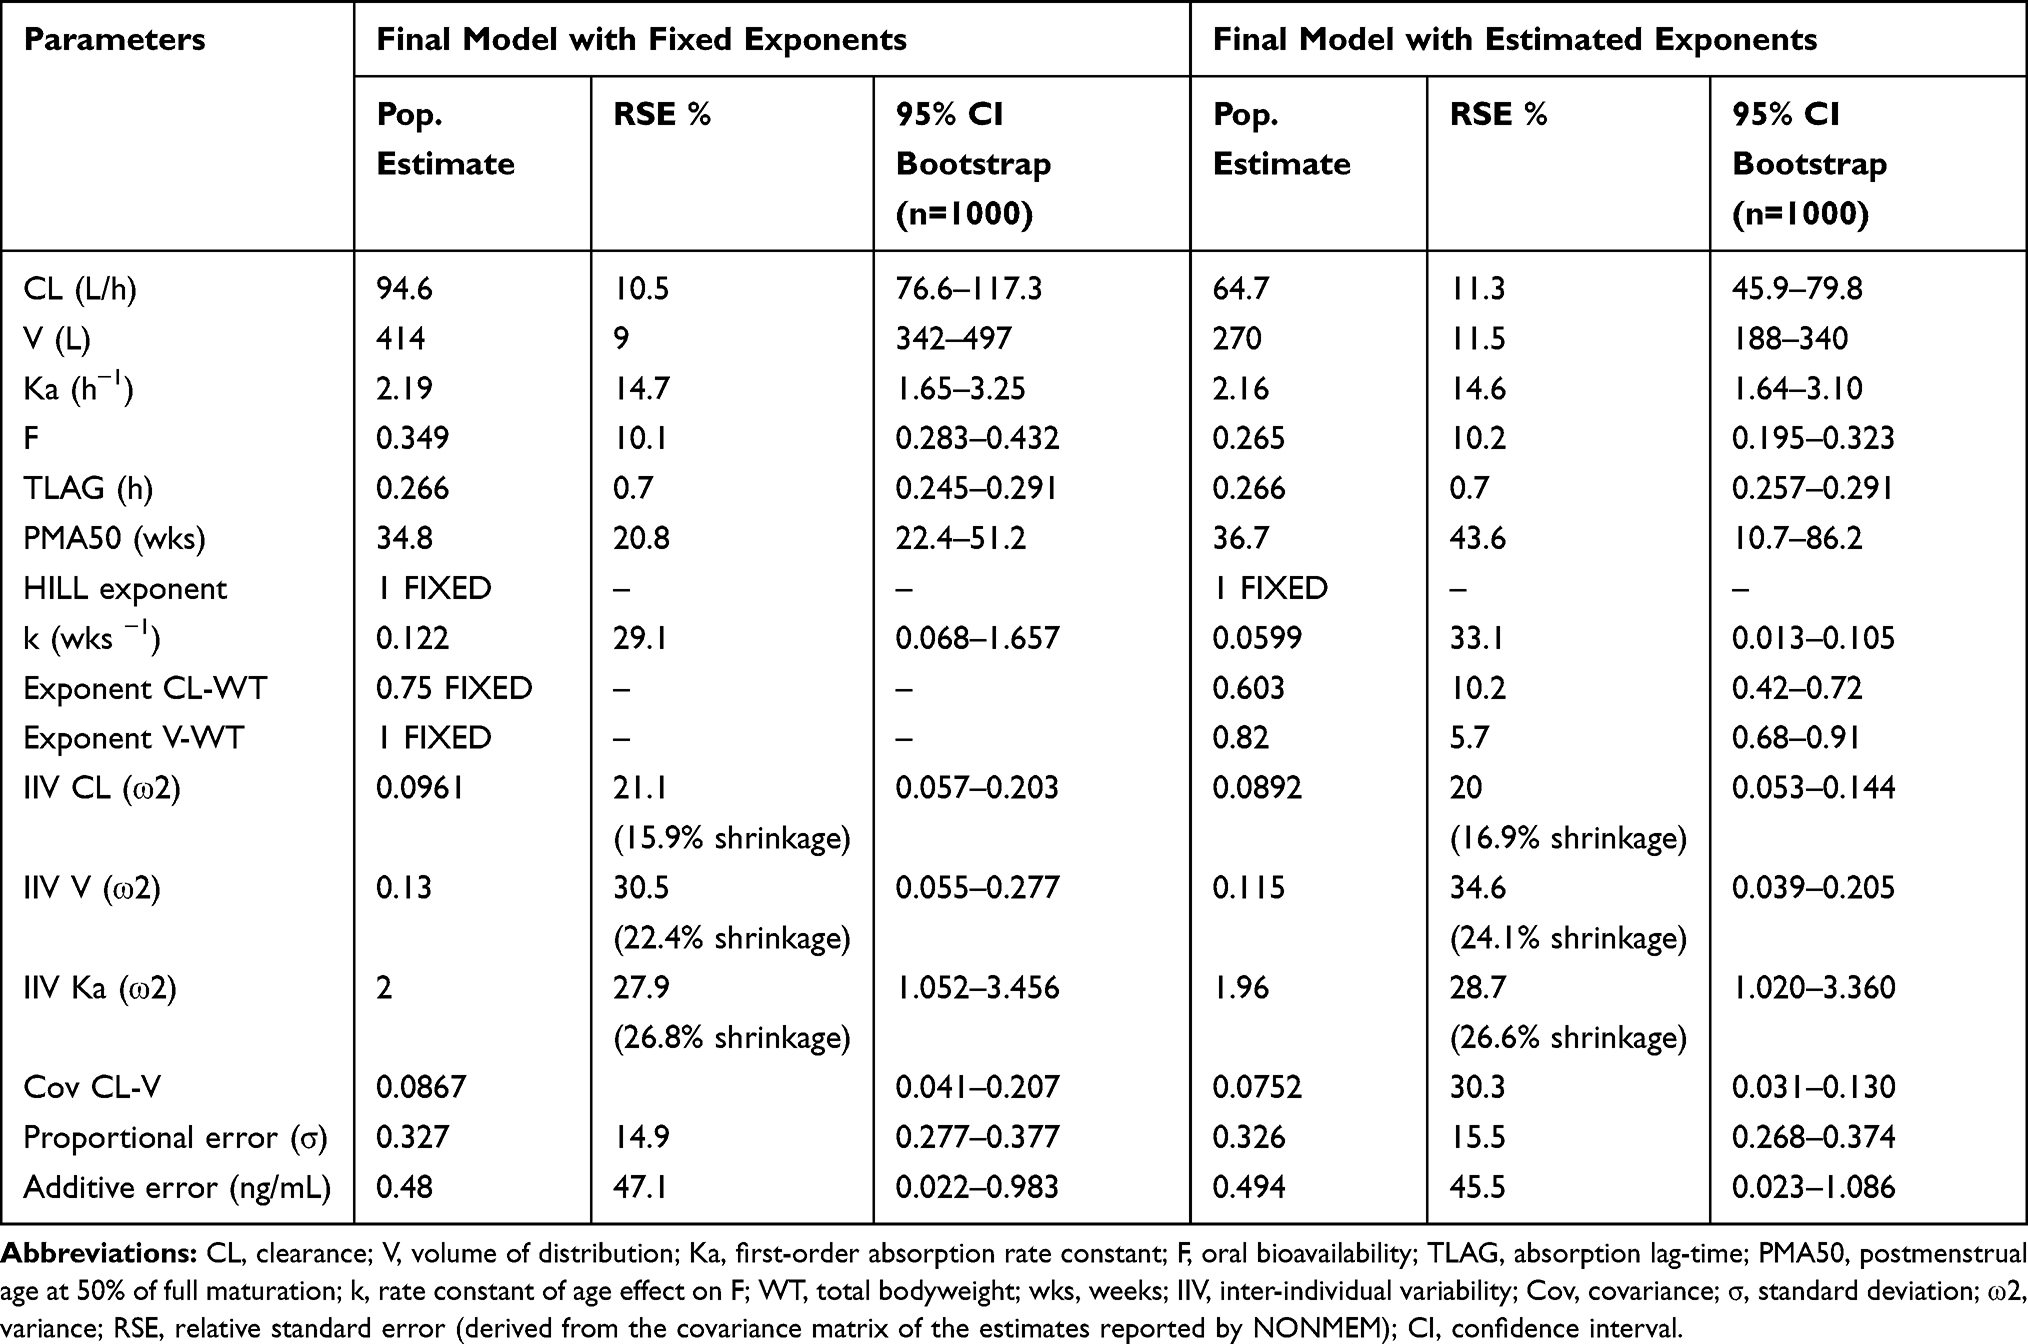 |
Table 3 Final Tapentadol Population Pharmacokinetics Parameter Estimates and 95% Confidence Intervals Using Either Assumed (0.75 and 1 for CL and V, Respectively) or Estimated Allometric Scaling Exponents. Estimates of CL/F and V/F in Both Models Relate to a Reference Weight of 70 kg |
In order to further investigate the differences in the derived age-dependent CL and V for the models, simulations were performed using the CDC growth charts. Results are provided in Figures 4 and 5 stratified by sex, to reflect the gender-specific weight-for-age distributions in the CDC growth charts. The simulations show the age-related changes in CL/F and V/F together with the Empirical Bayesian Estimates (EBEs) for the individual patients derived from the model. The latter were scaled to age-dependent bioavailability for both the IV and the PO administered patients to assure comparability. Results showed that both absolute CL/F and V/F increase dramatically with age, and that much of the variability can be explained by the bodyweight-age distribution as given in the CDC growth charts. The distribution of the EBEs along the simulated curves is generally within the expected range for both models. When the CL/F and V/F are scaled to bodyweight, thus cancelling the proportional component of bodyweight, a maximum in CL/F was observed at 3.5 and 2.5 years of age for the models with assumed and estimated allometric scaling exponents, respectively. This maximum also exists for V/F when the exponent is estimated (just over 1 year) but appears as an asymptotic value for the assumed exponent of 1. The maximum in these results of allometric scaling relates to a non-linear body mass effect with age and the maturation functions for CL and F that lead to a reduction at young age of both CL/F and V/F. A comparison of the simulated CL/F and V/F vs age curves with the EBEs suggests that the model with the estimated exponents designates a more prominent maximum that follows the EBEs slightly better than the model with the assumed exponents (Figures 4 and 5). This matches the expected higher flexibility when estimating the exponents. Taking the entire age range into consideration, the ratio between the established population curves for CL/F and V/F according to the two approaches was within bioequivalence margins except for children below 5 weeks where the difference increased outside the margins with the largest difference at birth (data not shown).
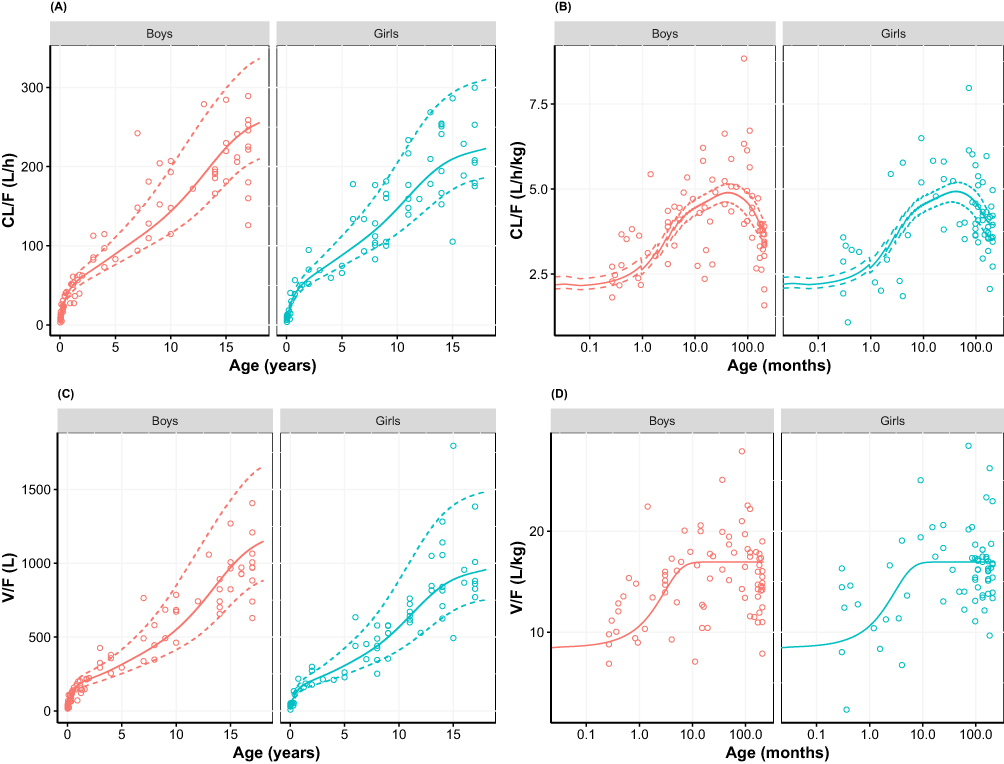 |
Figure 4 (A) Apparent clearance, (B) bodyweight-normalized apparent clearance, (C) apparent distribution volume, and (D) bodyweight-normalized apparent distribution volume versus age, using allometric scaling with assumed exponents (0.75 and 1 for Cl and V, respectively; Table 3). Empirical Bayesian estimates (dots) are shown together with simulated relationship (median weight-for-age (solid line) as well as the 3rd and 97th weight-for-age percentile (dashed lines) of the CDC growth charts). Empirical Bayesian estimates of all results are scaled to age-specific oral bioavailability and stratified by gender. For bodyweight-normalized values, data were presented on logarithmic x-axis. |
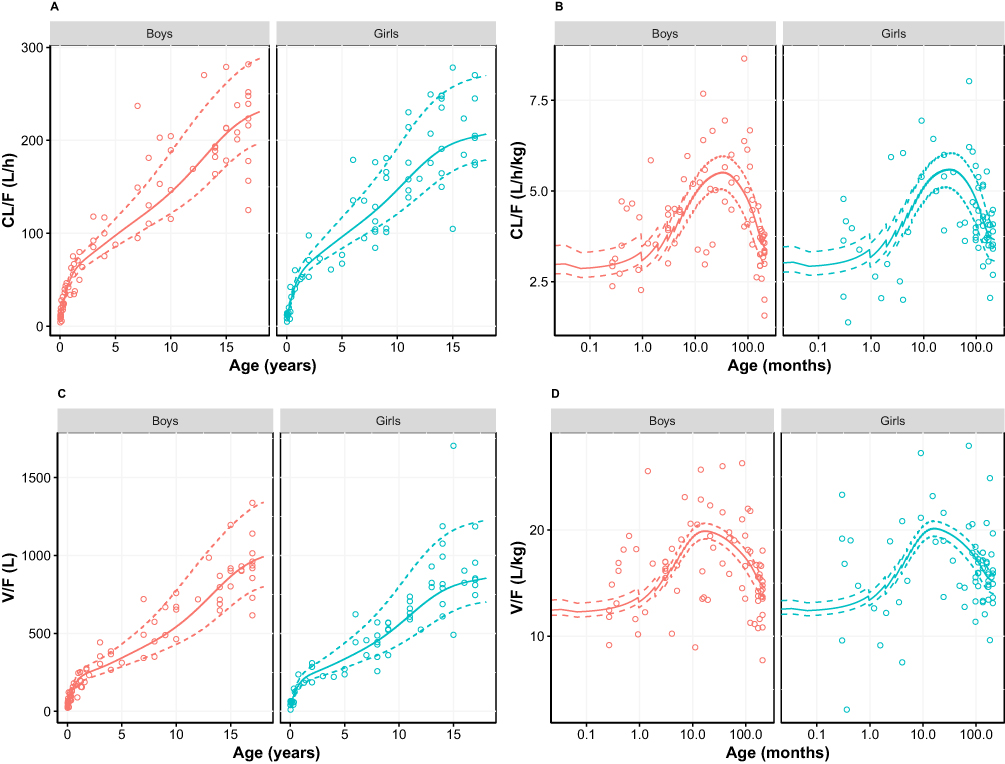 |
Figure 5 (A) Apparent clearance, (B) bodyweight-normalized apparent clearance, (C) apparent distribution volume, and (D) bodyweight-normalized apparent distribution volume versus age, using allometric scaling with estimated exponents (Table 3). Empirical Bayesian estimates (dots) are shown together with simulated relationship (median weight-for-age (solid line) as well as the 3rd and 97th weight-for-age percentile (dashed lines) of the CDC growth charts). Empirical Bayesian estimates of all results are scaled to age-specific oral bioavailability and stratified by gender. For bodyweight-normalized values, data were presented on logarithmic x-axis. |
Figures 6 and 7 show the simulated steady-state area under the curve (AUCtau,ss) of tapentadol in pediatric subjects from birth to <18 years of age upon the administration of the actual doses that were administered in the 4 PK trials if taken for long term every 4 h. These simulations were performed using both final models with assumed or estimated allometric scaling exponents in virtual pediatric populations using the CDC growth charts. The simulations showed that the planned trial doses lead to drug exposures mostly within the lower half of the target adult exposure range.
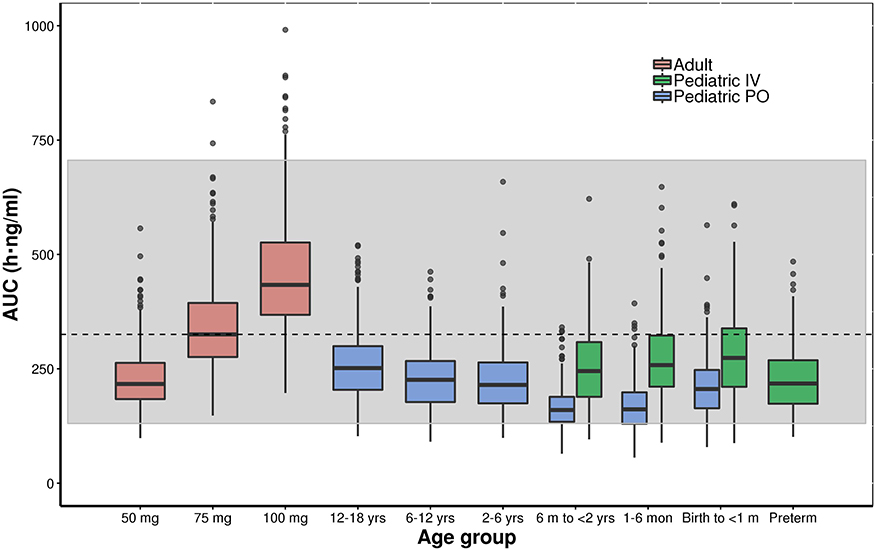 |
Figure 6 Boxplot of the simulated (model with assumed allometric scaling exponents of 0.75 and 1 for Cl and V, respectively) steady-state area under the curve (AUCtau,ss) of tapentadol in adults and pediatric subjects birth to <18 years of age receiving the doses of the included clinical trials every 4 hours. The gray shaded area represents the 2.5th and the 97.5th percentile of the AUCtau,ss in adults receiving 50 mg and 100 mg tapentadol every 4 hours, respectively. The central black line indicates the 50th percentile (median) of the AUCtau,ss in adults receiving 75 mg tapentadol every 4 hours. Simulated pediatric doses: Oral tapentadol: 1.0 mg/kg in children ≥2 years, 0.75 mg/kg in children 6 month to <2 years, 0.6 mg/kg in children 1 month to <6 months, and 0.5 mg/kg in children from birth to <1 month. Intravenous tapentadol: 0.4 mg/kg in children >7 days, 0.3 mg/kg in preterm. |
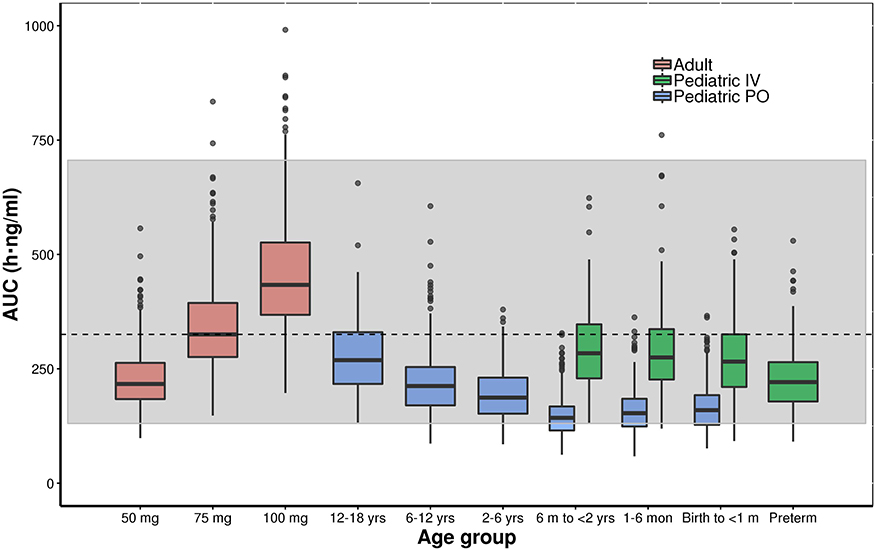 |
Figure 7 Boxplot of the simulated (model with estimated allometric scaling exponents) steady-state area under the curve (AUCtau,ss) of tapentadol in adults and pediatric subjects birth to <18 years of age receiving the doses of the included clinical trials every 4 hours. The gray shaded area represents the 2.5th and the 97.5th percentile of the AUCtau,ss in adults receiving 50 mg and 100 mg tapentadol every 4 hours, respectively. The central black line indicates the 50th percentile (median) of the AUCtau,ss in adults receiving 75 mg tapentadol every 4 hours. Simulated pediatric doses: Oral tapentadol: 1.0 mg/kg in children ≥2 years, 0.75 mg/kg in children 6 month to <2 years, 0.6 mg/kg in children 1 month to <6 months, and 0.5 mg/kg in children from birth to <1 month. Intravenous tapentadol: 0.4 mg/kg in children >7 days, 0.3 mg/kg in preterm. |
Discussion
Population PK Model for Tapentadol in the Pediatric Population from Birth to <18 Years
The tapentadol pediatric program was successful in collecting PK data in pediatric patients enabling full characterization and robust understanding of tapentadol PK in the pediatric population from birth up to <18 years, including preterm infants. This is one of the first pediatric development programs that collected pediatric data for analgesic medication following a systematic, staggered approach, starting from older children to increasingly younger children. The pediatric data not only considered the PK after oral administration but also after IV administration, which enabled identification of the oral drug bioavailability and its changes in early childhood. Whereas in older children several samples were drawn per patient (4–8 samples), in young children (<6 years) just 2 to 4 samples were taken to accommodate for lower total blood volumes in this population. However, the totality of the data supported the correct interpretation of the results in the sparsely sampled patients. The influence of age and weight on CL, V, and F could be identified with both modeling approaches using assumed or estimated allometric scaling exponents.
The developed models were employed to derive drug exposure at steady state for the actual doses applied in the 4 clinical trials (Figures 6 and 7). The established exposures were all in range of the effective AUCs in adults, but mostly within the lower half of the targeted adult exposure range, reflecting the safe approach taken by avoiding exceedance at the high end. In this respect, the skewness of the exposure distribution sets the median slightly ex-centric to accommodate the tail at the high-end. The conservative approach that was thus undertaken is crucial to ensure the safety of the patients in these “first-in-child” trials in each age group. While assuring the safety of the patients, the program delivered PK data enabling the development of the current popPK model at dose levels relevant from an efficacy point of view. With the implemented modeling approach, we could demonstrate that safe and effective doses for tapentadol across age ranges can be predicted based on PK data collected after exposing a relatively low number of patients and withdrawing only a few blood samples.
In addition to the already existing indication for adults, tapentadol OS has recently been approved in the EU for the relief of moderate to severe acute pain (adequately managed only with opioid analgesics) in children from 2 years of age. The approved dose for the pediatric population is 1.25 mg/kg.4 A previous popPK model that was developed for this age group14 was used to select this dose to be tested in a confirmatory efficacy trial in 2-year-old to <18-year-old patients suffering from acute postsurgical pain. The current model could be used to extrapolate the dose that is required to match the exposure in the younger children to that in the older children. However, it should be stressed that use of tapentadol in children below 2 years old has not been approved at this time and extending the use of tapentadol in younger children is therefore currently not recommended.
Factors Influencing Tapentadol PK Parameters Across Age
In the age group 2 years and above, CL and V of tapentadol could adequately be explained using bodyweight as a size descriptor.14 In the current investigation, we also explored younger children and quantified the influence of organ maturation on CL and F. Additionally, two scaling methods for the size effect were compared (assumed or estimated scaling exponents). Independent of the scaling approach, both models showed that maturation of metabolism as well as the oral bioavailability has to be considered to describe the PK changes in young age.
For the systemic metabolism, PMA50 was estimated at about 35 weeks (Table 3), hence 80% of maturation is expected to be achieved at a PMA of about 140 weeks which is equivalent to a postnatal age of about 2 years, assuming a PMA of 40 weeks at birth. When looking at the literature, different levels of UGT2B7, UGT1A9, and UGT1A6 expression in fetus and at birth have been reported, ranging from 1%-10% of adult level for UGT1A6 to 50% of adult levels for UGT1A9.25–27 With respect to the rate of maturation and time to full adult activity, UGT1A9 exhibits the most rapid development with adult expression realized by 12 months of age,28 UGT1A6 with approximately 50% of the adult level achieved by 6 months of age,27 whereas adult levels of UGT2B7 expression take from about 2 months up to 20 years to be achieved.25 The PMA50 reported here should be considered as a composite of all these competing processes. Additionally, both modeling approaches suggested a decrease of bioavailability with age during the first year of life by an exponential decay. This could be mostly explained by the maturation of the UGT enzymes responsible for tapentadol metabolism, resulting in a reduced first-pass effect and higher bioavailability in neonates and infants. A similar observation of higher drug oral bioavailability at young age that decreased with age has been previously reported for morphine, a substrate of UGT2B7.29
Combining the effect of age on the maturation of CL and F and the effect of weight on CL and V leads to a maximum in CL/F and V/F at young age when expressing them on a bodyweight basis (Figures 4 and 5). When applying weight-based dosing this would mean that for equal exposure across all ages, the highest dose is required at an age of 3.5 years following the approach with assumed allometric exponents, and 2.5 years for estimated allometric exponents. For older children, the difference in CL/F/kg to the maximum is relatively small (down to 76% of the maximum for assumed allometric exponents and down to 60% for estimated allometric exponents). For younger children, a slightly larger difference follows from the models (down to 44% of the maximum for assumed allometric exponents and 51% for estimated allometric exponents). Watson et al demonstrated that a fixed dose for children aged 2 years and above of 1.25 mg/kg is warranted, since the difference in CL/F over age is minor compared to the weight and random variation within the different age groups.14 This means that even in the presence of age-related changes such as body size, oral bioavailability and maturation of metabolic enzymes on tapentadol systemic exposure, a simple oral dosing regimen expressed in mg/kg could be established and justified for children aged at least 2 years.
Estimated versus Assumed Allometric Exponents
Although both assuming and estimating the allometric scaling exponents led to similar insights with respect to the PK of tapentadol in children, there were some differences that need to be addressed. Obviously, estimating the exponents improved the flexibility of describing the changes of the PK parameters with age, and thus led to a lower objective function value and more prominent maximum in the CL and V per kg bodyweight (please compare Figures 4 and 5). The estimated exponents from the totality of the data came close to the exponents that were reported by Watson et al14 based on data for children aged 2 years and above: 0.603 versus 0.638 for CL and 0.820 versus 0.847 for V. On the other hand, fixing the exponents to the theoretical values of 0.75 and 1 for CL and V as a priori known values narrowed the uncertainty of the estimated parameter (PMA50) in CL maturation function (Table 3). The latter approach is possibly of more interest to regulatory authorities and academic institutions in case several compounds are to be evaluated and compared with regard to their maturation characteristics, as it would prevent compensation effects if the estimated allometric exponents for the compound of interest are remote from what is expected from similar compounds. The European Medicines Agency (EMA) Modeling and Simulation Working Party (MSWP) considers the use of assumed exponents both scientifically justified and practical when developing popPK models in children and that regardless of whether estimated or assumed allometric exponents are used, the selected approach should be scientifically justified.30 However, to the best of our understanding, the MSWP does not encourage the simultaneous estimations of maturation functions and allometric exponents in lower ages30 due to the high correlation between bodyweight and age in pediatric patients.31
From a numerical point of view, the two approaches led to comparable results for oral administration. At full maturation, the derived CL/F, V/F, and absorption rate constant after oral administration using either one of the approaches are in good agreement with those previously reported in an adult popPK model for the IR tapentadol.19 In the adult model, the reported CL/F of 214 L/h compares very well to the estimated CL/F of 271 and 244 L/h in the pediatric models presented here with assumed or estimated allometric scaling exponents for a 70 kg reference weight. Also, the values of V/F and Ka of 1170 L and 2.06 h−1 correlate well with those predicted in this work (V/F= 1186 L and 1018 L, Ka= 2.19 h−1 and 2.16 h−1, respectively, for assumed or estimated allometric scaling exponents). In addition, pediatric simulations showed that maximum serum concentrations of tapentadol after a single oral solution dose in pediatrics were typically observed at around 1.3–1.5 h after administration, regardless of the scaling approach, which is comparable to the reported value of 1.25 h in adults.3 Looking over the whole age range, the ratio between the established population curves for CL/F and V/F according to the two approaches is within bioequivalence margins except for children below 5 weeks where the difference increases outside the margins with the largest difference at birth. The most noticeable difference between the two approaches occurs with respect to the estimated F as a function of age and consequently, the estimates of CL and V. Table 3 shows that estimated bioavailability at full maturation when using the assumed allometric exponents (0.349) best resembles the values in adults (0.3210). To conclude, regardless of the approach for the allometric scaling exponents, the PK parameters estimated from the data lead to similar conclusions with respect to the exposure distributions for the different age groups.
Conclusion
Sufficient data have been collected in the pediatric program of tapentadol, which enabled full characterization and robust understanding of tapentadol PK in the pediatric population from birth to <18 years, including preterm infants. The selected doses in the pediatric trials resulted in drug concentrations that were safe and in the range of adult efficacious exposure. The developed popPK model was able to identify the contribution of size-related (bodyweight) and function-related (maturation) factors on tapentadol CL, V, and F. Moreover, tapentadol PK were explored with two different approaches of popPK modeling, ie, with assumed or estimated allometric scaling exponents, and it has been shown that the inferences are similar for oral administration when looking at CL/F and V/F. If feasible, it is important to use both approaches to evaluate the sensitivity of the inferences of the PK parameters to the selected allometric scaling approach when developing pediatric popPK models; this may facilitate a greater understanding and be used in a broader context than for the determination of a dosing regimen of the drug being modelled. This comprehensive model can support the design and data analysis of future pediatric trials (including trials studying other tapentadol formulations) to overcome commonly encountered limitations such as sparse blood sampling and low number of available pediatric subjects.
Abbreviations
AUC, area under the curve; CDC, Centers for Disease Control and Prevention; CI, confidence interval; CL, clearance; EBE, Empirical Bayesian Estimate; EMA, European Medicines Agency; EU, European Union; F, oral availability; IR, immediate release; IV, intravenous; LLOQ, lower limit of quantification; MSWP, Modeling and Simulation Working Party; OFV, objective function value; OS, oral solution; PI, prediction interval; PK, pharmacokinetics; PMA, postmenstrual age; PNA, postnatal age; PO, oral; pop, population; UGT, uridine 5ʹ-diphospho-glucuronosyltransferase; V, volume of distribution; VPC, visual predictive checks.
Data Sharing Statement
Any request for data should be submitted via the following website: https://www.grunenthal.com/en/r-d-vision-mission/clinical-trials/data-sharing-clinical-trials.
Acknowledgments
Data for this analysis were collected in four trials. All trials were funded by Grünenthal GmbH; NCT01134536 in collaboration with Janssen Research & Development, LLC. The authors thank all patients, parents/legal guardians, investigators, and site teams involved in these trials. This analysis was funded by Grünenthal GmbH. Editorial assistance was provided by Elke Grosselindemann and Martin Brett and was paid for by Grünenthal GmbH.
Disclosure
EW, JF, SLC and TMT were employees of Grünenthal GmbH at the time of the analysis. All other authors (FK, CL, and ME) are current employees of Grünenthal GmbH. The authors report no other potential conflicts of interest for this work.
References
1. Schröder W, Tzschentke TM, Terlinden R, et al. Synergistic interaction between the two mechanisms of action of tapentadol in analgesia. J Pharmacol Exp Ther. 2011;337:312–320. doi:10.1124/jpet.110.175042
2. Electronic Medicines Compendium. Palexia 50 mg film-coated tablets. Available from: https://www.medicines.org.uk/emc/product/5159/smpc.
3. Electronic Medicines Compendium. Palexia oral solution 20 mg/mL. Available from: https://www.medicines.org.uk/emc/product/5346/smpc.
4. Health Products Regulatory Authority. Palexia 4 mg/mL oral solution. Available from: https://www.hpra.ie/img/uploaded/swedocuments/Licence_PA2242-012-010_04032020131343.pdf.
5. Eerdekens M, Beuter C, Lefeber C, van den Anker J. The challenge of developing pain medications for children: therapeutic needs and future perspectives. J Pain Res. 2019;12:1649–1664. doi:10.2147/JPR.S195788
6. Finkel JC, Goldberg J, Rosenburg R, et al. First evaluation of tapentadol oral solution for the treatment of moderate to severe acute pain in children aged 6 to < 18. J Pain Res. 2019;12:1925–1936.
7. Muse D, Tarau E, Lefeber C, et al. Pharmacokinetics, safety, and efficacy of tapentadol oral solution for treating moderate to severe pain in pediatric patients. J Pain Res. 2019;12:1777–1790. doi:10.2147/JPR.S197039
8. Beuter C, Volkers G, Radic T, Goldberg J, van den Anker J. Efficacy and safety of multiple doses of tapentadol oral solution in the treatment of moderate to severe acute pain in children aged 2 to <18 years–a randomized, double-blind, placebo-controlled trial. J Pain Res. 2019;12:3099–3112.
9. Eissa A, Tarau E, Beuter C, et al. Tapentadol for the treatment of moderate-to-severe acute pain in children under the age of two years. J Pain Res. In press 2020.
10. Göhler K, Brett M, Smit JW, Rengelshausen J, Terlinden R. Comparative pharmacokinetics and bioavailability of tapentadol following oral administration of immediate- and prolonged-release formulations. Int J Clin Pharmacol Ther. 2013;51:338–348. doi:10.5414/CP201722
11. Terlinden R, Kogel BY, Englberger W, Tzschentke TM. In vitro and in vivo characterization of tapentadol metabolites. Methods Find Exp Clin Pharmacol. 2010;32:31–38. doi:10.1358/mf.2010.32.1.1434165
12. Terlinden R, Ossig J, Fliegert F, Lange C, Göhler K. Absorption, metabolism, and excretion of 14C-labeled tapentadol HCl in healthy male subjects. Eur J Drug Metab Pharmacokinet. 2007;32:163–169. doi:10.1007/BF03190478
13. Nafziger AN, Barkin RL. Opioid therapy in acute and chronic pain. J Clin Pharmacol. 2018;58(9):1111–1122. doi:10.1002/jcph.1276
14. Watson E, Khandelwal A, Freijer J, van den Anker J, Lefeber C, Eerdekens M. Population pharmacokinetic modeling to facilitate dose selection of tapentadol in the pediatric population. J Pain Res. 2019;12:2835–2850. doi:10.2147/JPR.S208454
15. Kearns GL, Abdel-Rahman SM, Alander SW, Blowey DL, Leeder JS, Kauffman RE. Developmental pharmacology—drug disposition, action, and therapy in infants and children. N Engl J Med. 2003;349(12):1157–1167. doi:10.1056/NEJMra035092
16. West GB, Brown JH, Enquist BJ. A general model for the origin of allometric scaling laws in biology. Science. 1997;276(5309):122–126. doi:10.1126/science.276.5309.122
17. Anderson BJ, Holford NHG. Mechanism-based concepts of size and maturity in pharmacokinetics. Annu Rev Pharmacol Toxicol. 2008;48:303–332. doi:10.1146/annurev.pharmtox.48.113006.094708
18. Mahmood I. Dosing in children: a critical review of the pharmacokinetic allometric scaling and modelling approaches in paediatric drug development and clinical settings. Clin Pharmacokinet. 2014;53(4):327–346. doi:10.1007/s40262-014-0134-5
19. Xu XS, Smit JW, Lin R, Stuyckens K, Terlinden R, Nandy P. Population pharmacokinetics of tapentadol immediate release (IR) in healthy subjects and patients with moderate or severe pain. Clin Pharmacokinet. 2010;49(10):671–682. doi:10.2165/11535390-000000000-00000
20. Germovsek E, Barker CI, Sharland M, Standing JF. Scaling clearance in paediatric pharmacokinetics: all models are wrong, which are useful? Br J Clin Pharmacol. 2017;83:777–790. doi:10.1111/bcp.13160
21. Jonsson EN, Karlsson MO. Xpose–an S-PLUS based population pharmacokinetic/pharmacodynamic model building aid for NONMEM. Comput Methods Programs Biomed. 1999;58:51–64. doi:10.1016/S0169-2607(98)00067-4
22. Lindbom L, Ribbing J, Jonsson EN. Perl-speaks-NONMEM (PsN)–a Perl module for NONMEM related programming. Comput Methods Programs Biomed. 2004;75:85–94. doi:10.1016/j.cmpb.2003.11.003
23. Holford N, Heo YA, Anderson B. A pharmacokinetic standard for babies and adults. J Pharm Sci. 2013;102(9):2941–2952. doi:10.1002/jps.23574
24. National Center for Health Statistics in collaboration with the National Center for Chronic Disease Prevention and Health Promotion. Available from: http://www.cdc.gov/growthcharts/who_charts.htm and https://www.cdc.gov/growthcharts/percentile_data_files.htm.
25. Rowland A, Miners JO, Mackenzie PI. The UDP-glucuronosyltransferases: their role in drug metabolism and detoxification. Int J Biochem Cell Biol. 2013;45:1121–1132. doi:10.1016/j.biocel.2013.02.019
26. De Wildt SN, Kearns GL, Leeder JS, van den Anker JN. Glucuronidation in humans—pharmacogenetic and developmental aspects. Clin Pharmacokinet. 1999;36:439–452. doi:10.2165/00003088-199936060-00005
27. Miyagi SJ, Collier AC. The development of UDP-glucuronosyltransferases 1A1 and UGT1A6 in the pediatric liver. Drug Metab Dispos. 2011;39:912–919. doi:10.1124/dmd.110.037192
28. Miyagi SJ, Milne AM, Coughtrie MW, Collier AC. Neonatal development of hepatic UGT1A9: implications of pediatric pharmacokinetics. Drug Metab Dispos. 2012;40:1321–1327. doi:10.1124/dmd.111.043752
29. Liu T, Lewis T, Gauda E, Gobburu J, Ivaturi V. Mechanistic population pharmacokinetics of morphine in neonates with abstinence syndrome after oral administration of diluted tincture of opium. J Clin Pharmacol. 2016;56(8):1009–1018. doi:10.1002/jcph.696
30. European Medicines Agency. Modelling and simulation: questions and answers. Available from: https://www.ema.europa.eu/en/human-regulatory/research-development/scientific-guidelines/clinical-pharmacology-pharmacokinetics/modelling-simulation-questions-answers.
31. Bonate PL. The effect of collinearity on parameter estimates in nonlinear mixed effects models. Pharm Res. 1999;16(5):709–717. doi:10.1023/A:1018828709196
 © 2020 The Author(s). This work is published and licensed by Dove Medical Press Limited. The full terms of this license are available at https://www.dovepress.com/terms.php and incorporate the Creative Commons Attribution - Non Commercial (unported, v3.0) License.
By accessing the work you hereby accept the Terms. Non-commercial uses of the work are permitted without any further permission from Dove Medical Press Limited, provided the work is properly attributed. For permission for commercial use of this work, please see paragraphs 4.2 and 5 of our Terms.
© 2020 The Author(s). This work is published and licensed by Dove Medical Press Limited. The full terms of this license are available at https://www.dovepress.com/terms.php and incorporate the Creative Commons Attribution - Non Commercial (unported, v3.0) License.
By accessing the work you hereby accept the Terms. Non-commercial uses of the work are permitted without any further permission from Dove Medical Press Limited, provided the work is properly attributed. For permission for commercial use of this work, please see paragraphs 4.2 and 5 of our Terms.