")
Back to Journals » Infection and Drug Resistance » Volume 15
Population Pharmacokinetics of Levofloxacin and Moxifloxacin, and the Probability of Target Attainment in Ethiopian Patients with Multidrug-Resistant Tuberculosis
Authors Sidamo T , Rao PS, Aklillu E , Shibeshi W, Park Y, Cho YS, Shin JG, Heysell SK, Mpagama SG, Engidawork E
Received 17 September 2022
Accepted for publication 11 November 2022
Published 28 November 2022 Volume 2022:15 Pages 6839—6852
DOI https://doi.org/10.2147/IDR.S389442
Checked for plagiarism Yes
Review by Single anonymous peer review
Peer reviewer comments 3
Editor who approved publication: Prof. Dr. Héctor Mora-Montes
Temesgen Sidamo,1 Prakruti S Rao,2 Eleni Aklillu,3 Workineh Shibeshi,1 Yumi Park,4,5 Yong-soon Cho,4,5 Jae-Gook Shin,4,5 Scott K Heysell,2 Stellah G Mpagama,6 Ephrem Engidawork1
1Department of Pharmacology and Clinical Pharmacy, School of Pharmacy, College of Health Sciences, Addis Ababa University, Addis Ababa, Ethiopia; 2Division of Infectious Diseases and International Health, University of Virginia, Charlottesville, VA, USA; 3Department of Laboratory of Medicine, Karolinska Institutet, Karolinska University Hospital Huddinge, Stockholm, Sweden; 4Department of Pharmacology and PharmacoGenomics Research Center, Inje University College of Medicine, Busan, Republic of Korea; 5Center for Personalized Precision Medicine of Tuberculosis (cPMTb), Inje University College of Medicine, Busan, Republic of Korea; 6Kibong’oto Infectious Diseases Hospital, Sanya Juu, Tanzania
Correspondence: Ephrem Engidawork, Department of Pharmacology and Clinical Pharmacy, School of Pharmacy, College of Health Sciences, Addis Ababa University, P.O. Box 9086, Addis Ababa, Ethiopia, Email [email protected]
Objective: This study aimed to explore the population pharmacokinetic modeling (PopPK) of levofloxacin (LFX) and moxifloxacin (MXF), as well as the percent probability of target attainment (PTA) as defined by the ratio of the area under the plasma concentration-time curve over 24 h and the in vitro minimum inhibitory concentration (AUC0-24/MIC) in Ethiopian multidrug resistant tuberculosis (MDR-TB) patients.
Methods: Steady state-plasma concentration of the drugs in MDR-TB patients were determined using optimized liquid chromatography-tandem mass spectrometry. PopPK and simulations were run at various doses, and pharmacokinetic parameters were estimated. The effect of covariates on the PK parameters and PTA for maximum mycobacterial kill and resistance prevention was also investigated.
Results: LFX and MXF both fit in a one-compartment model with adjustments. Serum-creatinine (Cr) influenced (p = 0.01) the clearance of LFX, whereas body mass index (BMI) influenced (p = 0.01) the apparent volume of distribution (V) of MXF. The PTA for LFX maximal mycobacterial kill at the critical MIC of 0.5 mg/L with the simulated 750 mg, 1000 mg, and 1500 mg doses were 29%, 62%, and 95%, respectively, whereas the PTA for resistance prevention at 1500 mg was only 4.8%, with none of the lower doses achieving this target. At the critical MIC of 0.25 mg/L, there was no change in the PTA for maximum bacterial kill when the MXF dose was increased (600 mg, 800 mg, and 1000 mg), but the PTA for resistance prevention was improved.
Conclusion: The standard doses of LFX and MXF may not provide adequate drug exposure. PopPK of LFX is more predictable for maximum mycobacterial kill, whereas MXF’s resistance prevention target increases with dose. Cr and BMI are likely important covariates for dose optimization in Ethiopian patients.
Keywords: population pharmacokinetics, probability of target attainment, moxifloxacin, levofloxacin, MDR-TB patients, Ethiopia
Introduction
Fluoroquinolones (FQs) are used off-label for the treatment of multidrug-resistant tuberculosis (MDR-TB), and for evaluation in shortening the duration of drug susceptible TB in recently prioritized regimens.1 Within the class, levofloxacin (LFX) and moxifloxacin (MXF) play a substantial role in ensuring success in treatment outcomes and are important components of the World Health Organization (WHO) Group A regimen.2–5 However, pharmacokinetic (PK) variability within and between individuals is very common and may lead to suboptimal plasma levels and undesired treatment outcomes.6–8 The observed FQs PK variability may be due to comorbidities (diabetes mellitus or HIV) that contribute to malabsorption, concomitant medications, dietary intake, medication adherence, or host pharmacogenetics, and can impact other PK drivers such as drug metabolism.9–11 Dosage optimization based on an understanding of plasma exposure profile of FQs in patients (PK factor) and in vitro drug susceptibility patterns (PD factor) of Mycobacterium tuberculosis (Mtb) may improve treatment outcomes.12,13
The ratio of the 24 h area under the concentration-time curve (AUC) and in vitro minimum inhibitory concentration (MIC) (AUC0-24/MIC) has been accepted as the strongest predictor of FQs exposure and favorable clinical outcome.14–16 A hollow fiber bioreactor system (HFS) experiment has established that an unbound AUC0-24/MIC ratio of 53 for MXF substantially decreases the total population of Mtb by more than 3 log10 CFU/mL and suppresses the emergence of drug resistance. Moreover, an AUC0-24/MIC ratio of ≥100 for MXF completely kills FQ-sensitive population of Mtb without development of drug resistance.17,18 Another HFS experiment with LFX recently showed that the AUC0-24/MIC associated with maximal Mtb killing was 146, while the ratio associated with resistance suppression was 360. The experiment suggested that up to 1500 mg LFX doses are needed for best microbial killing if adverse effects are not an issue.19
Even though Ethiopia has recently transitioned out of the MDR-TB/Rifampicin resistant (RR)-TB world countries list, it remains on the list of 30 high TB/HIV burden countries.20 People of diverse ethnic background live in Ethiopia, although one-size-fits-all scenario is practiced in TB therapeutics.21,22 Evidence of interindividual variability (IIV), drug exposure profiles in MDR-TB patients and its impact on treatment outcomes are lacking. To the best of our knowledge, the PK of LFX and MXF among Ethiopian patients treated for MDR-TB is not yet studied. Furthermore, whether adequate in vivo serum exposure is attained with the current standard dose to achieve maximal bacterial kill and prevent resistance is not yet explored. The aim of this study was therefore to determine the population pharmacokinetic modeling (PopPK) of LFX and MXF and the probability of target attainment (PTA) for maximal mycobacterial kill and prevention of resistance in a group of people treated for MDR-TB in Ethiopia.
Materials and Methods
Study Setting and Design
This is a follow-up of our previous prospective cohort study,23 enrolling MDR-TB/RR-TB patients in four hospitals of Southern Ethiopia, namely, Butajira, Yirgalem, Arbaminch, and Nigist Eleni Mohammed Memorial teaching hospitals. These hospitals were among the first four hospitals identified by the Ministry of Health of Ethiopia as treatment initiative centers for MDR-TB treatment in Southern Ethiopia.
Participant Eligibility
As recommended by the recently integrated WHO Treatment Guidelines,24 eligible study participants were outpatients who visited the center monthly for drug refills and treatment response monitoring. MDR-TB patients aged 18 years and older with or without co-infection with HIV, receiving LFX (750 or 1000 mg/day) – or MXF (600 mg/day)-based regimens for at least 8 days (see Ref 23 for details of regimens) and provided written informed consent were included. Those severely ill and anemic defined by a hematocrit less than 25% (most recent value, measured within 30 days of the PK study) were excluded. All patients included in this study received standard TB treatment according to the National Guidelines for Tuberculosis and Leprosy, which is adopted from the WHO Guidelines.25,26
Variables, Sample Collection and Bioanalysis
Demographic, clinical and laboratory data were collected using a data abstraction form by trained public health specialists in each hospital. Upon giving informed consent, the patients were asked to stay for 48 h at the centres for blood sampling during one of their monthly visits. About 4 mL blood was drawn using a vacutainer (Becton–Dickinson Biosciences, San Jose, CA, USA) in EDTA tubes at 0 (pre-dose sampling), 2, 4, 6, 9, 12, and 24 h following drug intake. After mixing the blood with the anticoagulant, plasma was immediately separated, and the test tubes were appropriately labeled. The samples were transported to Wolaita Sodo University Hospital, stored at −80°C and then shipped to Inje University College of Medicine, South Korea for bioanalysis. Plasma concentrations of LFX and MXF were determined using a high-performance liquid chromatography-electrospray ionization–tandem mass spectrometry previously developed and validated by the Inje University research group.27
Determination of Minimum Inhibitory Concentration
MICs of the second-line antitubercular drugs were determined from patients for whom pre-treatment clinical isolates of Mtb were available. MIC was determined using the broth microdilution method in Middlebrook 7H9 broth supplemented with 10% Oleic Albumin Dextrose Catalase (OADC) and 0.05% tyloxapol.28 M. tuberculosis H37Rv (ATCC 27294) was used as the reference strain and its targeted MIC values were in the range of 0.0625–8.0 mg/L for LFX and 0.0625–16.0 mg/L for MXF.
Pharmacokinetic Model Development
Structural Model
Individual PK profiles for both LFX and MXF were estimated using a non-compartmental approach in Phoenix WinNonlin version 8.0 (Certara, Princeton, NJ, USA) and maximum plasma concentration (Cmax) and AUC0–24 were calculated and reported as mean ± S.E and median (IQR). The PopPK was developed using nonlinear mixed effect modelling (Phoenix NLME) and analysis of covariates was performed. First-order conditional estimation algorithms were used for model development. Various structural models were tested, including one or two compartment distributions with first-order absorption and elimination (with or without absorption lag time). Additive, proportional, and combined residual error models were also tested. Model selection was based on model fit and visual inspection of diagnostic plots, the precision of parameter estimation, minus two log likelihood (−2LL) value, and Akaike information criterion (AIC) and Bayesian information criterion (BIC). The reliability of the final model was assessed by the 95% confidence intervals (CIs) of the 2.5th and 97.5th percentiles of the simulated concentration-time profile. The PK parameters of a typical population along with their IIV were estimated using an exponential function. The PopPK estimated PK parameters were reported in terms of geometric mean (GM) and percent relative standard error (%RSE) while IIV was reported in terms of percent coefficient of variability (%CV).
Covariates
Based on previous similar studies and scientific interest, we included the following covariates in the current PopPK: nutritional status, gender, serum creatinine (Cr), adverse drug effects, comorbidities, alanine aminotransferase (AAT), aspartate aminotransferase (AST), bilirubin, and body mass index (BMI). The covariate selection was performed by forward addition (p = 0.05) and backward subtraction (p = 0.01). Visual predictive checks (VPCs) based on 1000 Monte Carlo simulations were performed to assess robustness of the final model. For continuous covariates, a power function was used using Equation 1:

Where TVPi is the typical value of a PK parameter (P) for an individual i with a COVi value of the covariate, while θ1 is the typical value for an individual with a mean covariate value of COVmean and θ2 is the power coefficient describing covariate parameter relationship.
For binary covariates, the fractional change in the typical parameter values was determined according to Equation 2:

where TVPi is as defined in Equation 1 above, θ1 is the typical value for an individual in whom the covariate takes the value 0 (N= 0), and θ2 is the fractional change in the typical value when the covariate takes the value 1 (N = 1).
Interindividual Variability
Distributions of IIV were assumed to be log-normal and described by the following exponential error model (Equation 3):
Where Pi is the parameter value for an individual i, TVP is the typical population value of the parameter, and ηPi (ETAs) are individual-specific IIV for an individual i and the parameter P. ETAs were assumed to be normally distributed with a mean of 0 and variances of  . For all PK parameters, IIV was estimated and described as percent coefficient of variability (%CV).
Residual Error
The residual error model was described by both combined additive and proportional error models for individual and population predicted plasma concentrations as depicted in Equations 4 and 5, respectively:


Where DVij is the observed plasma concentration of the individual i at time j, IPRED is the corresponding model predicted concentration, and PRED is the population predicted plasma concentration, ε1ij and ε2ij are proportional and additive components, respectively, of the residual random error. The residual error components were assumed to be normally distributed with a mean of 0 and variances of 
Drug Exposure and the Percent Probability of Target Attainment
The final model was used to construct simulated PK profiles for individual patients at various doses (using individual PK parameters and covariates, assuming dose-independent PK) and to calculate % PTA. The simulated doses of LFX were 750 mg, 1000 mg and 1500 mg, while those of MXF were 600 mg, 800 mg, and 1000 mg. Cmax and AUC0-24 were calculated using the individual simulated profiles. Box plots were used to show simulated concentrations and patient exposure (Cmax and AUC0-24) for each drug.
Using the assumed MIC based on those values determined for some patients involved in this study, and excluding those values well above the typical cut-off for resistance, the %PTA as defined by AUC0-24/MIC ratio for each MIC value for the original and simulated doses of LFX and MXF was analyzed descriptively. The number of patients achieving a specific target AUC0-24/MIC was described in % PTA against the total observations. The targets selected for the maximal mycobacterial kill and resistance suppression in the mutant strains for LFX were 146 and 360, respectively.19 Similarly, the two targets selected for MXF were 53 and 100, respectively.17,18 The formula we used for the PTA calculation was:

Ethical Considerations
This study was conducted in accordance with the Declaration of Helsinki. Ethical approval was obtained from both the Institutional Review Board of College of Health Sciences, Addis Ababa University (Protocol number 078/17/Pharma) and the National Ethical Review Committee of the Ministry of Science and Higher Education (Reference number MoSHE//RD/141/2318/19). Written informed consent was obtained after participants were informed about the purpose, benefits, and risks of the study. Confidentiality and anonymity were ensured by restricting access and removing identifiers.
Results
Patient Characteristics
There were 62 MDR/RR-TB patients for a potential PK sampling, out of which 7 were excluded due to critical illness. Plasma samples were therefore obtained from 55 patients. Of these, a total of 39 patients (21 for LFX and 18 for MXF) had adequate sample collection and plasma concentration with acceptable concentration-time profiles. Samples with lower than 5 time-point concentrations over 24 h and those with erratic concentration profiles were excluded from the analysis. Demographic, laboratory, and clinical characteristics of the patients are summarized in Table 1. There were no statistically significant differences in baseline characteristics between the LFX and MXF groups. Of the 39 patients included in the analysis, 19 patients (9 from LFX-and 10 from MXF-based regimen treatment group) had encountered at least one ADRs during the follow-up.
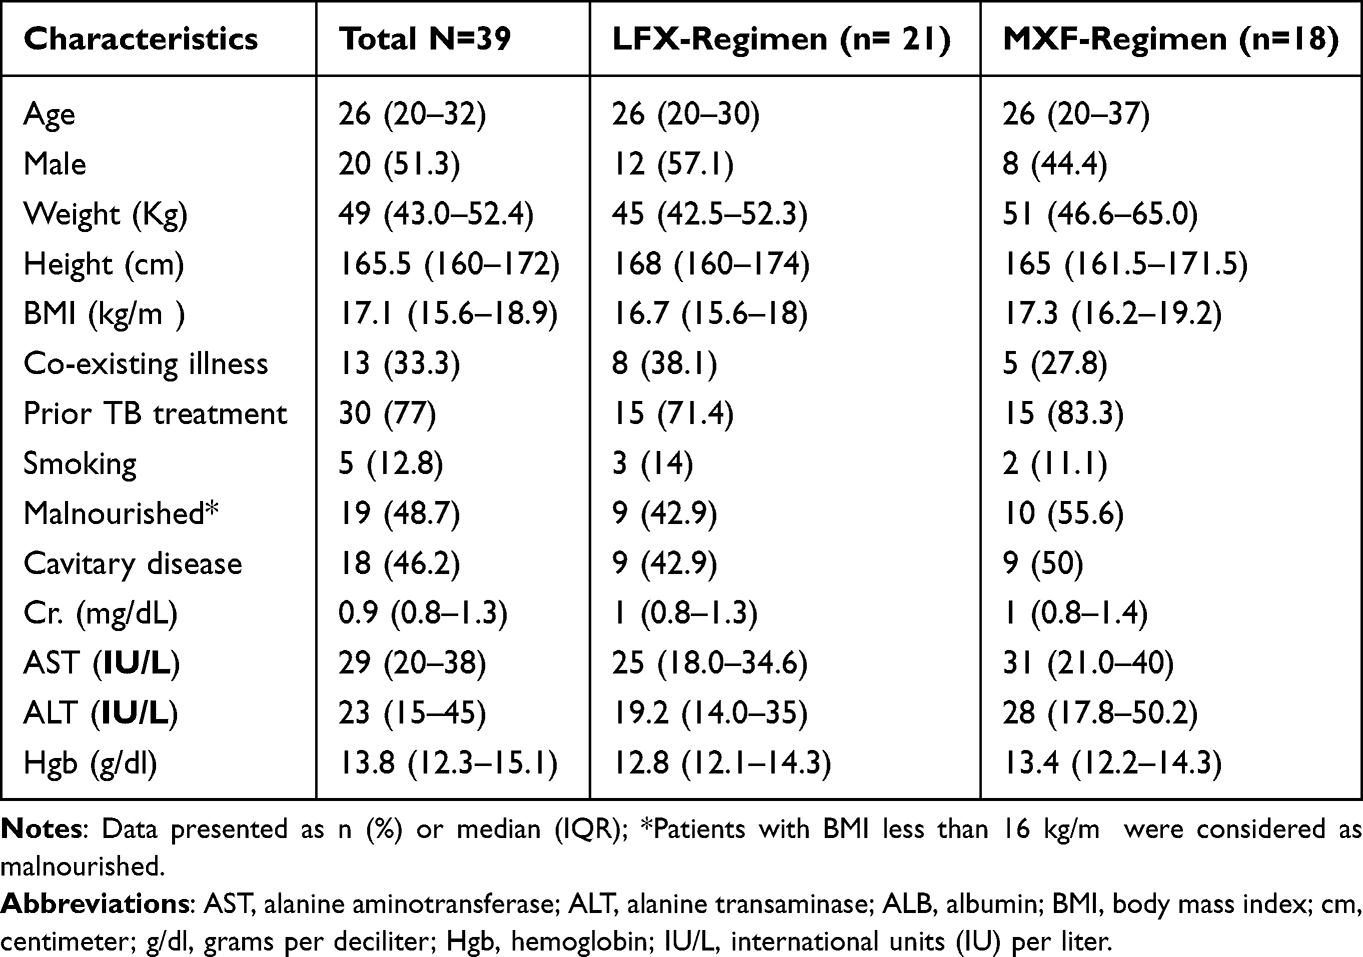 |
Table 1 Demographic and Clinical Characteristics of Ethiopian MDR-TB Patients Recieving the Standardized LFX- (n=21) and MXF- (n=18) Based Regimen |
The Population PK Model
Whilst the LFX dataset fits into a one-compartment model that includes both additive and multiplicative error models with lag time, the MXF dataset fits into a one-compartment model with additive error models without lag time. Residual variation was taken into account for all parameters. Table 2 shows the PopPK estimates in GM and %RSE, and IIV as %CV of the PK parameters for both groups. The Goodness-of-fit of the final model for LFX and MXF is summarized in Figure 1. VPCs for both models showed that most of the data are within the 90% prediction interval and around median values (Figure 2). Upon performing a stepwise search for covariates, the −2LL value was significantly reduced in scenarios, where Cr was used as a covariate for clearance (CL) of LFX data set. Therefore, this was selected as the final model for LFX. In a similar covariate screen, BMI as the apparent volume distribution (V) covariate, the −2LL score was significantly reduced and this was selected as the final model for MXF.
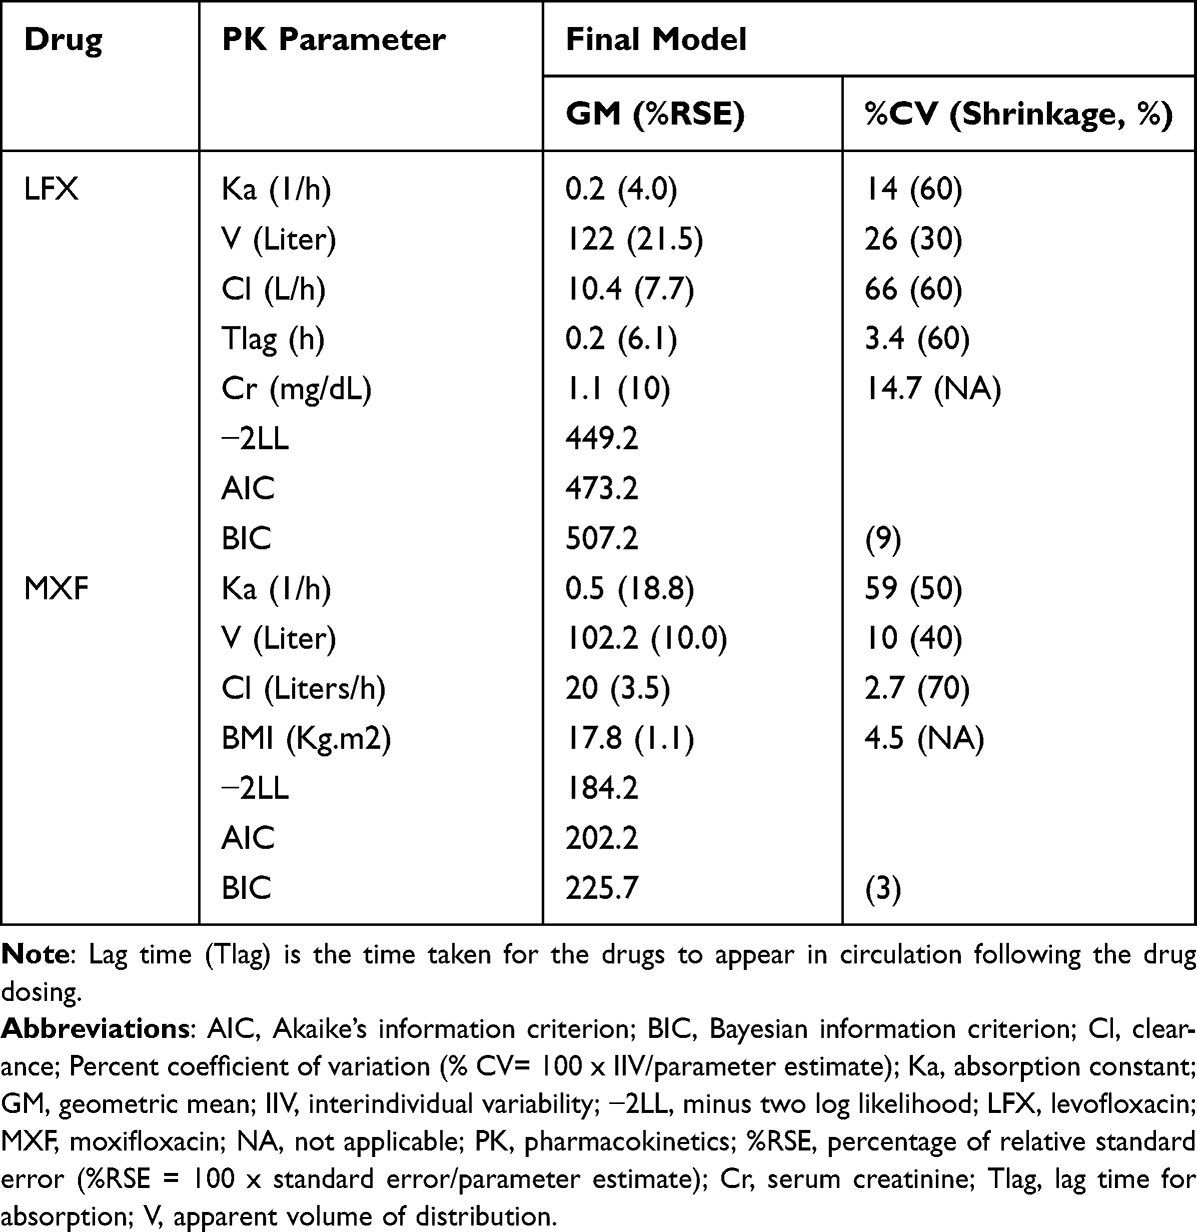 |
Table 2 Overall and Final One-Compartment Model for LFX (n=21) and MXF (n=18), and Covariates Included in the Model in Ethiopian MDR-TB Patients |
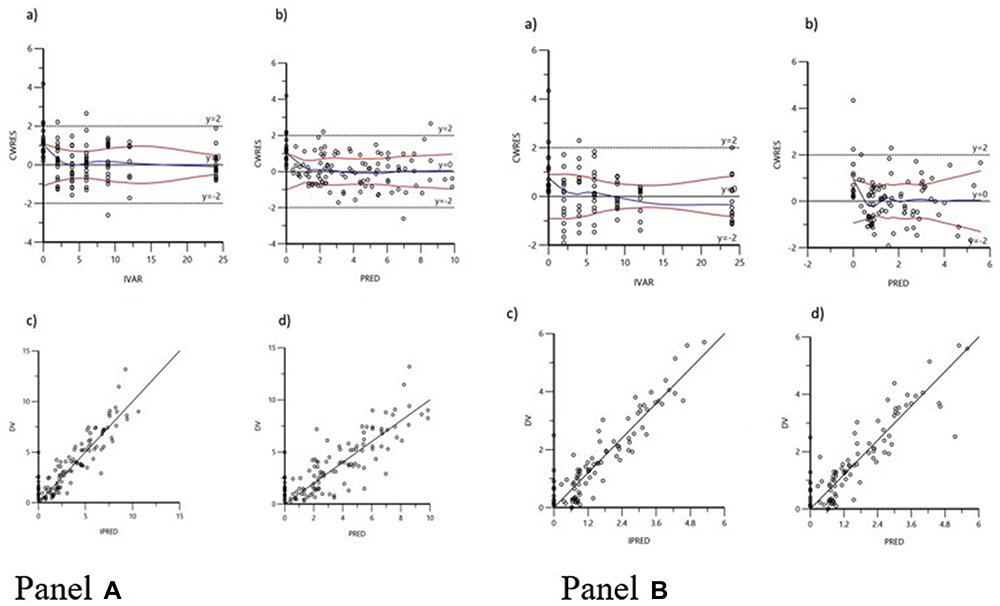 |
Figure 1 Goodness-of-fit plots for the final population pharmacokinetics of LFX (A) and MXF (B): conditional weighted residuals versus time (CWRES versus IVAR) (a); conditional weighted residuals versus population predicted concentrations (CWRES versus PRED) (b); observed versus individual predicted concentrations (DV versus IPRED) (c); observed versus population predicted concentrations (DV versus PRED) (d). The red lines in the panels represent smoothed regression lines. |
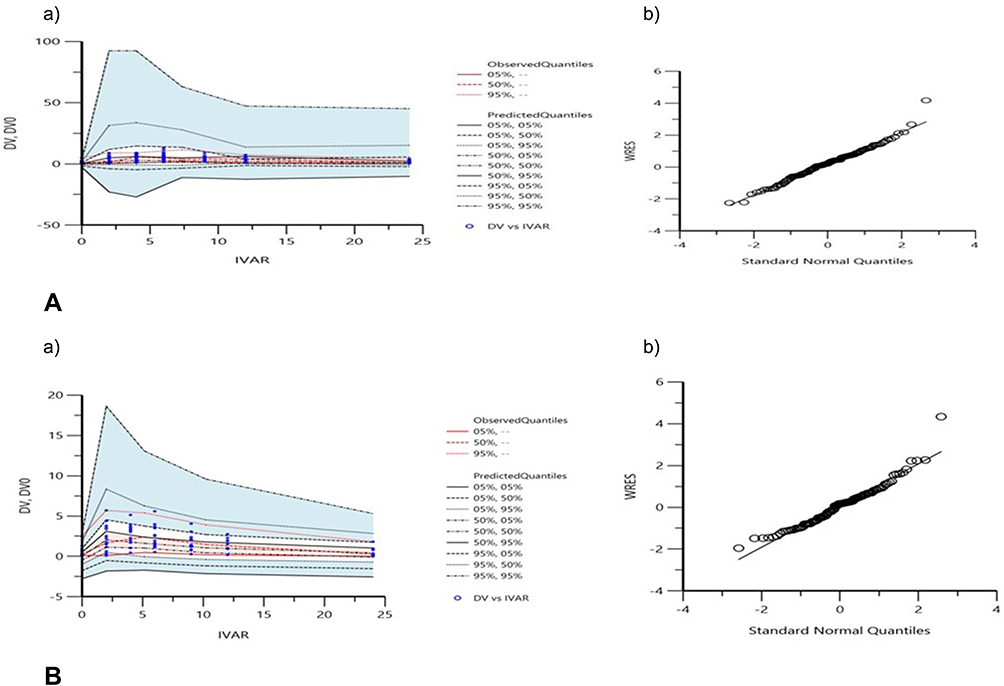 |
Figure 2 Visual predictive checks (a) and WRES versus Standard Normal Quantiles (b) for the final model of LFX (A) and MXF (B): red lines represent the 5th, 50th, and 95th percentiles of the observed concentrations; the shaded areas represent the 90% confidence intervals of the 5th, 50th, and 95th percentiles of the simulated concentrations, respectively; the dots represent the observed data; DV represents observed concentration; DV0, observed concentration at zero time; IVAR, time; WRES, weighted residuals. |
Total Drug Exposure
The individual participants’ mean ± standard error and median (Interquartile range) values of Cmax and AUC0-24 from the non-compartmental analysis of the original and simulated drug doses are summarized in Table 3. Figure 3 depicts box plots of Cmax and AUC0-24 for LFX and MXF.
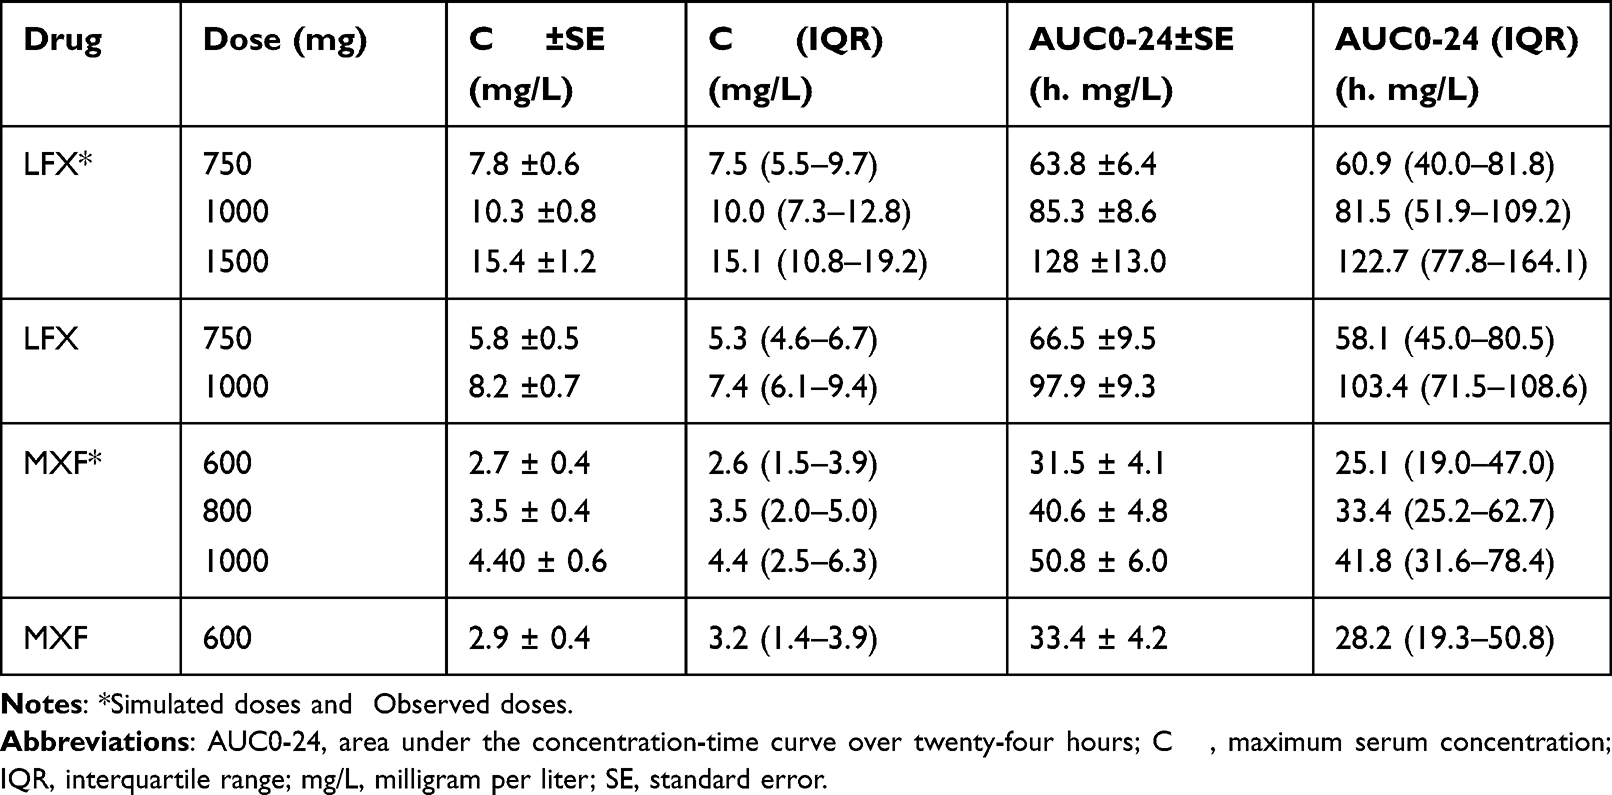 |
Table 3 Descriptive Summary of the Non-Compartmental Analysis of the Estimated Individual PK Parameters for the Original and Simulated Doses of LFX (n=21) and MXF (n=18) in Ethiopian MDR-TB Patients |
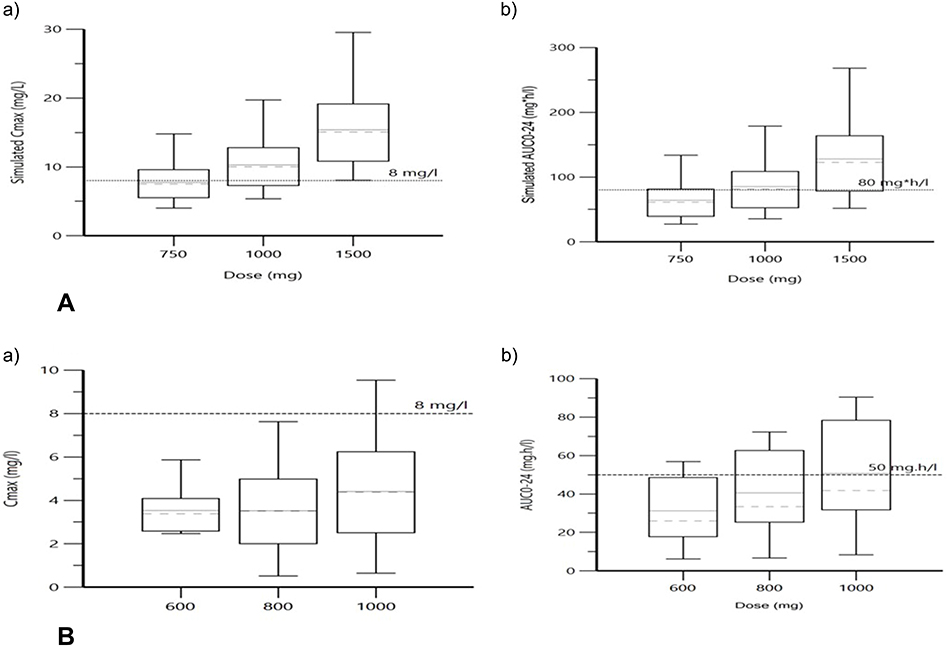 |
Figure 3 Box plot for simulated Cmax (a) and AUC0-24 (b) of LFX (A) and MXF (B): the dashed line indicates the minimum threshold for Cmax and AUC0-24. |
MIC Distribution of the Clinical Isolates
The MIC of LFX and MXF were successfully determined from the clinical isolates of 28 patients. However, the MICs for the remaining clinical isolates could not be determined as they did not grow from subculture after transportation to the referral laboratory. The individual MIC values (percent) for LFX were 0.25 mg/L (46.4%), 0.50 mg/L (42.8%), 2.0 mg/L (3.6%), 4 mg/L (3.6%), and 8 mg/L (3.6%); whereas they were 0.0625 mg/L (25%), 0.125 mg/L (53.6%), 0.25 mg/L (10.7%), 2.0 mg/L (7.1%), and 8.0 mg/L (3.6%) for MXF. Given that the WHO recommended critical susceptibility value for Mtb is 0.5 mg/L for LFX and 0.25 mg/L for MXF, 7.2% of the clinical isolates were resistant to LFX and 10.7% were resistant to MXF.
The Probability of Target Attainment
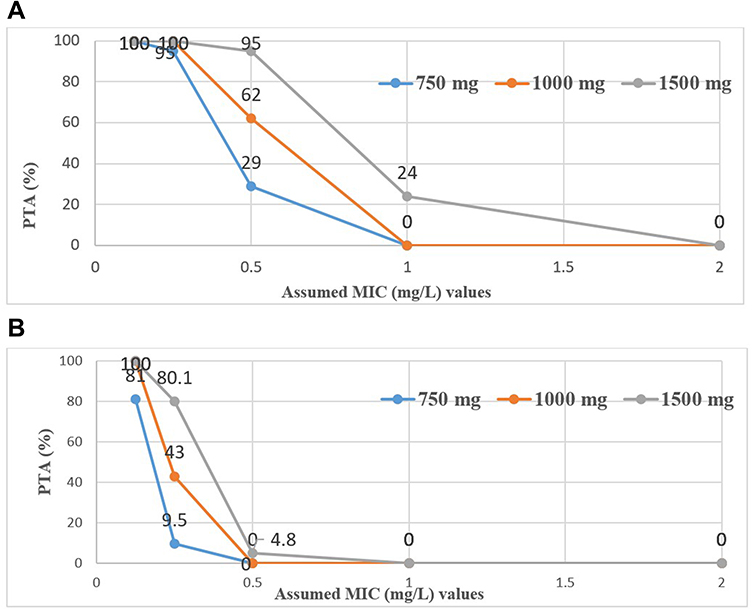
The % PTA for the simulated doses of 750 mg, 1000 mg, and 1500 mg of LFX for the two targets (AUC0-24/MIC ≥ 146, for the mycobacterial kill and AUC0-24/MIC ≥ 360, for resistance suppression) is depicted in Figure 4. At the WHO recommended critical MIC of 0.5 mg/L, the PTAs for the maximal bacterial kill were 29%, 62%, and 95% for the simulated doses of LFX, respectively. As regards to resistance suppression, whilst the 750 mg and 1000 mg LFX did not achieve the PTA needed for resistance suppression, only 4.8% attained the PTA needed with the 1500 mg LXF. Only the 1500 mg LFX achieved 24% PTA for the maximal bacterial kill when the MIC was changed to 1 mg/L. Interestingly, none of the doses were able to attain the PTA for resistance suppression at MIC values ≥1 mg/L.

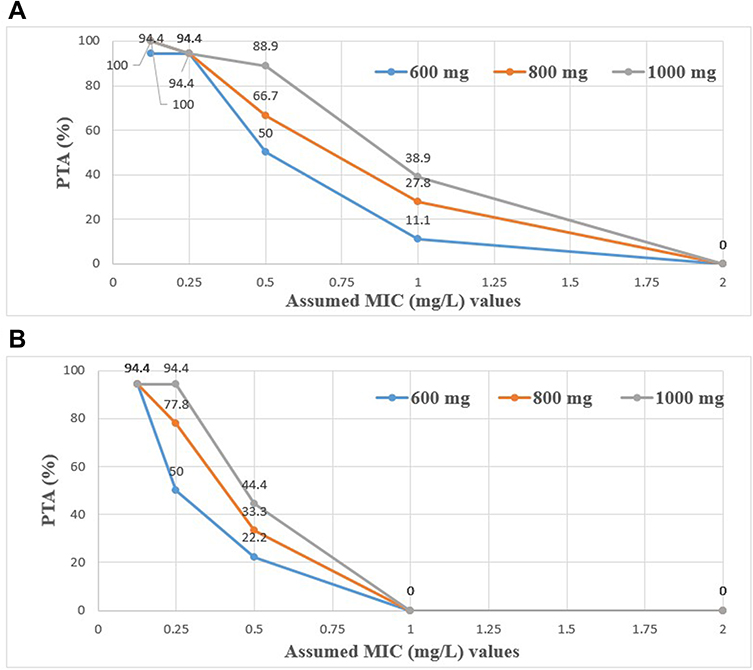
In a similar fashion, the PTA for the simulated doses of 600 mg, 800 mg, and 1000 mg of MXF at the two targets (AUC0-24/MIC ≥ 53, for the mycobacterial kill and AUC0-24/MIC ≥ 100, for resistance suppression) is depicted in Figure 5. At the WHO recommended critical MIC of 0.25 mg/L for MXF, the PTA needed for the maximal mycobacterial kill was the same (94.4%) for all doses. However, the PTA needed for resistance suppression varied with doses, 50%, 77.8%, and 94.4%, respectively. The PTAs calculated for the mycobacterial kill decreased with increasing the MIC value to 1 mg/mL and were 11.1%, 27.8%, and 38.9%, respectively. However, none of the doses achieved the PTA needed for resistance suppression at the MIC value of 1 mg/L and above.

Discussion
In this first PopPK of LFX and MXF in Ethiopian patients treated for MDR-TB, we importantly demonstrated that current doses of both medications led to poor probability of attaining PK targets that have previously been associated with microbial kill and prevention of acquired resistance. While multiple factors may have influenced this underexposure, the observed IIV in PK/PD parameters may result in poor treatment outcomes.29 We also demonstrated that the LXF concentration dataset was described best by a one-compartment model with both additive and multiplicative combination error model with lag time, whereas that of MXF was described best by a one-compartment additive error model with no lag time. MXF and LFX data for MDR-TB patients have been described by a one-compartment model in some previous studies30,31 and by a two-compartment model in others.32,33 The reason for this variation is unclear. The differences in the total sample size and number of plasma samples collected during the elimination phases in the studies could be a reason for the observed variations. For example, MXF PopPK was described by a two-compartment model in 241 MDR-TB patients from South Africa.33 Plasma samples on 10 different occasions were collected over 50 h while in the present study 5 to 7 plasma samples were collected over 24 h. We found that the relative IIV (%CV) of the population estimated Ka was higher in the MXF group than in the LFX group, and the IIV of V and CL was higher in the LFX group than in the MXF group. High shrinkage was observed for some model estimated PK parameters in this study. This might be associated with fewer number observations per subjects as it is consistent with other previous studies.34
Overall, higher doses were predicted to result in improved maximal bacterial kill target for LFX but not for MFX, although MXF achieved resistance prevention targets better than LFX. The AUC0-24 for MXF corrected to a 400 mg standard dose ranged from 10.2 to 79.1 mg.h/L in a study by Van den Elsen et al,35 which compared MXF with and without rifampin. The corresponding AUC0-24 values for the 600 mg in our study ranged from 3.5 to 72.2 mg·h/L. Given that no rifampin was used in our cohort, we expected even higher MXF exposure. At the in vitro critical concentration of 0.25 mg/L, which is currently recommended by WHO to determine susceptibility,35 there was no difference in the PTA (94.4%) needed for the maximal bacterial kill between the lower and higher MXF simulated doses. However, significant improvements in PTA were reached for the target of resistance prevention with the highest simulated MXF dose (1000 mg). Nevertheless, when utilizing an MIC value just a dilution higher at the borderline of susceptible (0.5 mg/ liter) and the target AUC0-24 of 50–65 mg.h/liter,36,37 the PTA needed for the resistance suppression with the 600 mg dose of MXF in Ethiopian patients would be only 22.2%. Yet, at higher simulated doses of 800 mg and 1000 mg, this was improved only to 33.3% and 44.4%, respectively. Ethiopian MDR-TB patients are rarely given a dose of 800 mg MXF based on body weight. Therefore, the current WHO recommendation of a critical concentration of 0.25 mg/L is likely to be accurate for this population, and well-powered interventional studies would be needed to determine if higher doses of MXF improve PTA.
Despite the appeal of a higher starting dose of MXF for optimizing outcomes, our findings may explain a study in Indian MDR-TB patients in a tertiary care center in Mumbai, which found that an increased MXF dosing did not improve treatment outcomes in the presence of low-level resistance to MXF.38 More interestingly, another recent study by Yun et al32 suggested a twice 400 mg instead of a single 800 mg MXF is an optimal dosing regimen for MDR-TB patients because it provides superior efficacy and safety. BMI was shown to have a statistically significant influence on V for MXF. The fact that BMI affected V may justify weight-based dosing of MXF in Ethiopian patients. It is important to note that the median CL and V values of MXF in the Ethiopian MDR-TB patients are greater than previously reported values from European patients.8 This higher CL and V of MXF may explain the lower AUC0-24 of MXF in this study compared to previous studies.35
Genetic diversities in drug transporters in African populations has been reported to have implications for conventional therapies, notably in TB and HIV.39 The study reported the prevalence of genetic variation in UGT1A and ABCB1 genes in black South African TB patients and assessed the effect of these on MXF PK. The study revealed that genetic variation in UGT1A rs8175347 reduced MXF clearance by 20.6%, whereas rs3755319 increased by 11.6%, and the ABCB1 rs2032582 SNP reduced the bioavailability by 40%. Therefore, our findings fit with other recommendations that more rigorous PK and pharmacogenetic studies may be of further benefit in settings such as Ethiopia.40,41
The overall drug exposure of the standard LFX doses (750–1000 mg) in Ethiopian patients was also inadequate. Specifically, the conventional 750 mg LFX dose neither achieved an adequate maximal bacterial kill nor a resistance prevention targets. Moreover, the PTA for the resistance prevention with the highest simulated dose (1500 mg) was only 4.8%, whereas none of the lower doses achieved this target. However, the PTA needed for the maximal mycobacterial kill with the simulated LFX doses (750 mg, 1000 mg, and 1500 mg) was increased more proportionately and predictably with a dose increase compared to that of MXF. For instance, the PTA required for a maximal bacterial kill at a critical MIC of 0.5 mg/L is more than tripled for 1500 mg LFX compared to 750 mg LFX dose. Peloquin et al30 in their earlier PopPK study of LFX, Gatifloxacin, and MXF revealed that the most favorable PK results were seen with LFX in the study population. This observation, the evidence that LFX has less risk for QT interval prolongation42 than MXF, and the findings of less LFX resistance when using the WHO critical concentrations, suggest LFX-based regimens are more preferable in the treatment of MDR-TB in Ethiopia. Deshpande et al19 recently identified that 1500 mg LFX confers equivalent effect to MXF 800 mg/day using HFS-TB in tandem with Monte Carlo Experiment, artificial intelligence-based analyses, and Probit models of clinical data. Cr, which affected CL of LFX, may be an important covariate in the therapeutic drug monitoring (TDM) of LFX. This is expected since LFX undergoes significant renal clearance and hence the renal function can affect drug clearance.43 Cr clearance was shown to be a covariate that influences LFX clearance in other studies as well.30
Delayed drug absorption and erratic concentration-time curves for some concentrations were observed in our study. It may be related to the food and drink intake behavior of patients before and during the investigation, as the patients were ambulatory and there was no food and drink restrictions. On the day of PK sampling, pre-dose blood samples were drawn in a fasting state while they received their daily dose after breakfast (under direct observation of the medical staff). However, the drug adherence information prior to the PK testing day was dependent on self-report of the patients. Therefore, non-adherence to the drug regimen could be a likely reason for some of the observed erratic concentration-time curves. Variable patterns of adherence to prescribed treatment are common and yet underestimated factors to sub-therapeutic plasma concentrations of TB drugs. Adverse drug effects and individual patient-related factors (psychiatric illness, substance use, and homelessness) increase the risk for variation in patterns of adherence.44 The other possible reason for the sub-therapeutic plasma concentrations may be a long storage time before the bioanalysis. It has been suggested that plasma sample storage time should also be regarded as an equally prominent covariate as age or gender and need to be included in epidemiological studies involving drugs in plasma. Repeated freeze-and-thawing of a sample during sample storage could affect data quality by interfering with peak detection.45,46
These findings support the importance of testing drug susceptibility and the potential benefit of follow-up TDM to determine if higher doses achieve targeted exposures. A further clinical study based on this work could be designed around higher starting doses of LFX and MXF, gyrA sequencing to determine no/low/high level resistance more rapidly than MIC testing, and measurement of serum drug concentrations by a limited sampling strategy performed at steady-state. Those patients not achieving target AUC0-24 or those with mutations consistent with low-level resistance could be triaged for a further dose/exposure optimization or exchange of the FQ drug class. Barriers to TDM include higher costs of specialized equipment and preserving the cold chain for analysis,47–54 yet assays under development, such as those using dried blood spots or saliva, promise to deliver drug concentration testing closer to the point-of-care. Lastly, more rigorous PopPK analyses to determine the optimal starting dose, if performed at local or regional levels, may be able to determine a setting-specific dose that could mitigate the routine need for TDM.55–57
Limitations
This was an observational study of MDR-TB patients in a programmatic treatment course. Many aspects which may affect the study result were not strictly controlled in the present study unlike in an interventional trial. Moreover, although our sample size is adequate for PopPK for a population with similar covariate distribution, it may not be representative of all Ethiopian MDR-TB patient populations. Incomplete MIC profile of the clinical isolates from the study subjects is also a limitation of this study. Bacterial killing and suppression of resistance depend on the concentration of unbound drug. However, for PTA calculations, raw drug concentrations were used to calculate the area under the concentration-time curve over 24 h.
Conclusion
The total plasma exposure in Ethiopian MDR-patients for both LFX and MXF is relatively lower than reports from previous studies in other settings. LFX demonstrated a more proportionate increase in the PTA required for the maximum mycobacterial kill with dose, whereas resistance prevention target was better achieved by higher dose of MXF. Cr and BMI are likely important covariates to consider for further interventional studies of dose increase or TDM to establish the optimal dose and plasma exposures of both drugs in Ethiopian patients.
Acknowledgments
We acknowledge Wolaita Sodo University and Addis Ababa University for their financial support in this study, and European and Developing Countries Clinical Trials Partnership (EDCTP) for granting a monthly stipend to TS for one year (grant Number: TMA2016-1778). This work was also supported by the National Research Foundation of Korea (NRF) grant (No.2018R1A5A2021242) funded by the Korean government (MSIT). We would like to thank the Inje University College of Medicine, Busan, Korea for granting TS access to its laboratory and generously providing all materials needed to conduct the bioassay and microbiological analysis. We also thank Pham My Tung, Seong Hyeon-Jeong and Sunyoung Lee for their technical assistance. We would also like to thank the Clinical Research staff of Inje University for their generous assistance in handling the data and study samples. Finally, we thank Dr. Getnet Yimer for mentoring TS during this study.
Disclosure
The authors report no conflicts of interest in this work.
References
1. Boeree MJ, Heinrich N, Aarnoutse R, et al.; PanACEA consortium. High-dose rifampicin, moxifloxacin, and SQ109 for treating tuberculosis: a multi-arm, multi-stage randomised controlled trial. Lancet Infect Dis. 2017;17(1):39–49. PMID: 28100438; PMCID: PMC5159618. doi:10.1016/S1473-3099(16)30274-2
2. World Health Organization. Rapid communication: key changes to treatment of multidrug- and rifampicin-resistant tuberculosis (MDR/ RR-TB); 2018.
3. Hu Y, Coates AR, Mitchison DA. Sterilizing activities of fluoroquinolones against rifampin-tolerant populations of Mycobacterium tuberculosis. Antimicrob Agents Chemother. 2003;47:653–657. doi:10.1128/AAC.47.2.653-657.2003
4. Yoshimatsu T, Nuermberger E, Tyagi S, Chaisson R, Bishai W, Grosset J. Bactericidal activity of increasing daily and weekly doses of moxifloxacin in murine tuberculosis. Antimicrob Agents Chemother. 2002;46:1875–1879. doi:10.1128/AAC.46.6.1875-1879.2002
5. Ahmad N, Ahuja SD, Akkerman OW, et al.; Collaborative Group for the Meta-Analysis of Individual Patient Data in MDR-TB treatment–2017. Treatment correlates of successful outcomes in pulmonary multidrug-resistant tuberculosis: an individual patient data meta-analysis. Lancet. 2018;392(10150):821–834. doi:10.1016/S0140-6736(18)31644-1
6. Srivastava S, Pasipanodya JG, Meek C, et al. Multidrug-resistant tuberculosis not due to noncompliance but to between-patient pharmacokinetic variability. J Infect Dis. 2011;204:1951–1959. doi:10.1093/infdis/jir658
7. Van’t Boveneind-Vrubleuskaya N, Seuruk T, van Hateren K, et al. Pharmacokinetics of levofloxacin in multidrug- and extensively drug-resistant tuberculosis patients. Antimicrob Agents Chemother. 2017;61:e00343–17. doi:10.1128/AAC.00343-17
8. Pranger AD, van Altena R, Aarnoutse RE, et al. Evaluation of moxifloxacin for the treatment of tuberculosis: 3 years of experience. Eur Respir J. 2011;38:888–894. doi:10.1183/09031936.00176610
9. Sachidanandam R, Weissman D, Schmidt SC, Kakol JM, Stein LD, Marth G. A map of human genome sequence variation containing 1.42 million single nucleotide polymorphisms. Nature. 2001;409:928–933. doi:10.1038/35057149
10. Ahmed S, Zhou Z, Zhou J, Chen SQ. Pharmacogenomics of drug metabolizing enzymes and transporters: relevance to precision medicine. Genomics Proteomics Bioinformatics. 2016;14:298–313. doi:10.1016/j.gpb.2016.03.008
11. Inge WS, Ulrich K. Influence of diet and nutritional status on drug metabolism. Clin Pharmacokinet. 1996;31:47–64. doi:10.2165/00003088-199631010-00004
12. Pranger AD, van der Werf TS, Kosterink JGW, Alffenaar JWC. The role of fluoroquinolones in the treatment of tuberculosis in 2019. Drugs. 2019;79(2):161–171. PMID: 30617959; PMCID: PMC6373389. doi:10.1007/s40265-018-1043-y
13. Pranger AD, Alffenaar JW, Aarnoutse RE. Fluoroquinolones, the cornerstone of treatment of drug-resistant tuberculosis: a pharmacokinetic and pharmacodynamics approach. Curr Pharm Des. 2011;17(27):2900–2930. doi:10.2174/138161211797470200
14. Firsov AA, Lubenko IY, Portnoy YA, Zinner SH, Vostrov SN. Relationships of the area under the curve/ MIC ratio to different integral endpoints of the antimicrobial effect: gemifloxacin pharmacodynamics in an in vitro dynamic model. Antimicrob Agents Chemother. 2001;45:927–931. doi:10.1128/AAC.45.3.927-931.2001
15. Craig W. Pharmacokinetic/pharmacodynamic parameters: rationale for antibacterial dosing of mice and men. Clin Infect Dis. 1998;26:1–12. doi:10.1086/516284
16. Craig W. Does dose matter? Clin Infect Dis. 2001;33(Suppl. 3):S233–S237. doi:10.1086/321854
17. Gumbo T, Louie A, Deziel MR, Parsons LM, Salfinger M, Drusano GL. Selection of a moxifloxacin dose that suppresses drug resistance in Mycobacterium tuberculosis, by use of an in vitro pharmacodynamic infection model and mathematical modeling. J Infect Dis. 2004;190:1642–1651. doi:10.1086/424849
18. Shandil RK, Jayaram R, Kaur P, et al. Moxifloxacin, ofloxacin, sparfloxacin, and ciprofloxacin against Mycobacterium tuberculosis: evaluation of in vitro and pharmacodynamic indices that best predict in vivo efficacy. Antimicrob Agents Chemother. 2007;51:576–582. doi:10.1128/AAC.00414-06
19. Deshpande D, Pasipanodya JG, Mpagama SG, et al. Levofloxacin pharmacokinetics/pharmacodynamics, dosing, susceptibility breakpoints, and artificial intelligence in the treatment of multidrug-resistant tuberculosis. Levofloxacin for drug-resistant tuberculosis. Clin Infect Dis. 2018;67(Suppl 3):S293–S302. doi:10.1093/cid/ciy611
20. World Health Organization. WHO Global Lists of High Burden Countries for TB, Multidrug/Rifampicin-Resistant TB (MDR/RR-TB) and TB/HIV, 2021–2025. Geneva: World Health Organization; 2021. Licence: CC BY-NCSA 3.0 IGO.
21. Adamu AY. Diversity in Ethiopia. Int J Commun Div. 2013;12(3):17–27. doi:10.18848/2327-0004/CGP/v12i03/39924
22. FMOH/CDC. 16th national annual review meeting group discussion. Why TB? Evaluating the national TB control program: challenges and ways forward; 2014.
23. Sidamo T, Shibeshi W, Yimer G, Aklillu E, Engidawork E. Explorative analysis of treatment outcomes of levofloxacin- and moxifloxacin-based regimens and outcome predictors in Ethiopian MDR-TB patients: a prospective observational cohort study. Infect Drug Resist. 2021;14:5473–5489. doi:10.2147/IDR.S342964
24. World Health Organization. WHO Consolidated Guidelines on Drug-Resistant Tuberculosis Treatment. Geneva, Switzerland: World Health Organization; 2019.
25. Federal Democratic Republic of Ethiopia. National Guidelines for TB, DR-TB and Leprosy, Federal Ministry of Health.
26. World Health Organization. Guidelines for Treatment of Drug-Susceptible Tuberculosis and Patient Care, 2017 Update. Geneva: World Health Organization; 2017.
27. Kim HJ, Seo KA, Kim HM, et al. Simple and accurate quantitative analysis of 20 anti-tuberculosis drugs in human plasma using liquid chromatography-electrospray ionization-tandem mass spectrometry. J Pharm Biomed Anal. 2015;102:9–16. doi:10.1016/j.jpba.2014.08.026
28. Schon T, Werngren J, Machado D, et al. Antimicrobial susceptibility testing of Mycobacterium tuberculosis complex isolates the EUCAST broth microdilution reference method for MIC determination. Clinical Microbiol Infect. 2020;26:1488–1492. doi:10.1016/j.cmi.2020.07.036
29. Rockwood N, Bruyn ED, Morris T, Wilkinson RJ. Assessment of treatment response in tuberculosis. Expert Rev Respir Med. 2016;10(6):643–654. doi:10.1586/17476348.2016.1166960
30. Peloquin CA, Hadad DJ, Molino LPD, et al. Population pharmacokinetics of levofloxacin, gatifloxacin, and moxifloxacin in adults with pulmonary tuberculosis. Antimicrob Agents Chemother. 2008;52(3):852–857. doi:10.1128/AAC.01036-07
31. Alsultan A, An G, Peloquin CA. Limited sampling strategy and target attainment analysis for levofloxacin in patients with tuberculosis. Antimicrob Agents Chemother. 2015;59(7):3800–3807. PMID: 25870068; PMCID: PMC4468713. doi:10.1128/AAC.00341-15
32. Yun H-Y, Chang V, Radtke KK, et al. Model-based efficacy and toxicity comparisons of moxifloxacin for multidrug-resistant tuberculosis. Open Forum Infect Dis. 2022;9(3):ofab660. doi:10.1093/ofid/ofab660
33. Zvada SP, Denti P, Sirgel FA, et al. Moxifloxacin population pharmacokinetics and model-based comparison of efficacy between moxifloxacin and ofloxacin in African patients. Antimicrob Agents Chemother. 2014;58(1):503. doi:10.1128/AAC.01478-13
34. Xu XS, Yuan M, Karlsson MO, Dunne A, Nandy P, Vermeulen A. Shrinkage in nonlinear mixed-effects population models: quantification, influencing factors, and impact. AAPS J. 2012;14:4. doi:10.1208/s12248-012-9407-9
35. van den Elsen SHJ, Sturkenboom MGG, Akkerman OW, et al. Limited sampling strategies using linear regression and the Bayesian approach for therapeutic drug monitoring of moxifloxacin in tuberculosis patients. Antimicrob Agents Chemother. 2019;63:e00384–19. doi:10.1128/AAC.00384-19
36. World Health Organization. Technical Report on Critical Concentrations for Drug Susceptibility Testing of Medicines Used in the Treatment of Drug-Resistant Tuberculosis. Geneva, Switzerland: World Health Organization; 2018.
37. Angeby KA, Jureen P, Giske CG, et al. Wild-type MIC distributions of four fluoroquinolones active against Mycobacterium tuberculosis in relation to current critical concentrations and available pharmacokinetic and pharmacodynamic data. J Antimicrob Chemother. 2010;65:946–952. doi:10.1093/jac/dkq091
38. Tornheim JA, Udwadia ZF, Arora PR, et al. Increased moxifloxacin dosing among patients with multidrug-resistant tuberculosis with low-level resistance to moxifloxacin did not improve treatment outcomes in a tertiary care center in Mumbai. India Open Forum Infect Dis. 2021;9(2):ofab615. PMID: 35097152; PMCID: PMC8794589. doi:10.1093/ofid/ofab615
39. Rajman I, Knapp L, Hanna I. Genetic diversity in drug transporters: impact in African populations. Clin Transl Sci. 2020;13:848–860. doi:10.1111/cts.12769
40. Naidoo R, Ramsuran V, Chirehwa M, et al. Effect of genetic variation in UGT1A and ABCB1 on moxifloxacin pharmacokinetics in South African patients with tuberculosis. Pharmacogenomics. 2018;19(1). doi:10.2217/pgs-2017-0144
41. Mugusi S, Habtewold A, Ngaimisi E, et al. Impact of population and pharmacogenetics variations on efavirenz pharmacokinetics and immunologic outcomes during anti-tuberculosis co-therapy: a parallel prospective cohort study in two Sub-Sahara African populations. Front Pharmacol. 2020;11:26. doi:10.3389/fphar.2020.00026
42. Malik M, Hnatkova K, Schmidt A, Smetana P. Electrocardiographic QTc changes due to moxifloxacin infusion. J Clin Pharmacol. 2009;49:674–683. doi:10.1177/0091270008330984
43. Siefert HM, Domdey-Bette A, Henninger K, Hucke F, Kohlsdorfer C, Stass HH. Pharmacokinetics of the 8-methoxyquinolone, moxifloxacin: a comparison in humans and other mammalian species. J Antimicrob Chemother. 1999;43(SupplB):69–76. doi:10.1093/jac/43.suppl_2.69
44. Rumende CM. Risk factors for multidrug-resistant tuberculosis. Acta Media Indonesia. 2018;50:1.
45. Enroth S, Hallmans G, Grankvist K, Gyllensten U. Effects of long-term storage time and original sampling month on biobank plasma protein concentrations. EBioMedicine. 2016;12:309–314. PMID: 27596149; PMCID: PMC5078583. doi:10.1016/j.ebiom.2016.08.038
46. Mitchella BL, Yasuie Y, Li CI, Fitzpatrick AL, Lampe PD. Impact of freeze-thaw cycles and storage time on plasma samples used in mass spectrometry based biomarker discovery projects. Cancer Inform. 2005;1:98–104.
47. Reynolds J, Heysell SK. Understanding pharmacokinetics to improve tuberculosis treatment outcome. Expert Opin Drug Metab Toxicol. 2014;10(6):813–823. doi:10.1517/17425255.2014.895813
48. Nunn AJ, Rusen ID, Van Deun A, et al. Evaluation of a standardized treatment regimen of anti-tuberculosis drugs for patients with multi-drug-resistant tuberculosis (STREAM): study protocol for a randomized controlled trial. Trials. 2014;15:353. doi:10.1186/1745-6215-15-353
49. Kuhlin J, Sturkenboom MGG, Ghimire S, et al. Mass spectrometry for therapeutic drug monitoring of anti-tuberculosis drugs. Clin Mass Spectr. 2019;14:34–45. doi:10.1016/j.clinms.2018.10.002
50. Davies Forsman L, Bruchfeld J, Alffenaar J-WC. Therapeutic drug monitoring to prevent acquired drug resistance of fluoroquinolones in the treatment of tuberculosis. Eur Respir J. 2017;49:1700173. doi:10.1183/13993003.00173-2017
51. Kang JS, Lee MH. Overview of therapeutic drug monitoring. Korean J Intern Med. 2009;24:1. doi:10.3904/kjim.2009.24.1.1
52. Nielsen EI, Friberg LE, Friberg LE. Pharmacokinetic/Pharmacodynamic (PK/PD) indices of antibiotics predicted by a semimechanistic PKPD model: a step toward model-based dose optimization. Antimicrob Agents Chemother. 2011;55:4619–4630. doi:10.1128/AAC.00182-11
53. Srivastava S, Peloquin CA, Sotgiu G, et al. Therapeutic drug management: is it the future of multidrug-resistant tuberculosis treatment? Eur Respir J. 2013;42(6):1449–1453. doi:10.1183/09031936.00073213
54. Ghimire S, Bolhuis MS, Sturkenboom MG, et al. Incorporating therapeutic drug monitoring into the World Health Organization hierarchy of tuberculosis diagnostics. Eur Respir J. 2016;47:1867–1869. doi:10.1183/13993003.00040-2016
55. Mohamed S, Mvungi HC, Sariko M, et al. Levofloxacin pharmacokinetics in saliva as measured by a mobile microvolume UV spectrophotometer among people treated for rifampicin-resistant TB in Tanzania - PubMed (nih.gov). J Antimicrob Chemother. 2021;76(6):1547–1552. doi:10.1093/jac/dkab057
56. van den Elsen SHJ, Oostenbrink LM, Heysell SK, et al. Systematic review of salivary versus blood concentrations of antituberculosis drugs and their potential for salivary therapeutic drug monitoring - PubMed (nih.gov). Drug Monit. 2018;40(1):17–37. PMID: 29120971; PMCID: PMC6345279. doi:10.1097/FTD.0000000000000462
57. Vu DH, Koster RA, Alffenaar JW, Brouwers JR, Uges DR. Determination of moxifloxacin in dried blood spots using LC-MS/MS and the impact of the hematocrit and blood volume - PubMed (nih.gov). J Chromatogr B Analyt Technol Biomed Life Sci. 2011;879(15–16):1063–1070. PMID: 21459055. doi:10.1016/j.jchromb.2011.03.017
 © 2022 The Author(s). This work is published and licensed by Dove Medical Press Limited. The full terms of this license are available at https://www.dovepress.com/terms.php and incorporate the Creative Commons Attribution - Non Commercial (unported, v3.0) License.
By accessing the work you hereby accept the Terms. Non-commercial uses of the work are permitted without any further permission from Dove Medical Press Limited, provided the work is properly attributed. For permission for commercial use of this work, please see paragraphs 4.2 and 5 of our Terms.
© 2022 The Author(s). This work is published and licensed by Dove Medical Press Limited. The full terms of this license are available at https://www.dovepress.com/terms.php and incorporate the Creative Commons Attribution - Non Commercial (unported, v3.0) License.
By accessing the work you hereby accept the Terms. Non-commercial uses of the work are permitted without any further permission from Dove Medical Press Limited, provided the work is properly attributed. For permission for commercial use of this work, please see paragraphs 4.2 and 5 of our Terms.