")
Back to Journals » Drug Design, Development and Therapy » Volume 13
Population pharmacokinetic analysis of tramadol and O-desmethyltramadol with genetic polymorphism of CYP2D6
Authors Lee J, Yoo H, Bae JW , Lee S, Shin K
Received 26 December 2018
Accepted for publication 1 May 2019
Published 23 May 2019 Volume 2019:13 Pages 1751—1761
DOI https://doi.org/10.2147/DDDT.S199574
Checked for plagiarism Yes
Review by Single anonymous peer review
Peer reviewer comments 3
Editor who approved publication: Dr Tuo Deng
Joomi Lee,1,* Hee-Doo Yoo,2,* Jung-Woo Bae,3 Sooyeun Lee,3 Kwang-Hee Shin1
1College of Pharmacy, Research Institute of Pharmaceutical Sciences, Kyungpook National University, Daegu, Republic of Korea; 2Department of Biostatistics and Bioinformatics, Pharma Partnering Inc., Seoul 06605, Republic of Korea; 3College of Pharmacy, Keimyung University, Daegu 42601, Republic of Korea
*These authors contributed equally to this work
Aim: Tramadol is widely used to treat acute, chronic, and neuropathic pain. Its primary active metabolite, O-desmethyltramadol (M1), is mainly responsible for its μ-opioid receptor-related analgesic effect. Tramadol is metabolized to M1 mainly by the cytochrome P450 (CYP) 2D6 enzyme, and to other metabolites by CYP3A4 and CYP2B6. The aim of this study was to develop a population pharmacokinetic (PK) model of tramadol and its metabolite using healthy Korean subjects.
Methods: Data on plasma concentrations of tramadol and M1 were obtained from 23 healthy Korean male subjects after a twice-daily oral dose of 100 mg of tramadol, every 12 hrs, for a total of 5 times. Blood samples were collected at 0 (pre-dose), 0.5, 1, 1.5, 2, 2.5, 3, 4, 6, 8, 10, 12, 24, 48 and 72 hrs after last administration. Plasma tramadol concentrations were then analyzed using LC/MS. Population PK analysis of tramadol and its metabolite was performed using a nonlinear mixed-effects modeling (NONMEM).
Results: A one-compartment model with combined first-order and zero-order absorption was well fitted to the concentration–time curve of tramadol. M1 was well described by the one-compartment model as an extension of the parent drug (tramadol) model. Genetic polymorphisms of CYP2D6 correlated with the clearance of tramadol, and clearance from the central compartment to the metabolite compartment.
Conclusion: The parent-metabolite model successfully characterized the PK of tramadol and its metabolite M1 in healthy Korean male subjects. These results could be applied to evaluate plasma tramadol concentrations after various dosing regimens.
Keywords: tramadol, O-desmethyltramadol, genetic polymorphism, pharmacokinetics, population pharmacokinetic model, CYP2D6*10
Introduction
Tramadol is a centrally acting analgesic agent, and it is widely used to relieve acute, chronic, and neuropathic pain.1 Tramadol is administered as a racemic mixture, therefore there are two enantiomers of the parent compound and the metabolite. The pharmacokinetic (PK) properties differ across enantiomers and what is more relevant, and their pharmacodynamics are different. The (+)-tramadol is an opioid agonist and it inhibits serotonin reuptake, however, the (−)-tramadol is weak monoamine re-uptake inhibitor.2 Both mechanisms of action are complementary and synergistic, and result in fewer side effects and a lower potential for the development of addiction compared to opioids analgesics.3,4
Tramadol has become one of the most popular prescribed opioid worldwide5 Although a large amount of information exists supporting the effectiveness of tramadol, it is also being increasingly abused by opioid-addicted subjects.4,5 Tramadol overdose can cause life-threatening seizures, respiratory depression, coma, nausea, vomiting, hypotension, and serotonin syndrome.3,5,6
When orally administered, tramadol is rapidly absorbed and distributed throughout the body, with 20–30% of the amount ingested undergoing first-pass metabolism; tramadol also has a bioavailability of 68–84%.1,3 Tramadol is extensively metabolized in the liver, and its elimination half-life is approximately 5–6 hrs.1,3 The elimination of tramadol is mainly urinary (90%), and five main (M1–M5) metabolites can be detected in the urine.3,7 Tramadol is metabolized by the cytochrome P450 (CYP) 2D6 enzyme to its primary active metabolite O-desmethyltramadol (M1) via O-demethylation, and by CYP3A4 and CYP2B6 to other metabolites.1,4 M1 is mainly responsible for the μ-opioid receptor-related analgesic effect1 M1 binds with an estimated 300-fold higher affinity to μ-opioid receptors, than the parent compound. A previous study reported that the minimum effective concentration of M1 is 84 μg/L8
Tramadol PKs and pharmacodynamics are highly dependent on polymorphisms associated with CYP2D6.1,3,9–12 Data suggest that extensive metabolization by CYP2D6 leads to better analgesic effects of tramadol than with poor metabolization, as tramadol interacts with the μ-opioid receptors predominantly via M1.1,3
The major variants of the CYP2D6 alleles in the Korean population are *4, *5, *10, *14 and *41. CYP2D6*10 is more frequently found in the Korean population (about 46.2%), with the frequency of other alleles being CYP2D6*4, 0.3%; CYP2D6*5, 4.5%; CYP2D6*14, 0.3%; and CYP2D6*41, 1.4%13 Previous studies have shown that the activity of CYP2D6 markedly reduced in individuals harboring the CYP2D6*10/*10 genotype.10–14 Although tramadol is widely used in clinical fields, information on its PKs is lacking, with only a few PK models being previously tested in adults.
Therefore, the aim of this study was to develop a population PK model for tramadol and its main active metabolite M1, and to investigate the influence of PK on tramadol, based on the genetic polymorphism CYP2D6*10 in healthy Korean subjects; this was performed to support the dose–response relationship including addiction due to overuse.
Materials and methods
Study population
A total of 23 healthy Korean male volunteers participated in this study. These volunteers ranged in age from 20 to 40 years (mean ± SD, 24.8±4.8 years), had weights ranging from 57 to 90 kg (mean ± SD, 71.6±8.9 kg), and body mass index (BMI) ranging from 18.1 to 26.9 kg/m2 (mean ± SD, 23.0±2.5 kg/m2). The study was conducted in accordance with the guidelines of Good Clinical Practice and the Declaration of Helsinki, and was approved by the institutional review board at Kyungpook National University Hospital (KNUH) (IRB No. 2016-08-005). All subjects gave written informed consent prior to their participation in the study. Each subject had a physically normal state, and had no clinically significant abnormalities based on their clinical history and a detailed physical examination (vital signs, laboratory analyses and 12 lead electrocardiography). Subjects who had a history of allergic reactions to tramadol, were excluded from the study. The subjects were admitted to the study site 12 hrs before drug dosing.
Study design
The analysis was performed using data from a single center. The study was an open-labeled, and single-dosed, involving 23 healthy adult males at the KNUH Clinical Trial Centre, Daegu, Korea. All subjects received tramadol (Tridol SR, Yuhan Co. Ltd., Korea) with 150 mL of water as a single 100 mg oral dose, for 5 times every 12 hrs. Blood sampling for the PK assessment was performed at 0 (pre-dose), 0.5, 1, 1.5, 2, 2.5, 3, 4, 6, 8, 10, 12, 24, 48, and 72 hrs after the last administration of tramadol. A total of 7 mL of blood per sample point was drawn in each sample point.
Genotype analysis
Genomic DNA was isolated from peripheral blood leukocytes for genotyping of the CYP2D6 with a commercial kit (Wizard® Genomic DNA Purification Kit, Promega, Madison, WI, USA); this was performed according to the manufacturer’s instructions. Genotyping of CYP2D6*2 and *10 was performed using the pyrosequencing method. The pyrosequencing primers were designed using the PyroMark Assay Design software 2.0 (Qiagen, Hilden, Germany). For the analysis of the CYP2D6*2 allele, the forward primer (5ʹ-CTACCCCGTTCTGTCCCGAGT-3ʹ), biotinylated reverse primer (B5ʹ-GGCCCCTGCACTGTTTCC-3ʹ) and sequencing primer (5ʹ-CAGCTTCAATGATGAGAAC-3ʹ) were used. The PCR cycling was performed with pre-specified condition as follows: pre-denaturation at 94°C for 5 mins, 35 cycles of denaturation at 94°C for 30 s, annealing at 56°C for 30 s and extension at 72°C for 30 s, followed by a final extension at 72°C for 5 mins. For the analysis of the CYP2D6*10 allele, the biotinylated forward primer (5ʹ-CAGAGGAGCCCATTTGGTAGT-3ʹ), reverse primer (B5ʹ-GTCGAAGCAGTATGGTGTGTTC-3ʹ) and sequencing primer (5ʹ-GGCAGGGGGCCTGGT-3ʹ) were used. The PCR cycling conditions for the CYP2D6*10 allele were as follows: pre-denaturation at 94°C for 5 mins, 35 cycles of denaturation at 94°C for 30 s, annealing at 56°C for 30 s and extension at 72°C for 30 s, followed by a final extension at 72°C for 5 mins. All pyrosequencing reactions were performed on a PyroMark Q96 ID instrument, using PyroMark Gold Q96 reagents and the manufacturer’s protocols (Qiagen). The long-PCR method was used for genotyping of CYP2D6*5 and the duplicated CYP2D6 gene, as previously described.11,13 Subjects with the CYP2D6*5 allele or duplicated CYP2D6 gene were not included in the study.
Determination of tramadol and M1
The plasma concentrations of tramadol and M1 were determined using validated HPLC–tandem mass spectrometry (LC/MS/MS). To each 100 μL plasma sample, 10 μL of internal standard solution (tramadol 13C, d3 for tramadol and M1-d6 for M1) was added. After vortex-mixing, 300 μL of acetonitrile was added, and the tube vigorously mixed for 30 s. Each sample was centrifuged at 2,500 rpm for 10 mins. The organic layer was transferred to a clean glass tube and evaporated at 40°C, under a mild stream of nitrogen gas. The residue was reconstituted with 200 μL of methanol, and 5 μL of residue was injected for LC/MS/MS analysis. Chromatography was performed on a Luna C18 5.0-μm column (2.0 mm×50 mm; Phenomenex, Torrance, CA, USA) at a flow rate of 300 μL/min. The mobile phase comprise ammonium formate (5 mM) and formic acid (0.1%) in methanol (A), and 5 mM ammonium formate solution (B). In addition, the following gradient condition was used: 0–2 mins, 97–5% (B); 2–4 mins, 5% (B); 4–5 mins, 5–97% (B); and 5–8 mins, 97% (B). The mass spectra were obtained via the use of an API3200 tandem mass spectrometer system (Applied Biosystems SCIEX, Toronto, ON, Canada), which was operated in electrospray ionization positive ion mode, using multiple reaction monitoring mode. The following mass transition pairs (m/z) were used: 264.2→58.1 for tramadol, 268.2→58.1 for tramadol 13C, d3, 250.2→58.2 for M1, and 256.2→64.1 for M1-d6. The concentration ranges for tramadol and O-desmethyltramadol were 1–1,000 ng/mL and 1–500 ng/mL, respectively. The calibration standard curve of tramadol and M1 was linear over the concentration range. The accuracies for tramadol and M1 were 94.8–109.8% and 89.8–107.5%, respectively, and the coefficients of variation (CV; intra-day and inter-day validation) were 4.5–15.9% and 1.8–9.1%, respectively.
Population PK model development
As the number of subjects with a CYP2D6*5/*5 was only one, the data obtained from this subject were excluded from the population PK modeling. The dataset consisted of a total of 328 for tramadol and 323 for the M1 metabolite. The demographic characteristics such as age, weight, height, and BMI of subjects are shown in Table 1. A population PK analysis was conducted using the nonlinear mixed effects modeling program, NONMEM (version 7.3; Icon Development Solutions, Ellicott City, MD, USA), to estimate the population parameters, inter-individual (η), and residual (ε) random effects15 We tested a one-compartment and a two-compartment model to the plasma concentrations of tramadol, to develop a basic population PK model for tramadol. The estimated population parameters for tramadol were apparent clearance (CL/F), apparent volume of distribution (Vd/F), and absorption rate constant (ka) for the one compartment model. For the two-compartment model, the following parameters were estimated: apparent clearance (CL/F), and inter-compartmental clearance (Q/F), the apparent central and peripheral volume of distribution (V2/F and V3/F, respectively) and ka. In addition, compartment and error models for M1 were fitted to consider the metabolic pathway, from tramadol to M1. The estimated population parameters of the metabolite were the apparent clearance from the central compartment of tramadol to the metabolite compartment (CLPM/F), and apparent clearance of metabolite (CLM/F).
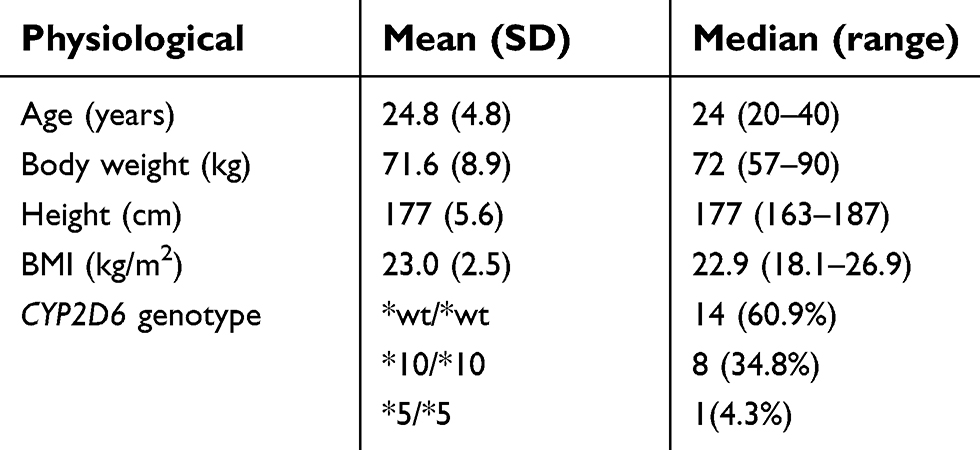 | Table 1 Characteristics of the studied subjects (N=23) |
The basic PK model was implemented in the PREDPP library subroutine ADVAN6 in NONMEM, and estimated using the first-order conditional estimation method, with η–ε interaction. First-order kinetics were assumed for all PK processes, except absorption. The inter-individual variability of each of the structural parameters of the basic model, was modeled using the following exponential error model:
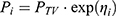
where  is the value or the parameter in an ith individual,
  is a random variable, and the difference between
  and
and  represent the value of the parameter in a typical individual.
It is assumed that the values of  are normally distributed, with a mean of zero and a variance of
  . For intraindividual variability (residual error), both additive and proportional characteristics were allowed:

where  is the jth observed value in the ith subject,
  is the jth predicted value in the ith subject, and
  and
and  represent the proportional and additive errors, respectively, and are the residual intra-subject variability, with mean of zero and variances of
  and
and  for proportional and additive errors, respectively. Each parameter was sequentially tested to determine if it should remain in the basic model.
Covariates selection
All demographic variables included in the dataset were screened as potential covariates for the PK parameters. The screening process was performed using both visual and numerical approaches. In the visual screening process, parameter versus covariate scatter plots were used for the continuous variables such as age, weight, height, and BMI, whereas box plots were used for the categorical variables such as genetic polymorphisms in CYP2D6 alleles. Generalized additive modeling implemented in the Xpose version 4.3.216 was used to identify the important covariates.
We explored the possible influence of genetic polymorphism in CYP2D6*10 on tramadol PKs. The genotypes as covariates were included in the model as index variables. For example, the association between the typical value of the CL/F and genetic polymorphism in CYP2D6*10 was modeled according to the following equation:

where θn1 is the estimate of oral clearance for the wild type group, θn2 is the fractional change in oral clearance for the genotype group, and Ggenotype is the index variable for the genotypes. The covariate model building was conducted using a stepwise approach, adding an additional covariate at each step.
The PK model was selected based on goodness-of-fit plots, precision of estimates and the likelihood ratio test within NONMEM. For the non-nested models, the value of the Akaike information criteria was used. The levels of significance were P<0.05 and P<0.01 during forward inclusion and backward deletion, respectively. The final model was evaluated using goodness-of-fit plots of the observations (dependent variable [DV]) versus population predictions (PRED), DV versus individual prediction (IPRED), conditional weighted residuals (CWRES) versus PRED, and CWRES versus time, which were obtained using the Xpose software.
Model evaluation
For the final model, its accuracy and robustness were evaluated using a simulation and a bootstrap method. The simulation method was conducted using the visual predictive check (VPC) implemented in Xpose, with the PsN. Results from the VPC with 1,000 simulations were assessed by graphical comparison of the 95% prediction interval from the simulated data, with an overlay of the raw data. Systematic patterns or an excess of data falling outside the prediction interval suggested that the parameter estimates were not robust.
Non-parametric bootstrap analysis was conducted using a total of 1,000 bootstrap-resampled datasets from the original dataset. The median and 95% CIs (2.5th and 97.5th percentile) of the parameters obtained from this step were compared to the final parameter estimates.
Results
Pharmacokinetic analysis
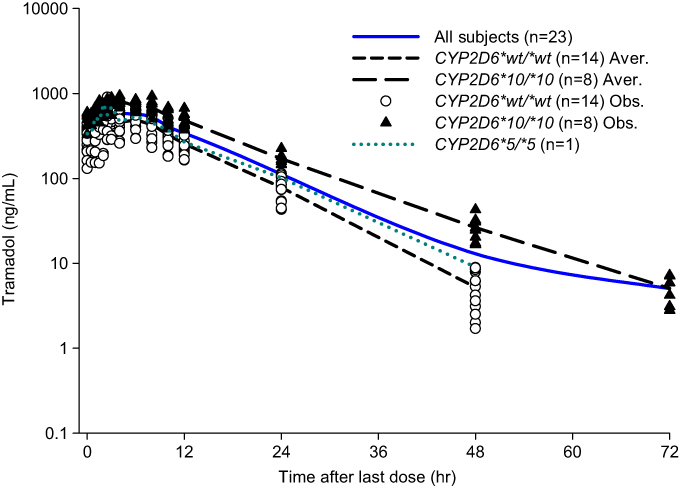
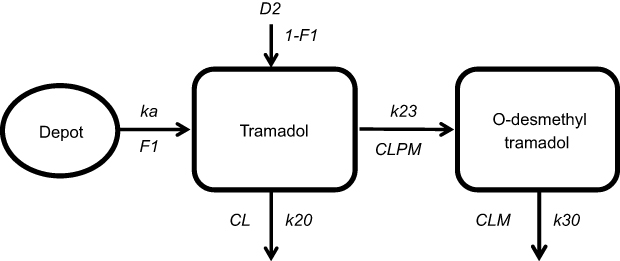
The observed time-concentration profiles of tramadol and its metabolite are shown in Figure 1. The population PKs of tramadol appeared slightly better fitted to a two-compartment model than to a one-compartment model, by objective function value. However, when tramadol plasma-concentration was classified according to genotypes, a one-compartment model was better suited than a two-compartment model. We applied combined first- and zero-order absorption to catch the bimodal absorption phase of the extended release formulation of tramadol. The metabolite, M1, was well described by the one-compartment model as an extension of the parent drug (tramadol) model, with first-order elimination. The best residual error model for both tramadol and M1 was a combined additive-proportional error. An integrated compartmental model with a one-compartment model for parent and metabolite, was considered as the base model (Figure 2).
 | Figure 1 The mean (± SD) serum concentration–time curve after 5 times oral administrations of 100 mg twice daily (A) tramadol and (B) O-desmethyltramadol (M1) to the 23 subjects. Solid line, observed average of all subjects (23 subjects); Short dash, observed average of CYP2D6*wt/*wt (14 subjects); Long dash, observed average of CYP2D6*10/*10 (8 subjects); Dotted line, observed CYP2D6*5/*5 (1 subjects); Open circle, observed CYP2D6*wt/*wt; and closed triangle, observed CYP2D6*10/*10. |
 | Figure 2 Scheme of the model used to describe the tramadol and O-desmethyltramadol plasma concentration–time profiles. |
Covariate analysis
A summary of the covariates model building steps is shown in Table 2, and represents the steps that resulted in a statistical significance in the OFV, during the development of the PK model. In the final model, the CL/F, ka, and the CLPM/F were significantly influenced, based on the genetic polymorphisms of CYP2D6*10/*10. In the final model, the inter-individual variability of CL/F and CLPM/F decreased by 11.5% and 27.9%, respectively, compared to the base model. Other covariates including age, body weight, height and BMI did not appear to affect any of the PK parameters in the final model. As a result, covariates in the final model were included with the use of the following equations:


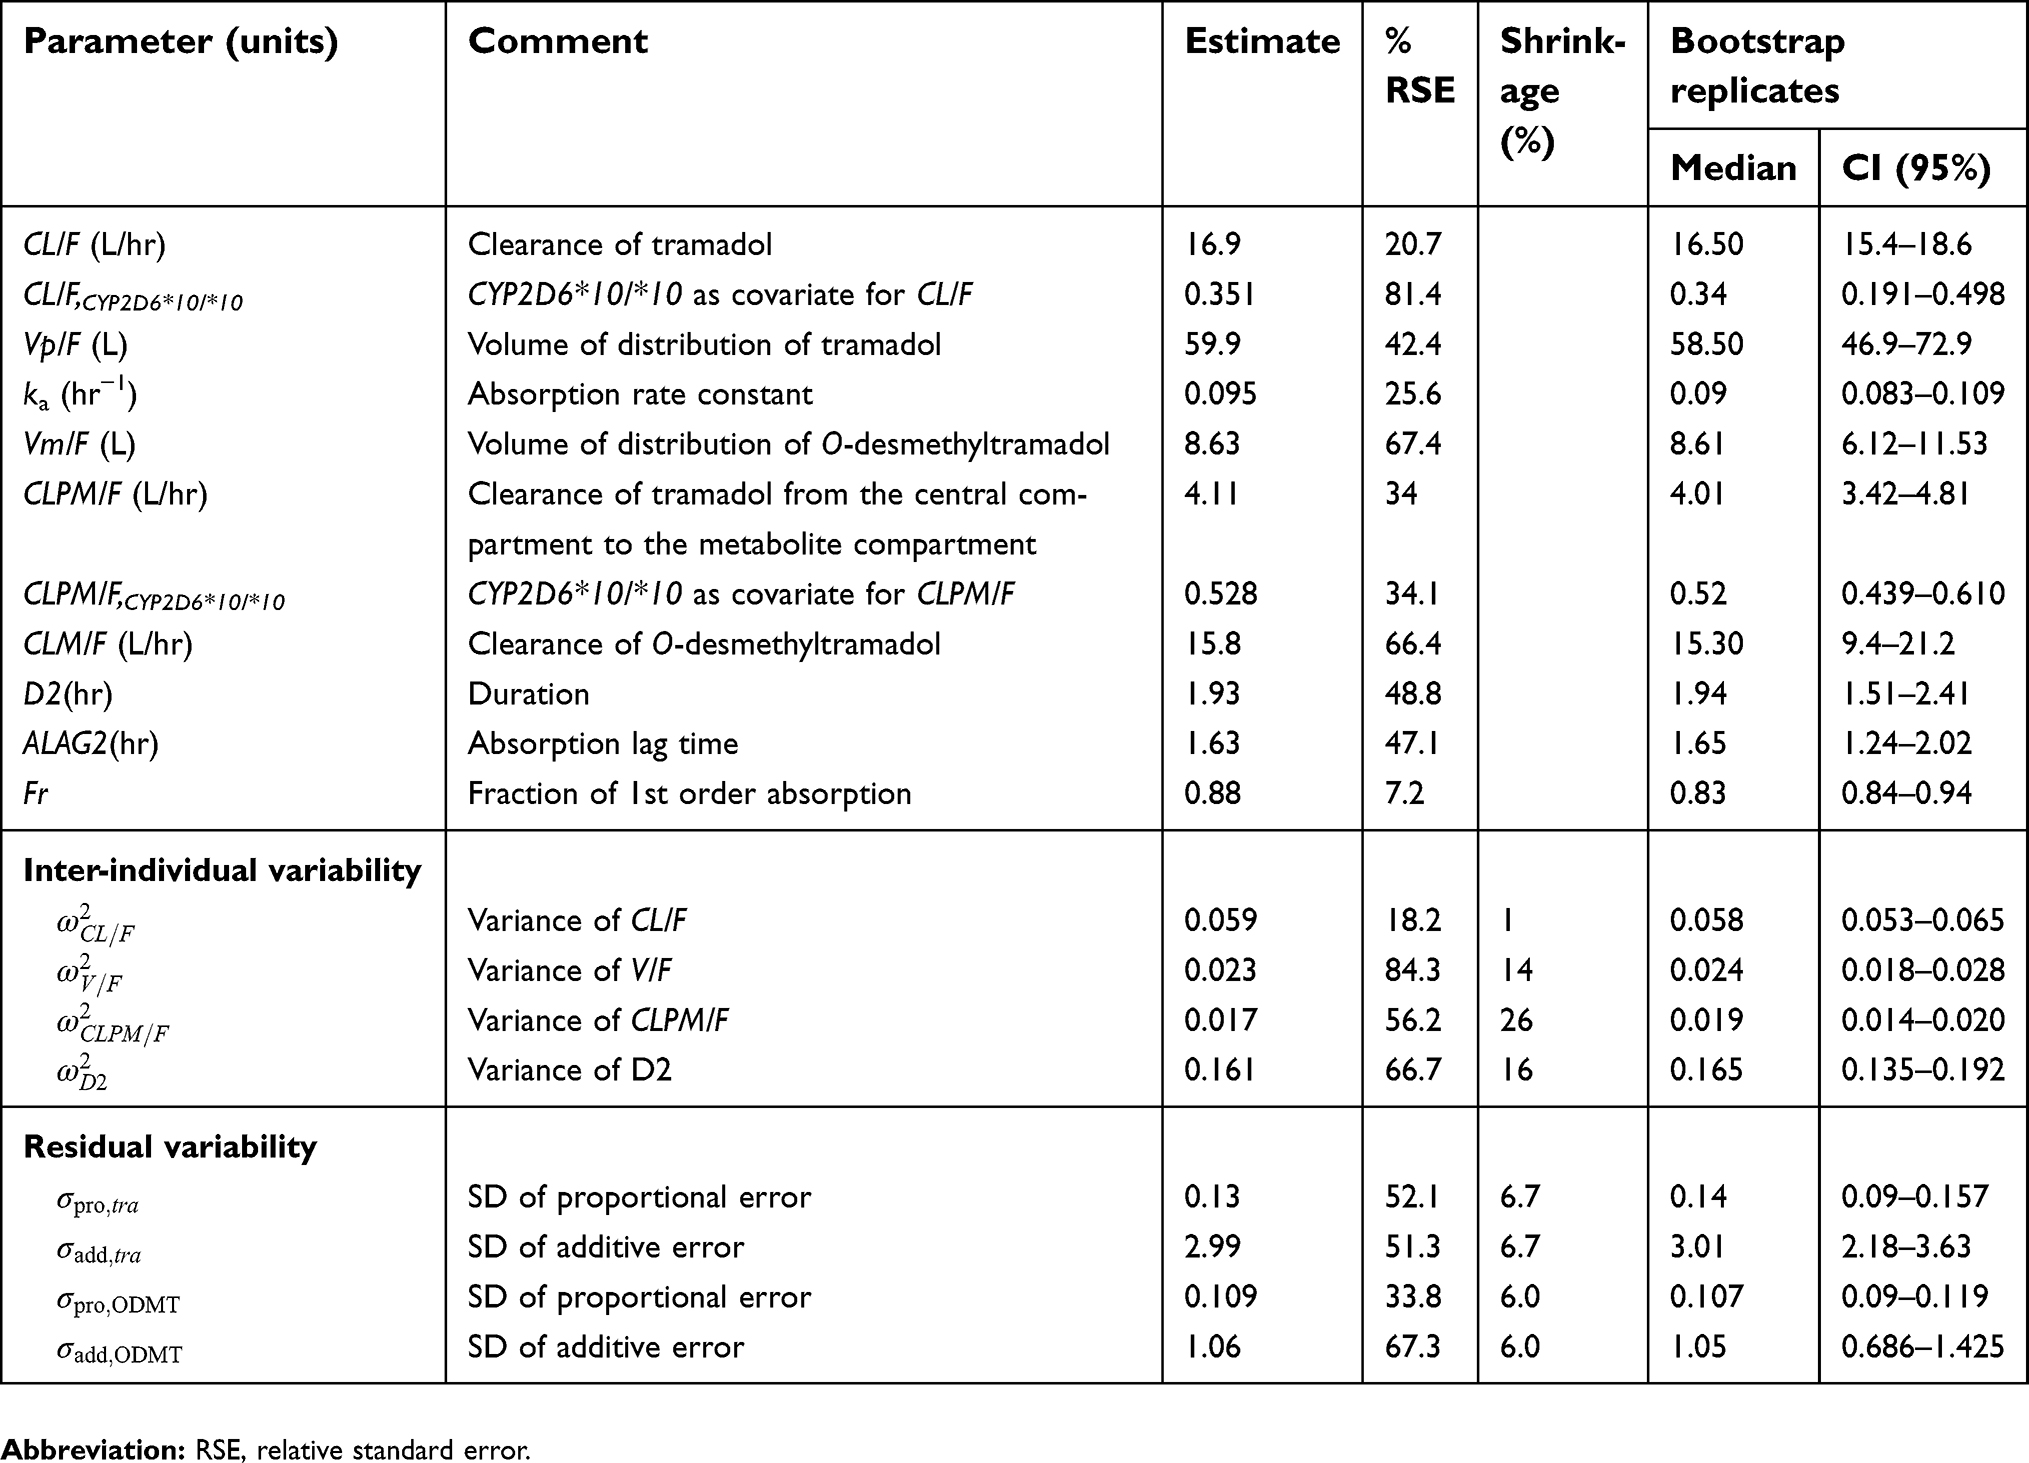 | Table 2 Population pharmacokinetic parameters for tramadol and O-desmethyltramadol in 22 subjects including the results of bootstrap validation (final model) |
The PK parameter values, and inter-individual and residual variability estimated by the final model are shown in Table 2. Generally, the PK parameters were well estimated, with the relative standard error (%RSE) for the estimation being 7.2–81.4%. A high value was not obtained for the %RSE for the inter-individual variability of the parameter estimates (18.2–84.3%). The values of eta shrinkage were relatively small in the final model. The residual error of parent drug was 13% and 2.99 ng/mL for the proportional error and additive error, respectively. In addition, the residual error for the metabolite was 10.9% and 1.06 ng/mL for the proportional error and additive error, respectively. The basic goodness-of-fit plots for the final model are shown in Figures 3 and 4. The diagnostic plots of the final population PK model revealed no systematic bias. The population and individual post hoc predictions were distributed around the line of identity. The CWRES for the population predicted plasma concentrations, were generally distributed around zero and were relatively symmetric.
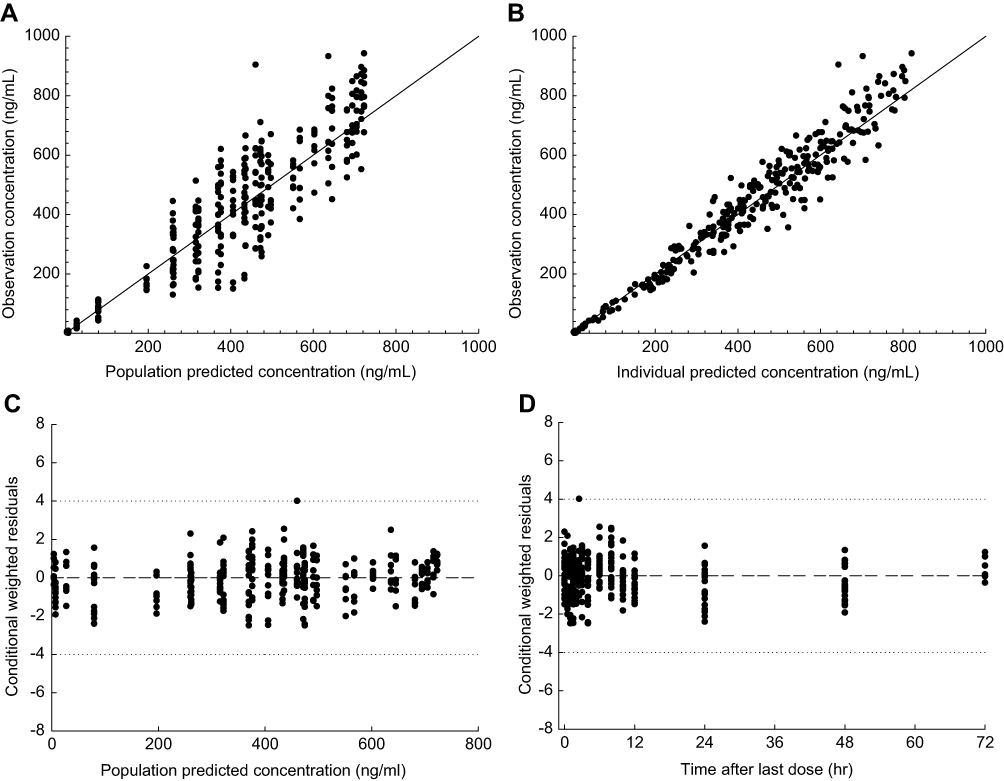 | Figure 3 Goodness-of-fit plots for the final model of tramadol. (A) Observations (dependent variable [DV]) versus population predictions (PRED), (B) DV versus individual prediction (IPRED), (C) conditional weighted residuals (CWRES) versus PRED, (D) CWRES versus time. |
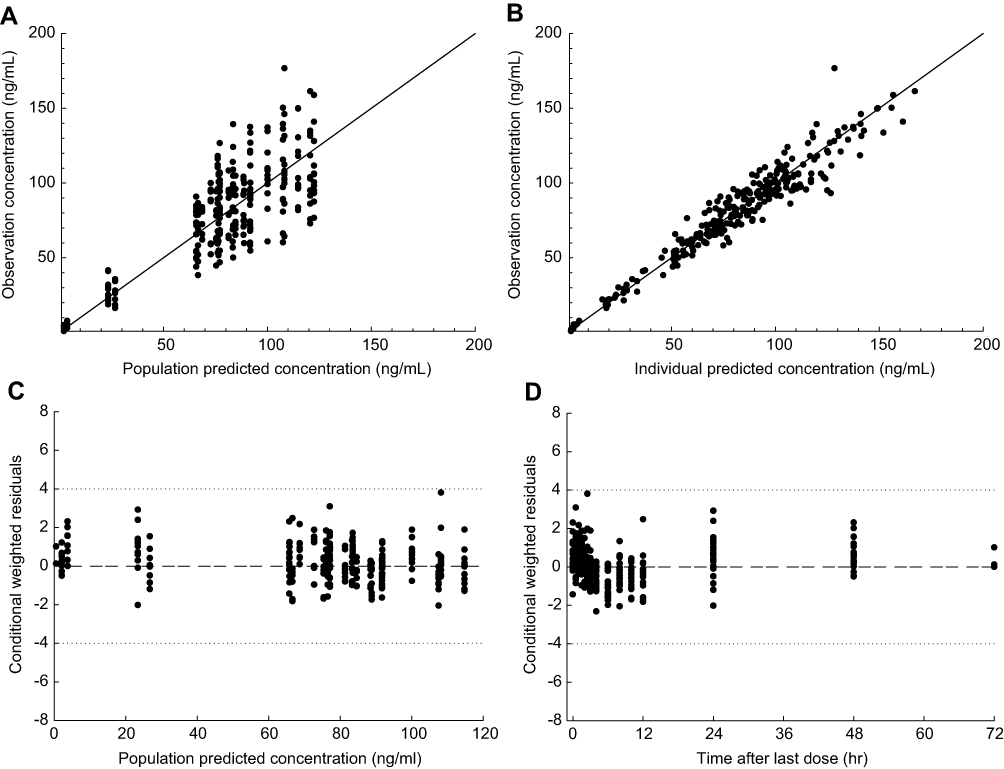 | Figure 4 Goodness-of-fit plots for the final model of O-desmethyltramadol. (A) Observations (dependent variable [DV]) versus population predictions (PRED), (B) DV versus individual prediction (IPRED), (C) conditional weighted residuals (CWRES) versus PRED, (D) CWRES versus time. |
Model evaluation
The final parameter estimates and their corresponding CV, and the bootstrap results are summarised in Table 2. The model and parameter estimates were adequately robust in the 2.5–97.5th percentiles for the bootstrap replicates. All parameter estimates from the final model were within the 95% bootstrap CI (Table 2). The predictive performance was also sufficient, based on the VPC result; the VPC plots are provided in Figure 5. The trend of the predicted time-concentration profile was well in accordance with the raw data.
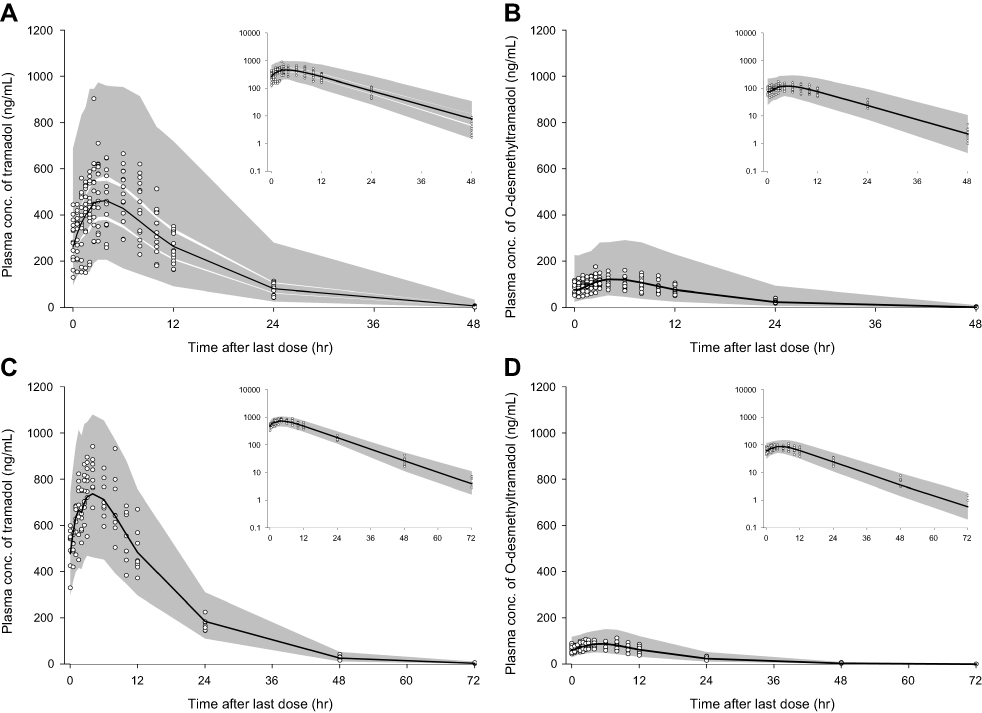 | Figure 5 Visual predictive check plot of the final model for tramadol (A CYP2D6 wt/wt, B: CYP2D6 *10/*10) and O-desmethyltramadol (C: CYP2D6 wt/wt, D: CYP2D6 *10/*10). A total of 1,000 datasets were simulated using the final PK parameter estimates. Circles represent the observed tramadol and O-desmethyltramadol plasma concentrations. The 95% CI of the simulated concentrations, shaded area; and solid line, medians of the predicted values. |
Discussion
In most of the previous studies conducted, only the PK profile of the parent drug was described. Therefore, the current study provides the useful information about the population PKs for tramadol and its metabolite, M1, in healthy adult volunteers. For tramadol and its metabolite, M1, the one-compartment model with combined first- and zero-order absorption, and first-order elimination, produced the best fit. In a previous report, Bressolle et al17 reported that for both tramadol and M1, the two-compartment structural model produced the best fit in children (1–8 years). In another study, the five-compartment population PK mixture model with first-order absorption.18 On the other hand, the one-compartment model with a first-order input process was selected as the best model for tramadol immediate-release (IR) formulation in another study19.
In this study, an inflection was observed in the time–tramadol plasma concentration profile; thus, a one-compartment model was not suitable. However, in the profile classified according to genotypes, the inflection was not observed. Even the parameters of V3/F and Q/F of the peripheral compartment in the two-compartment model were predicted to be very small. Therefore, a one-compartment model was best suited for tramadol PK. In a previous study20 that population PK modeling was developed with two-compartment model of both parent and metabolite, and the parameter such as CL/F and CLPM/F do not make much difference with our results, but the inter-compartmental clearances were reported relatively large values. This finding suggests that the genotypes not only affected the PK parameter as a covariate, but also the structure of the model which required changing as a result of the genotypes.
Tramadol is metabolized by the cytochrome P450 (CYP) 2D6 enzyme to its primary active metabolite O-desmethyltramadol (M1) via O-demethylation.1,4 In our study, the genetic polymorphism of CYP2D6 significantly affected the CL/F (P<0.000, model 2), and CLPM/F (P<0.000, model 3 in Table 3). CL/F was estimated as 16.9 L/hr for wild type, and 11.0 L/hr for the CYP2D6*10/*10 group, while CLPM/F was estimated as 4.11 L/hr and 1.94 L/hr for wild type and CYP2D6*10/*10 group, respectively.
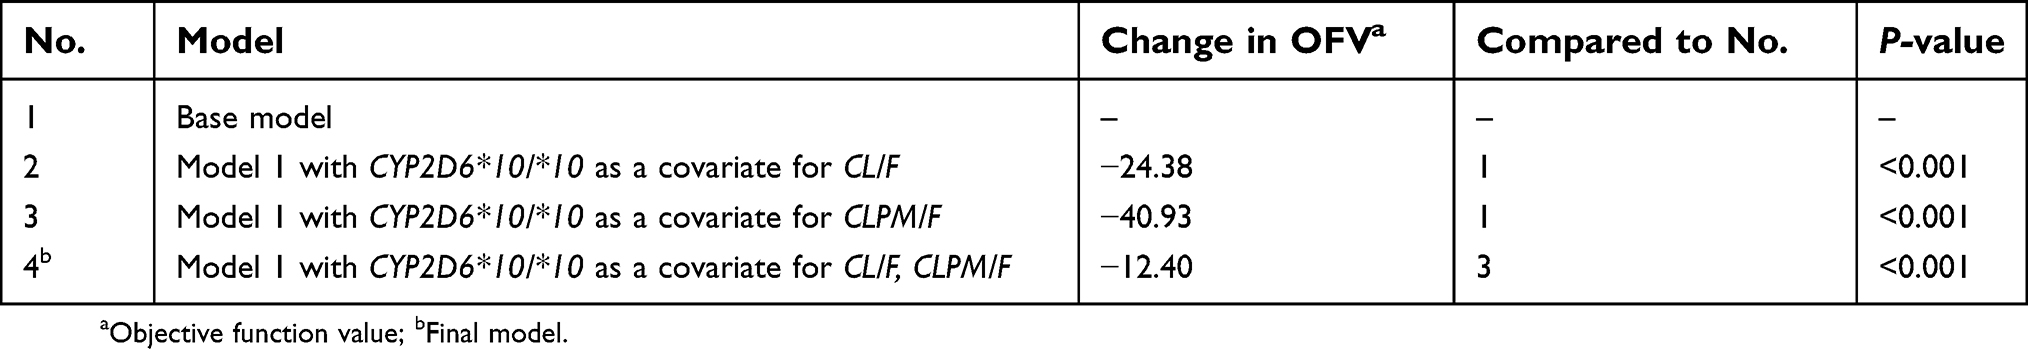 | Table 3 Summary of the covariate model building steps |
The final PK model and final estimates were used to simulate the time-concentration profiles following different dosing regimens. The simulations showed that the peak plasma concentration of tramadol for the CYP2D6 genotypes, CYP2D6*10/*10, was approximately 1.5 times higher than that of the wild type (CYP2D6*wt/*wt), at the steady state after multiple tramadol 100 mg twice daily administrations (Figure 6). It can be observed that the CYP2D6*10/*10 type may have adverse effects, even at low doses of tramadol, compared to those of the wild type. Thus, CYP2D6*10 genotype should always be considered when prescribing a drug, since variation in CYP2D6*10 activity has important therapeutic consequences, and can play a significant role in the development of adverse events or therapeutic failure in susceptible individuals21
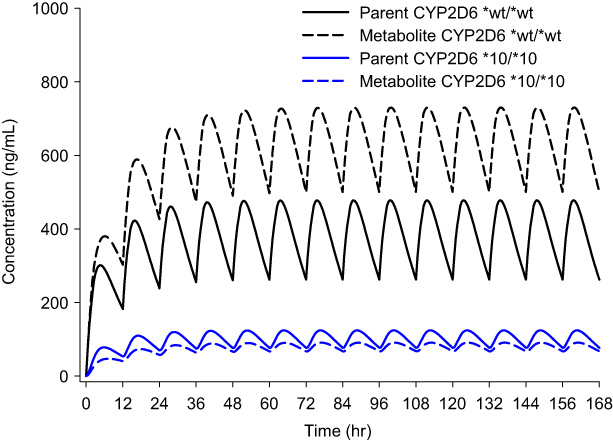 | Figure 6 Simulation of pharmacokinetic profiles of tramadol and O-desmethyltramadol (O-DSMT) during 1 week after twice-daily administration of 100 mg tramadol. |
For limitation of the study, among the 23 subjects, only one subject had CYP2D6*5 genotype and the data of the subject were excluded for model building. Larger populations with the various CYP2D6 genotypes should be included in further studies. Tramadol is a racemic mixture, and the R-tramadol and S-tramadol showed different roles in drug efficacy and safety.22,23 Moreover, in a previous study, tramadol inhibited the organic cation transporter 1 (OCT1) and the OCT1 was significant transporter for the O-desmethyltramadol and the polymorphism of OCT1 lead to differences in PKs and pharmacodynamics of O-desmethyltramadol.24,25 PK approach for each stereoisomers and polymorphism of OCT1 would provide more comprehensive understand and application of the model.
Conclusion
In conclusion, a population PK model for tramadol and its active metabolite, M1, were well fitted using a one-compartment PK model with combined first- and zero-order absorption, and reasonable parameters were obtained from the data of healthy Korean male subjects. In addition, the inter-individual variance in tramadol PK parameters can be estimated based on CYP2D6*10 polymorphism.
Acknowledgments
This study was supported by the Bio & Medical Technology Development Program of the National Research Foundation (NRF), and was funded by the Korean government (MSIP&MOHW) (No. NRF-2015M3A9E1028327).
Author contributions
All authors contributed to data analysis, drafting or revising the article, gave final approval of the version to be published, and agree to be accountable for all aspects of the work.
Disclosure
The authors report no conflicts of interest in this work.
References
1. Saarikoski T, Saari TI, Hagelberg NM, et al. Effects of terbinafine and itraconazole on the pharmacokinetics of orally administered tramadol. Eur J Clin Pharmacol. 2015;71(3):321–327. doi:10.1007/s00228-014-1799-2
2. Dayer P, Desmeules J, Collart L. Pharmacology of tramadol. Drugs. 1997;53(Suppl 2):18–24. doi:10.2165/00003495-199700532-00006
3. Faria J, Barbosa J, Moreira R, Queirós O, Carvalho F, Dinis‐Oliveira R. Comparative pharmacology and toxicology of tramadol and tapentadol. Eur J Pain. 2018;22(5):827–844. doi:10.1002/ejp.1196
4. Ryan NM, Isbister GK. Tramadol overdose causes seizures and respiratory depression but serotonin toxicity appears unlikely. Clin Toxicol. 2015;53(6):545–550. doi:10.3109/15563650.2015.1036279
5. Mohammadpour A, Ashkezari MD, Farahmand B, Shokrzadeh M. Demographic characteristics and functional performance of the kidneys and hearts of patients with acute tramadol toxicity. Drug Res. 2018;69:207–210.
6. Stassinos GL, Gonzales L, Klein-Schwartz W. Characterizing the toxicity and dose-effect profile of tramadol ingestions in children. Pediatr Emerg Care. 2017;35:117–120.
7. Wu W, McKown L, Liao S. Metabolism of the analgesic drug ULTRAM®(tramadol hydrochloride) in humans: API-MS and MS/MS characterization of metabolites. Xenobiotica. 2002;32(5):411–425. doi:10.1080/00498250110113230
8. Grond S, Meuser T, Uragg H, Stahlberg HJ, Lehmann KA. Serum concentrations of tramadol enantiomers during patient-controlled analgesia. Br J Clin Pharmacol. 1999;48(2):254–257.
9. Dong H, Lu S-J, Zhang R, Liu D-D, Zhang Y-Z, Song C-Y. Effect of the CYP2D6 gene polymorphism on postoperative analgesia of tramadol in Han nationality nephrectomy patients. Eur J Clin Pharmacol. 2015;71(6):681–686. doi:10.1007/s00228-015-1857-4
10. Li Q, Wang R, Guo Y, Wen S, Xu L, Wang S. Relationship of CYP2D6 genetic polymorphisms and the pharmacokinetics of tramadol in Chinese volunteers. J Clin Pharm Ther. 2010;35(2):239–247. doi:10.1111/j.1365-2710.2009.01102.x
11. Yu H, Hong S, Jeong CH, Bae JW, Lee S. Development of a linear dual column HPLC-MS/MS method and clinical genetic evaluation for tramadol and its phase I and II metabolites in oral fluid. Arch Pharm Res. 2018;41(3):288–298. doi:10.1007/s12272-017-0993-z
12. Yu H, Choi M, Jang JH, et al. Development of a column-switching LC-MS/MS method of tramadol and its metabolites in hair and application to a pharmacogenetic study. Arch Pharm Res. 2018;41(5):554–563. doi:10.1007/s12272-018-1013-7
13. Byeon JY, Kim YH, Lee CM, et al. CYP2D6 allele frequencies in Korean population, comparison with East Asian, Caucasian and African populations, and the comparison of metabolic activity of CYP2D6 genotypes. Arch Pharm Res. 2018;41(9):921–930. doi:10.1007/s12272-018-1075-6
14. Yoo HD, Lee SN, Kang HA, Cho HY, Lee IK, Lee YB. Influence of ABCB1 genetic polymorphisms on the pharmacokinetics of risperidone in healthy subjects with CYP2D6*10/*10. Br J Pharmacol. 2011;164(2b):433–443. doi:10.1111/j.1476-5381.2011.01385.x
15. Beal S, Sheiner L. NONMEM User Guides. San Francisco, CA: NONMEM Project Group; 1998.
16. Jonsson EN, Karlsson MO. Xpose-an S-PLUS based population pharmacokinetic/pharmacodynamic model building aid for NONMEM. Comput Methods Programs Biomed. 1999;58(1):51–64.
17. Bressolle F, Rochette A, Khier S, Dadure C, Ouaki J, Capdevila X. Population pharmacokinetics of the two enantiomers of tramadol and O-demethyl tramadol after surgery in children. Br J Anaesth. 2009;102(3):390–399. doi:10.1093/bja/aen405
18. Salman S, Sy SK, Ilett KF, Page-Sharp M, Paech MJ. Population pharmacokinetic modeling of tramadol and its O-desmethyl metabolite in plasma and breast milk. Eur J Clin Pharmacol. 2011;67(9):899–908. doi:10.1007/s00228-011-1023-6
19. Murthy BP, Skee DM, Danyluk AP, Brett V, Vorsanger GJ, Moskovitz BL. Pharmacokinetic model and simulations of dose conversion from immediate-to extended-release tramadol. Curr Med Res Opin. 2007;23(2):275–284. doi:10.1185/030079906X162773
20. Allegaert K, Holford N, Anderson BJ, et al. Tramadol and o-desmethyl tramadol clearance maturation and disposition in humans: a pooled pharmacokinetic study. Clin Pharmacokinet. 2015;54(2):167–178. doi:10.1007/s40262-014-0191-9
21. Bernard S, Neville KA, Nguyen AT, Flockhart DA. Interethnic differences in genetic polymorphisms of CYP2D6 in the US population: clinical implications. Oncologist. 2006;11(2):126–135. doi:10.1634/theoncologist.11-2-126
22. Grond S, Meuser T, Zech D, Hennig U, Lehmann KA. Analgesic efficacy and safety of tramadol enantiomers in comparison with the racemate: a randomised, double-blind study with gynaecological patients using intravenous patient-controlled analgesia. Pain. 1995;62(3):313–320.
23. Skinner-Robertson S, Fradette C, Bouchard S, Mouksassi MS, Varin F. Pharmacokinetics of tramadol and O-desmethyltramadol enantiomers following administration of extended-release tablets to elderly and young subjects. Drugs Aging. 2015;32(12):1029–1043. doi:10.1007/s40266-015-0315-4
24. Tzvetkov MV, Saadatmand AR, Lotsch J, Tegeder I, Stingl JC, Brockmoller J. Genetically polymorphic OCT1: another piece in the puzzle of the variable pharmacokinetics and pharmacodynamics of the opioidergic drug tramadol. Clin Pharmacol Ther. 2011;90(1):143–150. doi:10.1038/clpt.2011.56
25. Stamer UM, Musshoff F, Stuber F, Brockmoller J, Steffens M, Tzvetkov MV. Loss-of-function polymorphisms in the organic cation transporter OCT1 are associated with reduced postoperative tramadol consumption. Pain. 2016;157(11):2467–2475. doi:10.1097/j.pain.0000000000000662
 © 2019 The Author(s). This work is published and licensed by Dove Medical Press Limited. The full terms of this license are available at https://www.dovepress.com/terms.php and incorporate the Creative Commons Attribution - Non Commercial (unported, v3.0) License.
By accessing the work you hereby accept the Terms. Non-commercial uses of the work are permitted without any further permission from Dove Medical Press Limited, provided the work is properly attributed. For permission for commercial use of this work, please see paragraphs 4.2 and 5 of our Terms.
© 2019 The Author(s). This work is published and licensed by Dove Medical Press Limited. The full terms of this license are available at https://www.dovepress.com/terms.php and incorporate the Creative Commons Attribution - Non Commercial (unported, v3.0) License.
By accessing the work you hereby accept the Terms. Non-commercial uses of the work are permitted without any further permission from Dove Medical Press Limited, provided the work is properly attributed. For permission for commercial use of this work, please see paragraphs 4.2 and 5 of our Terms.