")
Back to Journals » International Journal of Nephrology and Renovascular Disease » Volume 9
Population-based estimation of renal function in healthy young Indian adults based on body mass index and sex correlating renal volume, serum creatinine, and cystatin C
Authors Rajagopalan P, Abraham G, Reddy YNV, Lakshmanasami R, Prakash M, Reddy Y
Received 25 January 2016
Accepted for publication 14 June 2016
Published 27 September 2016 Volume 2016:9 Pages 243—247
DOI https://doi.org/10.2147/IJNRD.S104983
Checked for plagiarism Yes
Review by Single anonymous peer review
Peer reviewer comments 2
Editor who approved publication: Professor Pravin Singhal
Prashanth Rajagopalan,1 Georgi Abraham,2 Yuvaram NV Reddy,2 Ravivarman Lakshmanasami,1 ML Prakash,1 Yogesh NV Reddy2
1Department of General Medicine, Mahatma Gandhi Medical College and Research Institute, Puducherry, 2Department of Nephrology, Madras Medical Mission Hospital, Chennai, India
Abstract: This population-based prospective study was undertaken in Mahatma Gandhi Medical College to estimate the renal function in young healthy Indian adults. A young healthy heterogeneous Indian cohort comprising 978 individuals, predominantly medical students, was assessed by a detailed questionnaire, and variables such as height, weight, body mass index (BMI), birth weight, and blood pressure were documented. Laboratory investigations included serum creatinine, serum cystatin C, blood sugar, urine protein, and imaging of the kidneys with ultrasound. The mean age of the cohort was 25±6 years, comprising 672 males and 306 females. The estimated glomerular filtration rates (eGFRs) by the Cockcroft–Gault formula for BMI <18.5 kg/m2, 18.5–24.99 kg/m2, 25–29.99 kg/m2, and ≥30 kg/m2 were 71.29±10.45 mL/min, 86.38±13.46 mL/min, 98.88±15.29 mL/min, and 109.13±21.57 mL/min, respectively; the eGFRs using cystatin C for the four groups of BMI were 84.53±18.14 mL/min, 84.01±40.11 mL/min, 79.18±13.46 mL/min, and 77.30±10.90 mL/min, respectively. This study attempts to establish a normal range of serum creatinine and cystatin C values for the Indian population and shows that in young healthy Indian adults, eGFR and kidney volume vary by BMI and sex.
Keywords: eGFR, birth weight, renal volume
Introduction
Genetic diversity and prenatal factors may have an impact on renal volume, number of glomeruli, and renal function. Previous publications have linked low birth weight and high risk of albuminuria, hypertension (HTN), salt sensitivity, and diabetes mellitus (DM).1,2 Brenner et al3 postulated and confirmed later by observing the relationship between low number of nephrons and HTN.4,5 The differences in lifestyle, dietary influences, and epigenetic mechanisms may account for the differences in body size and body weight changes with time, which correspond to changes in renal volume and renal function. Several studies have shown age-associated nephron loss.6,7 Increased kidney volume in healthy young adults is associated with higher body surface area (BSA). There are limited data on the kidney to body mass index (BMI) ratio in the young Indian adult population. Others have postulated that healthy adult Indians have lower glomerular filtration rate (GFR) in comparison to other ethnic groups.8 There were two previous studies looking at the normal range of GFR in adult Indian potential kidney donors who were of mean ages 35.16 years and 44.7 years, respectively.9
Studies have suggested no apparent tubular secretion of cystatin C although some have found tubular secretion in a defined group of hypertensive subjects.10 Thus, estimation of cystatin C is a robust marker and reflects GFR more accurately than serum creatinine.11 Therefore, cystatin C measurement significantly improves clinical decision making to justify its cost for detection of early renal impairment and prediction of long-term outcome.12 With that being said, equations based on serum creatinine that take into account age, sex, and race have been developed to improve its accuracy in the prediction of GFR.13
The reciprocal of cystatin C levels has been found to correlate well with measured GFR, and many equations based on cystatin C in specific populations have also been developed. Comparison of cystatin C-based equations with creatinine-based equations such as Schwartz, Modification of Diet in Renal Disease (MDRD), and Cockcroft–Gault (CG) formula has been rigorously assessed. Many found cystatin C-based equations to be superior to creatinine-based estimated GFR.11
Urinary clearance is cumbersome to measure in clinical practice and is often inaccurate because of incomplete urine collection. Hence, we used serum creatinine level and serum cystatin C levels to estimate GFR in our cohort.14
In addition to the GFR, the serum creatinine level depends on creatinine generation from muscle, extrarenal elimination, and tubular secretion. Using serum creatinine alone to estimate GFR is unsatisfactory and leads to delays in diagnosis and treatment of chronic kidney disease. For this reason, we also applied concurrent cystatin C measurements to estimate the GFR in our young healthy population.15,16 This population-based prospective study was undertaken in a medical college and hospital setting to estimate the renal function in young healthy Indian adults.
Materials and methods
We selected a young adult population (n=978) who came from different states, and hence, the cohort represented a diverse Indian population.
After obtaining approval from the institutional ethics committee at Mahatma Gandhi Medical College and Research Institute and written informed consent, health science students between the ages of 20 years and 35 years were recruited for a renal function assessment at Mahatma Gandhi Medical College & Research Institute, Puducherry, India, between June 2009 and December 2009.
The subjects were assessed by a detailed questionnaire that included demographic characteristics such as age, sex, height, weight, BMI, birth weight, and blood pressure. Laboratory investigations were conducted for serum samples of creatinine, cystatin C, fasting blood sugar, urine protein, and imaging of the kidneys with ultrasound.
The exclusion criteria from entering the study were presence of DM, presence of HTN (>140/90 mmHg), a family history of HTN, presence of chronic kidney disease, smoking, presence of proteinuria >1+, and subjects under medication and any concurrent medical illness. Out of the 1,000 subjects enrolled in the study, 32 were excluded.
BMI and BSA were calculated using the given data. Fasting blood sugar was measured by glucose oxidase–peroxidase method and serum creatinine by Jaffe’s Kinetic test.17 Cystatin C kits were exclusively purchased from abroad and after several standardization runs were used for the study. Roche Diagnostics’ Hitachi 902 machine was used for estimating serum creatinine and cystatin C using a latex-enhanced immunoturbidimetric assay. Urine protein was assessed by dipstick method. Estimated GFR (eGFR) was calculated from serum creatinine by CG formula and from serum cystatin C using Hoek’s formula GFR =-4.32+(80.35/Cystatin C) × BSA. The individuals were subjected to ultrasonography to calculate their renal volume. Ultrasonography was done by trained professionals who were blinded to the serum creatinine and cystatin C values. The dimensions of both the left and right kidneys were measured separately, and the volume was calculated on the ultrasonogram machine. The volume was calculated by the same group of trained doctors over the study period, and no new people were involved. The machine error was very low, and the operator error was ±5 mL.
The cohort was divided into four groups according to their BMI based on the WHO international classification, <18.5 kg/m2 (underweight), 18.5–24.99 kg/m2 (normal), 25–29.99 kg/m2 (overweight), and ≥30 kg/m2 (obese), and the groups were further subdivided by sex.
Serum creatinine, serum cystatin C, estimated creatinine clearance (CG formula), eGFR based on MDRD, cystatin C-based eGFR, and kidney volume were correlated with the four different groups of BMI as well as were based on sex.
The data were analyzed using SPSS . Student’s t-test, chi-square test, and one-way analysis of variance with post hoc Tukey’s test were used with a P-value <0.05 to be considered as statistically significant. The data were represented as mean ± standard deviation.
Results
After applying our exclusion criteria, there were 978 healthy young adults who formed the study group. They included 672 males and 306 females with a mean age of 25±6 years and a mean BMI of 22.3±2.5 kg/m2.
Baseline demographics are shown in Table 1.
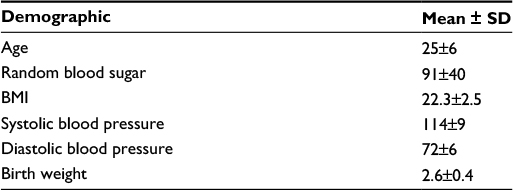 | Table 1 Baseline demographics of our patient population Abbreviations: SD, standard deviation; BMI, body mass index. |
Based on BMI, sex, and both, renal parameters such as serum creatinine, cystatin C, creatinine clearance using CG formula, eGFR from MDRD, and eGFR from cystatin C were compared and are shown in Tables 2–4.
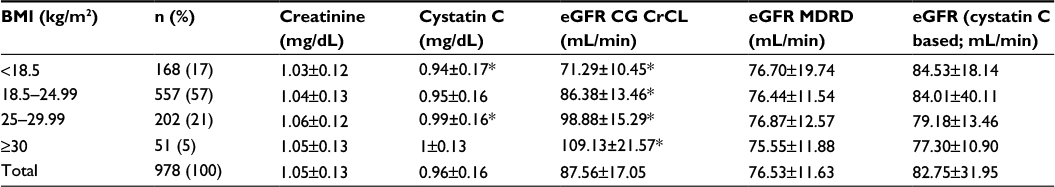 | Table 2 Serum creatinine, cystatin C, and estimated creatinine clearance according to BMI Note: *P-value <0.05 via post hoc Tukey’s test between the subgroups in a column. Abbreviations: BMI, body mass index; n, number of patients; eGFR, estimated glomerular filtration rate; CG CrCL, Cockcroft and Gault-based creatinine clearance; min, minute; MDRD, Modification of Diet in Renal Disease. |
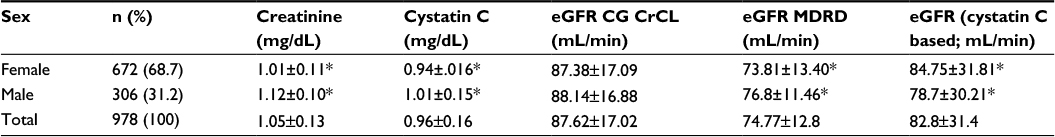 | Table 3 Serum creatinine, cystatin C, and estimated creatinine clearance according to sex Note: *P-value <0.05 via post hoc Tukey’s test between the subgroups in a column. Abbreviations: n, number of patients; eGFR, estimated glomerular filtration rate; CG CrCL, Cockcroft and Gault-based creatinine clearance; min, minute; MDRD, Modification of Diet in Renal Disease. |
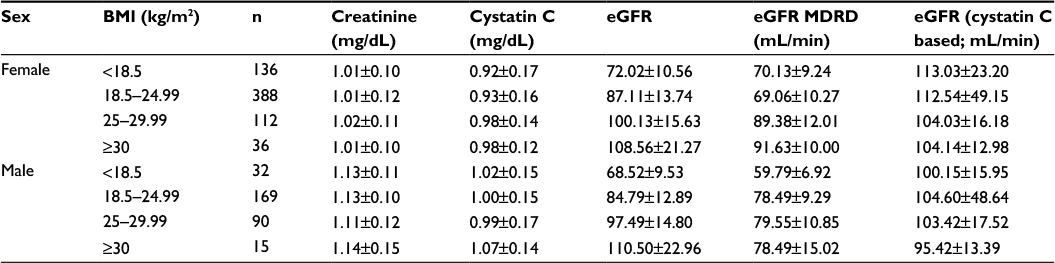 | Table 4 Serum creatinine, cystatin C, and estimated creatinine clearance according to BMI and sex Abbreviations: BMI, body mass index; n, number of patients; eGFR, estimated glomerular filtration rate; MDRD, Modification of Diet in Renal Disease; min, minute. |
Ultrasound-based renal volume according to sex and BMI is presented in Table 5.
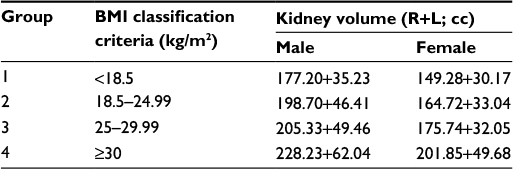 | Table 5 Ultrasound-based renal volume according to sex and BMI Abbreviations: BMI, body mass index; R, right; L, left. |
The creatinine-based eGFR was statistically significantly different based on different BMI groups (P<0.01), but was not statistically significantly different based on cystatin C, except in 34% of the study cohort.
Overall, serum creatinine and serum cystatin C were significantly different (P-value <0.05) based on sex as shown in Table 3.
Discussion
Our study is unique in several aspects. The Barai and Mahajan study was done on healthy kidney donors with a mean age of 35.16 years and 44.7 years.9 This study is unique because renal function and kidney biomarkers such as serum creatinine and cystatin C were established in healthy young adults (25±6 years). Hence, the effect of aging on the attrition of nephrons is negligible in our study. Furthermore, by excluding people with overt renal disease, DM, HTN, family history of DM, HTN, and previous significant illness and those on concurrent medications, there is very little chance of error in our establishment of normal GFR in a young heterogeneous Indian population.
Estimates of glomerular numbers in Europeans, Scandinavians, Australians, Americans, African Americans, and Australian Aboriginals demonstrated an average of ~900,000 glomeruli and a less than eightfold range with estimates ranging from just >200,000 to nearly 2 million glomeruli per kidney with differences in kidney volume.4,7,18,19 In our cohort, the eGFR was 87.56±17.05 mL/min by creatinine clearance estimation using CG formula and 82.75±31.95 mL/min by cystatin C eGFR estimation. The creatinine-based eGFR was statistically significantly different based on different BMI groups (P<0.01), but was not statistically significantly different based on cystatin C, except in 34% of the study cohort.
In another multicultural study, kidney weight correlated with BSA at all ages, varying 3.4-fold among adults, while kidney weight per meter square varied 3.7-fold. The percentage of sclerosed glomeruli varied from 0% to 23% and correlated strongly with age. Females had smaller kidneys than males and, marginally, fewer glomeruli. There were no significant variations by ethnic group.17
A postmortem study on glomerular volume, although in a small cohort, has shown that BMI has a direct correlation with glomerular function and hence kidney size in Africans, African Americans, Australian Aboriginals, and Australians.17,20 In our study, we analyzed the correlation of kidney volume with BMI and sex and found a direct correlation between them. Other studies done in Kuwait, Denmark, and Austria have assessed renal volumes in their population by either ultrasound or computed tomography and have helped establish a baseline of renal volume for their countries.21–24
Differences in body build and body composition between different ethnic groups suggest that creatinine-based estimated GFR (eGFR) derived for European populations may not be appropriate for others as muscle mass is a key determinant of serum creatinine levels and hence eGFR.25 Healthy Indians have lower muscle mass in comparison to Africans and Caucasians and hence a lower serum creatinine.26 It is interesting that our study showed that the kidney volume is lower in young healthy Indians compared to Caucasians and Africans. The kidney volume correlated with BMI in accordance with the existing studies, which reported an increase in kidney volume with increase in BMI. Contrary to prevalent data from developed countries, only 5% of our cohort had a BMI ≥30 kg/m2 and 20% were overweight with BMI between 25 kg/m2 and 29.99 kg/m2.27
Apart from several trial runs and patronage by a few corporate hospitals, cystatin C has not been widely used or accepted in the Indian medical practice. Though there is enough evidence to say that cystatin C is a better marker of kidney function and cardiovascular outcome, it is not used for estimation of GFR owing to its higher cost. In this prospective study, cystatin C as a biomarker was tested on a large cohort of 978 healthy subjects. Apart from establishing a baseline value for cystatin C in healthy young adults, this study will also promote the use of this biomarker to follow in healthy populations and those with kidney disease.
Although the study was conducted in just one institution, the participating subjects represent diversity as they come from different states in India covering all regions. Thus, this is a cross-sectional study not limited to a specific population from one part of the nation and is different from other previous studies (2×).28
The advantage of this cross-sectional study is that it recruited predominantly medical students who can be followed up in the future to see the effect of aging on GFR and kidney volume. If this cohort develops comorbidities such as DM, HTN, obesity, and chronic kidney disease, they can be followed up for future analysis and management.
CG formula has limitations for people with deranged kidney function and elderly and obese individuals. The equation should be used cautiously, if at all, in patients with fluctuating serum creatinine concentrations such as the critically ill individuals with acute kidney injury and patients requiring renal replacement therapy. Discrepancies between the CG- and MDRD-derived drug dosing regimens have been observed in elderly patients. Our prospective cohort consisted of healthy young individuals with no comorbid conditions, and hence, the CG formula may be a good estimate of GFR.
Conclusion
We analyzed a large cohort of young healthy Indians for estimation of kidney function using serum creatinine, cystatin C, BMI, kidney volume, urine protein, and birth weight. We have also tried to establish a normal range of values of serum creatinine and cystatin C for a heterogeneous group of young healthy Indians. We found that they have a lower eGFR and kidney volume compared to Africans and Caucasians. This cohort can be followed up longitudinally for changes in eGFR if they develop comorbidities.
Disclosure
The authors report no conflicts of interest in this work.
References
Hales CN, Barker DJ, Clark PM, et al. Fetal and infant growth and impaired glucose tolerance at age 64. Br Med J. 1991;303(6809):1019–1022. | ||
Barker DJ, Hales CN, Fall CH, Osmond C, Phipps K, Clark PM. Type 2 (non-insulin-dependent) diabetes mellitus, hypertension and hyperlipidemia (syndrome X): relation to reduced fetal growth. Diabetologia. 1993;36(1):62–66. | ||
Brenner BM, Garacia DL, Anderson S. Glomeruli and blood pressure. Less of one, more than other? Am J Hypertens. 1988;1(4 pt 1):335–347. | ||
Keller G, Zimmer G, Mall G, Ritz E, Amann K. Nephron number in patients with primary hypertension. N England J Med. 2003;348(2):101–108. | ||
Hoy WE, Hughson MD, Bertram JF, et al. Nephron number, hypertension, renal disease and renal failure. J Am Soc Nephrol. 2005;16(9):2557–2564. | ||
Tishkoff SA, Verrelli BC. Patterns of human genetic diversity: implications for human evolutionary history and disease. Annu Rev Genomics Hum Genet. 2003;4:293–340. | ||
Nyengaard JR, Bendtsen TF. Glomerular number and size and relation to age, kidney weight and body surface in normal man. Anat Rec. 1992;232(2):194–201. | ||
Singh NP, Ingle GK, Saini VK, et al. Prevalence of low glomerular filtration rate, proteinuria and associated risk factors in North India using Cockcroft-Gault and Modification of Diet in Renal Disease equation: an observational, cross-sectional study. BMC Nephrol. 2009;10:4. | ||
Mahajan S, Mukhiya GK, Singh R, et al. Assessing glomerular filtration rate in healthy Indian adults: a comparison of various prediction equations. J Nephrol. 2005;18(3):257–261. | ||
Van Rossum LK, Zietse R, Vulto AG, de Rijke YB. Renal extraction of cystatin C vs 125I-iothalamate in hypertensive patients. Nephrol Dial Transplant. 2006;21(5):1253–1256. | ||
Newman DJ, Thakkar H, Edwards RG, et al. Serum cystatin C measured by automated immunoassay: a more sensitive marker of changes in GFR than serum creatinine. Kidney Int. 1995;47(1):312–318. | ||
Dharnidharka VR, Kwon C, Stevens G. Serum cystatin C is superior to serum creatinine as a marker of kidney function: a meta-analysis. Am J Kidney Dis. 2002;40(2):221–226. | ||
Michels WM, Grootendorst DC, Verduijn M, Elliott EG, Dekker FW, Krediet RT. Performance of the Cockcroft-Gault, MDRD, and new CKD-EPI formulas in relation to GFR, age, and body size. Clin J Am Soc Nephrol. 2010;5(6):1003–1009. | ||
Cockcroft DW, Gault MH. Prediction of creatinine clearance from serum creatinine. Nephron. 1976;16(1):31–41. | ||
Perrone RD, Madias NE, Levey AS. Serum creatinine as an index of renal function: new insights into old concepts. Clin Chem. 1992;38(10):1933–1953. | ||
Rule AD, Larson TS, Bergstralh EJ, Slezak JM, Jacobsen SJ, Cosio FG. Using serum creatinine to estimate glomerular filtration rate: accuracy in good health and in chronic kidney disease. Ann Intern Med. 2004;141(12):929–937. | ||
Hoy WE, Douglas-Denton RN, Hughson MD, Cass A, Johnson K, Bertram JF. A stereological study of glomerular number and volume: preliminary findings in a multiracial study of kidneys at autopsy. Kidney Int Suppl. 2003;83:S31–S37. | ||
Brenner B, Garcia DL, Anderson S. Glomeruli and blood pressure. Less of one,more the other ? Am J Hypertens. 1988;1(pt 1):335–347. | ||
Hughson MD, Douglas-Denton R, Bertram JF, Hoy WE. Hypertension, glomerular number, and birth weight in African Americans and white subjects in the southeastern United States. Kidney Int. 2006;69(4):671–678. | ||
Silva AM, Shen W, Heo M, et al. Ethnicity-related skeletal muscle differences across the lifespan. Am J Hum Biol. 2010;22(1):76–82. | ||
Buchholz N-P, Abbas F, Biyabani SR, et al. Ultrasonographic renal size in individuals without known renal disease. J Pak Med Assoc. 2000;96:1. | ||
Emamian SA, Nielsen MB, Pedersen JF. Intraobserver and interobserver variations in sonographic measurements of kidney size in adult volunteers. ActaRadiologica. 1995;36(4):399–401. | ||
El-Reshaid W, Abdul-Fattah H. Sonographic assessment of renal size in healthy adults. Med Princ Pract. 2014;23(5):432–436. | ||
Glodny B, Unterholzner V, Taferner B, et al. Normal kidney size and its influencing factors – a 64-slice MDCT study of 1.040 asymptomatic patients. BMC Urol. 2009;9:19. | ||
Maple-Brown LJ, Lawton PD, Hughes JT, et al. Study protocol – accurate assessment of kidney function in indigenous Australians: aims and methods of the eGFR. BMC Public Health. 2010;10:80. | ||
Wang J, Streja E, Rhee CM, et al. Lean body mass and survival in hemodialysis patients and the roles of race and ethnicity. J Ren Nutr. 2016;26(1):26–37. | ||
Wagner DR, Heyward VH. Measures of body composition in blacks and whites: a comparative review. Am J Clin Nutr. 2000;71(6):1392–1402. | ||
Srinivas S, Annigeri RA, Mani MK, Rao BS, Kowdle PC, Seshadri R. Estimation of glomerular filtration rate in South Asian healthy adult kidney donors. Nephrology. 2008;13(5):440–446. |
 © 2016 The Author(s). This work is published and licensed by Dove Medical Press Limited. The full terms of this license are available at https://www.dovepress.com/terms.php and incorporate the Creative Commons Attribution - Non Commercial (unported, v3.0) License.
By accessing the work you hereby accept the Terms. Non-commercial uses of the work are permitted without any further permission from Dove Medical Press Limited, provided the work is properly attributed. For permission for commercial use of this work, please see paragraphs 4.2 and 5 of our Terms.
© 2016 The Author(s). This work is published and licensed by Dove Medical Press Limited. The full terms of this license are available at https://www.dovepress.com/terms.php and incorporate the Creative Commons Attribution - Non Commercial (unported, v3.0) License.
By accessing the work you hereby accept the Terms. Non-commercial uses of the work are permitted without any further permission from Dove Medical Press Limited, provided the work is properly attributed. For permission for commercial use of this work, please see paragraphs 4.2 and 5 of our Terms.