")
Back to Journals » Journal of Inflammation Research » Volume 14
Poor Clearance of Free Hemoglobin Due to Lower Active Haptoglobin Availability is Associated with Osteoarthritis Inflammation
Authors Sarkar A, Monu, Kumar V, Malhotra R, Pandit H, Jones E, Ponchel F, Biswas S
Received 7 January 2021
Accepted for publication 22 February 2021
Published 18 March 2021 Volume 2021:14 Pages 949—964
DOI https://doi.org/10.2147/JIR.S300801
Checked for plagiarism Yes
Review by Single anonymous peer review
Peer reviewer comments 2
Editor who approved publication: Professor Ning Quan
Ashish Sarkar,1,2 Monu,1,2 Vijay Kumar,3 Rajesh Malhotra,3 Hemant Pandit,4 Elena Jones,4 Frederique Ponchel,4 Sagarika Biswas1
1Department of Integrative and Functional Biology, CSIR-Institute of Genomics and Integrative Biology, New Delhi, 110007, India; 2Academy of Scientific and Innovative Research (AcSIR), Ghaziabad, Uttar Pradesh, 201002, India; 3All India Institute of Medical Sciences, New Delhi, 110029, India; 4Leeds Institute of Rheumatic and Musculoskeletal Medicine, School of Medicine, University of Leeds, Leeds, UK
Correspondence: Sagarika Biswas
Department of Integrative and Functional Biology, CSIR-Institute of Genomics and Integrative Biology, Near Jubilee Hall, Mall Road, New Delhi, 110007, India
Tel +91 11-2766-2581
Email [email protected]
Introduction: Circulating plasma proteins play an important role in various diseases, and analysis of the plasma proteome has led to the discovery of various disease biomarkers. Osteoarthritis (OA) is the most common chronic joint disease, mostly affecting people of older age. OA typically starts as a focal disease (in a single compartment, typically treated with unicompartmental knee replacement), and then progresses to the other compartments (if not treated in time, typically treated with total knee replacement). For this, identification of differential proteins was carried out in plasma samples of OA cases and compared with healthy controls. The aim of this study was to identify circulatory differentially expressed proteins (DEPs) in knee-OA patients undergoing total knee replacement or unicompartmental knee replacement compared to healthy controls and assess their role, in order to have better understanding of the etiology behind OA pathophysiology.
Methods: DEPs were identified with two-dimensional gel electrophoresis (2DE) and isobaric tags for relative and absolute quantification (iTRAQ), followed by liquid chromatography with tandem mass spectrometry. Validation of DEPs was carried out using Western blot and ELISA. Posttranslational modifications were checked after running native gel using purified protein from patients, followed by detection of autoantibodies.
Results: In total, 52 DEPs were identified, among which 45 were distinct DEPs. Haptoglobin (Hp) was identified as one of the most significantly upregulated proteins in OA (P=0.005) identified by both 2DE and iTRAQ. Decreased levels of Hp tetramers and increased levels of autoantibodies against Hpβ were observed in OA plasma.
Conclusion: Our data suggest that poor clearance of free hemoglobin and low levels of Hp tetramers may be associated with OA pathogenesis and inflammation.
Keywords: osteoarthritis, blood, haptoglobin, hemoglobin, biomarker, inflammation
Introduction
Osteoarthritis (OA) is the most common chronic joint disease associated with aging.1 Currently, OA accounts for 25% of joint problems2 and is the major cause of disability, leading to poor quality of life in the adult population. The etiology of OA is not yet well understood. OA pathogenesis is multifactorial, and its contributing factors are broadly linked to genetics, diet, lifestyle, injury, and obesity.3,4
There is currently a lack of knowledge regarding the cellular and molecular mechanisms initiating the disease and factors leading to bone and cartilage degradation and progression.5 Due to this lack of knowledge, OA treatment is largely symptomatic (ie, controlling pain or modifying lifestyle), allowing the disease to progress. Uncontrolled progression of OA ultimately leads to the need for a joint replacement, which is associated with considerable socioeconomic burden and medical complications.6 Currently, various imaging techniques, such as X-rays and magnetic resonance imaging, are used for diagnosis and grading of severity of OA, but these can only detect cartilage and bone degradation once they have already taken place.7
For joint replacement, OA patients are recommended either unicompartmental knee replacement (UKR) or total KR (TKR) surgery. In UKR, both cruciate ligaments and the two knee compartments are preserved, leading to faster recovery, more normal gait, better knee flexion, and lower cost than TKR.8,9 Normally, TKR is preferred, because of perception that it is more durable,10–12 despite the fact that up to 50% patients requiring KRs are suitable for a UKR.13–15 It would be useful to identify any specific biomarkers that are more commonly found in patients needing a UKR or those needing a TKR. There is significant interest and an absolute need to identify biomarkers, in order to understand the etiology behind OA pathogenesis and inform early clinical diagnosis, prognosis, and surgical choices for OA. Recently, strategies for biomarker discovery have included genomics, proteomics, metabolomics, and transcriptomics to identify candidate markers.16,17
The aim of the present study was to identify differentially expressed proteins (DEPs) between UKR and TKR OA cases and healthy controls (HCs). For this, we applied proteomic techniques (isobaric tags for relative and absolute quantification [iTRAQ] and two-dimensional gel electrophoresis [2DE]) followed by liquid chromatography with tandem mass-spectrometry (LC-MS/MS) using blood as a source sample. Blood is widely used for screening of potential protein biomarkers, because it is easy to access and offers the possibility of using large cohorts and repeated sampling.18,19
Proteomics has emerged as a highly promising technique for rapid detection of differentially expressed proteome profiles and biomarker discovery in biological samples. This method is widely used for the discovery of disease-associated biomarkers and understanding the pathogenesis of a number of diseases,20 where the most common method applied is a combination of 2DE and mass spectrometry.21 However significant improvements can be made by applying more advanced technique — iTRAQ.22
In this study, we identified 52 DEPs in OA patients’ plasma using both 2DE and iTRAQ. Haptoglobin (Hp), a free hemoglobin–scavenging protein,23 was identified as the most significant DEP, validated by Western blot and ELISA. Further, pure protein was purified by Immunoprecipitation (IP) and checked for posttranslational modifications (PTMs). Free hemoglobin detection in OA plasma was also carried out to validate our findings and demonstrate its utility and potential specificity for clinical diagnosis.
Methods
Patients
All OA patients (TKR and UKR, n=58) recruited fulfilled the American College of Rheumatology criteria for diagnosis of knee OA,24 with detailed disease history. All patients included in this study had a Kellgren–Lawrence (KL) score of 4 and had been referred to undergo either TKR or UKR. The KL grading system is a common method of classifying25 the severity of knee OA (using grades of 0–4, 4 being most severe).
Sample Collection and Processing
Whole-blood samples (4 mL) were collected from OA patients (TKR 45, UKR 13) in EDTA-coated vacutainers (Ptech, India) prior to surgery. Similarly, blood samples from HCs (n=40) with no clinical history of any joint-related disease, joint pain, or join discomfort were collected and included.25 Plasma samples were separated by centrifugation at 1,300 g for 10 minutes at 4°C and stored in multiple 20 µL aliquots in an Eppendorf tube at −80°C deep freezer until use. Demographic and clinical information about the OA patients and HCs is presented in Supplementary Table 1.
iTRAQ Labeling and Protein Identification
Three sets of pooled plasma samples were prepared from each group (TKR, UKR, and HCs, each n=12) and processed for protein digestion by trypsin (Promega, USA) followed by iTRAQ labeling using different isobaric tags (TKR tag115, UKR tag116, HCs tag117) and incubated for 2 hours at room temperature. Labeled peptides were then pooled, lyophilized, and analyzed with iTRAQ using standard protocols. For quantitative analysis, proteins with two or more unique peptides in at least one experiment with an unused score ≥2 only were considered26 (see details in Supplementary material).
Two-Dimensional Gel Electrophoresis
Plasma samples were also pooled and proteins (80µg) were subjected to 2DE:27,28 the first dimension with isoelectric focusing and the second with SDS-PAGE. Gels were then silver-stained using standard protocols.28,29 Experiments were repeated at least thrice using different pooled samples. Based on densitometry values, protein spots with fold change ≥2 in TKR/UKR compared to HCs were screened for protein identification (see details in Supplementary material).
In-Gel Digestion of Proteins and Preparation of LC MS/MS Analysis
Protein spots were excised from 2DE gels (minimum three gels), processed, and run on the LC MS/MS platform (Applied Biosystems, USA). MS/MS spectra were procured in reflector-positive mode over a mass scope of 10–20 kDa, and proteins having more than two unique peptides were considered4 (see details in Supplementary material).
Relationship with Major Pathways
DEPs were analyzed using DAVID (Database for Annotation, Visualization, and Integrated Discovery; version 6.8), an online tool for alignment of DEPs, with major pathways described. It provides functional interpretation of large numbers of genes/proteins derived from experimental studies.30 Proteins identified were first converted to their NCBI gene ID, then searched for associated pathways with maximum DEP hits.
Western Blot
Pooled plasma protein (20µg) from each group (TKR, UKR and HC) was separated by 12% SDS-PAGE and Western blot performed with an anti-Hp antibody (1:3,000), using standard procedures31 (see details in Supplementary material). Densitometry values of Western blot analysis were normalized with total protein, as well as a housekeeping protein (actin) as loading control.32,33 Experiments were repeated at least thrice.
Enzyme-Linked Immunosorbent Assays
ELISAs were performed using a commercial ELISA kit (CloudClone, USA) as per the manufacturer’s guideline using TKR (n=40), UKR (n=11), and HCs (n=17). We also performed indirect ELISAs manually, wherein plates were coated with diluted plasma samples (dilution 1:200) from individuals of each group (TKR 45, UKR 13, HCs 40) using standard protocols (see details in Supplementary material). The anti-Hp antibody (1:2,000) was used to detect Hp.27
Immunoprecipitation and Glycoprotein Staining
IP was performed to isolate pure Hp protein from OA and healthy plasma samples for detection of alteration in its native form using IP columns (Catch and Release version 2.0, Millipore, USA) and the anti-Hp antibody (2 μg). Concentration of protein in the plasma was measured by the Bradford method. From each group,500 μg total protein was added to the IP column as per the manufacturer’s guidelines. Immunoprecipitated protein samples (20 μL) from each group (TKR, UKR and HC) were then run on native (nondenaturing conditions) gel and transferred onto nitrocellulose (NC) membranes. The membranes were then subjected to glycoprotein detection using a GelCode glycoprotein-staining kit (Thermo Fisher Scientific, USA). Protein bands thus obtained were scanned using a ChemiDoc MP imaging system (Bio-Rad, USA).34 The IP-eluted samples (20 μL) were also run on SDS-PAGE, followed by silver staining. All experiments were repeated for at least thrice (see details in Supplementary material).
ProQ Diamond Staining
Phosphoprotein staining was performed for phosphoprotein detection using a ProQ gel-staining kit (Invitrogen, USA). Native gel was run as mentioned earlier, followed by phosphoprotein staining of gels and scanning using the ChemiDoc (see details in Supplementary material)
Autoantibody Detection
Proteins (2 μg) from immunoprecipitated samples of each group (TKR, UKR, and HCs) and controls (IgG control and plasma control) were separated by 12% SDS-PAGE, transferred to NC membranes, and incubated with diluted plasma (1:500 in PBS) as a source of primary autoantibodies, and incubated for 3 hours at room temperature followed by washing, incubation with goat antihuman horseradish peroxidase (HRP)–conjugated secondary antibody (1∶5,000, Jackson, USA) for 1 hour and developed with an enhanced chemiluminescence agent (G Bioscience, USA). Densitometry analysis was carried out using Image Lab 3.00 (Bio-Rad). Experiments were repeated at least thrice (as described in Supplementary material).
Ubiquitination
Proteins (10 μg) from immunoprecipitated samples of each group (TKR, UKR, and HCs) were separated with 12% SDS-PAGE, subsequently transferred to NC membranes, and blocked with 5% BSA. Blots were then incubated with antiubiquitin antibody followed by incubation with HRP-conjugated secondary antibody after washing. The membranes were then developed as mentioned earlier (see details in Supplementary material).
Free-Hemoglobin Detection
Free hemoglobin detection was carried out in plasma samples using a human free-hemoglobin ELISA kit (G Bioscience) as per the manufacturer’s guidelines (details in Supplementary material).
Statistical Analysis
Data were normalized using suitable controls according to the platform used. Graph was plotted using optical density and densitometry values using Microsoft Excel and GraphPad Prism (version 5). To compare data from different groups, we used nonparametric tests, as data were not normally distributed. Mann–Whitney U testsand ANOVA were used to compare data from two or more groups and ?2 for categorical data. P<.05 was considered significant, and Bonferroni correction for multiple testing was applied.
Results
Identification and Quantification of Differentially Expressed Proteins in OA-Patient Plasma
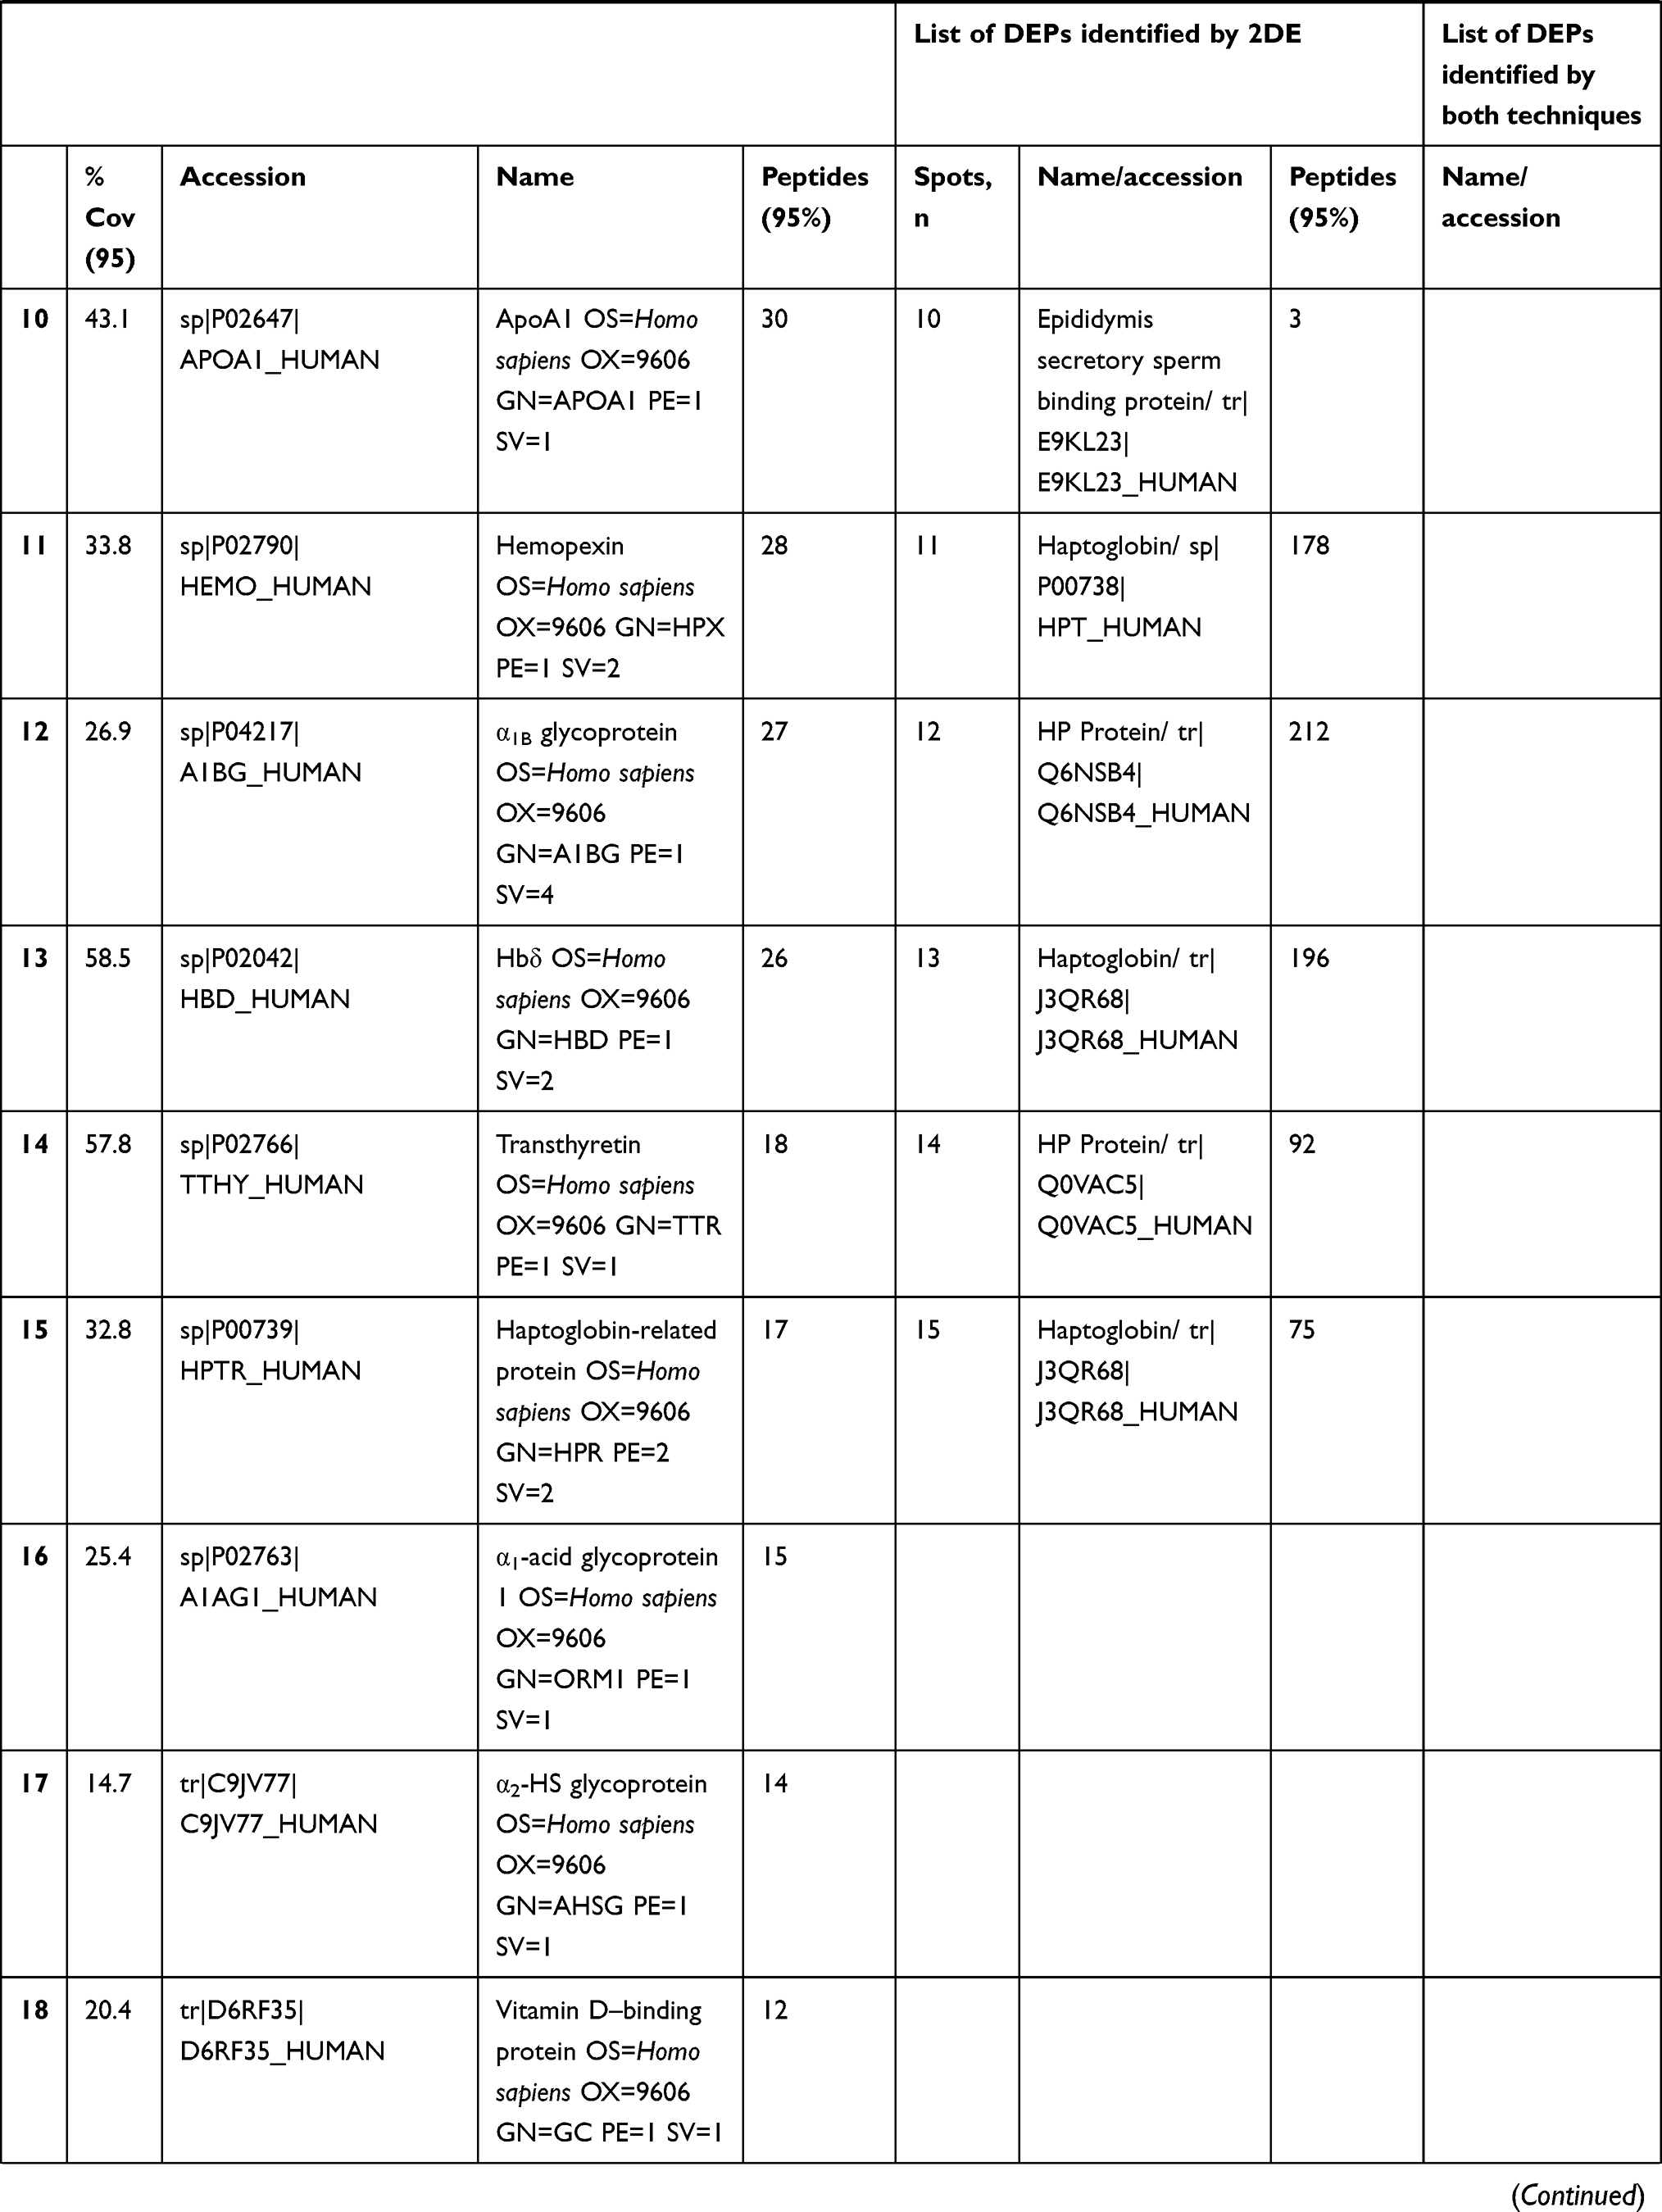
In total 52 DEPs were identified using proteomic techniques (2DE and iTRAQ,Table 1): 15 with 2DE (Figure 1) and 37 with iTRAQ (Table 1). However, with the 2DE method, several spots with the same accession number were identified per protein (probably reflecting isoforms), resulting in eight distinct DEPs. With iTRAQ, all 37 identified DEPs were distinct proteins. Therefore, 45 DEPs were identified in KL4-grade OA-patient plasma samples compared to HCs (P<0.05, Table 1). Among these 45 distinct DEPs, 30 were upregulated in TKR and 23 in UKR, while 21 were found to be common to both TKR and UKR patients compared to HCs (Figure 2A). Similarly, 13 proteins were downregulated in TKR and 20 in UKR, while ten were downregulated in both TKR and UKR patients compared to HCs (Figure 2B). Among these proteins, ten were highly upregulated or downregulated (samples 3–7, 29, 30, 32, and 34upregulated, sample 8 downregulated; Table 1) with fold change ≥2 in OA-patient plasma compared to HCs. Among all DEPs, Hp and serum albumin were found to be up regulated on both techniques (2DE and iTRAQ, Table 1). Hp was one of the most significantly upregulated proteins (2.39-fold, P=0.05) in OA patients compared to HCs. As such, the mechanism of its overexpression in OA was investigated further.
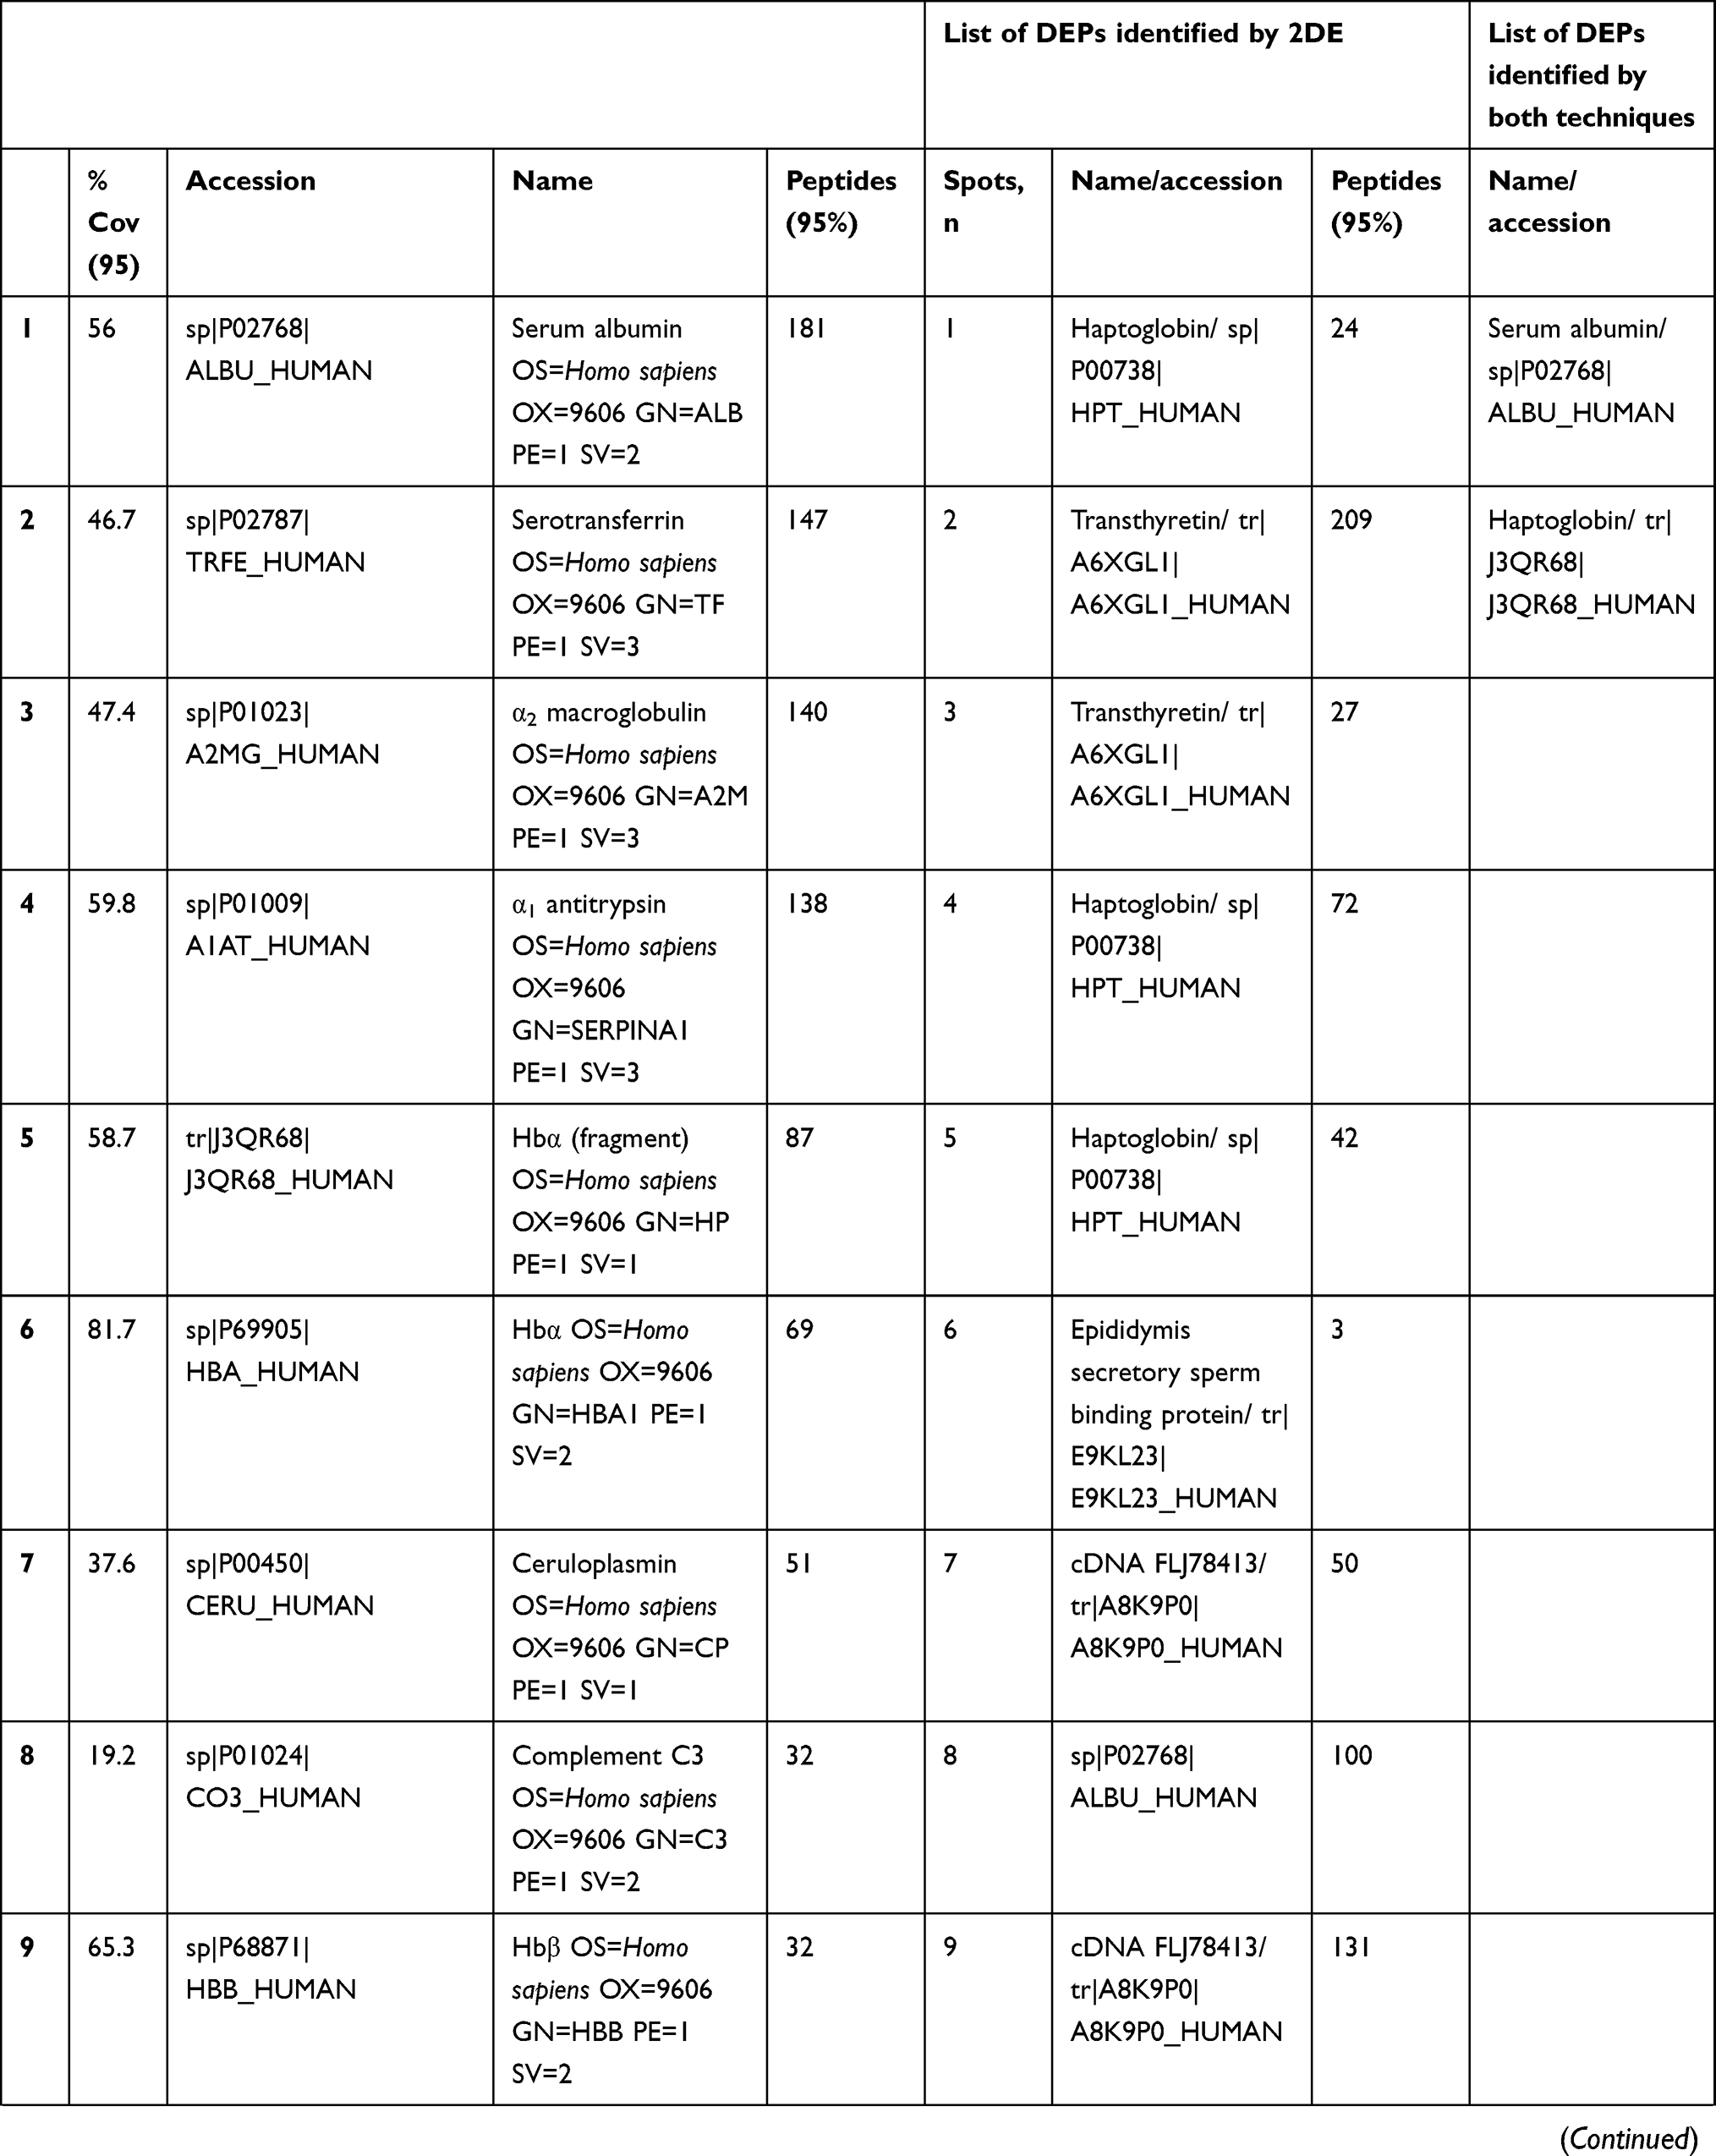 | 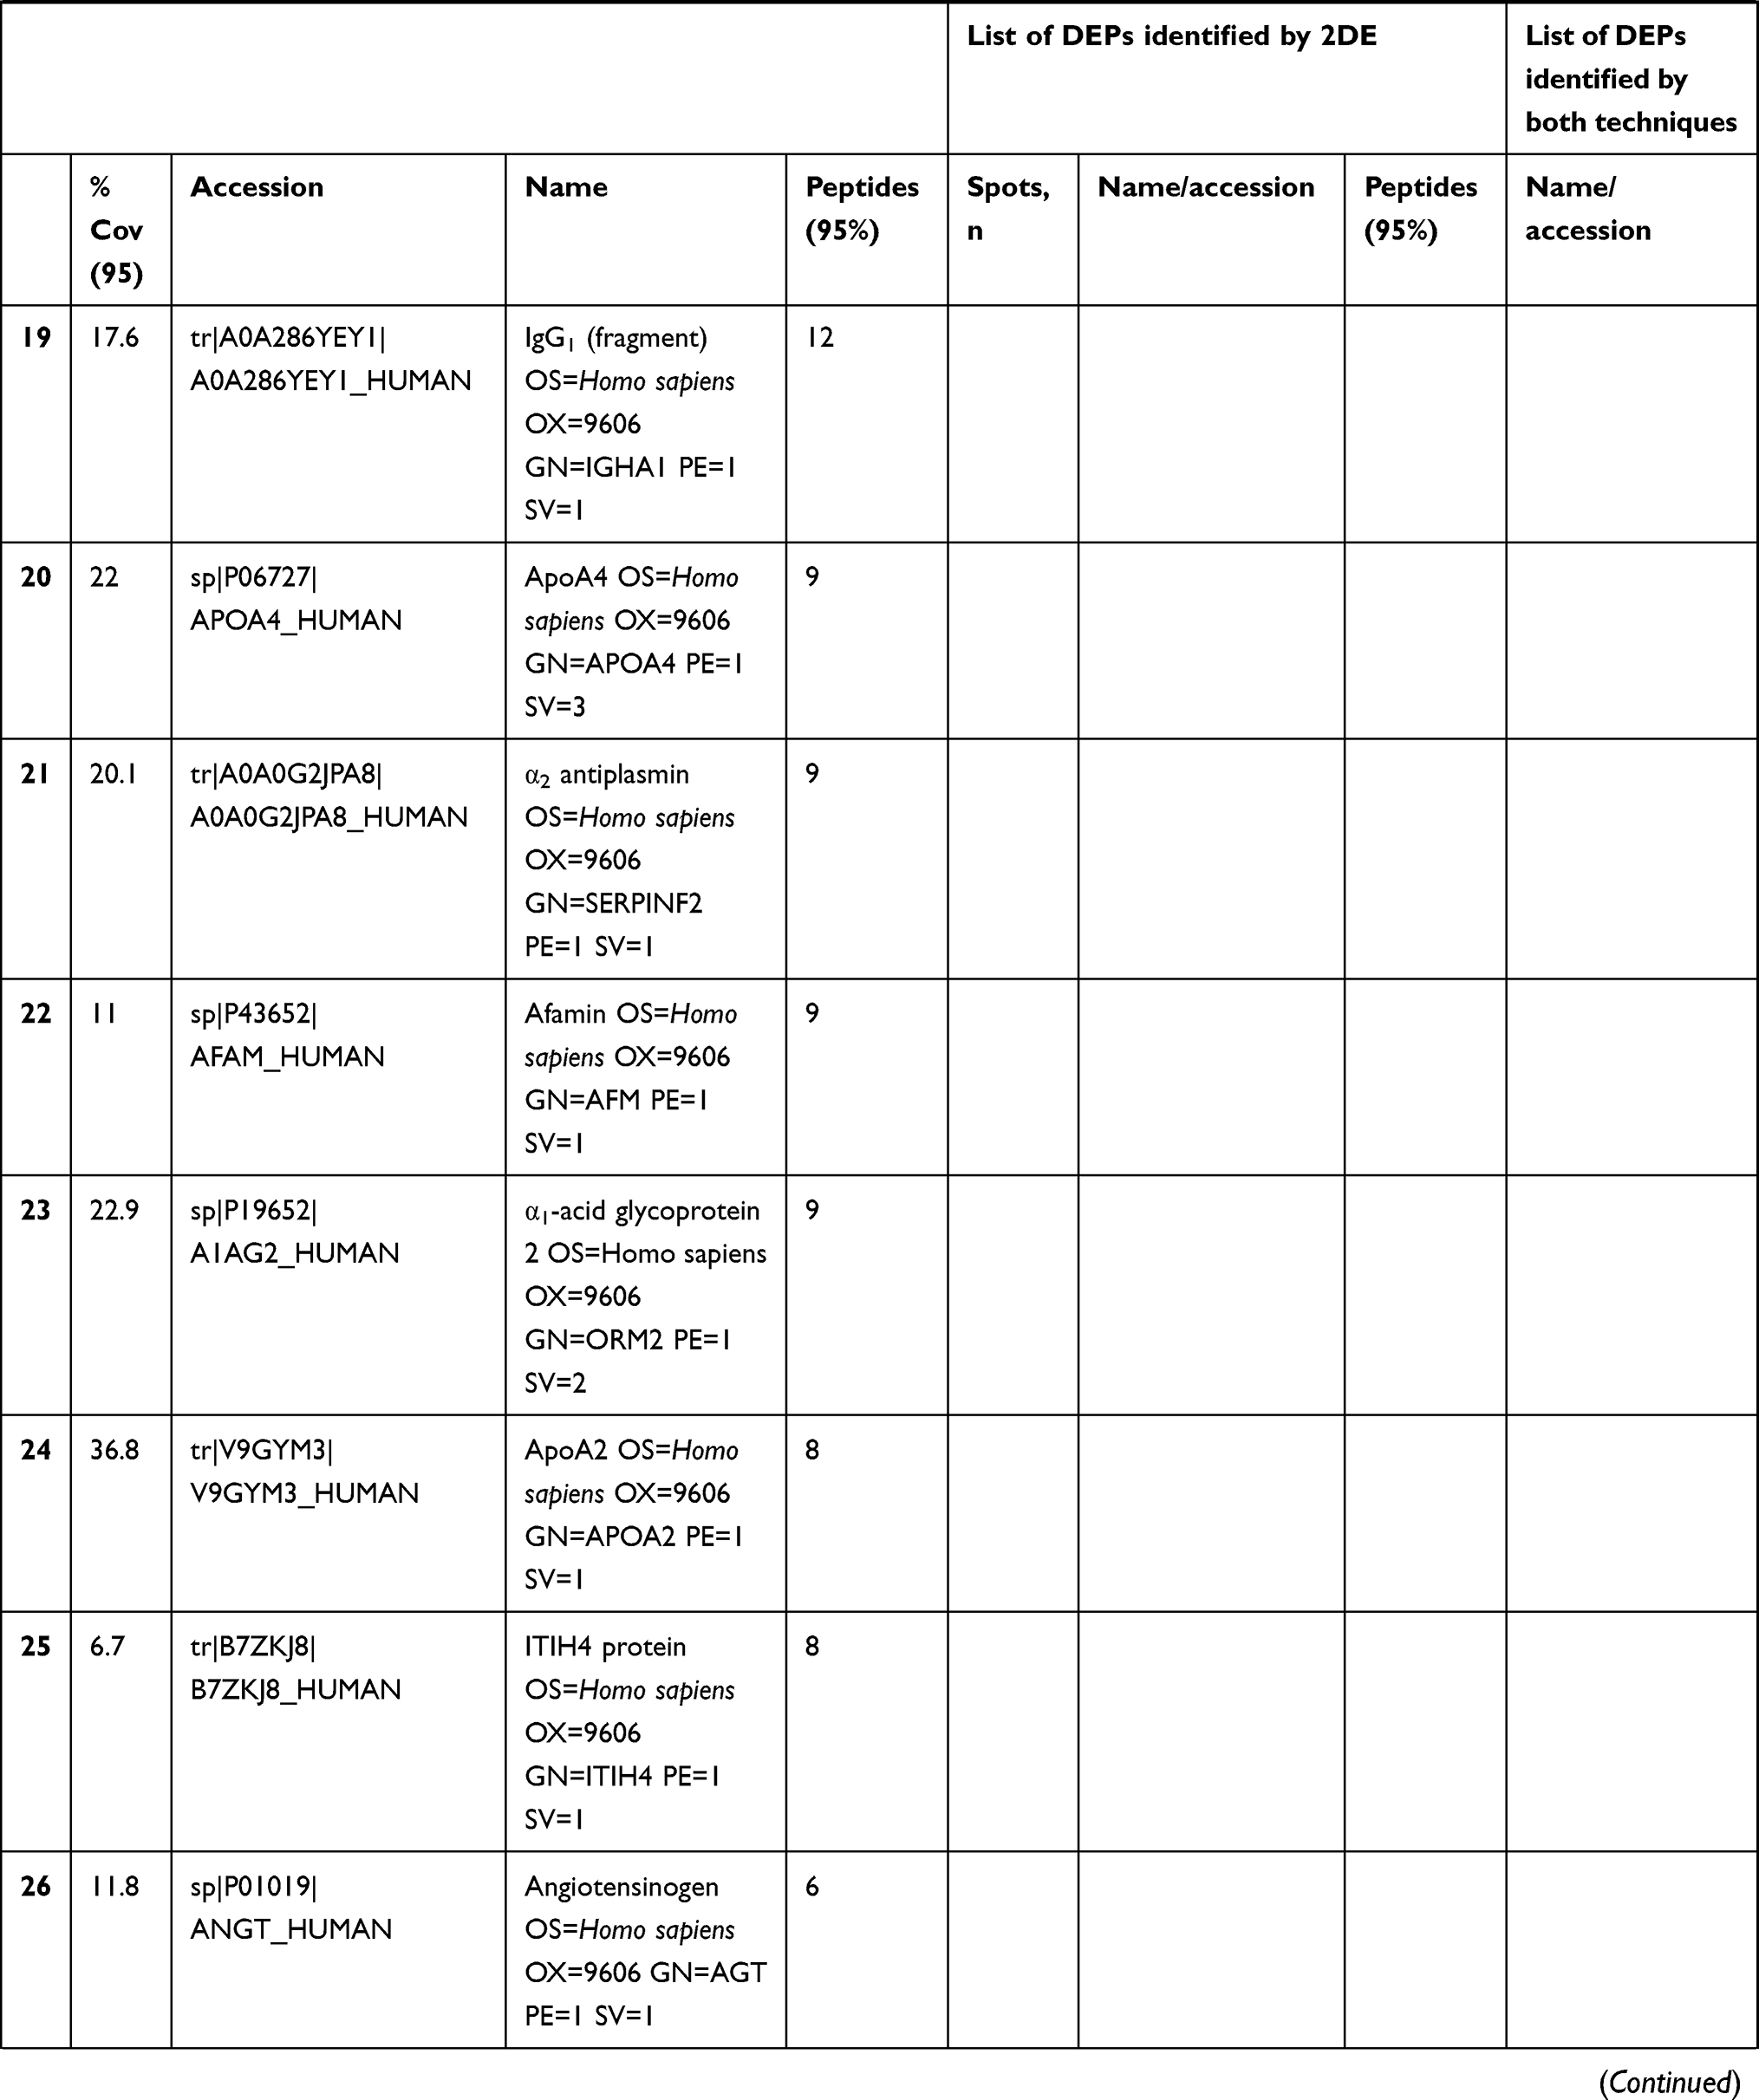 | 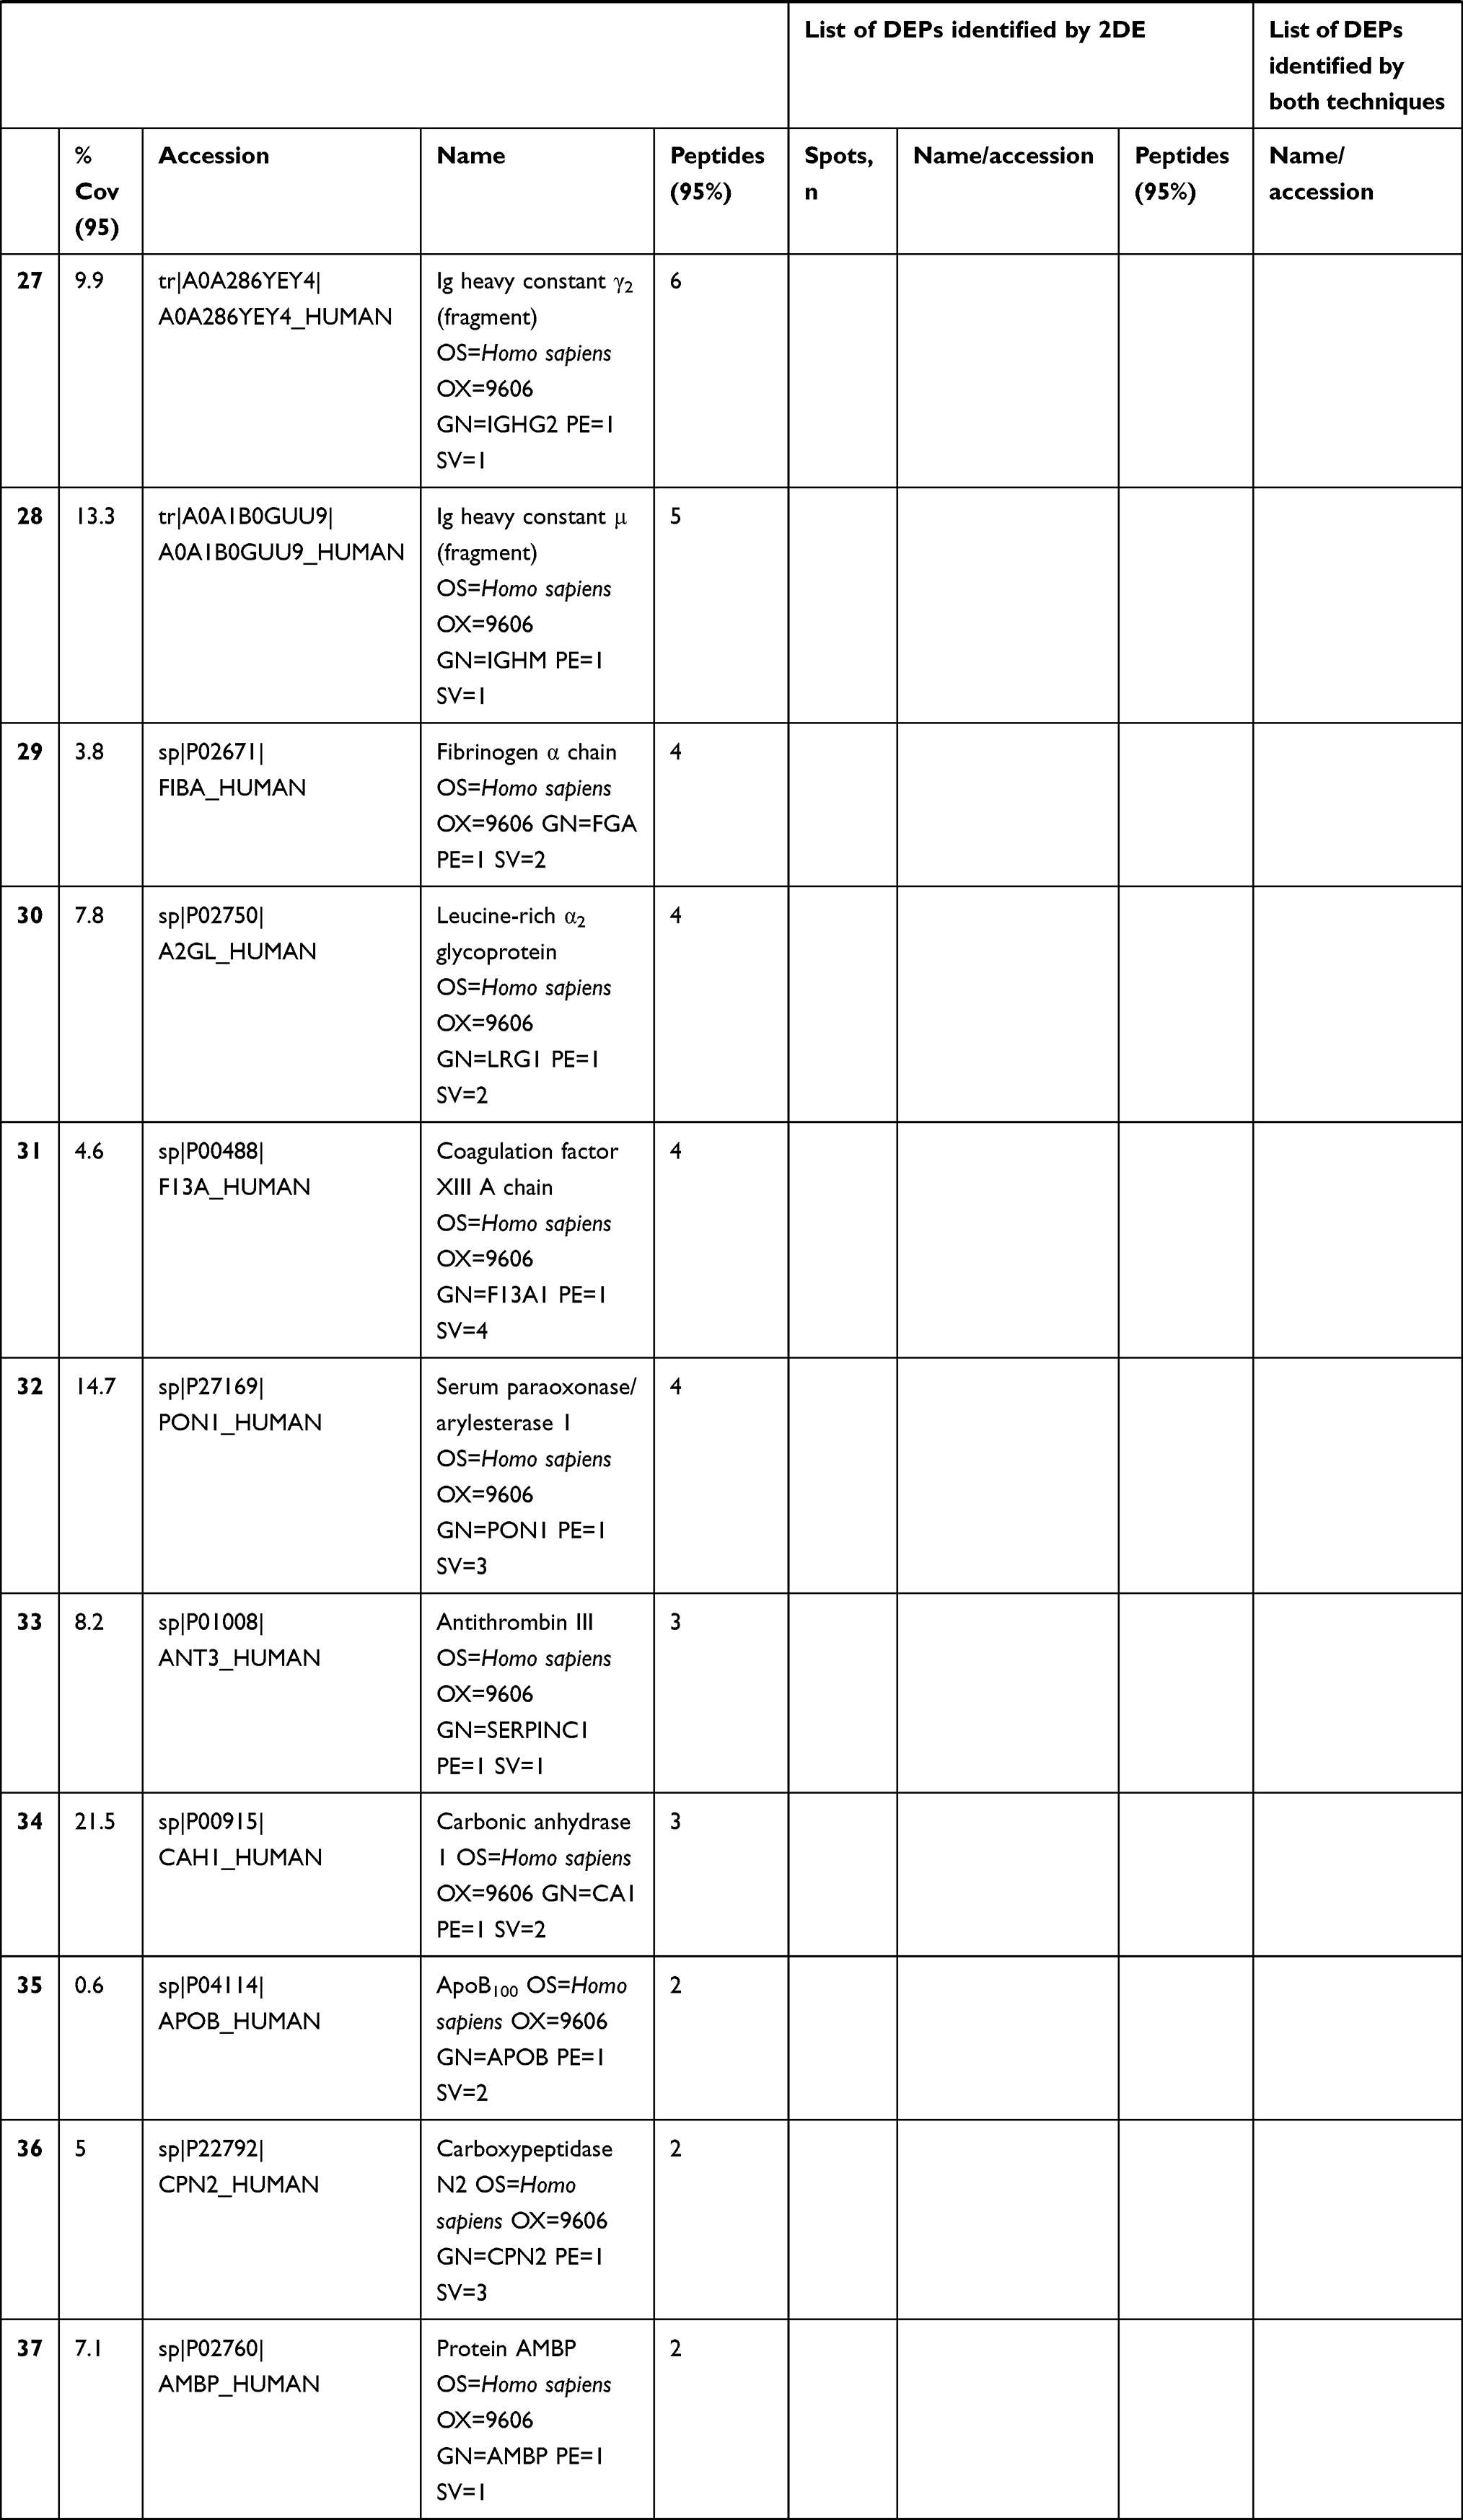 |
Table 1 Differentially expressed proteins (DEPs) identified by iTRAQ and 2DE in TKR/UKR blood plasma samples compared to HCs |
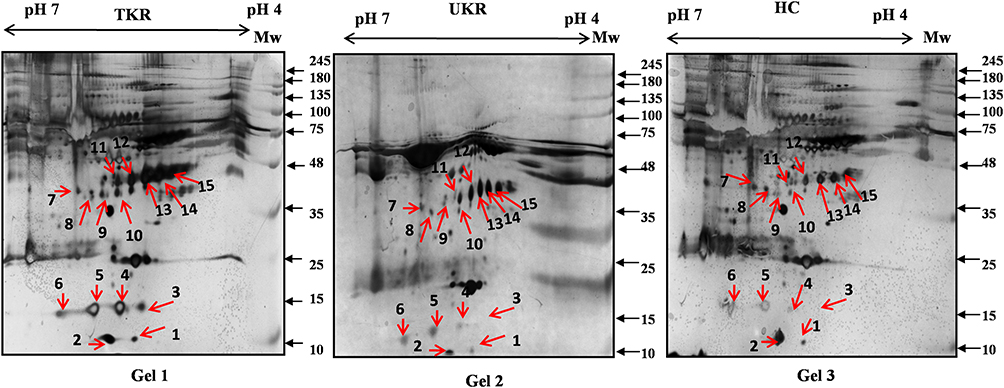 |
Figure 1 Two-dimensional gel electrophoresis (2DE) of plasma proteins. Representative 2DE gel images of plasma proteins showing differentially expressed protein spots in TKR (gel 1), UKR (gel 2), and HCs (gel 3), marked with arrows and numbered 1–15. Protein spots were excised from the protein gel and identified by liquid chromatography with tandem mass spectrometry. Abbreviations: Mw, molecular weight; TKR, total knee replacement; UKR, unicompartmental knee replacement; HCs, healthy controls. |
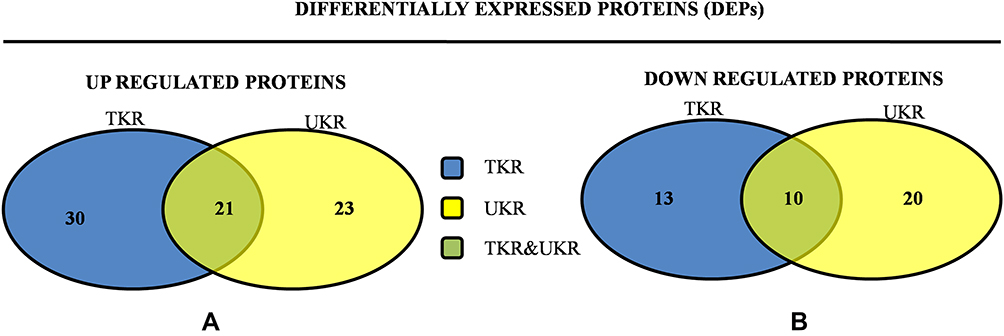 |
Figure 2 Venn diagrams of distribution of differentially expressed proteinsidentified in TKR and UKR. (A) Upregulated DEPs and their distribution among TKR and UKR: 30 proteins were upregulated in TKR and 23 in UKR patients, while 21 were common to both TKR and UKR patients. (B) Similarly, 13 proteins in TKR and 20 proteins in UKR patients were downregulated and ten common to both TKR and UKR patients compared to healthy controls. Abbreviations: TKR, total knee replacement; UKR, unicompartmental knee replacement. |
DAVID Pathway Analysis of DEPs
DAVID pathway analysis of all the identified DEPs provided the maximum hits for the “complement and coagulation pathway”. Seven proteins — A2M, F13A1, C3), FGA, SERPINA1, SERPINC1, and SERPINF2 — were found to be associated with this pathway (Supplementary Figure 1). Pathway enrichment indicated not only involvement of immunoresponse and inflammation but also homeostasis or related problems among OA patients.35
Validation with Western Blot and ELISA
For initial confirmation and validation, OA (TKR 12, UKR 12) and HC (12) plasma samples were pooled from same-age and -sex participants. The DEP level of Hp was then validated in pooled samples with Western blotting (Figure 3A). Densitometry values were normalized by total protein (Figure 3A, lower panel) and actin (Supplementary Figure 2) as loading control. Densitometry analysis followed by normalization revealed 1.5-fold and 1.4-fold increased Hp expression in TKR and UKR, respectively, compared to HCs (Figure 3B). ELISAs on with individual plasma samples of OA (TKR 40, UKR 11) and HCs (17), revealed 0.8-fold (P=0.0003) and 0.95-fold (P=0.05) lower Hp levels in TKR and UKR than HCs, respectively. Moreover, there was 0.89-fold (P=0.05) lower expression in TKR than UKR. The corresponding concentration of Hp was 1,417 ng/μL in TKR and 1,584 ng/μL in UKR compared to 1,655 ng/μL in HC plasma samples (Figure 3C). Further, the results of indirect ELISAs performed manually with increased sample sizes also revealed similar results (Supplementary Figure 3). The ELISA results were thus observed to be contradictory to our findings on 2DE gel, iTRAQ, and Western blot analysis. The main difference between Western blot and ELISA is that Western blot measures denatured protein with linearized epitope antibodies and is more likely to be able to quantify total protein. In contrast, ELISA measures native protein and may be sensitive to PTMs, protein complexes, and structural epitopes.
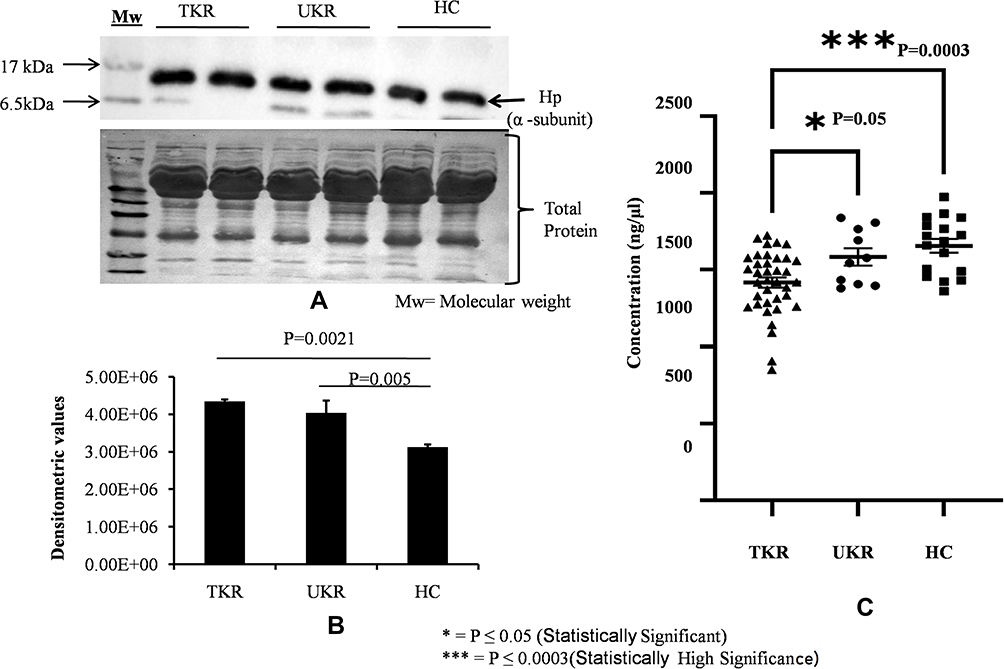 |
Figure 3 Validation of haptoglobin (Hp) expression in plasma. (A) Representative Western blot image of pooled plasma samples (TKR = 12, UKR = 12, HCs = 12) developed using anti-Hp antibody to detect Hpα. Hpα protein expression was normalized with total protein (lower panel) with Ponceau staining of membrane. (B) Densitometric analysis showing 1.5 fold upregulated Hpα in TKR (pP=0.0021) and 1.4-fold in UKR (pP=0.005) compared to HCs. Analysis was done using mean values of three independent experiments. (C) ELISA results showing Hp concentrations in blood plasma of TKR (n=40), UKR (n=11) and HCs (n=17). Average Hp concentration was found lowered by 1,417 ng/μL in TKR and 1,584 ng/μL compared to 1,655 ng/μL in HC plasma samples. The average fold change was found to be 0.8 (P=0.0003) and 0.95 (P=0.05) in TKR and UKR compared to HCs, respectively. TKR also showed 0.89-fold (P=0.05) lower levels of Hp than UKR. Abbreviations: TKR, total knee replacement; UKR, unicompartmental knee replacement; HCs, healthy controls. |
Posttranslational Modification and Level of Hp Tetramer Protein in Plasma
In order to decipher these contradictory results, Hp PTM was checked. Native protein was purified using IP from OA and HC plasma (pooled from 12 patients in each group of TKR, UKR, and HCs), followed by protein separation with SDS-PAGE and native gels. The gels were then glycostained or phosphostained to detect any change in PTM of Hp tetrameric structure. Glycostaining analysis of Western blot membranes showed (Figure 4A) reductions in glycosylated Hp tetramers to 0.69-fold and 0.83-fold, respectively, in TKR and UKR plasma samples compared to HCs (Figure 4B), suggesting that the decreased levels of glycosylated Hp tetramer in OA plasma may have contributed to the discrepancy between Western blot and ELISA data. However, phosphostaining of native gels showed no significant difference in band intensities of TKR, UKR, or HCs, indicating that there was no change in the phosphorylation status of Hp (Supplementary Figure 4). To further strengthen our data, the presence of autoantibodies in OA plasma was checked.
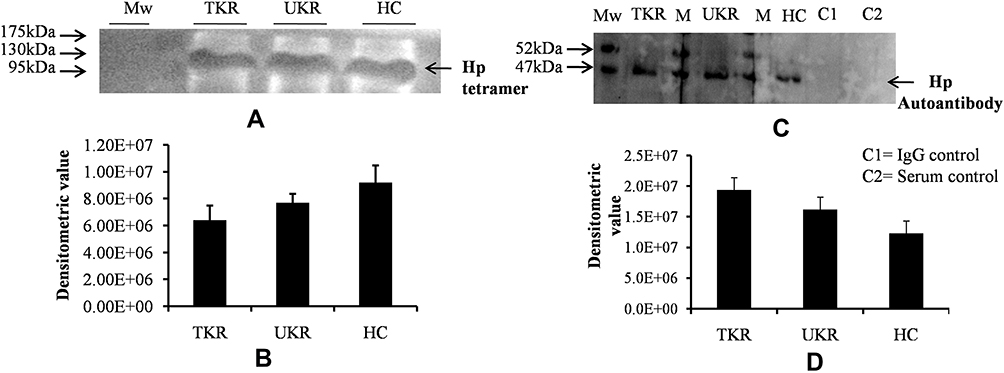 |
Figure 4 Native-gel analysis and autoantibody detection against haptoglobin (Hp). (A) Representative glycoprotein-stained image of Western blot after running native PAGE using purified native Hp protein (tetramer) by immunoprecipitation from plasma samples indicated low levels of Hp tetramer (120 kDa) in TKR and UKR compared to HCs. (B) Densitometric analysis of glycosylated Hp native band shows lower levels of Hp tetramer in TKR (0.69-fold) and UKR (0.83-fold) than HCs. (C) Western blot was carried out after running SDS-PAGE using IP-eluted purified Hp protein and using blood plasma as source of primary antibodies followed by incubation with antihuman secondary antibody. The image represents increased levels of autoantibodies against Hpβ in TKR and UKR plasma compared to HCs. (D) Densitometric analysis of Western blot indicating subsequent increased level of autoantibodies (1.57-fold in TKR and 1.31-fold in UKR) against Hpβ compared to HC plasma samples. Abbreviations: Mw, molecular weight; TKR, total knee replacement; UKR, unicompartmental knee replacement; HCs, healthy controls; Hp, haptoglobin. |
Presence of Autoantibodies Against Hp in Plasma
Although OA has not been considered an autoimmune disease,36 many autoantibodies have been reported in OA against such proteins as MAT2β-AAb,37 CHST14,38 and extracellular matrix proteins,39 but there have been no reports of the presence of autoantibodies against Hp. Interestingly, we identified Hp autoantibodies in OA samples. A band at 52 kDa was observed, suggesting recognition of Hpβ (Figure 4C). Densitometry analysis suggested 1.57- and 1.31-fold increase in expression of autoantibodies against Hpβ in TKR and UKR patients, respectively, compared to HCs (Figure 4D).
Lower Levels of Hpβ and Its Ubiquitination in Disease
The ubiquitination status of of Hpβ was checked to find the reason for the presence of autoantibodies against Hp. Densitometry analysis of Western blots of ubiquitinated Hp from TKR/UKR and HCs was performed (Figure 5A). The results showed 0.22-fold and 0.37-fold lower ubiquitination in TKR and UKR samples, respectively, compared to HCs (Figure 5B). We further checked Hpβ expression in disease using IP-eluted samples. SDS-PAGE of these followed by silver staining (Figure 5C) suggested that there was significantly less Hpβ in TKR (0.47-fold) and UKR (0.41-fold) patients than HCs (Figure 5D). We further evaluated changes in ubiquitination of Hpβ, and found only 45% and 86% ubiquitination in TKR and UKR patients, respectively, compared to 96% ubiquitination of Hpβ in HCs. The change in ubiquitination levels among TKR/UKR patients compared to HCs suggests that ubiquitination may possibly be PTMs involved in the production of autoantibodies against Hp in OA patients.
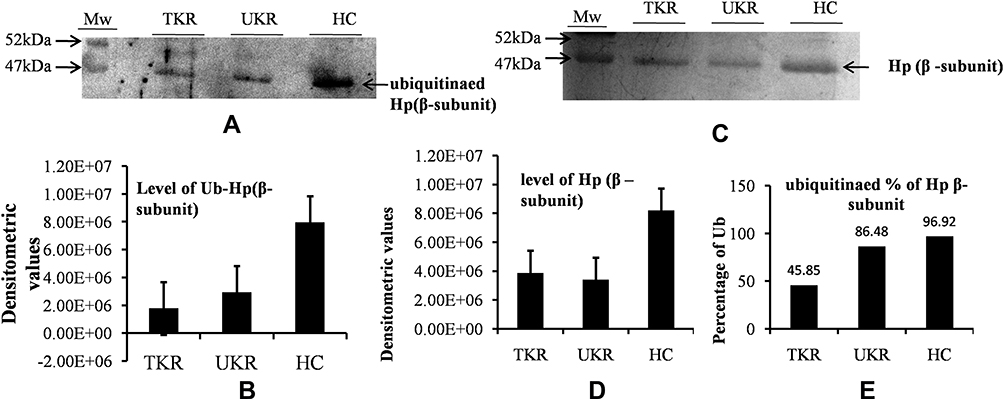 |
Figure 5 Ubiquitination of haptoglobin (Hp) by Western blot analysis. (A) Representative Western blot image showing that there were decreased levels of ubiquitinated Hpβ in TKR/UKR compared to HCs. Ubiquitination of Hpβ was detected using antiubiquitin antibody after immunoprecipitated Hp had been separated on SDS-PAGE followed by Western blot. (B) Densitometry analysis showing decreased ubiquitination of Hp in TKR (0.22-fold) and UKR (0.37-fold) compared to HCs. (C) Silver-stained image of gel after running SDS-PAGE using purified Hp, indicating lower levels of Hpβ in TKR and UKR patients than HCs. (D) Densitometry analysis of gel image for Hpβ showing lower levels of Hpβ in TKR (0.47-fold) and UKR (0.41-fold) than HCs. (E) Ubiquitination percentages of Hpβ in TKR, UKR, and HCs, showing 45.85% Hpβ) ubiquitinated in TKR and 86.48% in UKR compared to 96.92% in HCs. Abbreviations: TKR, total knee replacement; UKR, unicompartmental knee replacement; HCs, healthy controls; Ub, ubiquitination. |
Confirmation of Increased Levels of Free Hemoglobin in OA Patients
Evaluation of free-hemoglobin levels in plasma was performed using ELISAs. Average levels of free hemoglobin in TKR (n=45) and UKR (n=13) patients were significantly increased to 71 μg/ml and 66 μg/mL, respectively, compared to 50 μg/mL (basal level in human plasma sample) in HC samples (n=40, P=0.003; Figure 6A). Specificity (95%) and sensitivity (95%) evaluated by a receiver- operating characteristic (ROC) curve (Figure 6B) confirmed true-positive results against false-positive ones.
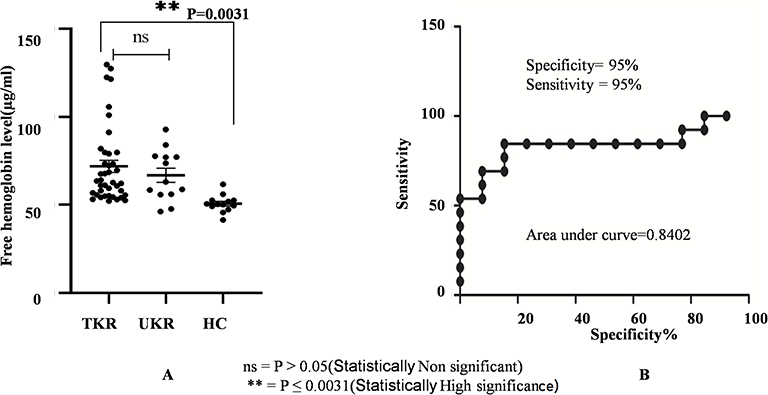 |
Figure 6 Free hemoglobin plasma–level analysis. (A) Circulating free hemoglobin in plasma was quantified in TKR (n=39), UKR (n=13), and HCs (n=13) using ELISA. The dot plot shows increased circulating free hemoglobin in TKR and UKR blood plasma compared to HCs. Free hemoglobin in TKR was found 71 μg/mL and 66 μg/mL in UKR compared to 50 μg/mL basal level in HCs. (B) ROC plot indicating individual protein abundance in each group with area under curve (AUC) of 0.8402 with 95% sensitivity and 95% specificity between the groups. Abbreviations: TKR, total knee replacement; UKR, unicompartmental knee replacement; HCs, healthy controls; ROC, receiver-operating characteristic; NS not significant. |
Discussion
The current study was designed to identify novel OA-associated protein markers in severely affected OA patients (TKR and UKR cases, KL4 grade). The inconclusive clinical difference in deciding the type of joint replacement needed (TKR/UKR) for patients led us to perform a differential protein–profile study, with a belief that DEPs among TKR and UKR patients and HCs may additionally develop into biomarkers for surgeon’ choices.40 Using a proteomic approach, Hp was observed to have a better peptide score (209, Table 1), and was hence chosen for detailed study. The Hp protein is well known for its free hemoglobin–clearance activity, linked with the “complement and coagulation pathway”41 on DAVID pathway analysis. Free hemoglobin has been found to be associated with inflammation,42–44 and triggers complement activation via intravascular hemolysis.45 Hp consists of 2 α and 2 β chains: Hpα typically has 14–18 kDa molecular mass, while the molecular mass of Hpβ is 45 kDa.46 The HP gene harbors three types of Hp (1-1, 2-1, and 2-2).47 Hp1 and Hp2 are susceptible to various diseases (eg, cancer, cardiovascular disease, diabetes, rheumatoid arthritis),44,48 but their role in OA is not known. Although some reports have shown that Hp is upregulated in human OA serum samples49,50 and in synovial fluid of knee OA, further validation has not been carried out.51 We found significantly upregulated expression of Hpα in OA cases (TKR and UKR) compared to HCs (Figure 3A and B), but this result was not replicated on ELISA. Three Hp proteins have been identified but a reason for their up- or downregulation has not been put forward.48,49 These seemingly contradictory results supported our findings, and we reasoned that this may be possible if there is a difference in native tetramer form and its denatured form due to the possibility of degradation of protein monomers.46 Decreased levels of glycosylated Hp tetramer by native gel in OA plasma (Figure 4A) indicated that there was possibly degradation of proteins (Hp) and that may have triggered autoantibody production.52,53 Similar results were also noted while using individual plasma samples from OA patients (Supplementary Figure 5). However, the inaccurate protein folding in old age may also be an added reason for reduction in glycosylated active Hp.54 To confirm our hypothesis, autoantibodies against Hpβ subunit were identified and found to be increased in TKR and UKR (Figure 4, panel C). The involvement of other PTMs (phosphorylation, ubiquitination) status of Hp tetramer was also checked. Phosphorylation status revealed no change in Hp phosphorylation, indicating that autoantibody production was not due to phosphorylation (Supplementary Figure 4).
In ubiquitination, the E3 ubiquitin ligase depletes MARCH2 by targeting substrate-protein degradation, which may be responsible for reduced secretion of Hp.54,55 Highly decreased levels (Figure 5B) of ubiquitination in OA cases (TKR 45% and UKR 86%) compared to HCs (97%;Figure 5E) revealed decreased levels of E3 ubiquitin ligase and altered degradation pathway for Hp.56 Deregulated ubiquitination events are associated with immunological disorders and autoimmune and inflammatory diseases,57 indicating that ubiquitination may be responsible for triggering autoantibody formation in OA. For more confirmation, protein subunits were separated and detected with SDS-PAGE58 using purified patient protein (Hp), revealing lower Hpβ levels at 45 kDa (Figure 5C and D) and upregulation in Hpα (Supplementary Figure 6) in UKR/TKR patients compared to HCs. The autoantibody against the Hpβ may lead to its degradation, and hence lower levels of Hpβ may be responsible for lowering of Hp tetramer formation. However, the key factor responsible for autoantibody formation leading to the degradation of Hpβ remains unclear.
It has reported that the Hp precursor is an N-linked glycoprotein52 cleaved into α and β chains,46 and it is also known that active Hp binds with hemoglobin at specific sites on Hpβ and β-globin chain of hemoglobin59 and alters Hp’s biochemical profile,43 and thus the level of Hp increases for the clearance of circulating free hemoglobin in blood,23 playing a role in the maintenance of cellular iron homeostasis. The increase in free-hemoglobin levels in UKR and TKR patients in our study suggested that Hp has strong potential to neutralize the adverse physiological effects of free Hb.41
Some reports have concluded that obesity is a low-grade systemic inflammation condition60 positively correlated with body-mass index (BMI), progressivelyincreasing the risk of knee OA.61,62 As per our observations (supplementary Table 1) the difference in BMI between the OA groups was not found to be significant (TKR and UKR). This may have been due to the small sample of UKR patients. Obese mice deficient in TNFα or TNFα receptors do not exhibit the typical increase in Hp mRNA.63 This signifies that upregulation of Hp is specifically associated with inflammation,64 neither due to the obesity nor increased BMI of OA patients. However, future studies looking at a larger cohort may be helpful to understand the chain of events more precisely. Inappropriate functioning of Hp leads to wear and tear of the joints.65,66 Our study provides new evidence that lower levels of Hp tetramer may be one of the factors associated with initiation of inflammation in OA.
Conclusion
Hp was found to be an important factor in regulating hemoglobin homeostasis and inflammation in severely affected knee-OA patients (TKR and UKR surgical cases). Downregulation of active Hp tetramer accompanied by increased levels of free hemoglobin indicated poor clearance of free hemoglobin in patients with severe OA, and may be responsible for disease severity. This study thus contributes to understanding of the inflammation cascade in severe OA patients, and should be helpful in understanding its etiology and developing new treatment strategies.
Data Sharing Statement
For all original data and detail protocol, please contact Dr Sagarika Biswas([email protected]).
Ethics Statement
The study protocol was approved by the Medical Ethics Committee of the All India Institute of Medical Sciences, Department of Orthopaedics, New Delhi, India (CSIR-IGIB/IHEC2017-18 Dt.08.02.2018) and the Council of Scientific and Industrial Research, Institute of Genomics and Integrative Biology, Delhi, India (CSIR-IGIB/IHEC/2017-18, February 8, 2018). All study protocols complied with the Declaration of Helsinki.
Consent for Publication
Written signed consent was obtained from all participating patients and healthy volunteers.
Acknowledgments
We would like to thank Dr Rajan Panthee for providing biological samples, Mr Rahul for technical assistance and mass-spectrometry data acquisition, and Mr Pankaj for transporting biological samples from the hospital to the lab. We acknowledge the Department of Science and Technology for providing funding and the Council of Scientific and Industrial Research of the Institute of Genomics and Integrative Biology for providing research support. Professor Pandit is a National Institute for Health Research (NIHR) senior investigator. The views expressed in this article are those of the author(s) and not necessarily those of the NIHR or the Department of Health and Social Care.
Author Contributions
All authors made substantial contributions to conception and design, acquisition of data, or analysis and interpretation of data, took part in drafting the article or revising it critically for important intellectual content, agreed to submit to the current journal, gave final approval to the version to be published, and agree to be accountable for all aspects of the work.
Funding
This research was funded by the Department of Science and Technology (DST), New Delhi, India.
Disclosure
Professor Hemant Pandit reports grants from the UK India Research Initiative, during the conduct of the study. The authors report no other potential conflicts of interest for this work.
References
1. Herrero-Beaumont G, Roman-Blas JA, Castaneda S, et al. Primary osteoarthritis no longer primary: three subsets with distinct etiological, clinical, and therapeutic characteristics. Semin Arthritis Rheum. 2009;39(2):71–80. doi:10.1016/j.semarthrit.2009.03.006
2. Chen D, Shen J, Zhao W, et al. Osteoarthritis: toward a comprehensive understanding of pathological mechanism. Bone Res. 2017;5:16044. doi:10.1038/boneres.2016.44
3. Charlesworth J, Fitzpatrick J, Perera NKP, et al. Osteoarthritis- a systematic review of long-term safety implications for osteoarthritis of the knee. BMC Musculoskelet Disord. 2019;20(1):151. doi:10.1186/s12891-019-2525-0
4. Biswas S, Sharma S, Saroha A, et al. Identification of novel autoantigen in the synovial fluid of rheumatoid arthritis patients using an immunoproteomics approach. PLoS One. 2013;8(2):e56246. doi:10.1371/journal.pone.0056246
5. Michael JW, Schlüter-Brust KU, Eysel P. The epidemiology, etiology, diagnosis, and treatment of osteoarthritis of the knee. Dtsch Arztebl Int. 2010;107(9):152–162.
6. Piscitelli P, Iolascon G, Di Tanna G, et al. Socioeconomic burden of total joint arthroplasty for symptomatic hip and knee osteoarthritis in the Italian population: a 5‐year analysis based on hospitalization records. Arthritis Care Res. 2012;64:1320–1327. doi:10.1002/acr.21706
7. Braun HJ, Gold GE. Diagnosis of osteoarthritis: imaging. Bone. 2012;51(2):278–288. doi:10.1016/j.bone.2011.11.019
8. Liotta LA, Petricoin EF. Serum peptidome for cancer detection: spinning biologic trash into diagnostic gold. J Clin Invest. 2006;116:26–30. doi:10.1172/JCI27467
9. Baird AL, Westwood S, Lovestone S. Blood-based proteomic biomarkers of alzheimer’s disease pathology. Front Neurol. 2015;6:236.
10. Laurencin CT, Zelicof SB, Scott RD, et al. Unicompartmental versus total knee arthroplasty in the same patient, A comparative study. Clin Orthop. 1991;273:151–156.
11. Nha K-W, Shon O-J, Kong B-S, et al. Gait comparison of unicompartmental knee arthroplasty and total knee arthroplasty during level walking. PLoS One. 2018;13(8):e0203310. doi:10.1371/journal.pone.0203310
12. Lyons MC, MacDonald SJ, Somerville LE, et al. Unicompartmental versus total knee arthroplasty database analysis: is there a winner? Clin Orthop Relat Res. 2012;470(1):84–90. doi:10.1007/s11999-011-2144-z
13. Kim KT. Unicompartmental knee arthroplasty. Knee Surg Relat Res. 2018;30(1):1–2. doi:10.5792/ksrr.18.014
14. Beard DJ, Holt MD, Mullins MM, et al. Decision making for knee replacement: variation in treatment choice for late stage medial compartment osteoarthritis. Knee. 2012;19(6):886–889. doi:10.1016/j.knee.2012.05.005
15. White SH, Ludkowski PF, Goodfellow JW. Anteromedial osteoarthritis of the knee. J Bone Joint Surg Br. 1991;73:582–586. doi:10.1302/0301-620X.73B4.2071640
16. Newman JH, Ackroyd CE, Shah NA. Unicompartmental or total knee replacement? Five-year results of a prospective, randomised trial of 102 osteoarthritic knees with unicompartmental arthritis. J Bone Joint Surg Br. 1998;80:862–865. doi:10.1302/0301-620X.80B5.0800862
17. Cameron HU, Jung YB. A comparison of unicompartmental knee replacement with total knee replacement. Orthop Rev. 1988;17:983–988.
18. Marshall KW, Zhang H, Nossova N. Chondrocyte genomics: implications for disease modification in osteoarthritis. Drug Discov Today. 2006;11(17–18):825–832. doi:10.1016/j.drudis.2006.07.004
19. Aigner T, Saas J, Zien A, et al. Analysis of differential gene expression in healthy and osteoarthritic cartilage and isolated chondrocytes by microarray analysis. Methods Mol Med. 2004;100:109–128. doi:10.1385/1-59259-810-2:109
20. Mobasheri A. Osteoarthritis year 2012 in review: biomarkers. Osteoarthr Cartil. 2012;20(12):1451–1464. doi:10.1016/j.joca.2012.07.009
21. Chan PY, Wasinger VC, Leong RW. Current application of proteomics in biomarker discovery for inflammatory bowel disease. World J Gastrointest Pathophysiol. 2016;7(1):27–37.
22. Swiatly A, Horala A, Matysiak J. Understanding ovarian cancer: iTRAQ-based proteomics for biomarker discovery. Int J Mol Sci. 2018;19(8):2240. doi:10.3390/ijms19082240
23. Langlois MR, Delanghe JR. biological and clinical significance of haptoglobin polymorphism in humans. Clin Chem. 1996;42(10):1589–1600. doi:10.1093/clinchem/42.10.1589
24. Altman RD. Criteria for the classification of osteoarthritis of the knee and hip. Scand J Rheumatol Suppl. 1987;65:31–39. doi:10.3109/03009748709102175
25. Kellgren JH, Lawrence JS. Radiological assessment of osteo-arthrosis. Ann Rheum Dis. 1957;16:494–502. doi:10.1136/ard.16.4.494
26. Basak T, Tanwar VS, Bhardwaj G, et al. Plasma proteomic analysis of stable coronary artery disease indicates impairment of reverse cholesterol pathway. Sci Rep. 2016;6:28042. doi:10.1038/srep28042
27. Hussain S, Dutta A, Sarkar A, et al. Proteomic analysis of irradiated lung tissue of mice using gel-based proteomic approach. Int J Radiat Biol. 2017;93(4):373–380. doi:10.1080/09553002.2016.1266058
28. Monu KR, Sharma A, Chaddar MK, et al. Plasma proteome profiling of coronary artery disease patients: downregulation of transthyretin—an important event. Mediators Inflamm. 2020;2020:3429541.
29. Biswas S, Karl-Heinz F, Sharma NK, et al. Synovial fluid phosphoproteome profile of Indian-german osteoarthritis: serum albumin a potential marker. Trends Carbohydr Res. 2019;11:35–46.
30. Mireille C, Luche S, Rabilloud T. Silver staining of proteins in polyacrylamide gels. Nat Protoc. 2006;1:1852–1858. doi:10.1038/nprot.2006.288
31. Huang DW, Lempicki RA. Systematic and integrative analysis of large gene lists using DAVID bioinformatics resources. Nat Protoc. 2009;4:44–57. doi:10.1038/nprot.2008.211
32. Moritz CP. Tubulin or not tubulin: heading toward total protein staining as loading control in Western Blots. Proteomics. 2017;17:1600189.
33. Fosang AJ, Colbran RJ. Transparency is the key to quality. J Biol Chem. 2015;290(50):29692–29694. doi:10.1074/jbc.E115.000002
34. Sarkar A, Sharma S, Agnihotri P, et al. Synovial fluid cell proteomic analysis identifies upregulation of alpha-taxilin proteins in rheumatoid arthritis: a potential prognostic marker. J Immunol Res. 2020;2020:4897983. doi:10.1155/2020/4897983
35. Kenawy HI, Boral I, Bevington A. Complement-coagulation cross-talk: a potential mediator of the physiological activation of complement by low pH. Front Immunol. 2015;6:215.
36. Ene R, Sinescu RD, Ene P, et al. Synovial inflammation in patients with different stages of knee osteoarthritis. Rom J Morphol Embryol. 2015;56:169–173.
37. Encina MC, Barreiro VB, Perez IR, et al. Discovery of an autoantibody signature for the early diagnosis of knee osteoarthritis: data from the osteoarthritis initiative. Ann Rheum Dis. 2019;78(12):1699–1705. doi:10.1136/annrheumdis-2019-215325
38. Henjes F, Lourido L, Romero CR, et al. Analysis of autoantibody profiles in osteoarthritis using comprehensive protein array concepts. J Proteome Res. 2014;13(11):5218–5229. doi:10.1021/pr500775a
39. Ruthard J, Hermes G, Hartmann U, et al. Identification of antibodies against extracellular matrix proteins in human osteoarthritis. Biochem Biophys Res Commun. 2018;503:1273–1277. doi:10.1016/j.bbrc.2018.07.036
40. Li L, Zhang J, Deng Q, et al. Proteomic profiling for identification of novel biomarkers differentially expressed in human ovaries from polycystic ovary syndrome patients. PLoS One. 2016;11(11):e0164538. doi:10.1371/journal.pone.0164538
41. Schaer DJ, Buehler PW, Alayash AI, et al. Hemolysis and free hemoglobin revisited: exploring hemoglobin and hemin scavengers as a novel class of therapeutic proteins. Blood. 2013;121(8):1276–1284. doi:10.1182/blood-2012-11-451229
42. Rifkind JM, Mohanty JG, Nagababu E. The pathophysiology of extracellular hemoglobin associated with enhanced oxidative reactions. Front Physiol. 2015;5:500. doi:10.3389/fphys.2014.00500
43. Boretti FS, Buehler PW, D’Agnillo F, et al. Sequestration of extracellular hemoglobin within a haptoglobin complex decreases its hypertensive and oxidative effects in dogs and guinea pigs. J Clin Invest. 2009;119(8):2271–2280. doi:10.1172/JCI39115
44. MacKellar M, Vigerust DJ. Role of haptoglobin in health and disease: a focus on diabetes. Clin Diabetes. 2016;34(3):148–157. doi:10.2337/diaclin.34.3.148
45. Merle NS, Grunenwald A, Rajaratnam H, et al. Intravascular hemolysis activates complement via cell-free heme and heme-loaded microvesicles. JCI Insight. 2018;3(12):e96910. doi:10.1172/jci.insight.96910
46. Jia Y, Wood F, Buehler PW, et al. Haptoglobin preferentially binds β but not α subunits cross-linked hemoglobin tetramers with minimal effects on ligand and redox reactions. PLoS One. 2013;8(3):e59841. doi:10.1371/journal.pone.0059841
47. Mallen PC, Checkoway H, Zabeti A, et al. The functional polymorphism of the hemoglobin-binding protein haptoglobin influences susceptibility to idiopathic parkinson’s disease. Am J Med Genet B Neuropsychiatr Genet. 2008;147B(2):216–222. doi:10.1002/ajmg.b.30593
48. Masi AD, Simone GD, Ciaccio C, et al. Haptoglobin: from hemoglobin scavenging to human health. Mol Aspects Med. 2020;73:0098–2997.
49. Costa CF, Calamia V, Puente PF, et al. Sequential depletion of human serum for the search of osteoarthritis biomarkers. Proteome Sci. 2012;10(1):55. doi:10.1186/1477-5956-10-55
50. Liao W, Li Z, Zhang H, et al. Proteomic analysis of synovial fluid as an analytical tool to detect candidate biomarkers for knee osteoarthritis. Int J Clin Exp Pathol. 2015;8(9):9975–9989.
51. Fernández-Puente P, Calamia V, Lourido L, et al. Analysis of the biomarker value of haptoglobin and Von Willebrand factor for knee osteoarthritis using a targeted mass spectrometry approach in serum. Osteoarthr Cartil. 2016;24(1):S458. doi:10.1016/j.joca.2016.01.836
52. Zhang H, Li X-J, Martin DB, et al. Identification and quantification of N-linked glycoproteins using hydrazide chemistry, stable isotope labeling and mass spectrometry. Nat Biotechnol. 2003;21(6):660–666. doi:10.1038/nbt827
53. Arase N, Arase H. Cellular misfolded proteins rescued from degradation by MHC class II molecules are possible targets for autoimmune diseases. J Biochem. 2015;158(5):367–372. doi:10.1093/jb/mvv093
54. Yoo W, Cho E-B, Kim S, Yoon J-B. The E3 ubiquitin ligase MARCH2 regulates ERGIC3-dependent trafficking of secretory proteins. J Biol Chem. 2019;294(28):10900–10912. doi:10.1074/jbc.RA119.007435
55. Hu H, Sun SC. Ubiquitin signaling in immune response. Cell Res. 2016;26:457–483.
56. Wilkinson KD. Ubiquitination and deubiquitination: targeting of proteins for degradation by the proteasome. Semin Cell Dev Biol. 2000;11(3):141–148. doi:10.1006/scdb.2000.0164
57. Liu S, Chen ZJ. Expanding role of ubiquitination in NF-κB signaling. Cell Res. 2011;21(1):
58. Wu J, Luo X, Yan L-J. Two dimensional blue native/SDS-PAGE to identify mitochondrial complex I subunits modified by 4-hydroxynonenal (HNE). Front Physiol. 2015;6:98. doi:10.3389/fphys.2015.00098
59. Lim S-K, Ferraro B, Moore K, Halliwell B. Role of haptoglobin in free hemoglobin metabolism. Redox Rep. 2001;6(4):219–227. doi:10.1179/135100001101536364
60. Das UN. Is obesity an inflammatory condition? Nutrition. 2001;17(11–12):953–966. doi:10.1016/S0899-9007(01)00672-4
61. Chiellini C, Santini F, Marsili A, et al. Serum haptoglobin: a novel marker of adiposity in humans. J Clin Endocrinol Metab. 2004;89(6):2678–2683. doi:10.1210/jc.2003-031965
62. Coggon D, Reading I, Croft P, et al. Knee osteoarthritis and obesity. Int J Obes Relat Metab Disord. 2001;25:622–627.
63. Chiellini C, Bertacca A, Novelli SE, et al. Obesity modulates the expression of haptoglobin in the white adipose tissue via TNFα. J Cell Physiol. 2002;190(2):251–258. doi:10.1002/jcp.10061
64. Wang Y, Kinzie E, Berger FG, et al. Haptoglobin, an inflammation-inducible plasma protein. Redox Rep. 2001;6(6):379–385. doi:10.1179/135100001101536580
65. Allen KD, Golightly YM. State of the evidence. CurrOpinRheumatol. 2015;27:276–283.
66. Roberts JH, Liu F, Karnuta JM, et al. Discovery of age-related protein folding stability differences in the mouse brain proteome. J Proteome Res. 2016;15(12):4731–4741. doi:10.1021/acs.jproteome.6b00927
 © 2021 The Author(s). This work is published and licensed by Dove Medical Press Limited. The full terms of this license are available at https://www.dovepress.com/terms.php and incorporate the Creative Commons Attribution - Non Commercial (unported, v3.0) License.
By accessing the work you hereby accept the Terms. Non-commercial uses of the work are permitted without any further permission from Dove Medical Press Limited, provided the work is properly attributed. For permission for commercial use of this work, please see paragraphs 4.2 and 5 of our Terms.
© 2021 The Author(s). This work is published and licensed by Dove Medical Press Limited. The full terms of this license are available at https://www.dovepress.com/terms.php and incorporate the Creative Commons Attribution - Non Commercial (unported, v3.0) License.
By accessing the work you hereby accept the Terms. Non-commercial uses of the work are permitted without any further permission from Dove Medical Press Limited, provided the work is properly attributed. For permission for commercial use of this work, please see paragraphs 4.2 and 5 of our Terms.