")
Back to Journals » International Journal of Nanomedicine » Volume 10 » Issue 1
Poly(lactic-co-glycolic acid) nanoparticles conjugated with CD133 aptamers for targeted salinomycin delivery to CD133+ osteosarcoma cancer stem cells
Authors Ni M, Xiong M, Zhang X, Cai G, Chen H, Zeng Q, Yu Z
Received 2 December 2014
Accepted for publication 18 February 2015
Published 31 March 2015 Volume 2015:10(1) Pages 2537—2554
DOI https://doi.org/10.2147/IJN.S78498
Checked for plagiarism Yes
Review by Single anonymous peer review
Peer reviewer comments 5
Editor who approved publication: Professor Lei Yang
Miaozhong Ni,1,* Min Xiong,1,* Xinchao Zhang,1,* Guoping Cai,1 Huaiwen Chen,2 Qingmin Zeng,1 Zuochong Yu1
1Department of Orthopedics, Jinshan Hospital, Fudan University, 2International Joint Cancer Institute, the Second Military Medical University, Shanghai, People’s Republic of China
*These authors contributed equally to this work
Background: Cancer stem cells (CSCs) possess the characteristics associated with normal stem cells and are responsible for cancer initiation, recurrence, and metastasis. CD133 is regarded as a CSCs marker of osteosarcoma, which is the most common primary bone malignancy in childhood and adolescence. Salinomycin, a polyether ionophore antibiotic, has been shown to kill various CSCs, including osteosarcoma CSCs. However, salinomycin displayed poor aqueous solubility that hinders its clinical application. The objective of this study was to develop salinomycin-loaded nanoparticles to eliminate CD133+ osteosarcoma CSCs.
Methods: The salinomycin-loaded PEGylated poly(lactic-co-glycolic acid) nanoparticles (SAL-NP) conjugated with CD133 aptamers (Ap-SAL-NP) were developed by an emulsion/solvent evaporation method, and the targeting and cytotoxicity of Ap-SAL-NP to CD133+ osteosarcoma CSCs were evaluated.
Results: The nanoparticles are of desired particle size (~150 nm), drug encapsulation efficiency (~50%), and drug release profile. After 48 hours treatment of the Saos-2 CD133+ osteosarcoma cells with drugs formulated in Ap-SAL-NP, SAL-NP, and salinomycin, the concentrations needed to kill 50% of the incubated cells were found to be 2.18, 10.72, and 5.07 µg/mL, respectively, suggesting that Ap-SAL-NP could be 4.92 or 2.33 fold more effective than SAL-NP or salinomycin, respectively. In contrast, Ap-SAL-NP was as effective as SAL-NP, and less effective than salinomycin in Saos-2 CD133- cells, suggesting that Ap-SAL-NP possess specific cytotoxicity toward Saos-2 CD133+ cells. Ap-SAL-NP showed the best therapeutic effect in Saos-2 osteosarcoma xenograft mice, compared with SAL-NP or salinomycin. Significantly, Ap-SAL-NP could selectively kill CD133+ osteosarcoma CSCs both in vitro and in vivo, as reflected by the tumorsphere formation and proportion of Saos-2 CD133+ cells.
Conclusion: Our results suggest that CD133 is a potential target for drug delivery to osteosarcoma CSCs and that it is possible to significantly inhibit the osteosarcoma growth by killing CD133+ osteosarcoma CSCs. We demonstrated that Ap-SAL-NP have the potential to target and kill CD133+ osteosarcoma CSCs.
Keywords: targeted therapy, ligand-conjugated nanomedicines, cancer initiating cells
Introduction
Osteosarcoma, the most common primary bone malignancy in childhood and adolescence, comprises almost 60% of the common histological subtypes of bone sarcomas in childhood.1 Despite advances having been achieved in surgery and chemotherapy, the long-term survival rates of osteosarcoma have stagnated at ~65%.2 The failure in osteosarcoma therapy is mainly due to tumor recurrence or lung metastasis,3 which probably is due to the inability to eliminate the residual tumor cells after surgery and chemotherapy.4 Thus, it is urgent to develop novel approaches to eliminate therapy-resistant osteosarcoma.5
Cancer stem cells (CSCs), a subpopulation of cancer cells, possess the characteristics associated with normal stem cells.6 CSCs possess unique intrinsic or acquired characteristics, such as self-renewal, quiescence, and over-expression of adenosine triphosphate-binding cassette transporters, leading to their resistance to chemotherapy and radiotherapy, and are responsible for cancer initiation, recurrence, and metastasis.7 Thus, treatment of CSCs plays a critical role in cancer therapy. In some cases, patients with osteosarcoma will develop a tumor relapse after chemotherapy and surgery.8,9 This clinical feature leads us to presume that current therapeutic approaches are not efficient to target CSCs in osteosarcoma, according to the concept of CSCs.5,10 Cluster of differentiation 133 (CD133) is recognized as a stem cell marker for normal and cancerous tissues. Currently, CD133 is regarded as a CSCs marker in osteosarcoma and other tumors.11–13 CD133+ osteosarcoma cells can form mammospheres, which could be able to initiate tumor growth in nonobese diabetic/severe combined immunodeficiency (NOD/SCID) mice, to express stemness genes, and to differentiate into mesenchymal lineages, such as osteoblasts and adipocytes.11–13 To completely eradicate osteosarcoma, it is critical to target CD133+ osteosarcoma cells.
Using various high-throughput screening methods, researchers have identified several old chemotherapy drugs (salinomycin and thioridazine) for their novel application in anti-CSCs activity. Salinomycin, a polyether ionophore antibiotic, has been shown to kill various CSCs, including breast CSCs and leukemia CSCs.14–16 Recently, Tang et al demonstrated that salinomycin could inhibit osteosarcoma by selectively targeting its CSCs both in vitro and in vivo, and the Wnt/β-catenin signaling pathway may be involved in the therapeutic mechanism of salinomycin.17 Although salinomycin has shown high potency in killing CSCs, salinomycin displayed poor aqueous solubility that hinders its clinical application.18 Incorporating salinomycin in nanoparticles can address these problems. For example, several studies have developed salinomycin-loaded nanoparticles to deliver salinomycin to drug-resistant cancer cells or CSCs.18,19
Nanoparticles prepared with poly(lactic-co-glycolic acid) (PLGA) receive extensive attention and are used widely since their safety in the clinic is well established.20 Polyethylene glycol (PEG)-functionalized PLGA nanoparticles are especially desirable because PEGylated polymeric nanoparticles have significantly prolonged systemic circulation compared with the nanoparticles without PEG,21 which greatly improve the passive targeting of nanoparticles to tumor by the enhanced permeability and retention effects. Nanoparticles conjugated with targeting ligands have recently attracted a great deal of interest, principally due to their potential use as targeted drug delivery systems.22 Aptamers are oligonucleic acid or peptide molecules that bind to a specific target molecule. Aptamers have several distinct advantages, such as low molecular weights, lack of immunogenicity, and they are readily available. Thus, aptamers are good candidates for targeted imaging and therapy.23 Various aptamers have been developed against a variety of cancer targets, including extracellular ligands and cell surface proteins.24 A15 is an RNA aptamer that binds to CD133 and could be efficiently internalized after binding, and it has been successfully exploited as a targeting ligand for tracking CD133 positive cancer cells.25 Therefore, we speculated that the A15–CD133 interaction could be utilized as a strategy to mediate highly specific and effective drug delivery to CD133-overexpressing osteosarcoma CSCs.
In this study, to obtain a robust drug-delivery system for specifically targeting CD133+ osteosarcoma CSCs, we developed and characterized salinomycin-loaded PLGA nanoparticles (SAL-NP) conjugated with CD133 aptamers (Ap-SAL-NP). The antitumor activity and mechanism including the elimination ability of CD133+ osteosarcoma CSCs of Ap-SAL-NP was investigated in vitro and in vivo.
Materials and methods
Materials
PLGA (17 k)-PEG (3 k)-COOH was bought from PolySciTech (Akina, Inc., West Lafayette, IN, USA). Salinomycin, coumarin 6, 1-ethyl-3-(3-dimethylaminopropyl)carbodiimide (EDC), and N-hydroxysuccinimide (NHS) were purchased from Sigma-Aldrich (St Louis, MO, USA). The CD133 MicroBead Kit and phycoerythrin (PE)-labeled CD133/2 (293C3) antibodies (PE-CD133 antibodies) were obtained from Miltenyi Biotec (Bergisch Gladbach, Germany). A15 aptamers (sequence: 5′-NH2-CCCUCCUACAUAGGG-3′) were synthesized by GenePharma Co., Ltd (Shanghai, People’s Republic of China). Dulbecco’s Modified Eagle’s Medium (DMEM) and fetal bovine serum (FBS) were purchased from Thermo Fisher Scientific (Waltham, MA, USA). The primers were synthesized by Thermo Fisher Scientific, and the sequence of the primers are listed in Table S1. All organic reagents were of analytical grade and purchased from Sinopharm (Shanghai, People’s Republic of China) unless otherwise stated.
Cell lines and culture
The Saos-2, U-2 OS, and MG-63 osteosarcoma cell lines were purchased from the Cell Culture Center, Shanghai Institutes for Biological Sciences, the Chinese Academy of Sciences (Shanghai, People’s Republic of China). The cells were maintained in DMEM supplemented with 10% FBS, 25 mM hydroxyethyl piperazine ethanesulfonic acid buffer, 100 U/mL penicillin, and 100 μg/mL streptomycin in a humidified atmosphere of 5% carbon dioxide at 37°C.
Magnetic-activated cell sorting of CD133+ cells
The CD133+ cells was isolated from the osteosarcoma cell lines using magnetic-activated cell sorting (Miltenyi Biotec), according to the manufacture’s protocols. Briefly, cell suspension was collected as described and centrifuged for 5 minutes at 1,200× g. The supernatant was removed, 20 μL CD133 microbeads were added, mixed, and incubated for 15 minutes at 4°C under dark conditions. Uncombined microbeads were removed by two washes, and the pellet was resuspended in 500 μL PBE (phosphate-buffered saline [PBS] supplemented with 0.5% bovine serum albumin and 5 mM ethylenediaminetetraacetic acid) and separated on a magnetic separation column. Column flow through contained CD133+ cells. The CD133+ cells retained by the column were washed with PBE and collected. The CD133+ cells were labeled with PE-CD133 antibodies, and the purity was determined by flow cytometry, as described in the next section.
CD133 expression of the cells
The cells were incubated with PE-CD133 antibodies (1 μg/mL) for 45 minutes at 4°C. After that, the cells were washed and suspended in PBS (pH 7.4), and the CD133 expression of the cells, as reflected by the proportion of positively stained cells and mean fluorescence intensity, was analyzed by flow cytometry (BD Biosciences, San Jose, CA, USA).
Preparation of salinomycin-loaded PLGA nanoparticles
SAL-NP were prepared with an emulsion/solvent evaporation method as described previously.26 Briefly, 25 mg PLGA (17 k)-PEG (3 k)-COOH and 1 mg salinomycin were dissolved in 2 mL dichloromethane, which was then added into 4 mL of a 1% sodium cholate aqueous solution. The mixture was sonicated using a probe sonicator for 45 seconds at 150 W output. After sonication, the formed emulsion was added dropwise into 20 mL of 0.5% sodium cholate under magnetic stirring. Then, dichloromethane was removed by evaporation overnight. The untrapped salinomycin was removed by ultrafiltrating the nanoparticles with deionized water (15 mL ×4) using Amicon® Ultra-15 centrifugal filter devices (100,000 nominal molecular weight limit; EMD Millipore, Billerica, MA, USA). Blank nanoparticles were prepared as described above, without the addition of salinomycin. Coumarin 6-loaded nanoparticles (C6-NP) were prepared with the same protocol by adding 0.1% (w/w) of coumarin 6.
Preparation of salinomycin-loaded PLGA nanoparticles conjugated with CD133 aptamers
For preparation of Ap-SAL-NP, CD133 aptamers (ie, A15 aptamers) were conjugated to the nanoparticles via an EDC/NHS technique as described by Guo et al.27 Briefly, SAL-NP suspended in deionized water (2.5 mg/mL) was incubated with excess NHS (50 mM) and EDC (100 mM) at room temperature for 30 minutes. The resultant NHS-activated SAL-NP was washed with deionized water (4 mL ×4) by ultrafiltration (Amicon® Ultra-4 centrifugal filter devices, 100,000 nominal molecular weight limit; EMD Millipore). The resultant nanoparticles were incubated with 1 mL of A15 aptamers (0.5 mg/mL) for 4 hours under magnetic stirring. The obtained Ap-SAL-NP were washed with deionized water (4 mL ×4) by ultrafiltration, resuspended in distilled water, and stored at 4°C until use.
Size, zeta potential, and morphology
After the nanoparticles were suspended in deionized water, their particle size was analyzed by dynamic light scattering using Zetasizer Nano S90 (Malvern Instruments Ltd., Malvern, UK). The zeta potential of the nanoparticles was also analyzed by Zetasizer Nano S (Malvern Instruments Ltd.).
The morphological examination of the nanoparticles was performed by transmission electron microscopy (TEM). Briefly, samples were prepared by dropping one drop of nanoparticle dispersion onto a copper grid coated with a carbon membrane. Then the samples were stained by 2% phosphotungstic acid and dried. The nanoparticles were visualized under the Hitachi H-600 TEM (Hitachi Ltd., Tokyo, Japan) (accelerating voltage of 75 kV).
Determination of the encapsulation efficacy and loading efficacy of salinomycin and coumarin-6
The encapsulation efficacy (EE) and drug loading of salinomycin were determined as described below. Briefly, 5 mg nanoparticles were fully dissolved in 1 mL dichloromethane. The dichloromethane solution was evaporated in a vacuum evaporator and 5 mL methanol was added to form a clear solution sample for high performance liquid chromatography (HPLC) (L-2000; Hitachi Ltd.) analysis. The HPLC was equipped with a reverse phase C-18 column (Diamond, 250 mm ×4.6 mm, 5 μm). For HPLC analysis, the mobile phase consisted of acetonitrile/deionized water/tetrahydrofuran/phosphoric acid (85/10/5/0.01, v/v), with a flow rate at 1.5 mL/min. The detection wavelength and column temperature were set at 210 nm and 30°C, respectively. The injection volume was 20 μL. All the samples were filtered through a syringe filter (0.45 μm pore size; EMD Millipore) before HPLC analysis. The EE of salinomycin was calculated from the following formula:
ME/MT ×100% | (1) |
where ME and MT were defined as the mass of encapsulated salinomycin and the mass of totally added salinomycin, respectively. The drug loading of salinomycin was calculated from the following formula:
ME/MN ×100% | (2) |
where ME and MN were defined as the mass of encapsulated salinomycin and the mass of salinomycin loaded nanoparticles, respectively.
The drug loading of coumarin 6 in C6-NP was calculated according to a coumarin-6 calibration curve constructed by standard lead coumarin-6 solutions.
In vitro drug release
In vitro release study was performed on the nanoparticles using PBS (pH 7.4) and human plasma as the release media. Briefly, the nanoparticles were suspended in a centrifuge tube at the concentration of 0.5 mg/mL, which was put in an orbital shaker and vibrated horizontally at 100× g at 37°C. At predetermined time intervals, the tubes were taken out and centrifuged at 12,000× g for 40 minutes. The supernatant was then subjected to HPLC analysis as described above, and the pellet was resuspended in fresh dissolution medium and put back into the shaker until the next designated time point measurement.
In vitro cellular uptake evaluated by confocal studies and flow cytometry
For in vitro cellular uptake study, CD133+ or Saos-2 CD133− cells were seeded in 12-well tissue culture plates at a density of 2.5×10⁵ cells per well and incubated overnight at 37°C. Then, the cells were treated with free coumarin 6 or C6-NP for 2 hours at 37°C, which had an equivalent concentration of coumarin 6 (15 ng/mL). After washing with PBS containing 0.1% Tween 20, the cells were fixed with 4% paraformaldehyde. The cells were counterstained with 4′,6-diamidino-2-phenylindole dihydrochloride and mounted under glass coverslips. The immunofluorescence was visualized with a confocal microscope (Leica TCS SP5; Leica Microsystems, Wetzlar, Germany). For flow cytometry analysis, the cells were rinsed three times with ice-cold PBS to remove free coumarin 6 or C6-NP. Then, the cells were dissociated, collected, and analyzed by flow cytometry (BD Biosciences).
Cell proliferation assays
The cytotoxic effect of the nanoparticles against the cells was measured using the Cell Counting Kit-8 (Dojindo Laboratories, Kumamoto, Japan) according to the manufacturer’s protocols. Briefly, cells were seeded in 96-well plates with a density of 5×10³ cells per well overnight. The cells were incubated with a series of concentrations of the nanoparticles or free salinomycin. After 48 hours or 72 hours, the cell proliferation was evaluated by adding 10 μL Cell Counting Kit-8 solution to each well of the plate. Two hours after incubation, the absorbance was measured at 450 nm/630 nm with the BIO-TEK ELx800 Universal Microplate Reader (BioTek, Winooski, VT, USA). The cell viability was calculated using the following formula:
[AE − AB]/[AC − AB]) ×100% | (3) |
where AE, AC, and AB are defined as the absorbance of experimental samples, untreated samples, and blank controls, respectively.
Quantitative real-time polymerase chain reaction
Total RNA was extracted from the cells with the Trizol® Reagent (Thermo Fisher Scientific). With the Reverse Transcription System kit (Promega Corporation, Fitchburg, WI, USA), the first-strand complementary DNA was reverse transcribed from RNA. Real-time polymerase chain reaction (RT-PCR) was performed using a Light Cycler (Hoffman-La Roche Ltd., Basel, Switzerland). The messenger RNA (mRNA) expression levels, which were normalized against β-actin, were calculated and expressed as 2CΔΔCT as described previously, where ΔCt = Ct, target − Ct, β-actin and ΔΔCt = Ct, experiment condition − ΔCt, control condition.27
The effect of nanoparticles on the proportion of CSCs within the Saos-2 cell population
The effect of nanoparticles on the CSCs proportion of Saos-2 cells, as reflected by the tumorsphere formation ability and the proportion of CD133+ cells, was examined by the following methods. Briefly, Saos-2 cells were seeded in 12-well plates at a density of 5×10⁴ per well and cultured overnight. The cells were treated with the nanoparticles or free salinomycin (at a salinomycin concentration of 3 μg/mL) or left untreated. Twenty-four hours after treatment, the drugs were removed and the cells were washed and incubated with fresh medium at 37°C for 72 hours. Thereafter, the cells were trypsinized and cultured in ultralow adherent 6-well dishes (Corning Incorporated, Corning, NY, USA) at a density of 2,000 cells per well to obtain mammospheres. The cells were cultured in stem cell-conditioned culture medium, consisting of serum-free DMEM-F12, supplemented with 20 ng/mL basic fibroblast growth factor (Sigma-Aldrich), 20 ng/mL epidermal growth factor (Sigma-Aldrich), 1× B27 (Thermo Fisher Scientific), 1× insulin-transferrin-selenium (Thermo Fisher Scientific). After 5–7 days, the number of the tumorspheres was counted under an inverted light microscope. The tumorspheres should be solid, round structures, and the cells appear fused together, and it is difficult to distinguish them as individual cells. Alternatively, the cells were trypsinized, and the proportion of CD133+ cells in the Saos-2 cells was analyzed by flow cytometry using the method described in the section “CD133 expression of the cells.”
Animal studies
All mice were purchased from the Shanghai Experimental Animal Center of Chinese Academy of Sciences (Shanghai, People’s Republic of China). Mice were placed in a pathogen-free environment and allowed to acclimate for a week before being used in studies. The in vivo study was conducted according to the ethical principles of Fudan University Institutional Animal Care and Use Committee (Shanghai, People’s Republic of China).
In vivo tumorigenic potential of Saos-2 cells
The in vivo tumorigenic potential of Saos-2 cells was evaluated using an in vivo tumorigenicity assay. Briefly, CD133+ or Saos-2 CD133− cells (2×10³ to 5×10⁵ cells) were implanted subcutaneously into BALB/c nude mice (male, 4–6 weeks, ~20 g). Saos-2 CD133+ cells and Saos-2 CD133− cells were injected into the left and right sides of the same mice. The tumor formation of the cells was examined over a period of 12 weeks.
In vivo antitumor assays in mice
The in vivo therapeutic effect of the nanoparticles was examined in a subcutaneous osteosarcoma xenograft model. Briefly, 1×10⁷ Saos-2 cells were injected subcutaneously on day 0 into BALB/c mice (male, 4–6 weeks, ~20 g). Tumors reached about ~50 mm3 in size by day 15. Starting on day 15, mice were treated with intravenous injections via tail vein of the nanoparticles or free salinomycin (5 mg/kg). Each group consisted of eight mice. All the formulations were given to mice via tail vein except that free salinomycin was administered by intraperitoneal injection with the aid of ethanol due to the insolubility and toxicity of salinomycin. All the groups were injected nine times (on days 15, 17, 19, 21, 23, 25, 27, 29, and 31). On day 34, the effect of the drugs on the proportion of CSCs in the Saos-2-induced tumors in vivo was evaluated as described below. Briefly, three mice were euthanized, and the tumors were excised. The excised tumors were sterilized by 75% ethanol and washed with PBS (pH 7.4). The excised tumors were cut into small pieces and digested with the collagenase I solution (1 mg/mL, pH 7.4) at 37°C for 20 minutes. Then, the cells were filtered through a 40 μm cell strainer and washed with DMEM with 10% FBS. The cells were then cultured at 37°C for 10 hours. After washing with PBS three times, the cells were trypsinized, and the CSCs proportion of the cells, as reflected by the tumorsphere formation ability and the proportion of CD133+ cells, was evaluated as described in the section “The effect of nanoparticles on the proportion of CSCs within the Saos-2 cell population.” Furthermore, tumors were measured with a caliper once every 5 days, and the tumor volume was calculated by the formula:
(width2 × length)/2 | (4) |
The body weight of the mice was monitored every 5 days.
Statistical analysis
Data were analyzed by the statistic package SPSS 13.0 (SPSS Inc., Chicago, IL, USA). For values that were normally distributed, a direct comparison between two groups was conducted by Student’s nonpaired t-test, and one-way ANOVA with the Dunnett’s or Newman–Keuls posttest was used to compare the means of three or more groups. P-value of <0.05 was considered statistically significant and P>0.05 was considered not significant.
Results
CD133 expression in osteosarcoma cells
The CD133 expression of the three osteosarcoma cell lines was examined by flow cytometry. The proportion of CD133+ cells in the osteosarcoma cell lines was 4%–7%. After CD133 magnetic-activated cell sorting, the proportion of CD133+ cells in sorted CD133+ cells was >90%, whereas the proportion of CD133+ cells in sorted Saos-2 CD133– cells was <2%.
Saos-2 CD133+ cells have the characteristics of osteosarcoma CSCs
The RT-PCR assay examined the mRNA levels of CSCs-related genes such as BMI-1 and c-myc in both CD133+ and Saos-2 CD133− cells (Figure S1; Table S1). The results showed that the mRNA levels of CD133, oct4, SMO, NG2, and BMI-1 were significantly increased in Saos-2 CD133+ cells compared with Saos-2 CD133− cells, suggesting that Saos-2 CD133+ cells possess the property of osteosarcoma CSCs. Furthermore, Saos-2 CD133+ cells induced tumors with a 100% incidence in mice, when the cell count was larger than or equal to 1×10⁴ (Table S2). In contrast, Saos-2 CD133− cells induced tumors with a 37.5% (3/8) incidence, even when the cell number was 5×10⁵, suggesting that Saos-2 CD133+ cells possessed much more enhanced tumorigenic potential than Saos-2 CD133− cells. In conclusion, Saos-2 CD133+ cells possess the characteristics of osteosarcoma CSCs. Similar results were obtained in the other two osteosarcoma cell lines (U-2 OS and MG-63).
Characterization of nanoparticles
The preparation procedure of the nanoparticles is shown in Figure 1. Briefly, SAL-NP was prepared with an emulsion/solvent evaporation method, and Ap-SAL-NP was prepared by conjugation of CD133 aptamers to SAL-NP via an EDC/NHS technique. The characteristics of the nanoparticles, including size, zeta potential, and EE, are summarized in Table 1. SAL-NP had a size of 133.4 nm, whereas Ap-SAL-NP had a slightly larger size of 159.8 nm, suggesting that the modification of aptamers increases the size of SAL-NP. The polydispersity index of the nanoparticles are smaller than 0.2, suggesting that the size distribution of these nanoparticles is narrow. All of the nanoparticles showed negative zeta potential, and the EE of the nanoparticles was ~50%. The surface morphology of SAL-NP and Ap-SAL-NP was examined by TEM. As shown in Figure 2A, both nanoparticles were in moderate uniformity and showed smooth surface.
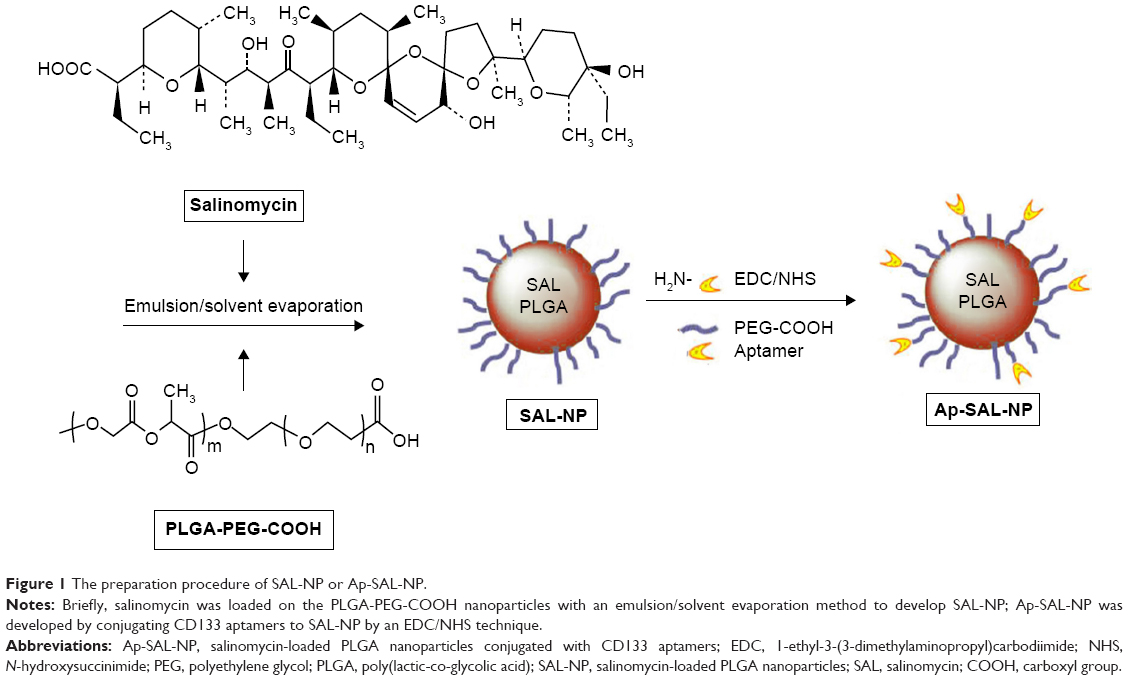 | Figure 1 The preparation procedure of SAL-NP or Ap-SAL-NP. |
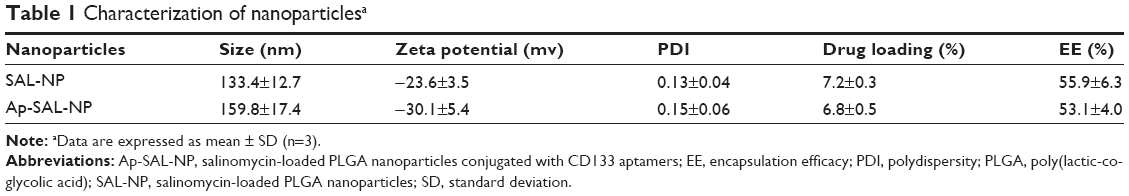 | Table 1 Characterization of nanoparticlesa |
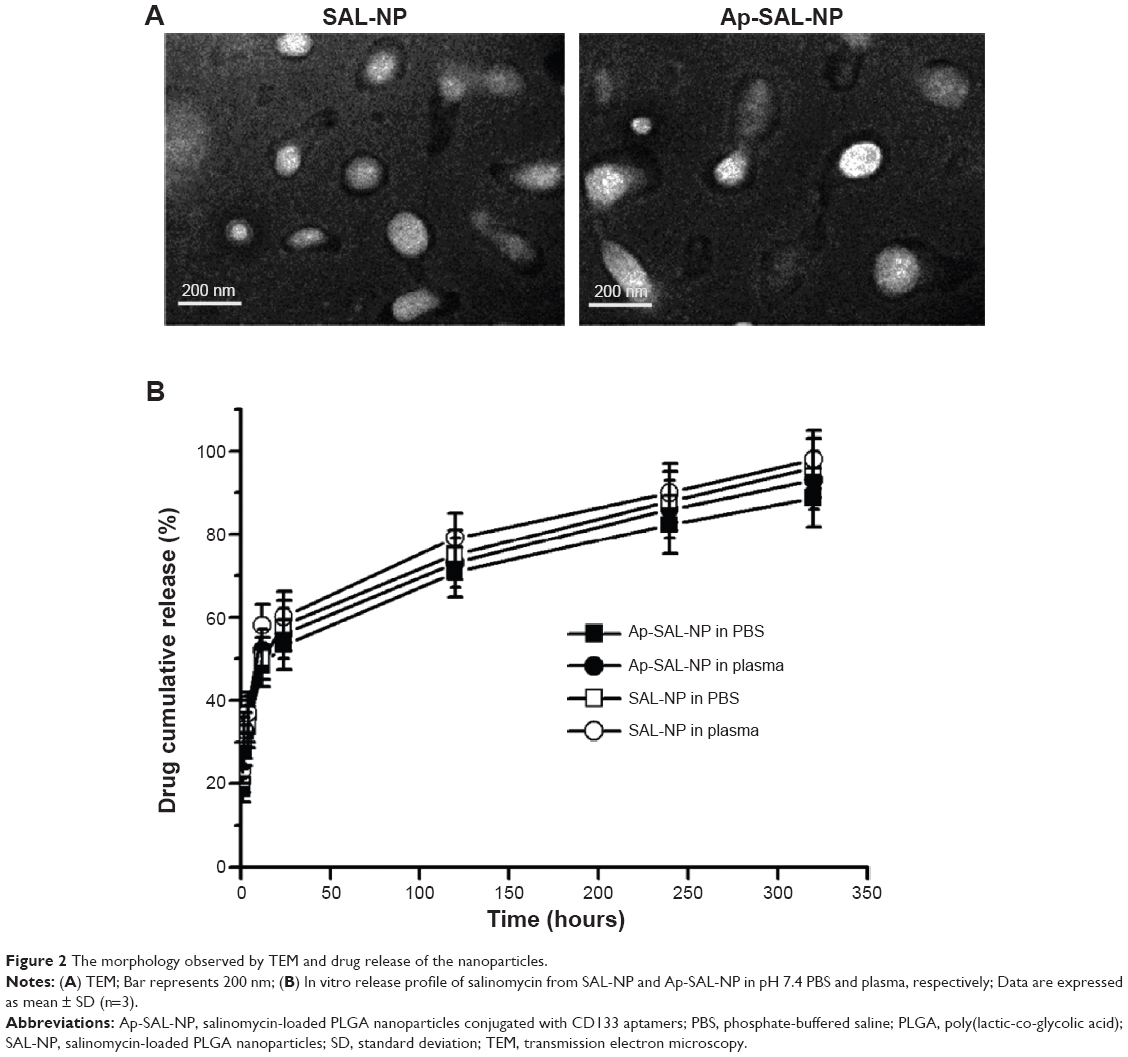 | Figure 2 The morphology observed by TEM and drug release of the nanoparticles. |
The in vitro release of salinomycin from SAL-NP and Ap-SAL-NP was investigated in pH 7.4 PBS and human plasma at 37°C (Figure 2B). Both nanoparticles exhibited similar release patterns in both release media. In the initial 24 hours, a fast release of salinomycin from both nanoparticles was observed (~50%). In the following 48 hours, the cumulative release reached ~65% for both nanoparticles. After that, both nanoparticles exhibited sustained release, with the total release in 12 days reaching ~85% for both nanoparticles.
In vitro cellular uptake evaluated by confocal studies and flow cytometry
In vitro cellular uptake of the nanoparticles was evaluated by confocal studies and flow cytometry. As shown in Figure 3, Saos-2 CD133+ cells treated with C6-NP conjugated with CD133 aptamers (Ap-C6-NP) showed significant internalization of nanoparticles (using coumarin 6 as a green trace marker). In contrast, Saos-2 CD133+ cells treated with the nontargeted C6-NP showed no significant internalization, as shown by the faint green fluorescence. When the nanoparticles were incubated with Saos-2 CD133− cells, intracellular fluorescence was rarely observed, suggesting lack of cellular uptake of the nanoparticles (Figure S2). Similar results were obtained in the flow cytometry (Figure 4). The mean fluorescence intensity in the Ap-C6-NP-treated group was significantly higher than that of the C6-NP-treated group (P<0.05) and coumarin-6-treated group (P<0.01) in Saos-2 CD133+ cells. In Saos-2 CD133− cells, no significant difference in mean fluorescence between Ap-C6-NP-, C6-NP-, and coumarin-6-treated groups was observed (P>0.05), and both groups exhibited a rather low mean fluorescence intensity. Taken together, these results confirmed that Ap-C6-NP specifically bind to CD133 antigen and is internalized into Saos-2 CD133+ cells via receptor mediated endocytosis.
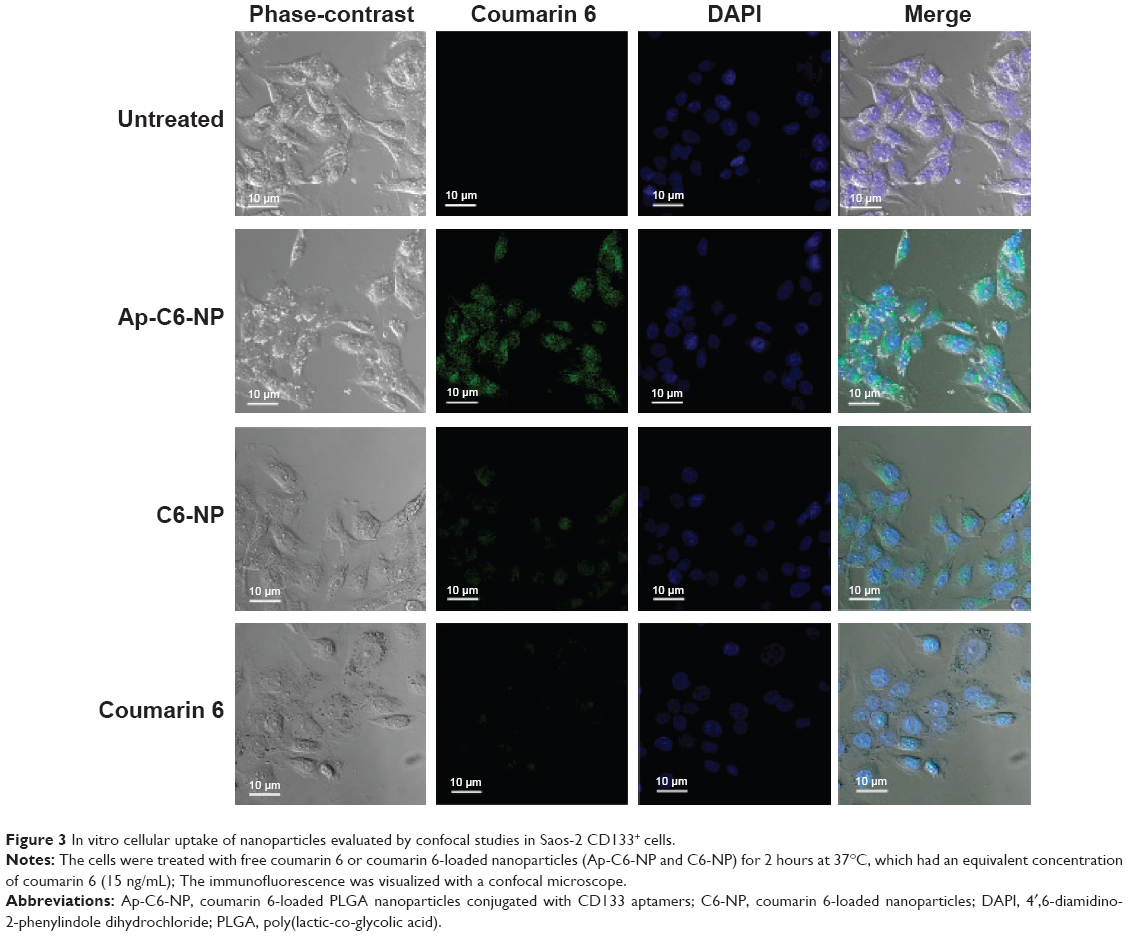 | Figure 3 In vitro cellular uptake of nanoparticles evaluated by confocal studies in Saos-2 CD133+ cells. |
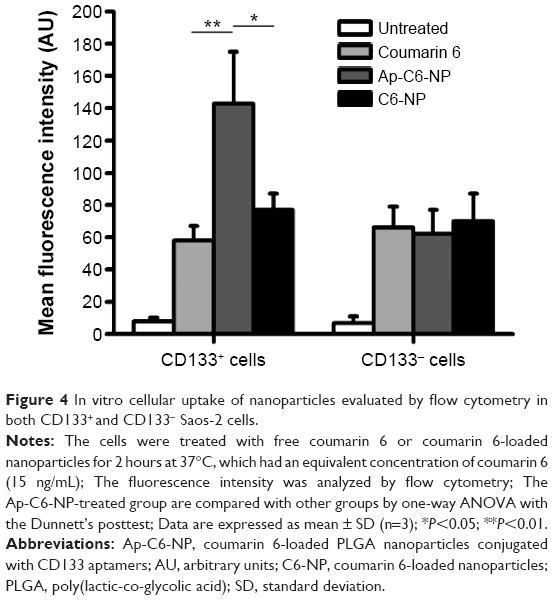 | Figure 4 In vitro cellular uptake of nanoparticles evaluated by flow cytometry in both CD133+ and CD133− Saos-2 cells. |
The cell proliferation assay of nanoparticles toward osteosarcoma cells
The cell proliferation assay of the nanoparticles was examined in both CD133+ and CD133− osteosarcoma cells. Blank PLGA nanoparticles conjugated with CD133 aptamers (Ap-NP) did not show significant cytotoxicity toward the cells at 48 hours and 72 hours, indicating that the blank nanoparticles are nontoxic to the osteosarcoma cells (Figures 5 and S3). In contrast, salinomycin, SAL-NP, and Ap-SAL-NP showed a dose-dependent cytotoxicity toward Saos-2 cells. To evaluate the in vitro cytotoxicity quantitatively, we calculated the drug concentration needed to kill 50% of the incubated cells (IC50) at 48 hours (Table 2) and 72 hours (Table 3). As shown in Table 2, the IC50 value of Ap-SAL-NP (15.17 μg/mL) was not significantly different from that of SAL-NP (17.54 μg/mL) in Saos-2 CD133− cells (P>0.05). However, in Saos-2 CD133+ cells, the IC50 value of Ap-SAL-NP (2.18 μg/mL) was significantly lower than that of SAL-NP (10.72 μg/mL) (P<0.01) and salinomycin (5.07 μg/mL) (P<0.05). In other words, Ap-SAL-NP could be 4.92 or 2.33 fold more effective than SAL-NP or salinomycin in Saos-2 CD133+ cells, respectively. At 72 hours, Ap-SAL-NP could be 5.33 or 2.57 fold more effective than SAL-NP or salinomycin in Saos-2 CD133+ cells. Similar results were obtained in the other two osteosarcoma cell lines (U-2 OS and MG-63). At 48 hours, Ap-SAL-NP could be 4.91 or 2.51 fold more effective than SAL-NP or salinomycin in U-2 OS CD133+ cells, and 2.19 or 1.64 fold more effective than SAL-NP or salinomycin in MG-63 CD133+ cells. At 72 hours, Ap-SAL-NP could be 4.85 or 3.19 fold more effective than SAL-NP or salinomycin in U-2 OS CD133+ cells, and 2.22 or 1.71 fold more effective than SAL-NP or salinomycin in MG-63 CD133+ cells. These results suggested that the enhanced cytotoxic effect of Ap-SAL-NP toward CD133+ osteosarcoma cells is attributed to the high CD133 expression of CD133+ osteosarcoma cells.
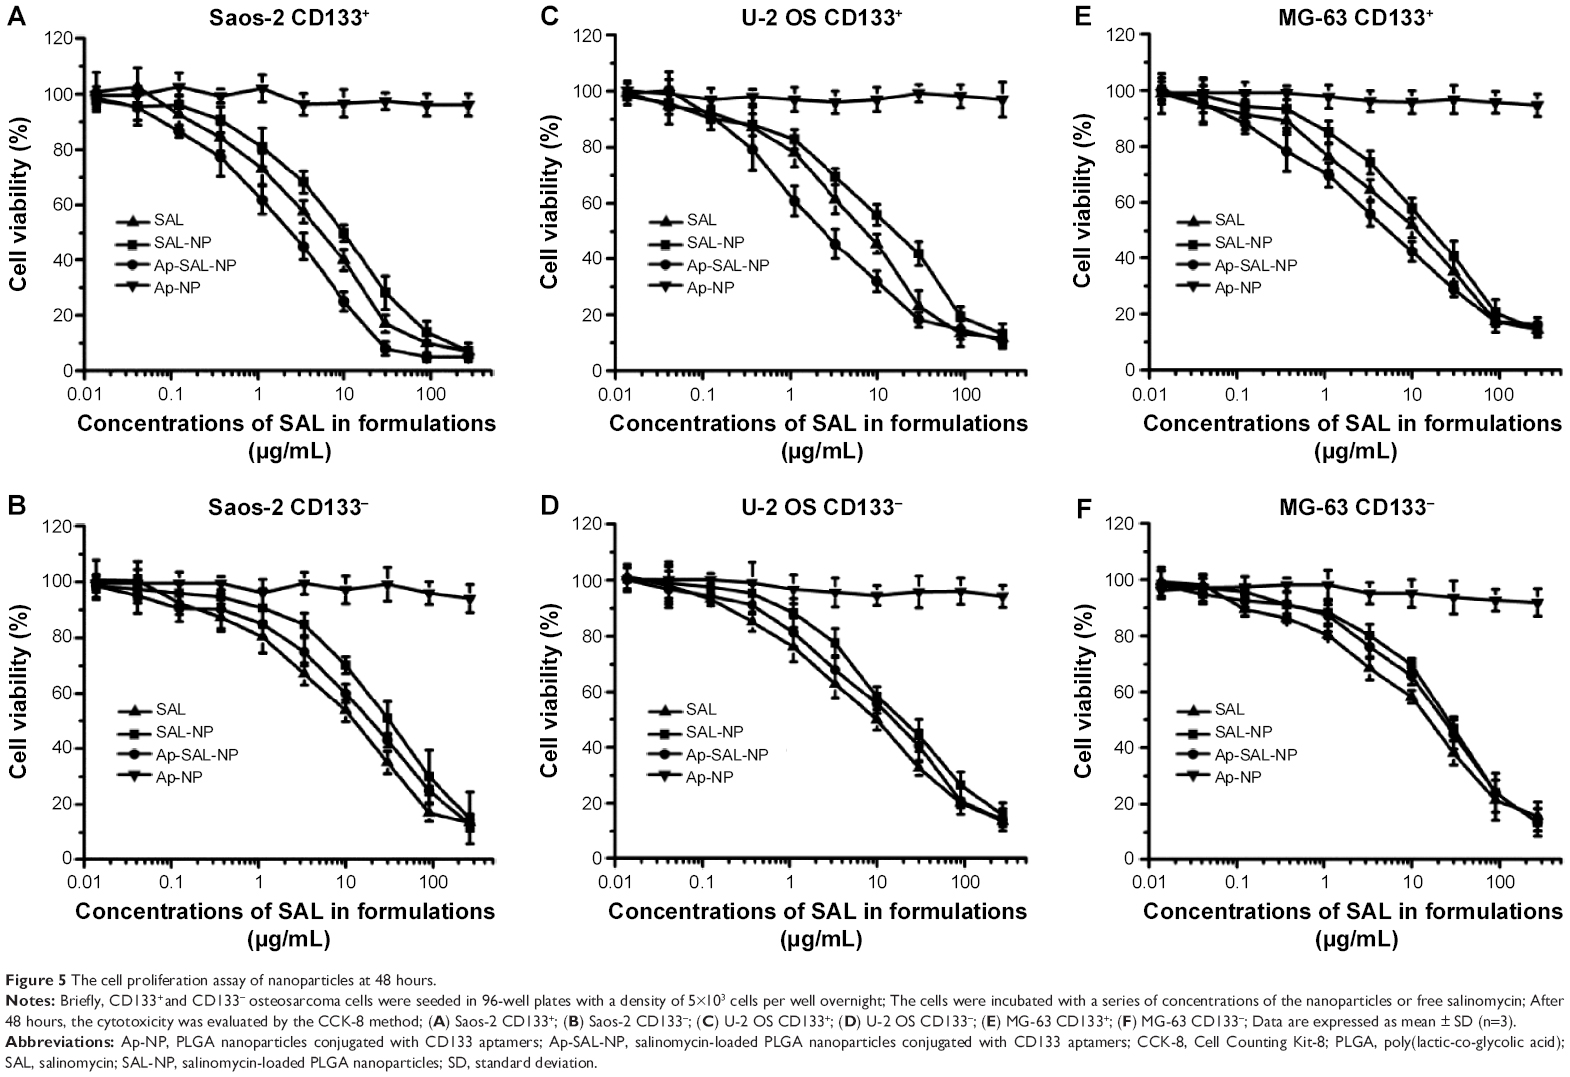 | Figure 5 The cell proliferation assay of nanoparticles at 48 hours. |
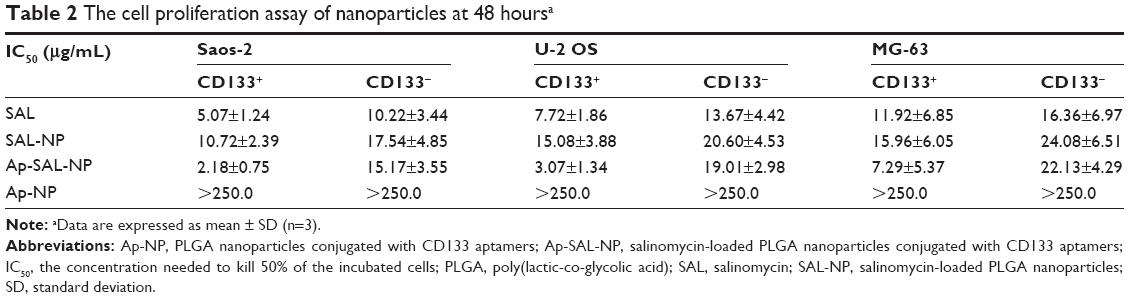 | Table 2 The cell proliferation assay of nanoparticles at 48 hoursa |
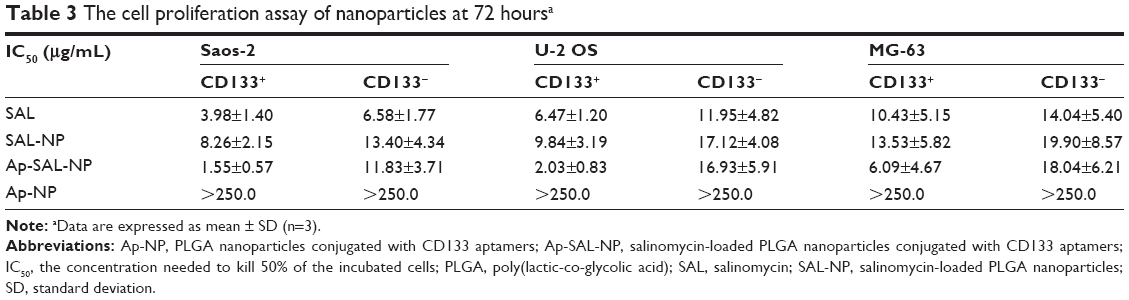 | Table 3 The cell proliferation assay of nanoparticles at 72 hoursa |
The effect of nanoparticles on the proportion of CSCs with the Saos-2 cell population
The effect of nanoparticles on the proportion of CSCs in Saos-2 cells was examined by the ability of tumorsphere formation and the proportion of CD133+ cells in Saos-2 cells after treatment (Figure 6). The ability of tumorsphere formation in suspension cultures is reported to be correlated with the proportion of CSCs.35 As shown in Figure 6A and C, Ap-SAL-NP treatment resulted in a fivefold decrease in the number of Saos-2 mammospheres relative to the untreated control. Moreover, Ap-SAL-NP treatment resulted in much fewer mammospheres compared with salinomycin (P<0.01) and SAL-NP (P<0.001). Similar results were obtained in the proportion of CD133+ cells in Saos-2 cells. Ap-SAL-NP treatment significantly decreased the proportion of CD133+ cells in Saos-2 cells compared with salinomycin (P<0.001) and SAL-NP (P<0.001) (Figure 6B). Representative images of the tumorsphere formation experiments at the end point are shown in Figure 6C. Taken together, Ap-SAL-NP showed enhanced therapeutic efficacy toward CD133+ osteosarcoma CSCs within the Saos-2 cell population compared with SAL-NP and salinomycin.
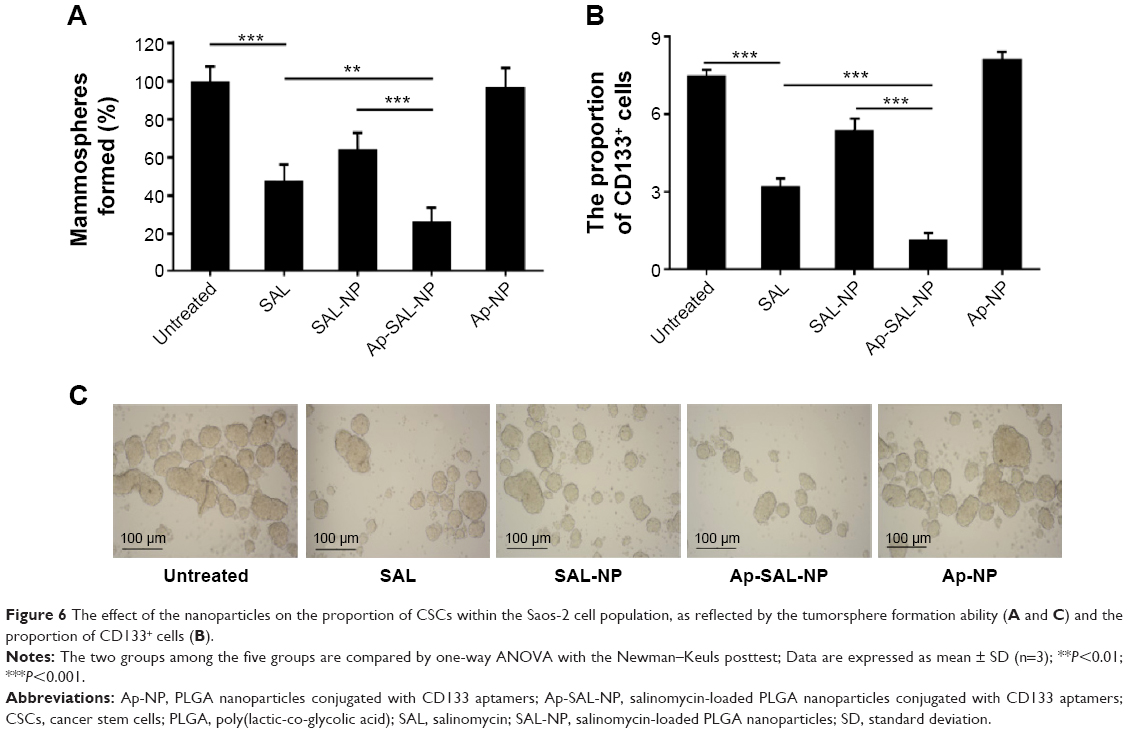 | Figure 6 The effect of the nanoparticles on the proportion of CSCs within the Saos-2 cell population, as reflected by the tumorsphere formation ability (A and C) and the proportion of CD133+ cells (B). |
The in vivo antitumor activity of nanoparticles
The therapeutic effect of the nanoparticles was evaluated in mice bearing subcutaneous Saos-2 tumors. As shown in Figure 7A, saline and Ap-NP did not show any antitumor effect, and the tumors of both groups progressed rapidly. Ap-SAL-NP, SAL-NP, and salinomycin exhibited significant antitumor activity. At the end point (day 60), compared with the initial tumor volume (~50 mm3), SAL-NP resulted in 14.2 fold increase in tumor volume, whereas salinomycin resulted in 17.4 fold increase. It is noteworthy that Ap-SAL-NP achieved only a 7.1 fold increase in the tumor volume. The mean tumor volume of the Ap-SAL-NP-treated group was statistically significantly smaller than that of other groups (Ap-SAL-NP =355.2 mm3, SAL-NP =710.4 mm3, salinomycin =872 mm3, Ap-NP =1,244.8 mm3, saline =1,341.6 mm3; Ap-SAL-NP versus SAL-NP: P<0.01, Ap-SAL-NP versus salinomycin: P<0.001, Ap-SAL-NP versus Ap-NP: P<0.001, Ap-SAL-NP versus saline: P<0.001) (Figure 7A).
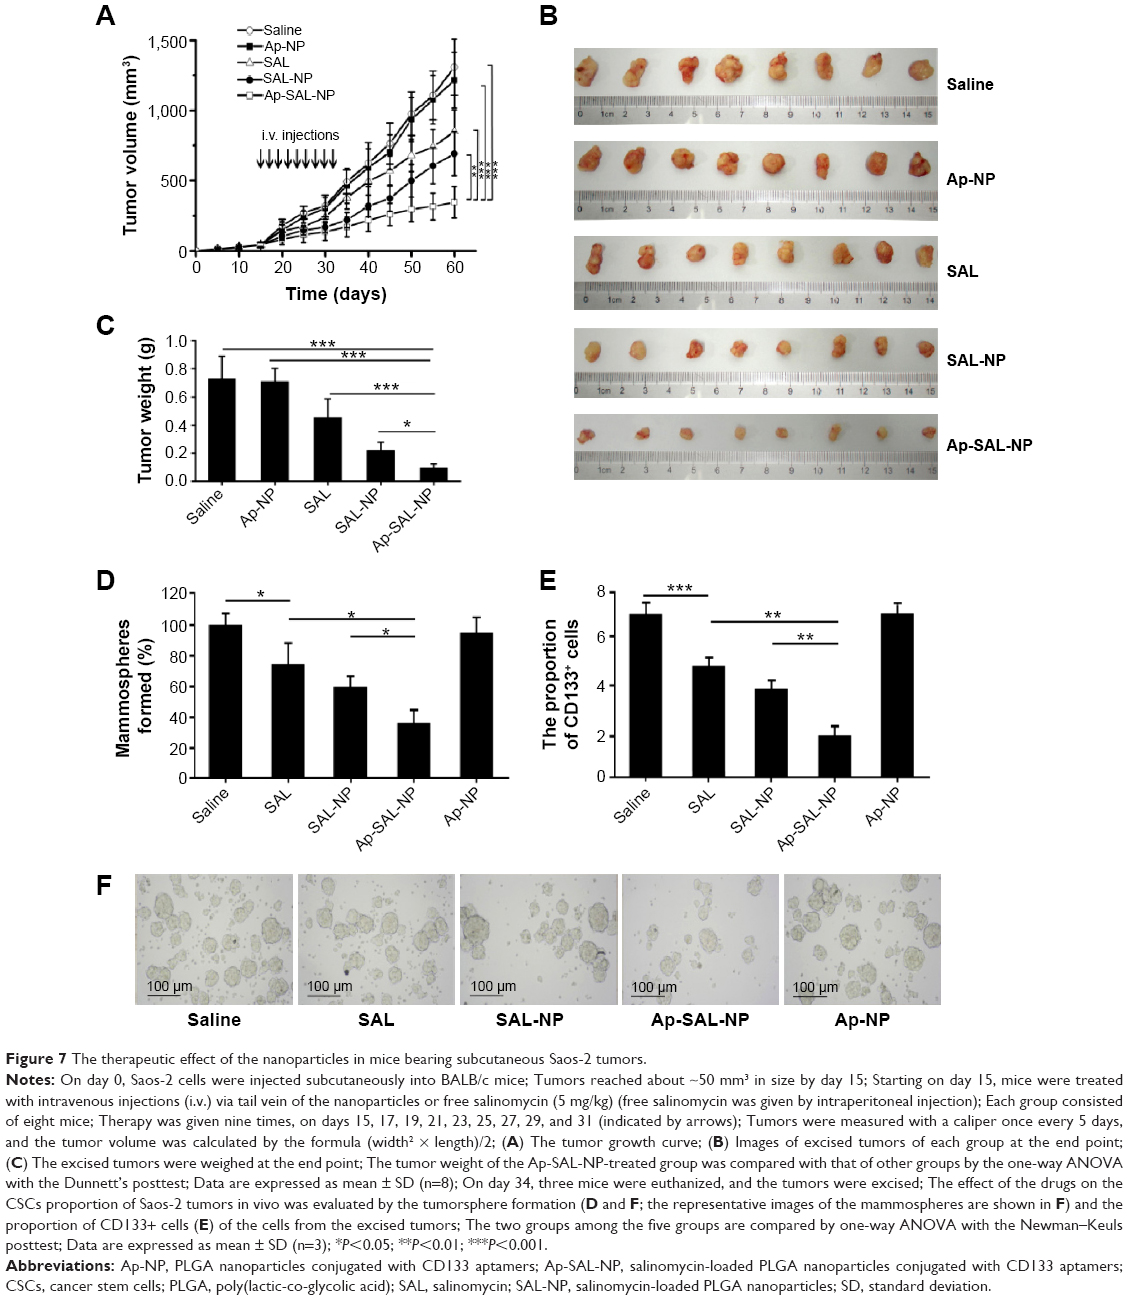 | Figure 7 The therapeutic effect of the nanoparticles in mice bearing subcutaneous Saos-2 tumors. |
The weight of the tumors excised at the endpoint was examined (Figure 7B and C). The mean tumor weight of the Ap-SAL-NP-treated group was statistically significantly lower than that of other groups (Ap-SAL-NP =0.08 g, SAL-NP =0.31 g, salinomycin =0.45 g, Ap-NP =0.71 g, saline =0.72 g; Ap-SAL-NP versus SAL-NP: P<0.05, Ap-SAL-NP versus salinomycin: P<0.001, Ap-SAL-NP versus Ap-NP: P<0.001, Ap-SAL-NP versus saline: P<0.001) (Figure 7C). The mean tumor weight of the SAL-NP-treated group was significantly lower than that of the Ap-NP-treated group (P<0.001) and saline-treated group (P<0.001). Salinomycin also showed significantly enhanced efficacy in inhibiting tumor growth compared to saline (P<0.01).
The effect of the nanoparticles on the proportion of osteosarcoma CSCs was analyzed as described below. Briefly, the tumorsphere formation ability and the proportion of CD133+ cells of the cells recovered from the excised tumors after nine treatments were analyzed (Figure 7D–F). As expected, Ap-NP had no effect on the tumorsphere formation of Saos-2 cells. Consistent with the results obtained in vitro, Ap-SAL-NP exhibited the best therapeutic efficacy against osteosarcoma CSCs. Compared with the saline treatment, Ap-SAL-NP treatment resulted in 2.6 fold decrease in the number of Saos-2 tumorspheres (Figure 7D). Also, Ap-SAL-NP resulted in much fewer mammospheres compared with SAL-NP (P<0.05) and salinomycin (P<0.05). Furthermore, the proportion of CD133+ osteosarcoma cells in the excised tumors was significantly decreased by Ap-SAL-NP treatment compared with salinomycin (P<0.01) and SAL-NP (P<0.01) (Figure 7E). The relative proportion of the CD133+ osteosarcoma cells within the excised tumors was threefold lower after treatment with Ap-SAL-NP than with saline. Ap-NP did not affect the proportion of CD133+ osteosarcoma cells.
The toxicity of treatments was evaluated by observing any behavioral changes posttreatment and monitoring the weight of mice. None of the mice showed any noticeable behavioral change and no significant change in weight compared to the saline (Figure S4). The results showed that mice tolerated all the treatments extremely well.
Discussion
CSCs are original cancer cells that are of characteristics associated with normal stem cells. CSCs are toughest against various treatments and thus responsible for cancer metastasis and recurrence after medical therapies. Due to these distinct properties of CSCs, surviving CSCs give rise to cancer relapse and metastasis after conventional therapies such as radiotherapy and chemotherapy. Thus, developing therapeutic strategies against CSCs is crucial to increase the efficacy of cancer therapy. Previous studies suggested that CD133+ osteosarcoma cells exhibit the characteristics of stem cells, including low abundance, quiescence, and a high potential to undergo differentiation as well as expression of stem cell regulatory and drug resistance genes.13 Thus, it is critical to target CD133+ osteosarcoma cells to completely eradicate osteosarcoma. The nanoparticle-based approaches to eliminate CSCs represent a potential approach to eliminate CSCs without harming normal healthy stem cells. CSCs-associated phenotypes could be utilized for further targeting CSCs. Our study demonstrated that Ap-SAL-NP have the potential to effectively target and kill CD133+ osteosarcoma CSCs both in vitro and in vivo.
The safety of nanomedicines is considered to be an important issue in their application in clinical use.28 The selection of polymer, aptamers, and drugs is critically important for the safety of our prepared Ap-SAL-NP. Firstly, as for safety, 90% of the nanoparticles of common interest in biomedical applications are nondegradable, such as inorganic and metal nanoparticles. Thus, development of biodegradable polymers for the application of nanomedicines is critical to address the safety problem. Various US Food and Drug Administration-approved biodegradable polymers are commercially available, of which the most commonly used materials are poly(lactic acid), PLGA, and poly(ε-caprolactone).29 To reduce the mechanical strength and increase the degradation of these materials, PEG has been commonly used as a component polymer in copolymer synthesis to improve the property of poly(lactic acid), PLGA, and poly(ε-caprolactone). Secondly, aptamers offer several advantages compared with antibodies in therapeutic and diagnostic agents, such as small molecular weight, less immunogenicity, high productivity, and stability.30 Aptamers were reported to be well tolerated in rhesus monkeys and patients with diabetic macular edema.31,32 Thirdly, salinomycin is a polyether ionophore antibiotic and has been shown to kill various CSCs, including breast CSCs and leukemia CSCs.14–16 Promising results from preclinical trials in human xenograft mice and a few clinical pilot studies reveal that salinomycin is able to effectively eliminate CSCs and to induce partial clinical regression of heavily pretreated and therapy-resistant cancers.14 Salinomycin is reported to be well tolerated in cancer patients in a small pilot clinical study, and did not cause severe side effect to these patients.14 A Phase I/II clinical trial with VS-507, a proprietary formulation of salinomycin produced by Verastem Inc., (Needham, MA, USA) in patients with triple negative breast cancer is envisioned to start in 2013.14 In our studies, Ap-SAL-NP did not show any major systemic toxicity. Collectively, Ap-SAL-NP would be expected to have good safety in clinical use, though further safety studies may need to be performed.
It is generally accepted that CSCs contain distinct phenotypes that distinguish them from non-CSC populations.10 CSCs phenotypes can also be utilized to fulfill the aim of specifically targeting CSCs, similar to the tumor associated antigen such as epidermal growth factor receptor or HER2.33–35 CD133 is also one of the best documented CSCs markers. Recently, Bourseau-Guilmain et al developed lipid nanocapsules (LNCs) conjugated with CD133 monoclonal antibody (immune-LNCs).36 The resultant immune-LNCs showed CD133-specific cellular binding in CD133-overexpressing Caco-2 cells. Recently, Wang et al further developed single-walled carbon nanotubes (SWNTs) conjugated with CD133 monoclonal antibody (anti-CD133-SWNTs).37 The results showed that under irradiation with near-infrared laser light, the in vitro tumorigenic and self-renewal capability of glioblastoma-CD133+ cells were selectively blocked after treatment with anti-CD133-SWNTs, but the glioblastoma-CD133− cells were barely affected. Significantly, glioblastoma-CD133+ cells pretreated with anti-CD133-SWNTs and irradiated by near-infrared laser light 48 hours after xenotransplantation in nude mice did not exhibit sustainability of CSCs features for tumor growth, suggesting that anti-CD133-SWNTs have the potential to be an alternative to effectively target and destroy glioblastoma CSCs. Although targeting glioblastoma-CD133+ CSCs was well demonstrated by this study, it should be pointed out that SWNTs many pose risks to human health, such as pulmonary toxicity and direct cytotoxic effects, upon pharyngeal aspiration or inhalation.38 More significantly, the therapeutic effect of systemic administration of anti-CD133-SWNTs should be elucidated, as the inoculation of glioblastoma-CD133+ cells pretreated with anti-CD133-SWNTs in mice would certainly guarantee enough anti-CD133-SWNTs uptake in glioblastoma-CD133+ cells, whereas the accumulation of anti-CD133-SWNTs in glioblastoma-CD133+ cells after systemic administration may not be enough. In an in vivo setting, CSCs represent only a very small proportion in the bulky cancer cells. Thus, it is crucial to know whether the targeting nanoparticles could still possess the ability to specifically target CD133+ cells in vivo. In our study, Ap-SAL-NP could significantly improve the therapeutic efficacy of salinomycin in Saos-2 CD133+ cells in vitro. More importantly, in mice bearing Saos-2 osteosarcoma xenograft, the systemic administration of Ap-SAL-NP could selectively kill Saos-2 CD133+ cells in vivo, as reflected by reduced proportion of Saos-2 CD133+ cells and reduced tumorsphere formation capability of Saos-2 cells.
In this study, the presence of CD133 aptamers was critical to maintaining the special targeting activity of Ap-SAL-NP to Saos-2 CD133+ cells. Confocal studies demonstrated that Ap-C6-NP was efficiently bound and delivered to Saos-2 CD133+ cells but not to Saos-2 CD133− cells. Upon cell binding, Ap-SAL-NP was readily internalized and released salinomycin to the cytoplasm, resulting in enhanced cytotoxic effect compared to nontargeted SAL-NP and salinomycin in Saos-2 CD133+ cells but not in Saos-2 CD133− cells. Furthermore, Ap-SAL-NP could reduce the tumorsphere formation and the proportion of CD133+ osteosarcoma CSCs in Saos-2 cells more effectively than SAL-NP and salinomycin, suggesting that Ap-SAL-NP has selective toxicity against CD133+ osteosarcoma CSCs in bulky osteosarcoma cells. These data suggested that Ap-SAL-NP can significantly improve the therapeutic efficacy of salinomycin in Saos-2 CD133+ cells.
The in vivo antitumor assay suggested that Ap-SAL-NP showed superior antitumor activity over other controls. It is noteworthy that Ap-SAL-NP could not completely eliminate osteosarcoma, although it achieved significant antitumor activity toward osteosarcoma. The reason may be explained as follows: first, using one specific CSCs phenotype to target anticancer drugs to CSCs has several pitfalls, which may hamper the therapeutic effect of Ap-SAL-NP. Tumors may harbor multiple phenotypically distinct CSCs, and eliminating only a subpopulation of CSCs does not always lead to successful elimination of cancer.39 For osteosarcoma, CD117 and Stro-1 are also considered to be osteosarcoma CSCs markers.40 Thus, nanoparticles targeting CD133, CD117, and Stro-1 may achieve enhanced therapeutic efficacy over targeting only CD133. Second, it is commonly known that CSCs phenotype is not a stable trait, and CSCs can be converted from non-CSCs.41 Thus, killing only CSCs may not be sufficient for eliminating tumors. In our studies, Ap-SAL-NP could not only kill CSCs but non-CSCs, since the controlled released salinomycin from Ap-SAL-NP could also effectively kill non-CSCs.
Taken together, our data help to elucidate the antitumor mechanism of Ap-SAL-NP. First, Ap-SAL-NP accumulated in tumors due to the long circulating time of PEGylated nanoparticles and the enhanced permeability and retention effect. Then, Ap-SAL-NP is specifically bound to and internalized in CD133+ osteosarcoma CSCs. After internalization, Ap-SAL-NP readily releases salinomycin to the cytoplasm and kills the CD133+ osteosarcoma CSCs. Meanwhile, gradually released salinomycin from Ap-SAL-NP could effectively kill non-CSCs. The mechanism of cell death induced by salinomycin was associated with nonapoptotic cell death or apoptotic cells death.14 In contrast, nontargeted SAL-NP remained in the extracellular space and underwent nonspecific endocytosis and rupture.
Conclusion
Our data suggest that Ap-SAL-NP could deliver salinomycin specifically and efficiently to CD133+ osteosarcoma CSCs, resulting in selective toxicity against CD133+ osteosarcoma CSCs. Our results thus suggest that CD133 is a potential target for drug delivery to osteosarcoma CSCs and that it is possible to significantly inhibit the osteosarcoma growth by killing CD133+ osteosarcoma CSCs. We predict that Ap-SAL-NP might achieve favorable efficacy in osteosarcoma as it could effectively target and kill CD133+ osteosarcoma CSCs. We believe that this Ap-SAL-NP would shed new light on osteosarcoma in the near future and patients with osteosarcoma might benefit from this treatment.
Acknowledgments
This work was supported by the Young Project of the Shanghai Health and Family Planning Commission (2014-676).
Disclosure
The authors report no conflicts of interest in this work.
References
Meyers PA, Schwartz CL, Krailo M, et al. Osteosarcoma: a randomized, prospective trial of the addition of ifosfamide and/or muramyl tripeptide to cisplatin, doxorubicin, and high-dose methotrexate. J Clin Oncol. 2005;23(9):2004–2011. | ||
Araki N, Uchida A, Kimura T, et al. Involvement of the retinoblastoma gene in primary osteosarcomas and other bone and soft-tissue tumors. Clin Orthop Relat Res. 1991;(270):271–277. | ||
Siegel HJ, Pressey JG. Current concepts on the surgical and medical management of osteosarcoma. Expert Rev Anticancer Ther. 2008;8(8):1257–1269. | ||
Kim JJ, Tannock IF. Repopulation of cancer cells during therapy: an important cause of treatment failure. Nat Rev Cancer. 2005;5(7):516–525. | ||
Siclari VA, Qin L. Targeting the osteosarcoma cancer stem cell. J Orthop Surg Res. 2010;(5):78. | ||
Reya T, Morrison SJ, Clarke MF, Weissman IL. Stem cells, cancer, and cancer stem cells. Nature. 2001;414(6859):105–111. | ||
Zhou BB, Zhang H, Damelin M, Geles KG, Grindley JC, Dirks PB. Tumour-initiating cells: challenges and opportunities for anticancer drug discovery. Nat Rev Drug Discov. 2009;8(10):806–823. | ||
Bacci G, Ferrari S, Mercuri M, et al. Predictive factors for local recurrence in osteosarcoma: 540 patients with extremity tumors followed for minimum 2.5 years after neoadjuvant chemotherapy. Acta Orthop Scand. 1998;69(3):230–236. | ||
Kempf-Bielack B, Bielack SS, Jürgens H, et al. Osteosarcoma relapse after combined modality therapy: an analysis of unselected patients in the Cooperative Osteosarcoma Study Group (COSS). J Clin Oncol. 2005;23(3):559–568. | ||
Chumsri S, Burger AM. Cancer stem cell targeted agents: therapeutic approaches and consequences. Curr Opin Mol Ther. 2008;10(4):323–333. | ||
Suvà ML, Riggi N, Stehle JC, et al. Identification of cancer stem cells in Ewing’s sarcoma. Cancer Res. 2009;69(5):1776–1781. | ||
Tirino V, Desiderio V, Paino F, et al. Human primary bone sarcomas contain CD133+ cancer stem cells displaying high tumorigenicity in vivo. FASEB J. 2011;25(6):2022–2030. | ||
Li J, Zhong XY, Li ZY, et al. CD133 expression in osteosarcoma and derivation of CD133+ cells. Mol Med Rep. 2013;7(2):577–584. | ||
Naujokat C, Steinhart R. Salinomycin as a drug for targeting human cancer stem cells. J Biomed Biotechnol. Epub 2012 Nov 21. | ||
Gupta PB, Onder TT, Jiang G, et al. Identification of selective inhibitors of cancer stem cells by high-throughput screening. Cell. 2009;138(4):645–659. | ||
Fuchs D, Daniel V, Sadeghi M, Opelz G, Naujokat C. Salinomycin overcomes ABC transporter-mediated multidrug and apoptosis resistance in human leukemia stem cell-like KG-1a cells. Biochem Biophys Res Commun. 2010;394(4):1098–1104. | ||
Tang QL, Zhao ZQ, Li JC, et al. Salinomycin inhibits osteosarcoma by targeting its tumor stem cells. Cancer Lett. 2011;311(1):113–121. | ||
Zhang Y, Zhang H, Wang X, Wang J, Zhang X, Zhang Q. The eradication of breast cancer and cancer stem cells using octreotide modified paclitaxel active targeting micelles and salinomycin passive targeting micelles. Biomaterials. 2012;33(2):679–691. | ||
Zhao P, Dong S, Bhattacharyya J, Chen M. iTEP nanoparticle-delivered salinomycin displays an enhanced toxicity to cancer stem cells in orthotopic breast tumors. Mol Pharm. 2014;11(8):2703–2712. | ||
Langer R. Drug delivery and targeting. Nature. 1998;392(6679 Suppl):5–10. | ||
Alexis F, Pridgen E, Molnar LK, Farokhzad OC. Factors affecting the clearance and biodistribution of polymeric nanoparticles. Mol Pharm. 2008;5(4):505–515. | ||
Manjappa AS, Chaudhari KR, Venkataraju MP, et al. Antibody derivatization and conjugation strategies: application in preparation of stealth immunoliposome to target chemotherapeutics to tumor. J Control Release. 2011;150(1):2–22. | ||
Keefe AD, Pai S, Ellington A. Aptamers as therapeutics. Nat Rev Drug Discov. 2010;9(7):537–550. | ||
Barbas AS, Mi J, Clary BM, White RR. Aptamer applications for targeted cancer therapy. Future Oncol. 2010;6(7):1117–1126. | ||
Shigdar S, Qiao L, Zhou SF, et al. RNA aptamers targeting cancer stem cell marker CD133. Cancer Lett. 2013;330(1):84–95. | ||
Guo J, Gao X, Su L, et al. Aptamer-functionalized PEG-PLGA nanoparticles for enhanced anti-glioma drug delivery. Biomaterials. 2011;32(31):8010–8020. | ||
Nagy I, Caelers A, Monge A, Bonabi S, Huber AM. Bodmer D. NF-kappaB-dependent apoptotic hair cell death in the auditory System. Audiol Neurotol. 2007;12(4):209–220. | ||
Nyström AM, Fadeel B. Safety assessment of nanomaterials: implications for nanomedicine. J Control Release. 2012;161(2):403–408. | ||
Kumari A, Yadav SK, Yadav SC. Biodegradable polymeric nanoparticles based drug delivery systems. Colloids Surf B Biointerfaces. 2010;75(1):1–18. | ||
Brody EN, Gold L. Aptamers as therapeutic and diagnostic agents. J Biotechnol. 2000;74(1):5–13. | ||
Drolet DW, Nelson J, Tucker CE, et al. Pharmacokinetics and safety of an anti-vascular endothelial growth factor aptamer (NX1838) following injection into the vitreous humor of rhesus monkeys. Pharm Res. 2000;17(12):1503–1510. | ||
Cunningham ET, Adamis AP, Altaweel M, et al; Macugen Diabetic Retinopathy Study Group. A phase II randomized double-masked trial of pegaptanib, an anti-vascular endothelial growth factor aptamer, for diabetic macular edema. Ophthalmology. 2005;112(10):1747–1757. | ||
Gao J, Chen H, Yu Y, et al. Inhibition of hepatocellular carcinoma growth using immunoliposomes for co-delivery of adriamycin and ribonucleotide reductase M2 siRNA. Biomaterials. 2013;34(38):10084–10098. | ||
Gao J, Sun J, Li H, et al. Lyophilized HER2-specific PEGylated immunoliposomes for active siRNA gene silencing. Biomaterials. 2010;31(9):2655–2664. | ||
Gao J, Yu Y, Zhang Y, et al. EGFR-specific PEGylated immunoliposomes for active siRNA delivery in hepatocellular carcinoma. Biomaterials. 2012;33(1):270–282. | ||
Bourseau-Guilmain E, Béjaud J, Griveau A, et al. Development and characterization of immuno-nanocarriers targeting the cancer stem cell marker AC133. Int J Pharm. 2012;423(1):93–101. | ||
Wang CH, Chiou SH, Chou CP, Chen YC, Huang YJ, Peng CA. Photothermolysis of glioblastoma stem-like cells targeted by carbon nanotubes conjugated with CD133 monoclonal antibody. Nanomedicine. 2011;7(1):69–79. | ||
Shvedova AA, Kagan VE. The role of nanotoxicology in realizing the ‘helping without harm’ paradigm of nanomedicine: lessons from studies of pulmonary effects of single-walled carbon nanotubes. J Intern Med. 2010;267(1):106–118. | ||
Visvader JE, Lindeman GJ. Cancer stem cells: current status and evolving complexities. Cell Stem Cell. 2012;10(6):717–728. | ||
Adhikari AS, Agarwal N, Wood BM, et al. CD117 and Stro-1 identify osteosarcoma tumor-initiating cells associated with metastasis and drug resistance. Cancer Res. 2010;70(11):4602–4612. | ||
Chaffer CL, Marjanovic ND, Lee T, et al. Poised chromatin at the ZEB1 promoter enables breast cancer cell plasticity and enhances tumorigenicity. Cell. 2013;154(1):61–74. |
Supplementary materials
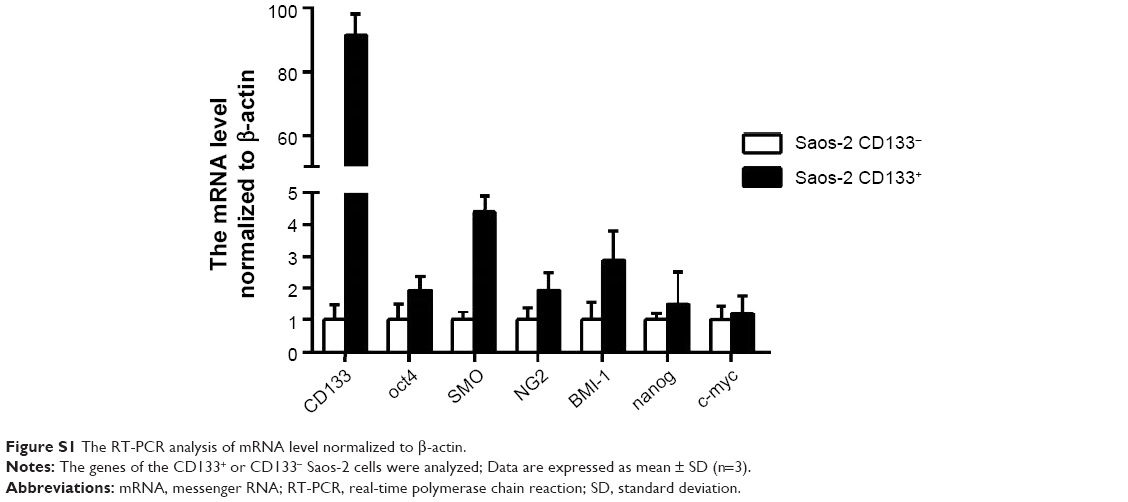 | Figure S1 The RT-PCR analysis of mRNA level normalized to β-actin. |
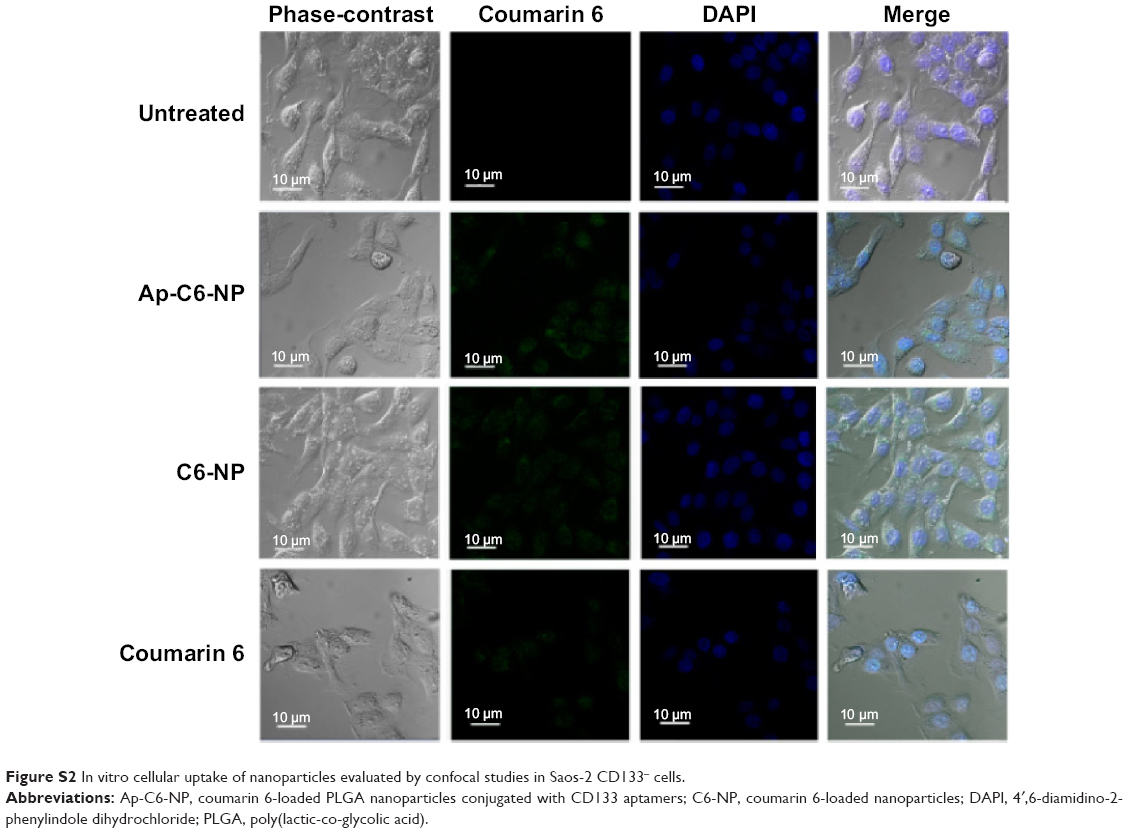 | Figure S2 In vitro cellular uptake of nanoparticles evaluated by confocal studies in Saos-2 CD133− cells. |
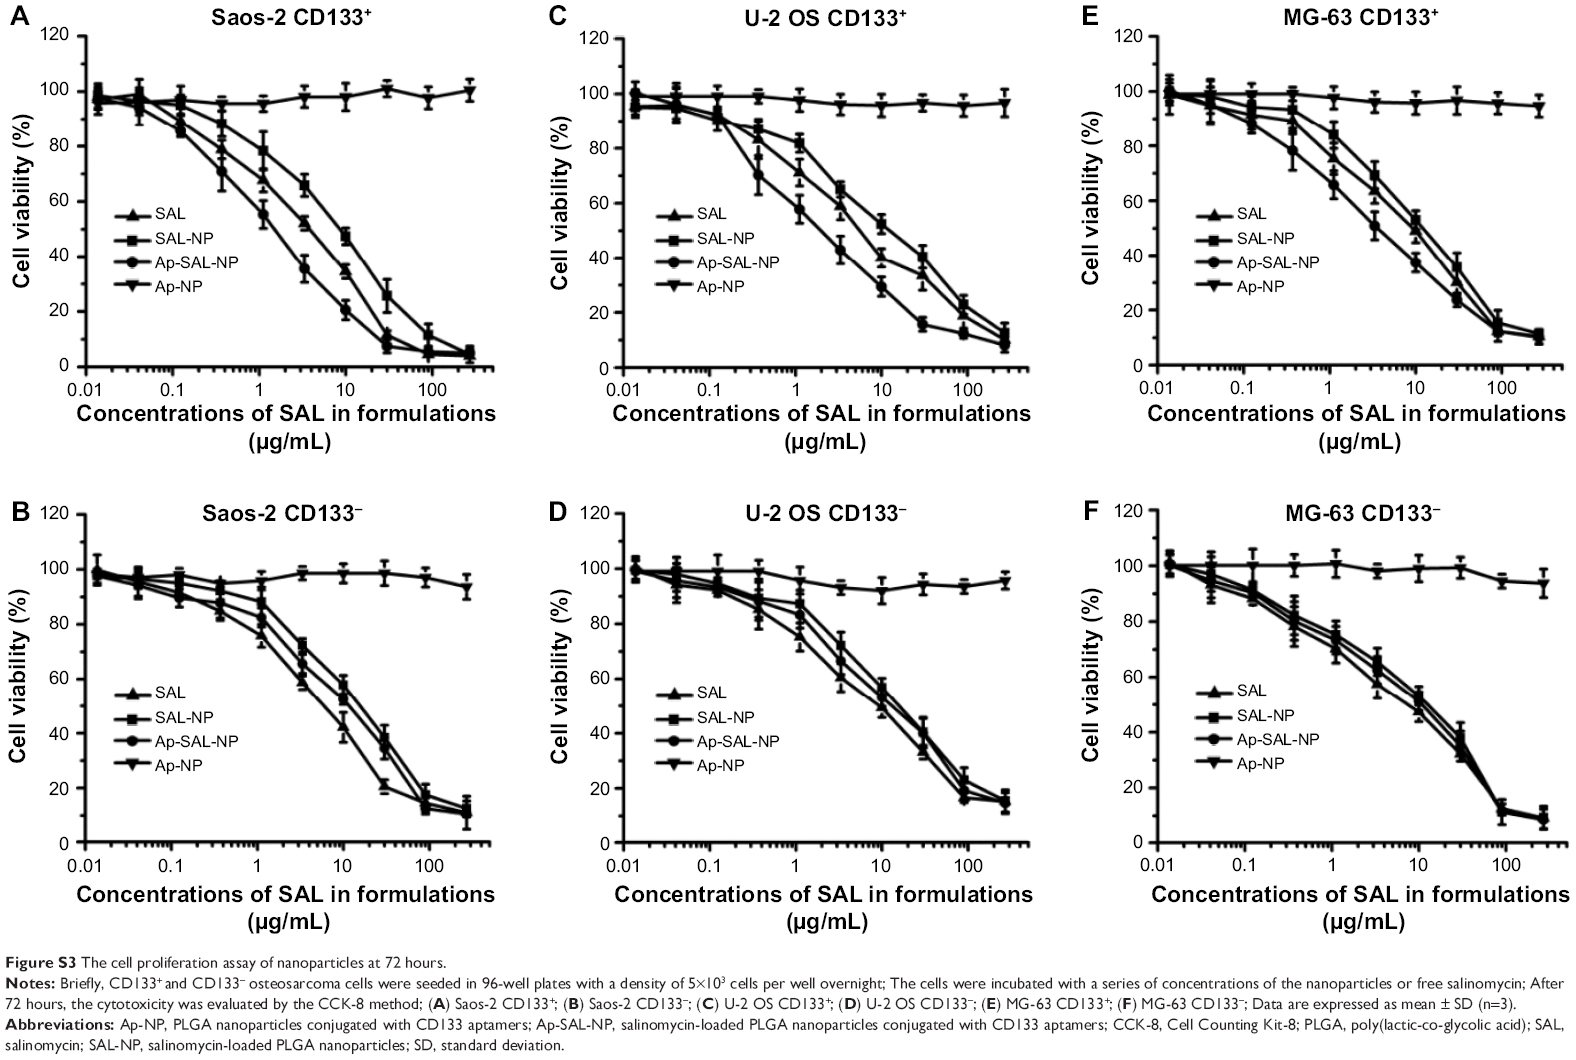 | Figure S3 The cell proliferation assay of nanoparticles at 72 hours. |
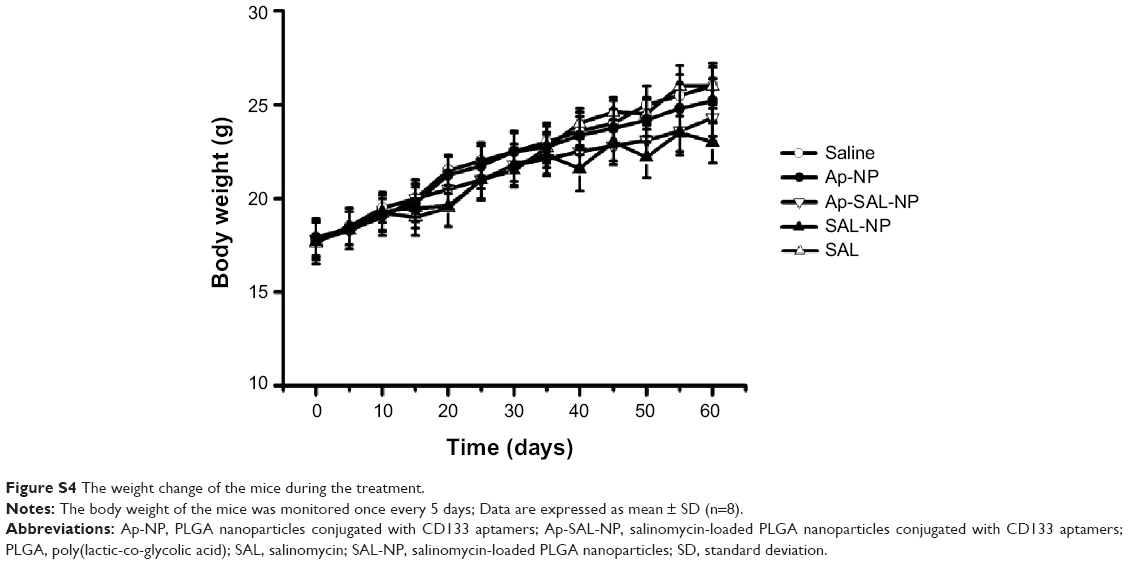 | Figure S4 The weight change of the mice during the treatment. |
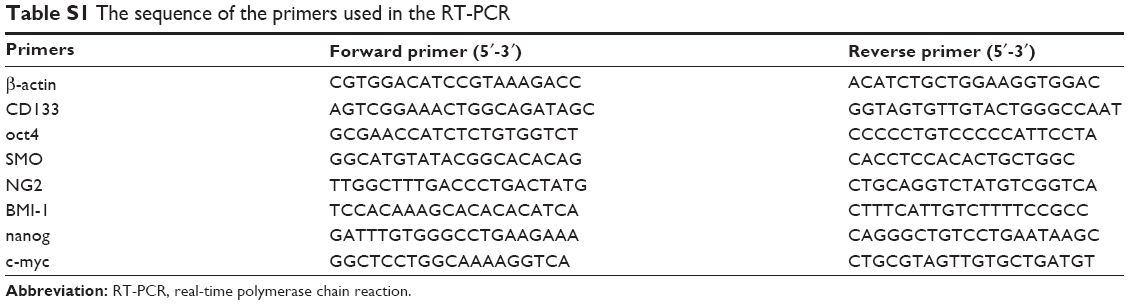 | Table S1 The sequence of the primers used in the RT-PCR |
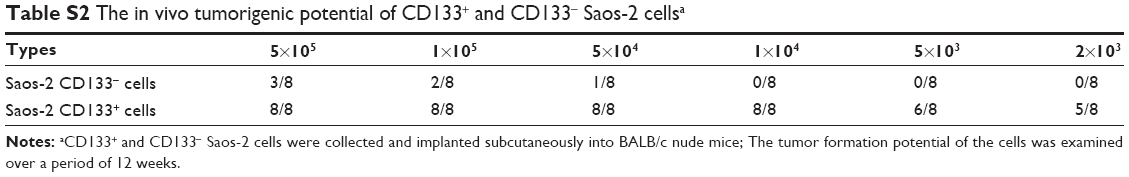 | Table S2 The in vivo tumorigenic potential of CD133+ and CD133− Saos-2 cellsa |
 © 2015 The Author(s). This work is published and licensed by Dove Medical Press Limited. The full terms of this license are available at https://www.dovepress.com/terms.php and incorporate the Creative Commons Attribution - Non Commercial (unported, v3.0) License.
By accessing the work you hereby accept the Terms. Non-commercial uses of the work are permitted without any further permission from Dove Medical Press Limited, provided the work is properly attributed. For permission for commercial use of this work, please see paragraphs 4.2 and 5 of our Terms.
© 2015 The Author(s). This work is published and licensed by Dove Medical Press Limited. The full terms of this license are available at https://www.dovepress.com/terms.php and incorporate the Creative Commons Attribution - Non Commercial (unported, v3.0) License.
By accessing the work you hereby accept the Terms. Non-commercial uses of the work are permitted without any further permission from Dove Medical Press Limited, provided the work is properly attributed. For permission for commercial use of this work, please see paragraphs 4.2 and 5 of our Terms.