")
Back to Journals » International Journal of Nanomedicine » Volume 9 » Issue 1
Polyethylene glycol–polylactic acid nanoparticles modified with cysteine–arginine–glutamic acid–lysine–alanine fibrin-homing peptide for glioblastoma therapy by enhanced retention effect
Authors Wu J, Zhao J, Zhang B , Qian Y, Gao H, Yu Y, Wei Y, Yang Z, Jiang X, Pang Z , Pang Z
Received 13 August 2014
Accepted for publication 22 September 2014
Published 13 November 2014 Volume 2014:9(1) Pages 5261—5271
DOI https://doi.org/10.2147/IJN.S72649
Checked for plagiarism Yes
Review by Single anonymous peer review
Peer reviewer comments 4
Editor who approved publication: Dr Thomas Webster
Junzhu Wu,1,2,* Jingjing Zhao,1,3,* Bo Zhang,1 Yong Qian,1 Huile Gao,1 Yuan Yu,1 Yan Wei,1 Zhi Yang,1 Xinguo Jiang,1 Zhiqing Pang1
1Key Laboratory of Smart Drug Delivery, Ministry of Education, Department of Pharmaceutics, School of Pharmacy, Fudan University, Shanghai, 2School of Pharmacy, Dali University, Xiaguan, 3School of Pharmacy, China Pharmaceutical University, Nanjing, People’s Republic of China
*These authors contributed equally to this work
Abstract: For a nanoparticulate drug-delivery system, crucial challenges in brain-glioblastoma therapy are its poor penetration and retention in the glioblastoma parenchyma. As a prevailing component in the extracellular matrix of many solid tumors, fibrin plays a critical role in the maintenance of glioblastoma morphology and glioblastoma cell differentiation and proliferation. We developed a new drug-delivery system by conjugating polyethylene glycol–polylactic acid nanoparticles (NPs) with cysteine–arginine–glutamic acid–lysine–alanine (CREKA; TNPs), a peptide with special affinity for fibrin, to mediate glioblastoma-homing and prolong NP retention at the tumor site. In vitro binding tests indicated that CREKA significantly enhanced specific binding of NPs with fibrin. In vivo fluorescence imaging of glioblastoma-bearing nude mice, ex vivo brain imaging, and glioblastoma distribution demonstrated that TNPs had higher accumulation and longer retention in the glioblastoma site over unmodified NPs. Furthermore, pharmacodynamic results showed that paclitaxel-loaded TNPs significantly prolonged the median survival time of intracranial U87 glioblastoma-bearing nude mice compared with controls, Taxol, and NPs. These findings suggested that TNPs were able to target the glioblastoma and enhance retention, which is a valuable strategy for tumor therapy.
Keywords: CREKA peptide, nanoparticles, retention effect, paclitaxel, glioblastoma
Introduction
Accounting for about 70% of all malignant gliomas,1 glioblastoma (GBM) is the most malignant type of brain tumor in adults,2,3 with median survival time of 15–21 months4,5 and a 5-year survival rate of lower than 5%,4 despite aggressive treatment. The treatment of GBM continues to be an enormous challenge, even though much remarkable advancement has been achieved in the treatment of other tumors. Nanoparticle (NP) drug-delivery systems have brought hope to the treatment of GBM, since they have shown great potential in drug delivery and have been developed rapidly over the past years. For NP drug-delivery systems, crucial challenges in brain GBM therapy are their poor penetration and retention in the GBM parenchyma, as GBM is less permeable than peripheral solid tumors and rapid NP clearance in tumors hinders the treatment of GBM.6
With regard to this issue, many strategies have been presented.7–10 Some researchers have designed NPs for blood–brain barrier (BBB) penetration by adjusting the size and surface potential of NPs,11–15 and retained them in tumors by enhanced permeability and retention (EPR).16 However, there was still a big gap between EPR-dependent results and expectation. In order to achieve higher NP uptake in tumor cells, most research has focused on actively targeting NPs17,18 that mainly targeted specific receptors on BBB and/or GBM cells, as well as those on GMB stroma cells.11 Unfortunately, the receptor-targeting drug-delivery system was not perfect, because the relative expression of those commonly used target receptors of BBB or GBM cells was not high enough and the GBM-targeting efficiency was still moderate, which led to limited treatment effect.11,19,20 For instance, as a classic tumor-associated receptor, transferrin-receptor expression is upregulated in tumor cells only three- to fivefold higher than that in normal tissues.19,20 Moreover, few studies have focused on NP retention in tumor tissue for the improvement of GBM treatment. Therefore, alternative therapeutic approaches targeting GBM with high efficiency are still urgently needed.
Large amounts of extracellular matrix (ECM) exist in GBM, which play a critical role in the maintenance of GBM morphology and are closely associated with GBM cell differentiation and proliferation.21 As a prevailing part of ECM, lots of fibrin is deposited in the tumor matrix due to vascular leaky and hemorrhagic vasculature, but no such cross-linked fibrin is detectable in normal tissues.22–24 In addition, fibrin is considered more abundant and possibly more stable than nonspecific and limited numbers of receptors, and thus to be a better target, and it has been used in the molecular imaging of cancer.1,25 Then, a novel drug-delivery system can be developed based on abundant and specific fibrin deposits, which may prolong drug retention in tumors and improve the effectiveness of tumor treatment.
Tumor-homing peptide cysteine–arginine–glutamic acid–lysine–alanine (CREKA), a linear pentapeptide achieved by in vivo phage display, is also one type of fibrin-binding peptide.26 Taking advantage of its fibrin-binding capacity to thrombi and microthrombi, this pentapeptide has been utilized for the image diagnosis of myocardial ischemia and tumors,1,25,26 but not for the targeted therapy of GMB.20 Compared to cyclic fibrin-binding peptides, the linear pentapeptide is simpler and more stable in structure.24,26 In addition, the terminal sulfhydryl group of cysteine provides good binding activity.24 The characters of CREKA suggest that it may be a good medium for the targeted therapy of GMB, and can perhaps increase the EPR effect and even the GBM cell uptake of modified NPs, and then improve the result of GMB therapy.
In order to validate our assumptions, we developed a new strategy to deliver paclitaxel (PTX)-loaded NPs to GBM nidi by modifying the NPs with the fibrin-binding peptide CREKA. Firstly, the NPs were prepared by an emulsion/solvent evaporation technique, and CREKA was conjugated to the NP surface through a maleimide (Mal)–thiol reaction. The clot-binding capacity of CREKA was tested by an in vitro clot-binding experiment. In vivo NP retention in GBM-bearing mice was investigated by Spectrum IVIS [in vivo imaging system] (PerkinElmer, USA) and frozen slices of GBM tissues. Finally, the median survival time of each group was compared to evaluate the therapeutic effect of modified PTX-loaded NPs.
Materials and methods
Materials and animals
Methoxy-poly(ethylene glycol) (MPEG, molecular weight [MW] 3,000 Da) and Mal-PEG (MW 3,400 Da) were purchased from NOF (Japan) and Laysan Bio (USA), respectively. d,l-Lactide (purity 99.5%) was supplied by Purac (the Netherlands). MPEG-poly(lactic acid) (MPEG-PLA; MW 33,000 Da) and Mal-PEG-PLA (MW 33,400 Da) block copolymers were selected to prepare the NPs, as the PEG on the surface of NPs can prolong the in vivo circulation time.28 These two block copolymers were synthesized by ring-opening polymerization of lactide using MPEG and Mal-PEG as the initiator as previously described.29 The CREKA peptide was synthesized by the Chinese Peptide Company (People’s Republic of China [PRC]). 1,1′-Dioctadecyl-3,3,3′,3′-tetramethylindotricarbocyanine iodide (DiR), a near-infrared dye, was obtained from Biotium (Invitrogen, USA). Coumarin 6 was obtained from Sigma-Aldrich (USA). PTX was purchased from Nanfang Biotech (PRC). Fresh frozen human plasma (FFP) was from the Shanghai Blood Center (PRC), and thrombin was from Siemens Healthcare (Germany). The U87-RFP cell line was bought from Shanghai SBO Medical Biotechnology (PRC). Dulbecco’s Modified Eagle’s Medium (high-glucose) cell-culture medium, plastic cell-culture dishes, and plates were purchased from Corning (USA). Fetal bovine serum (FBS) was purchased from Gibco (USA). Trypsin–ethylenediaminetetraacetic acid and penicillin–streptomycin solution were provided by Invitrogen (Belgium). Double-distilled water was purified using a Millipore Simplicity System (USA). DAPI (4′,6-diamidino-2-phenylindole) was from Beyotime Biotechnology (PRC). All the other chemical reagents were analytical grade or chromatographic pure grade, and were purchased from Sinopharm Chemical Reagent (PRC).
BALB/c nude mice (male, 4–5 weeks old, 18–22 g) were purchased from the Shanghai Laboratory Animal Center (PRC) and maintained under standard housing conditions. All animal experiments were carried out in accordance with protocols evaluated and approved by the ethics committee of Fudan University.
Preparation of NPs and TNPs
Unmodified NPs were prepared with a blend of MPEG-PLA and Mal-PEG-PLA (10:1 w/w) by an emulsion/solvent evaporation technique. Briefly, 30 mg of MPEG-PLA and 3 mg of Mal-PEG-PLA were dissolved in 1 mL of dichloromethane and then added to 5 mL of 0.6% sodium cholate aqueous solution. The mixture was intensively emulsified by sonication for 100 seconds at 200 W in ice water using a probe sonicator (Scientz Biotechnology, PRC). After dichloromethane was removed by rotary evaporation (Shanghai Institute of Organic Chemistry, PRC) at 37°C, the obtained NPs were concentrated by centrifugation at 21,000 g for 40 minutes at 4°C with a TJ-25 centrifuge (Beckman Coulter, USA) and resuspended in 0.5 mL of deionized water. For CREKA peptide conjugation with NPs (TNPs), the NP suspension was mixed with 18 μg of CREKA and stirred at 50 rpm for 4 hours under nitrogen conditions. Free CREKA was removed by centrifugation at 21,000 g for 40 minutes at 4°C. PTX-loaded, coumarin 6-, or DiR-labeled NPs and TNPs were prepared using the same procedure, except that 2 mg of PTX, 750 μg of coumarin 6, or 300 μg of DiR were dissolved in 1 mL of dichloromethane in advance.
Characterization of NPs and TNPs
Size, zeta potential, and morphology
The particle size and zeta potential of NPs and TNPs were determined by a 3600 Nano ZS Zetasizer (Malvern Instruments, UK; n=3). The morphology of NPs was observed by transmission electron microscopy (H-600; Hitachi, Japan) following negative staining with 2% sodium phosphotungstate solution.
Conjugation efficiency of CREKA with nanoparticles and CREKA density on the nanoparticle surface
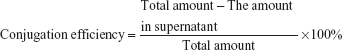
The conjugation efficiency of CREKA with NPs was determined by measuring free CREKA concentration in the supernatant using high-performance liquid chromatography (HPLC) (1200 series; Agilent, USA), which was equipped with an analytical column (250×4.6 mm, pore size 5 μm, Zorbax 300SB-C18; Agilent). The mobile phase consisted of solvent A (0.1% trifluoroacetic acid in water) and solvent B (80% acetonitrile aqueous solution containing 0.09% trifluoroacetic acid) (A:B =92:8, v/v) at a flow rate of 1.0 mL/min. The ultraviolet (UV)-detection wavelength was set at 220 nm, and the sample injection volume was 20 μL. CREKA conjugation efficiency was calculated with the formula:
|
The peptide density on the nanoparticle surface was calculated as follows:
|
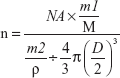
NA was Avogadro's constant, m1 was the weight of CREKA peptide conjugated to NPs, M was the molar mass of CREKA peptide, m2 was the weight of NPs, D was the mean diameter of NPs and ρ was the density of NPs, estimated to be 1.1 g/cm3.
Drug-encapsulation efficiency and -loading capacity
In order to investigate the encapsulation efficiency (EE) and loading capacity (LC) of PTX in NPs, 100 μL of PTX-loaded NPs (PTX NPs) or PTX-loaded TNPs (PTX TNPs) was dissolved in 900 μL of acetonitrile and vortexed for 1 minute. After centrifugation at 10,000 rpm for 10 minutes using a 5418 R centrifuge (Eppendorf, Germany) to remove the polymer materials, 20 μL of supernatant was injected into the HPLC system to quantify the PTX concentration. An analytical column (200×4.6 mm, pore size 5 μm; Diamonsil TMC18) was used at room temperature. The mobile phase consisted of acetonitrile and water (55:45 v/v) with a flow rate of 1.0 mL/min. The UV-detection wavelength was set at 227 nm. The EE and LC were calculated as previously described: LC = PTXencapsulated/materials ×100%, EE = PTXencapsulated/PTXtotal ×100%.11 The EE and LC of coumarin 6 in NPs were also determined in the same way as PTX, except for the chromatographic conditions. For the determination of coumarin 6, the mobile phase was methanol and water (96:4 v/v), and the UV-detection wavelength was set at 465 nm. To determine the EE and LC of DiR in NPs, DiR-labeled NPs or TNPs were treated with the same method as described earlier, but DiR concentration in the supernatant was determined at 754 nm by a microplate reader (BioTek Synergy TM2) instead of the HPLC system.
In vitro release profiles
The in vitro release behaviors of PTX, DiR, and coumarin 6 were evaluated by a dialysis method. For DiR and coumarin 6 release, 0.01 M phosphate-buffered saline (PBS; pH 7.4) and 10% FBS in 0.01 M PBS were selected as the release medium to investigate whether DiR and coumarin 6 were suitable for NP tracking in vivo. For PTX release, 0.01 M PBS (pH 7.4 and 5.0) with 0.5% Tween 80 was used as release medium. For the release study, 1 mL of PTX-loaded NPs and coumarin 6 or DiR-labeled NPs in the release medium were transferred into the dialysis bag (MW cutoff 7,000 Da) and incubated in 30 mL release medium at 37°C at a shaking speed of 100 rpm. At each setting time point, 0.5 mL of release medium was withdrawn, followed by the addition of an equal volume of fresh release medium immediately. The amounts of PTX, coumarin 6, and DiR were determined by the same method mentioned earlier.
In vitro TNP binding with fibrin
Fluorescence microscopy of TNP binding with FFP clots
The fluorescence microscopy of TNP binding with FFP clots was performed as previously described.26 In brief, each microscope slide received 20 μL of FFP, 2 μL of 0.4 M CaCl2, and 2 μL of thrombin (0.1 U/mL PBS). Slides were incubated at 37°C for 60 minutes to form fibrin clots. Coumarin 6-labeled NP solutions (20 μL, 5 mg/mL) were then added to each clot and incubated at 37°C for an additional 15 minutes. Afterward, the clots were washed thrice with PBS and imaged by fluorescence microscopy (Leica, Germany). Experiments were performed in quadruplicate.
Optical imaging of TNP binding with FFP clots
Fibrin clots were formed in a 96-well plate. Each well received 90 μL of FFP, 5 μL of 0.4 M CaCl2, and 25 μL thrombin (0.1 U/mL), and the plate was incubated at 37°C for 90 minutes. DiR-labeled NP solutions (50 μL, 5 mg/mL) were then added to each well and incubated at 37°C for an additional 30 minutes. Afterward, the clots were then washed thrice with PBS and imaged with the IVIS in the near-infrared channel (745 nm excitation and 800 nm emission).
In vivo imaging of glioblastoma-bearing nude mice
The U87 orthotopic GBM model was established by injection of U87 cells (106 cells in 5 μL of PBS [0.01 M, pH 7.4]) into the right brain of each nude mouse (2 mm laterally to the bregma and 5.0 mm deep from the dura) at a rate of 3.0 mL/min using a stereotaxic apparatus. Fourteen days after U87 cell inoculation, DiR-labeled NPs or TNPs were injected into the GBM-bearing mice via the tail vein (9 mg/kg DiR). After injection, fluorescence imaging of mice was performed at 8, 12, 24, 48, and 72 hours with the IVIS. At 24, 48, and 72 hours postinjection, three mice in each group were killed and perfused with PBS (0.01 M, pH 7.4) and 4% paraformaldehyde. The main organs, including the brain, heart, liver, spleen, lung, and kidney, were then harvested and analyzed with the IVIS.
Distribution of TNPs in glioblastoma
Fourteen days after the inoculation of U87 cells, coumarin 6-labeled NPs or TNPs were injected into the mice via tail veins at a coumarin 6 dose of 1.5 mg/kg; 72 hours later, the mice were killed and then were perfused with PBS (0.01 M, pH 7.4) and 4% paraformaldehyde. The brains were collected and fixed in 4% paraformaldehyde for 24 hours, then sequentially dehydrated with 15% and 30% sucrose solution. Afterward, these brains were frozen optimal cutting temperature in OCT (Sakura, Torrance, CA, USA) at -80°C and sectioned into slices 20 μm thick. After being stained with 1 μg/mL DAPI for 10 minutes at room temperature, these slides were observed under a fluorescence microscope (Leica DMI 4000B) to reveal the fluorescent distribution of NPs and TNPs in brain tumor sites. The overlay of green NPs with red GBM cells was analyzed by ImageJ 1.48 software.
Pharmacodynamic evaluation
The orthotopic brain GBM model was established as described earlier. Forty mice were randomly divided into four groups and administered (intravenously) with 100 μL of PTX NPs, PTX TNPs, and Taxol at an equal dose of 5 mg/kg PTX at 14, 16, 18, and 20 days after U87 cell inoculation. The survival time of animals was recorded, and the data were processed by Kaplan–Meier survival log-rank analysis to evaluate the anti-GBM efficacy of these PTX formulations.
Statistical analysis
Data are presented as means ± standard deviation. One-way analysis of variance was used to analyze the significance among groups, after which post hoc tests with Bonferroni correction were used for comparison between individual groups. A P-value less than 0.05 was considered to be statistically significant.
Results and discussion
Characterization of NPs and TNPs
Nanoparticle morphology, size, and zeta potential
As shown in Figure 1A, transmission electron microscopy showed that TNPs were spherical and well dispersed without any aggregation. The mean particle sizes of NPs and TNPs were 104.5±4.0 nm and 106.6±6.2 nm, respectively (Table 1 and Figure 1B). Zeta potentials of NPs and TNPs were −24.1±1.3 mV and −22.5±1.9 mV, respectively (Table 1 and Figure 1C). Compared with NPs, it was observed that the mean particle size and zeta-potential value of TNPs were slightly increased, but not significantly so. As shown in Table 1, the encapsulation of DiR, coumarin 6, or PTX in NPs also slightly changed the particle size and zeta potential, but not significantly so. In this study, the NPs made by emulsion/solvent evaporation had a particle size of about 100 nm, which was an appropriate size for in vivo drug delivery.30 We all know that NP modification changes particle size and surface zeta potential, and so it was in our research. However, these changes were so minimal that they could be ignored, as they would not have changed the in vitro and in vivo behavior of NPs.31
 | Table 1 Size and zeta potential of nanoparticles (NPs; n=3) |
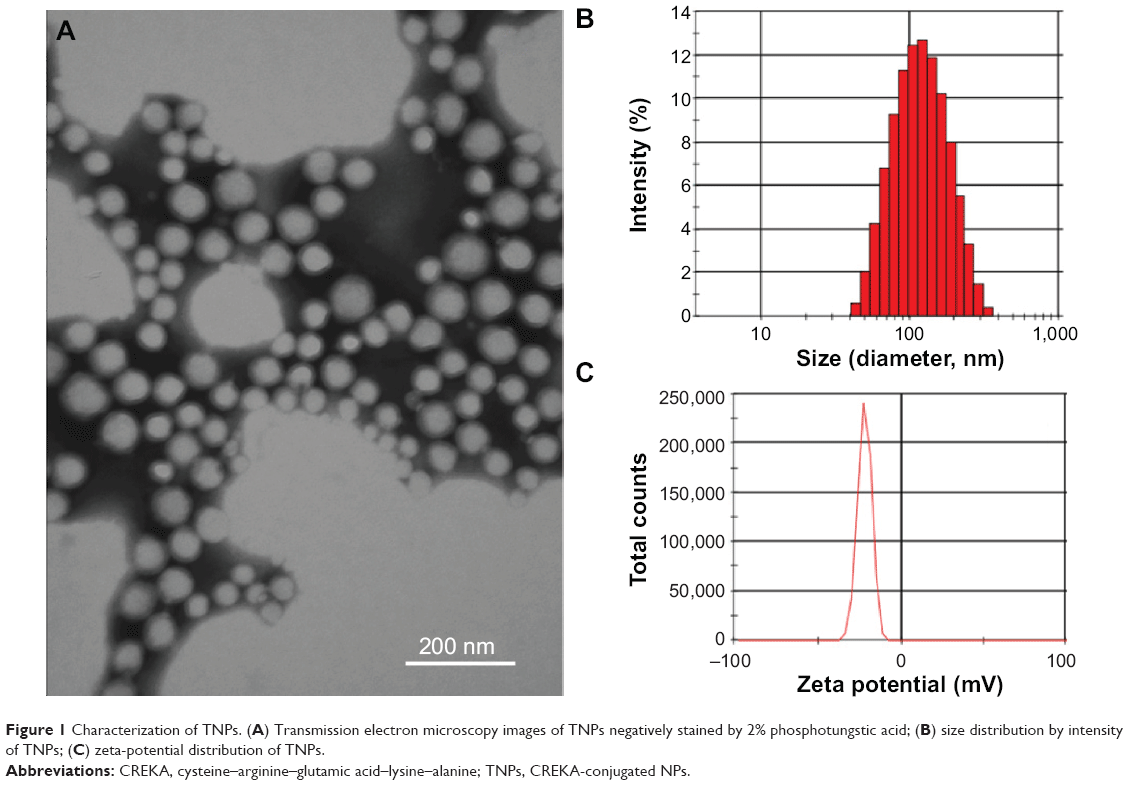 | Figure 1 Characterization of TNPs. (A) Transmission electron microscopy images of TNPs negatively stained by 2% phosphotungstic acid; (B) size distribution by intensity of TNPs; (C) zeta-potential distribution of TNPs. |
Conjugation efficiency of CREKA with nanoparticles and CREKA density on the nanoparticle surface
Under our experiment conditions (mass ratio of Mal-PEG-PLA to CREKA 3 mg:18 μg, reaction time 4 hours), only about 0.6 μg of free CREKA was detected in the supernatant, and the CREKA conjugation efficiency was approximately 96.7%. The density of CREKA on the surface of NPs was 220±36, which is reasonable for an actively targeting drug-delivery system. In addition, the peptide density in the present study did not cause notable changes in surface charge, and thus reduced the influence of surface charge on NP behavior in vitro and in vivo.
Drug-encapsulation efficiency and -loading capacity
The EE and LC values of fluorescence dye and PTX in NPs and TNPs are shown in Table 2. The EEs of PTX for PTX NPs and PTX TNPs were 23.96%±1.62% and 22.86%±1.21%, respectively. The LCs of PTX for PTX NPs and PTX TNPs were 1.45%±0.10% and 1.38%±0.07%, respectively. The LCs of DiR and coumarin 6 in PTX TNPs were 0.33%±0.03% and 1.07%±0.09%, respectively, which were high enough for in vivo tracking of NPs.
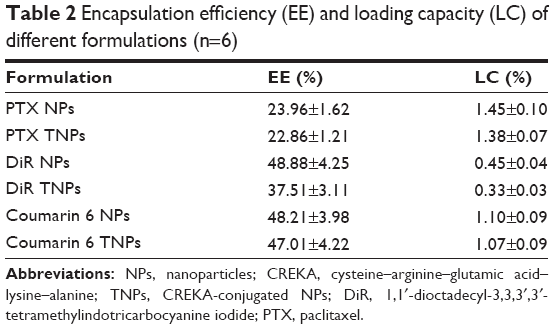 | Table 2 Encapsulation efficiency (EE) and loading capacity (LC) of different formulations (n=6) |
In vitro release profiles
The fluorescence probe DiR or coumarin 6 was encapsulated in NPs or TNPs acting as NP tracers in vivo or in vitro due to their good sensitivity and relatively low leak from NPs.31,32 The in vitro release curves showed that the conjugation of CREKA did not significantly change the release profiles of DiR or coumarin 6 from NPs (Figure 2A, B). After 72 hours, the cumulative release of DiR was lower than 1% in PBS (pH 7.4) and approximately 3% in 10% FBS. The cumulative release of coumarin 6 was also lower than 1% in PBS (pH 7.4) and approximately 5% in 10% FBS. The very low release of DiR and coumarin 6 from NPs indicated that DiR and coumarin 6 could be accurate fluorescence probes for NP behavior in vivo, and the fluorescence signals detected in organs well represented the distribution of the NPs. The release behaviors of PTX from TNPs were similar to that from NPs in both pH 5.0 PBS and pH 7.4 PBS (Figure 2C), indicating the surface CREKA on NPs did not significantly change the release profiles of PTX from NPs. After 48 hours in pH 5.0 PBS, the cumulative release percentages of PTX from NPs and TNPs were 94.53% and 97.07%, respectively, which were higher than those of NPs and TNPs in pH 7.4 PBS, indicating the acid environment in cell lysosomes might help PTX release from NPs.
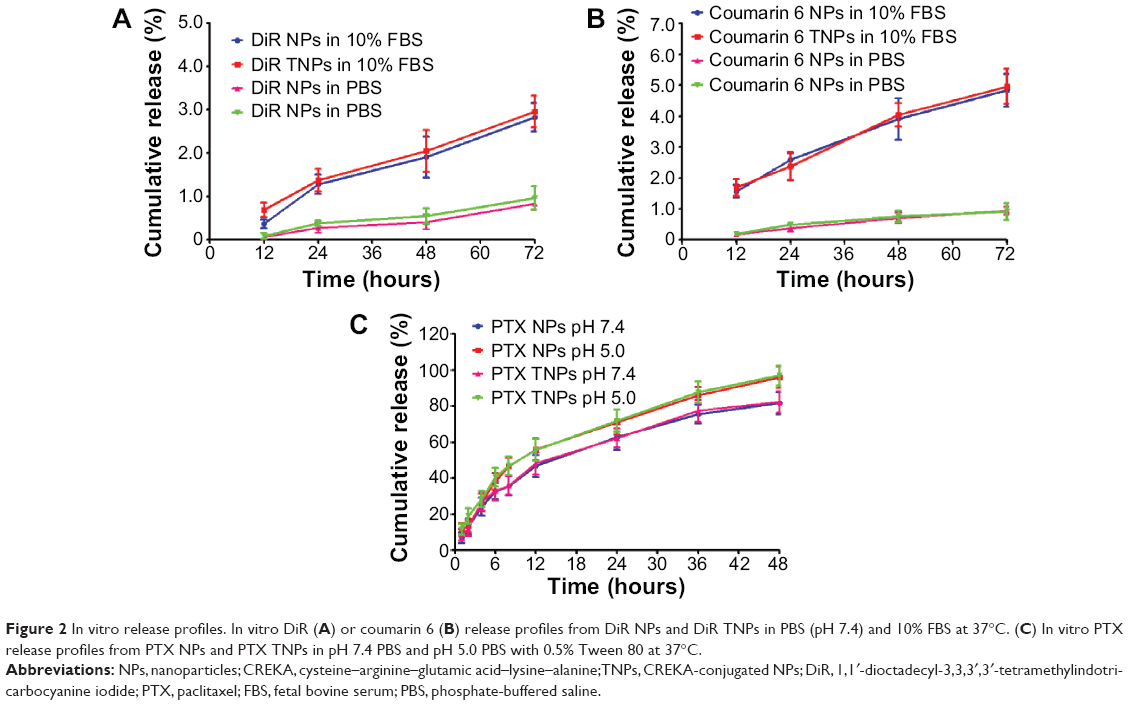 | Figure 2 In vitro release profiles. In vitro DiR (A) or coumarin 6 (B) release profiles from DiR NPs and DiR TNPs in PBS (pH 7.4) and 10% FBS at 37°C. (C) In vitro PTX release profiles from PTX NPs and PTX TNPs in pH 7.4 PBS and pH 5.0 PBS with 0.5% Tween 80 at 37°C. |
In vitro TNP binding with fibrin
The in vitro targeting capability of NPs to fibrin was investigated with FFP clots. For fluorescence microscopy imaging of NP binding with fibrin, fibrin clots were formed on microscope slides. As shown in Figure 3A, TNPs showed strong fluorescence on the surface of clots, whereas there was no significant binding of NP to the control clots. For optical imaging of NP binding with fibrin, fibrin clots were formed in 96-well plates. After incubation with NPs, the plate was imaged by the IVIS in the IR783 channel. As shown in Figure 3B, the TNP group demonstrated considerably greater radiant efficiency than unmodified NPs. Semiquantitative results revealed that the radiant efficiency of the TNP group (2.11±0.14×10⁹) was 3.5-fold that of unmodified NPs (P<0.001, Figure 3C). All these results suggest that CREKA conjugation on NPs imparted NPs a strong binding capability with fibrin, and the density of CREKA on the surface of NPs in the present study was enough for strong NP binding with fibrin, which agreed well with previous studies.27
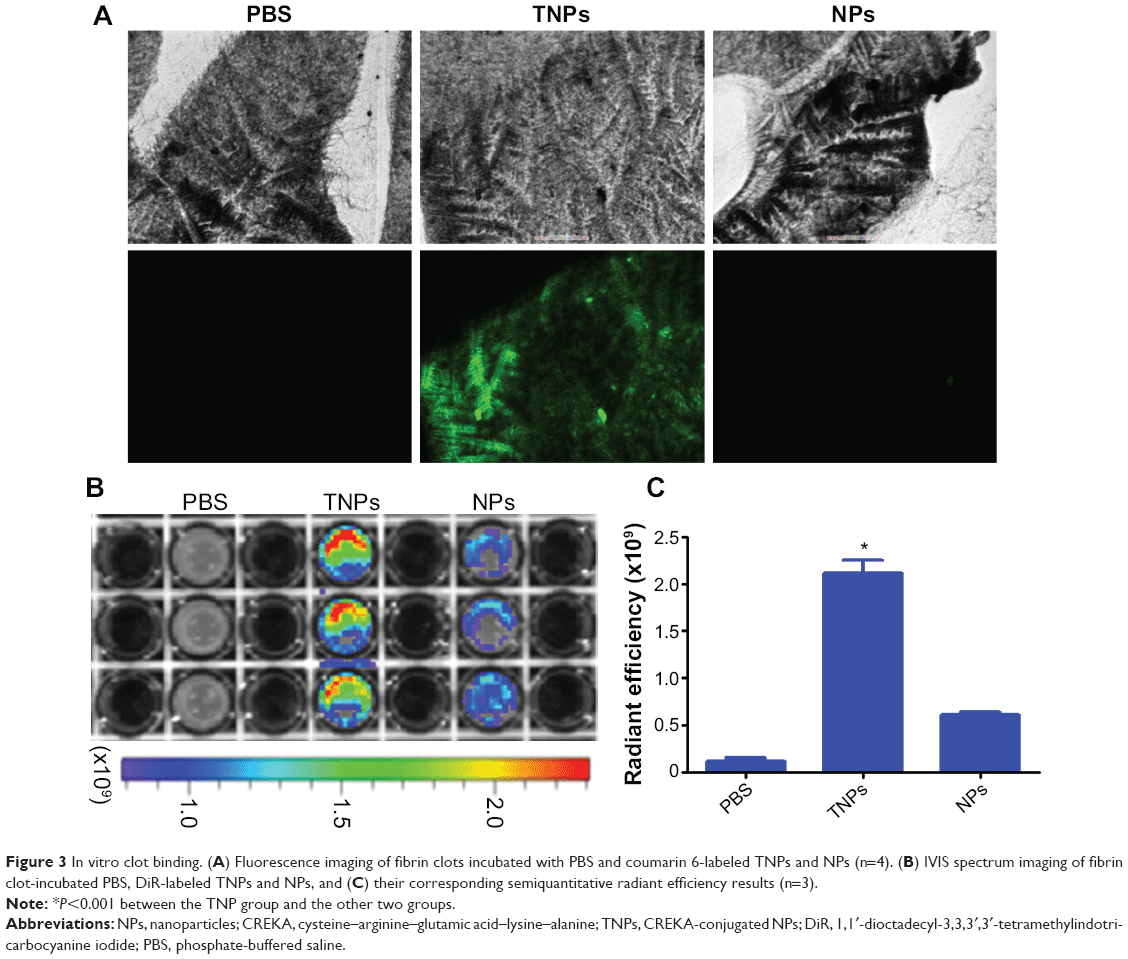 | Figure 3 In vitro clot binding. (A) Fluorescence imaging of fibrin clots incubated with PBS and coumarin 6-labeled TNPs and NPs (n=4). (B) IVIS spectrum imaging of fibrin clot-incubated PBS, DiR-labeled TNPs and NPs, and (C) their corresponding semiquantitative radiant efficiency results (n=3). |
In vivo imaging
In order to investigate the TNP-retention capability in GBM, in vivo imaging of GBM-bearing mice administered with DiR-labeled TNPs or NPs was conducted. As shown in Figure 4A, the brain fluorescence intensity of TNP-group mice was obviously higher than that of NP-group mice at each time point after administration, indicating TNPs had better retention and accumulation than NPs in GBM-related regions. Ex vivo imaging of the brains (Figure 4B) further demonstrated that GBM of TNPs had significantly higher fluorescence intensity at the GBM site (indicated by the red circle) than NPs at 24, 48, and 72 hours. Moreover, semiquantitative results revealed that the fluorescence intensity of the TNP group in the GBM decreased more slowly than that of NPs from 24 to 72 hours (Figure 4C). At 72 hours, the radiant efficiency of GBM for the TNP group was 5.8-fold that for the NP group. These results suggested that TNPs had better retention in GBM tissue compared with NPs, which might be attributable to the surface CREKA on NPs binding with abundant fibrin in GBM tissue and making NPs immobilized in the tumor.
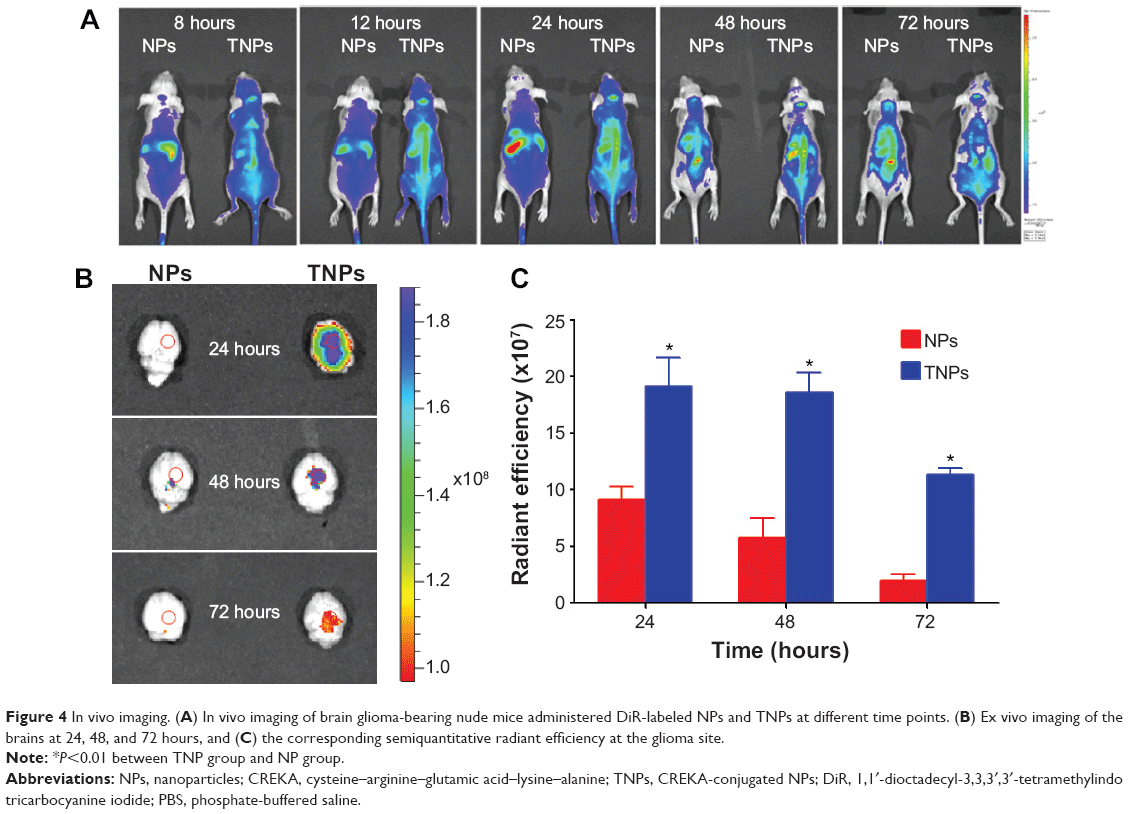 | Figure 4 In vivo imaging. (A) In vivo imaging of brain glioma-bearing nude mice administered DiR-labeled NPs and TNPs at different time points. (B) Ex vivo imaging of the brains at 24, 48, and 72 hours, and (C) the corresponding semiquantitative radiant efficiency at the glioma site. |
As shown in Figure 5, TNP distribution in other major organs was similar to NPs, and mainly distributed in the mononuclear phagocyte system-related organs, including the liver and spleen. TNP distribution in liver and spleen was lower than NPs at different time points, but not significantly so.
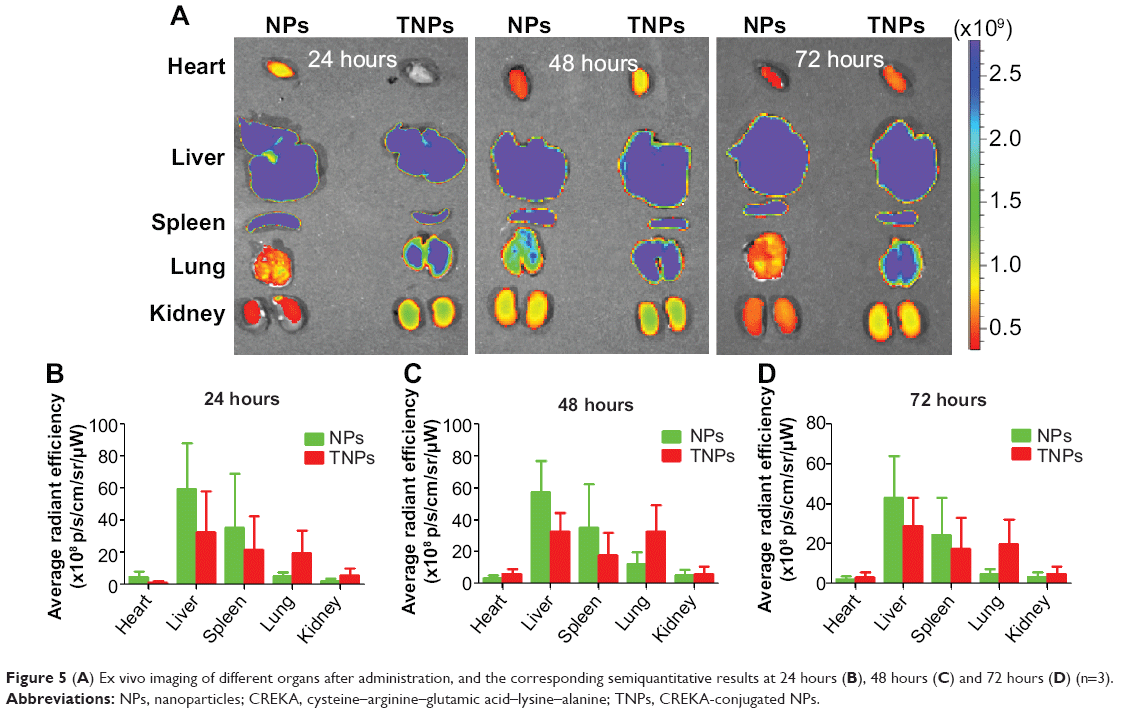 | Figure 5 (A) Ex vivo imaging of different organs after administration, and the corresponding semiquantitative results at 24 hours (B), 48 hours (C) and 72 hours (D) (n=3). |
In vivo distribution of TNPs in GBM
Fourteen days after GBM cell inoculation, in vivo distribution of coumarin 6-labeled NPs and TNPs in GBM slices was observed to investigate NP retention at 72 hours after intravenous administration. As shown in Figure 6, TNPs were distributed extensively and deeply in GBM tissues, while NP showed little distribution (Figure 6B, F). As we know, the necrotic areas and fibrosis in tumor can decrease intratumoral distribution of therapeutic agents. However, they had less impact on TNP distribution than NP distribution. Moreover, TNPs reached the deep region of tumor tissues uniformly, and even about 35% of TNPs (estimated by ImageJ software) were distributed in the GBM cells expressing red fluorescence protein (Figure 6D). This unique distribution of TNPs might be attributable to two factors. Firstly, TNP interaction with fibrins in the ECM to keep NPs immobilized in the tumor greatly enhanced the NP-retention effect. Secondly, TNPs interacted with fibrins to form coaggregates, which could bind to integrin on the surface of GBM cells, and ultimately became internalized.11 As shown in Figure 6D and H, no NPs or TNPs were accumulated in normal brain tissue, indicating TNPs loaded with chemotherapeutics would not damage the normal brain after GBM delivery.
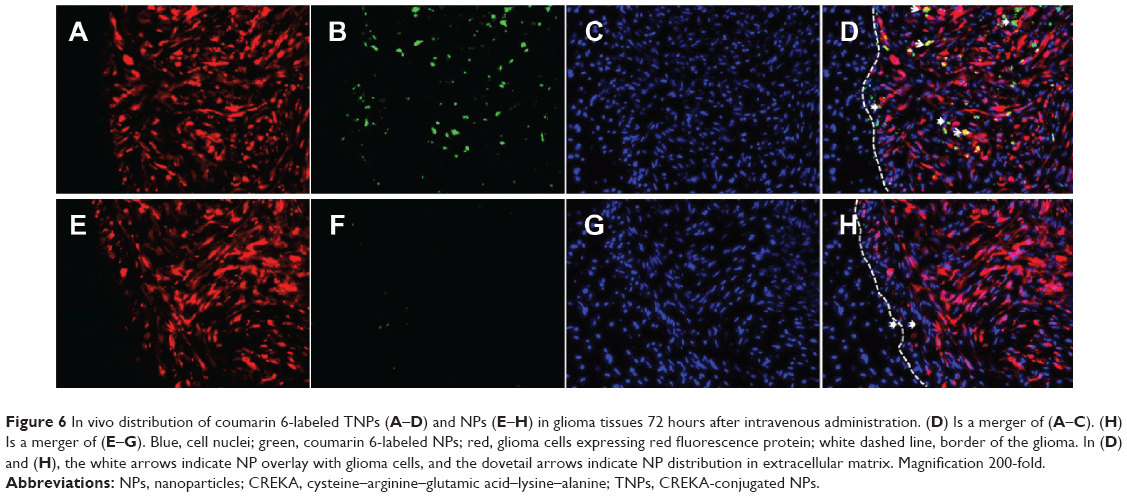 | Figure 6 In vivo distribution of coumarin 6-labeled TNPs (A–D) and NPs (E–H) in glioma tissues 72 hours after intravenous administration. (D) Is a merger of (A–C). (H) Is a merger of (E–G). Blue, cell nuclei; green, coumarin 6-labeled NPs; red, glioma cells expressing red fluorescence protein; white dashed line, border of the glioma. In (D) and (H), the white arrows indicate NP overlay with glioma cells, and the dovetail arrows indicate NP distribution in extracellular matrix. Magnification 200-fold. |
The binding-site barrier effect was discovered by Juweid et al and further research demonstrated that the penetration of antibodies, NPs, and block copolymer micelle in tissues would be limited because of the interaction between them and target cells.34,35 However, in the present study, it was demonstrated that TNPs distributed deeply in the GBM tissue, and the penetration of TNPs seemed not to be influenced by the binding-site barrier effect. The reasons might be that CREKA on the surface of NPs did not interact with the GBM cells directly, but with the ECM. Compared with a GBM cell receptor-targeting drug-delivery system, this new mode of NP interaction with ECM that would not limit the penetration of NPs by the binding-site barrier effect will be an advantage for tumor ECM-targeting strategies.
In vivo anti-glioblastoma efficacy
In order to evaluate the anti-GBM efficacy of PTX TNPs, the survival time of intracranial U87 GBM-bearing mice was monitored after four cycles of drug administration. The life span of GBM-bearing mice administered with PTX NPs, PTX TNPs, Taxol, or saline is shown in Figure 7 and Table 3. The median survival times for the PTX NP group, the PTX TNP group, the Taxol group, and the saline group were 36, 45, 48, and 60 days, respectively. Compared with the saline group, PTX NP and PTX TNP treatment significantly prolonged the survival time of GBM-bearing mice (P<0.01). Furthermore, the survival time of the TNP group was significantly longer than that of the PTX NP group (P<0.01). The in vivo anti-GBM results demonstrated that CREKA-modified NPs significantly improved the therapeutic effects of the commercial product Taxol and the traditional PTX NPs, which agreed well with in vivo imaging results and in vivo distribution in GBM. These remarkable results imply enormous clinical potential of fibrin-oriented targeting therapy of GBM.
 | Figure 7 Cumulative survival of glioma-bearing nude mice treated with different PTX formulations (n=10). |
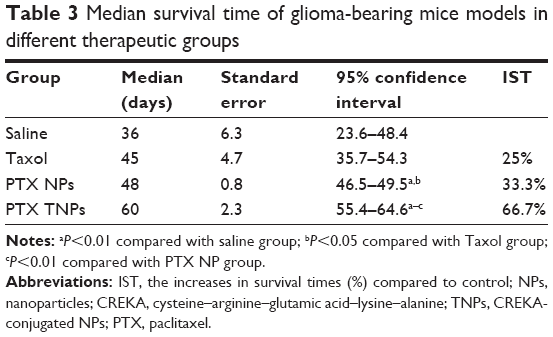 | Table 3 Median survival time of glioma-bearing mice models in different therapeutic groups |
Conclusion
In the present study, we developed an actively targeting drug-delivery system helping to enhance the NP-retention effect in GBM stroma, which may be a promising strategy for the treatment of malignant brain tumors. In vitro NPs binding with fibrin showed the CREKA-modified NPs had a higher capacity of binding to fibrin than other agents. In vivo imaging and GBM slice imaging revealed that TNPs demonstrated significantly stronger retention in GBM tissue than unmodified NPs. Moreover, CREKA-modified NPs significantly improved the therapeutic effects of the commercial product Taxol and the traditional PTX NPs. In summary, these promising results indicate that the CREKA-modified NPs might have positive potential in the clinical therapy of GBM.
Acknowledgments
This work was supported by the National Basic Research Program of China (program 973, 2013CB932502), the National Natural Science Foundation of China (81472757, 81302714), the State Scholarship Fund, and the Zhuoxue program of Fudan University.
Disclosure
The authors report no conflicts of interest in this work.
References
Chung EJ, Cheng Y, Morshed R, et al. Fibrin-binding, peptide amphiphile micelles for targeting glioblastoma. Biomaterials. 2014; 35(4):1249–1256. | ||
Palanichamy K, Erkkinen M, Chakravarti A. Predictive and prognostic markers in human glioblastomas. Curr Treat Options Oncol. 2006;7(6): 490–504. | ||
Bhujbal SV, de Vos P, Niclou SP. Drug and cell encapsulation: alternative delivery options for the treatment of malignant brain tumors. Adv Drug Deliv Rev. 2014;67–68:142–153. | ||
Stupp R, Hegi ME, Mason WP, et al. Effects of radiotherapy with concomitant and adjuvant temozolomide versus radiotherapy alone on survival in glioblastoma in a randomised phase III study: 5-year analysis of the EORTC-NCIC trial. Lancet Oncol. 2009;10(5):459–466. | ||
McGirt MJ, Than KD, Weingart JD, et al. Gliadel (BCNU) wafer plus concomitant temozolomide therapy after primary resection of glioblastoma multiforme. J Neurosurg. 2009;110(3):583–588. | ||
Liu Y, Lu W. Recent advances in brain tumor-targeted nano-drug delivery systems. Expert Opin Drug Deliv. 2012;9(6):671–686. | ||
Caruso G, Raudino G, Caffo M. Patented nanomedicines for the treatment of brain tumors. Pharm Pat Anal. 2013;2(6):745–754. | ||
Meyers JD, Doane T, Burda C, Basilion JP. Nanoparticles for imaging and treating brain cancer. Nanomedicine (Lond). 2013;8(1):123–143. | ||
Caruso G, Caffo M, Alafaci C, et al. Could nanoparticle systems have a role in the treatment of cerebral gliomas? Nanomedicine. 2011;7(6): 744–752. | ||
Gabathuler R. Approaches to transport therapeutic drugs across the blood-brain barrier to treat brain diseases. Neurobiol Dis. 2010;37(1): 48–57. | ||
Zhang B, Shen S, Liao Z, et al. Targeting fibronectins of glioma extracellular matrix by CLT1 peptide-conjugated nanoparticles. Biomaterials. 2014;35(13):4088–4098. | ||
Agemy L, Friedmann-Morvinski D, Kotamraju VR, et al. Targeted nanoparticle enhanced proapoptotic peptide as potential therapy for glioblastoma. Proc Natl Acad Sci U S A. 2011;108(42):17450–17455. | ||
Steiniger SC, Kreuter J, Khalansky AS, et al. Chemotherapy of glioblastoma in rats using doxorubicin-loaded nanoparticles. Int J Cancer. 2004;109(5):759–767. | ||
De Rosa G, Salzano G, Caraglia M, Abbruzzese A. Nanotechnologies: a strategy to overcome blood–brain barrier. Curr Drug Metab. 2012;13(1): 61–69. | ||
Caraglia M, De Rosa G, Salzano G, et al. Nanotech revolution for the anti-cancer drug delivery through blood–brain barrier. Curr Cancer Drug Targets. 2012;12(3):186–196. | ||
Vaupel P. Tumor microenvironmental physiology and its implications for radiation oncology. Semin Radiat Oncol. 2004;14(3):198–206. | ||
DeNardo SJ, DeNardo GL, Miers LA, et al. Development of tumor targeting bioprobes ((111)In-chimeric L6 monoclonal antibody nanoparticles) for alternating magnetic field cancer therapy. Clin Cancer Res. 2005;11(19):7087s–7092s. | ||
Cai W, Shin DW, Chen K, et al. Peptide-labeled near-infrared quantum dots for imaging tumor vasculature in living subjects. Nano Lett. 2006;6(4):669–676. | ||
Bae YH, Park K. Targeted drug delivery to tumors: myths, reality and possibility. J Control Release. 2011;153(3):198–205. | ||
Boult J, Roberts K, Brookes MJ, et al. Overexpression of cellular iron import proteins is associated with malignant progression of esophageal adenocarcinoma. Clin Cancer Res. 2008;14(2):379–387. | ||
Ulrich TA, de Juan Pardo EM, Kumar S. The mechanical rigidity of the extracellular matrix regulates the structure, motility, and proliferation of glioma cells. Cancer Res. 2009;69(10):4167–4174. | ||
Dvorak H, Senger DR, Dvorak A, Harvey V, McDonagh J. Regulation of extravascular coagulation by microvascular permeability. Science. 1985;227(4690):1059–1061. | ||
Pilch J, Brown DM, Komatsu M, et al. Peptides selected for binding to clotted plasma accumulate in tumor stroma and wounds. Proc Natl Acad Sci U S A. 2006;103(8):2800–2804. | ||
Abe K, Shoji M, Chen J, et al. Regulation of vascular endothelial growth factor production and angiogenesis by the cytoplasmic tail of tissue factor. Proc Natl Acad Sci U S A. 1999;96(15):8663–8668. | ||
Zhou Z, Wu X, Kresak A, Griswold M, Lu ZR. Peptide targeted tripod macrocyclic Gd(III) chelates for cancer molecular MRI. Biomaterials. 2013;34(31):7683–7693. | ||
Song Y, Huang Z, Xu J, et al. Multimodal SPION-CREKA peptide based agents for molecular imaging of microthrombus in a rat myocardial ischemia-reperfusion model. Biomaterials. 2014;35(9):2961–2970. | ||
Simberg D, Duza T, Park JH, et al. Biomimetic amplification of nanoparticle homing to tumors. Proc Natl Acad Sci U S A. 2007;104(3): 932–936. | ||
Gref R, Minamitake Y, Peracchia MT, Trubetskoy V, Torchilin V, Langer R. Biodegradable long-circulating polymeric nanospheres. Science. 1994;263(5153):1600–1603. | ||
Gao X, Tao W, Lu W, et al. Lectin-conjugated PEG-PLA nanoparticles: preparation and brain delivery after intranasal administration. Biomaterials. 2006;27(18):3482–3490. | ||
Pang Z, Gao H, Yu Y, et al. Brain delivery and cellular internalization mechanisms for transferrin conjugated biodegradable polymersomes. Int J Pharm. 2011;415(1–2):284–292. | ||
Graf N, Bielenberg DR, Kolishetti N, et al. α(v)β(3) Integrin-targeted PLGA-PEG nanoparticles for enhanced anti-tumor efficacy of a Pt(IV) prodrug. ACS Nano. 2012;6(5):4530–4539. | ||
Pang Z, Lu W, Gao H, et al. Preparation and brain delivery property of biodegradable polymersomes conjugated with OX26. J Control Release. 2008;128(2):120–127. | ||
Davda J, Labhasetwar V. Characterization of nanoparticle uptake by endothelial cells. Int J Pharm. 2002;233(1–2):51–59. | ||
Juweid M, Neumann R, Paik C, et al. Micropharmacology of monoclonal antibodies in solid tumors: direct experimental evidence for a binding site barrier. Cancer Res. 1992;52(19):5144–5153. | ||
Lee H, Fonge H, Hoang B, Reilly RM, Allen C. The effects of particle size and molecular targeting on the intratumoral and subcellular distribution of polymeric nanoparticles. Mol Pharm. 2010;7(4):1195–1208. |
 © 2014 The Author(s). This work is published and licensed by Dove Medical Press Limited. The full terms of this license are available at https://www.dovepress.com/terms.php and incorporate the Creative Commons Attribution - Non Commercial (unported, v3.0) License.
By accessing the work you hereby accept the Terms. Non-commercial uses of the work are permitted without any further permission from Dove Medical Press Limited, provided the work is properly attributed. For permission for commercial use of this work, please see paragraphs 4.2 and 5 of our Terms.
© 2014 The Author(s). This work is published and licensed by Dove Medical Press Limited. The full terms of this license are available at https://www.dovepress.com/terms.php and incorporate the Creative Commons Attribution - Non Commercial (unported, v3.0) License.
By accessing the work you hereby accept the Terms. Non-commercial uses of the work are permitted without any further permission from Dove Medical Press Limited, provided the work is properly attributed. For permission for commercial use of this work, please see paragraphs 4.2 and 5 of our Terms.