")
Back to Journals » Cancer Management and Research » Volume 13
PolG Inhibits Gastric Cancer Glycolysis and Viability by Suppressing PKM2 Phosphorylation
Authors Lv M, Zhang S, Dong Y, Cao L, Guo S
Received 16 November 2020
Accepted for publication 3 February 2021
Published 16 February 2021 Volume 2021:13 Pages 1559—1570
DOI https://doi.org/10.2147/CMAR.S292306
Checked for plagiarism Yes
Review by Single anonymous peer review
Peer reviewer comments 3
Editor who approved publication: Dr Xueqiong Zhu
Mengzhu Lv,1,* Simeng Zhang,2,* Yuqing Dong,1 Liu Cao,3 Shu Guo1
1Department of Plastic Surgery, China Medical University the First Hospital, Shenyang, 110001, Liaoning Province, People’s Republic of China; 2Department of Medical Oncology, China Medical University the First Hospital, Shenyang, 110001, Liaoning Province, People’s Republic of China; 3Key Laboratory of Medical Cell Biology, Ministry of Education, Institute of Translational Medicine, China Medical University, Liaoning Province Collaborative Innovation Center of Aging Related Disease Diagnosis and Treatment and Prevention, Shenyang, 110001, Liaoning Province, People’s Republic of China
*These authors contributed equally to this work
Correspondence: Shu Guo
Department of Plastic Surgery, China Medical University the First Hospital, No. 155, Nan Jing Street, Heping District, Shenyang, 110001, Liaoning Province, People’s Republic of China
Tel/Fax +86-24-83282779
Email [email protected]
Liu Cao
Institute of Translational Medicine, China Medical University, No. 77 Puhe Road, Shenyang North New Area, Shenyang, 110122, Liaoning Province, People’s Republic of China
Tel +86 24 31939630
Fax +86 024 31939630
Email [email protected]
Purpose: Gastric cancer (GC) is the fifth most frequently diagnosed cancer and the third leading cause of cancer-related death. There is a critical need for the development of novel therapies in GC. DNA polymerase gamma (PolG) has been implicated in mitochondrial homeostasis and affects the development of numerous types of cancer, however, its effects on GC and molecular mechanisms remain to be fully determined. The aim of the present research was to clarify the effects of PolG on GC and its possible molecular mechanism of action.
Methods: The GSE62254 dataset was used to predict the effect of PolG on prognostic value in GC patients. Lentivirus-mediated transduction was used to silence PolG expression. Western blot analysis evinced the silencing effect. Co-immunoprecipitation (Co-IP) analysis was performed to explore the potential molecular mechanism of action. Analysis of the glycolysis process in GC cells was also undertaken. Cell proliferation was determined using a CCK-8 (Cell Counting Kit-8) proliferation assay. Cell migration was detected using the Transwell device. Animal experiments were used to measure in vivo xenograft tumor growth.
Results: GC patients with low PolG expression have worse overall survival (OS) and progression-free survival (PFS). PolG binds to PKM2 and affects the activation of Tyr105-site phosphorylation, thus interfering with the glycolysis of GC cells. In vitro tumor formation experiments in mice also confirmed that PolG silencing of GC has a stronger proliferation ability. PolG can suppress GC cell growth both in vivo and in vitro.
Conclusion: Our study reveals a potential molecular mechanism between PolG and the energy metabolic process of GC tumor cells for the first time, suggesting PolG as an independent novel potential therapeutic target for tumor therapy, and providing new ideas for clinical GC treatment.
Keywords: DNA polymerase gamma, energy metabolism, tumor suppressor, PKM protein, stomach neoplasms
Plain Language Summary
Gastric cancer (GC) is the fifth most frequently diagnosed cancer and the third leading cause of cancer-related death. There is a critical need for the development of novel therapies in GC. DNA polymerase gamma (PolG) has been implicated in mitochondrial homeostasis and affects the development of a number of types of cancer: however, its effects on GC and molecular mechanisms of action therein remain to be fully determined. In this study, we found that PolG predicts favorable prognosis through online data analysis. Through Co-IP analysis, we found that PolG binds to PKM2 and affects the activation of Tyr105-site phosphorylation, thus interfering with the glycolysis of GC cells. In vitro tumor-formation experiments in mice also confirmed that PolG silencing of GC cells confers a stronger proliferation ability. Our study reveals a potential molecular mechanism of action between PolG and the energy metabolic process of GC cells, suggesting PolG as an independent novel potential therapeutic target for tumor therapy.
Introduction
One million new cases of gastric cancer (GC) were diagnosed globally in 2018 with an estimate of 783,000 deaths (amounting to 1 in every 12 deaths), making it the fifth most frequently diagnosed cancer and the third leading cause of cancer-related death.1 Major efforts have been made in GC treatment including targeted therapies such as HER2-targeted trastuzumab, VEGFR2-targeted ramucirumab, and immune checkpoint inhibitors (ICIs).2 In addition to these improvements, the complex biology of GC often results in treatment failure and therapeutic resistance.3 Therefore, it is necessary to further explore novel treatment targets, and adopt comprehensive treatment methods to deliver better patient outcomes in GC.
Under well-oxygenated conditions, oxidative phosphorylation is the primary way of nutrient catabolism and energy production in most differentiated cells.4 When the mitochondrial function of tumor cells is impaired, the energy supply capacity of oxidative phosphorylation is reduced which may impact the survival of tumor cells. However, due to changes in metabolic homeostasis, tumor cells have a preference to acquire energy through glycolysis under the same conditions, which is known as the Warburg effect.5,6
DNA polymerase gamma (PolG) is the main polymerase of mitochondrial DNA. PolG can affect the stability of mitochondrial DNA and interfere with the expression of proteins synthesized by mitochondrial DNA transcription, affecting mitochondrial homeostasis.7–9 Studies have reported that silencing of PolG in bowel cancer can reduce the content of mtDNA, and increase glucose uptake and lactate secretion, making tumors more resistant to oxidative stress.10 By systematically analyzing the DDR gene data of patients with hereditary breast cancers, missense mutations in PolG were significantly related to the risk of breast cancer.11 Curcumin can interfere with mitochondrial function by decreasing the expression of PolG, thereby inhibiting the development of GC.12,13 These findings suggest that PolG may be closely related to the occurrence, development and prognosis of tumors, yet the specific molecular mechanisms of PolG remain to be ascertained.
In this study, we explored the potential mechanism of PolG in the growth of GC tumors. Our results suggested that PolG is a tumor suppressor gene that impacts GC cell viability. PolG can also competitively bind to the phosphorylation site of PKM2, to reduce phosphorylation at the PKM2-Tyr105 site, and independently suppress the glycolysis of GC tumors to inhibit tumor growth.
Materials and Methods
Data Collection and Screening
Microarray data of GSE62254 were sourced from the Gene Expression Omnibus (www.ncbi.nlm.nih.gov/geo/). GSE62254 data were based on the GPL570 platforms (Affymetrix Human Genome U133 Plus 2.0 Array, 300 GC patients), and 295 samples with both clinical parameters and gene expression data of GC were included in this study. A Kaplan–Meier plotter (KM plotter) (http://www.kmplot.com/) was used for external validation.
Survival Analysis
Survival analysis was performed using the Kaplan–Meier (KM) method and a Log rank test. The expression levels of hub genes were separated according to high and low expression based on the median value. The Cox proportional-hazards regression model was applied to both uni- and multivariate analyses. A nomogram was set up by the rms package in R, according to the final multivariate COX regression model. The predictive accuracy was assessed by centrality-index (C-Index). The internal validation of nomogram was measured by a calibration curve.
Chemicals and Reagents
DMEM medium, FBS, penicillin/streptomycin, and trypsin were purchased from Invitrogen. Sodium butyrate and Puromycin and were purchased from Sigma. Anti-PolG antibodies (EPR7296) were purchased from Abcam. Antibodies specific to β-actin (A1978) were purchased from Sigma. PKM2 (4053s), pPKM2-Tyr105 (3827s), Myc (2276s), Flag (2368s), and HRP-conjugated secondary antibodies were purchased from Cell Signaling Technology Inc. Unless otherwise stated chemicals were purchased from Sigma.
Plasmid Construction
A lentiviral PolG shRNA was purchased from Genechem (Shanghai, China). The shRNA sequence targeting the human PolG complementary DNA was 5′-TGTCCAGGGAGAGTTTATA-3′. A scrambled shRNA was included as a negative control (NC). The expression of the Myc-tagged PolG plasmid was constructed by PCR amplification (Primer sequences: F: 5′-CCGGAATTCGCCACCATGAGCCGCCTGCTCTGG −3′, R: 5′-GCTCTAGATGGTCCAGGCTGGCTTCGT-3′) and subcloned into the Myc-pCMV vector (Clontech, 631,604). The Flag-PKM2 plasmid was purchased from OriGene Technologies (SC315792).
Cell Culture and Transfection
SGC7901, MGC803, and HEK293T cells were purchased from the Type Culture Collection of the Chinese Academy of Sciences (Shanghai, China). Cells were cultured in high-glucose DMEM with 10% FBS and 100 units/mL of penicillin/streptomycin, at 37 °C in an atmosphere containing 5% CO2 in an incubator. Cells were transfection by Lipofectamine 2000 (Thermo Fisher Scientific, 11,668,019) according to the instructions supplied therewith and harvested 48 h after transfection. 293T cells were used for lentivirus production and transfected with the shRNA-expression vector. The transfected 293T cell supernatant was collected at 24 h, 48 h, and 72 h. Thereafter, the specimens were subjected to centrifugation at 1500g for 30 min, the lentiviral particles were resuspended in PBS and added to the SGC7901 and MGC803 cells for 24 h to allow infection. Stably transfected cell lines were sifted for five days in 20 μg/mL puromycin. Specimens in the NC transfection group were treated at the same time as a positive control.
Western Blot Analysis
Cells were lysed with an IP lysis buffer (50 mM Tris–Cl at pH 7.4, 1% Triton X-100, 1% NP40, 150 mM NaCl, 1 mM EDTA, 0.25% sodium deoxycholate, and protease inhibitor cocktail) supplemented with protease and phosphatase inhibitor cocktails for 30 min on ice. Total protein was harvested by centrifugation at 15,000 rpm for 20 min at 4 °C. The protein concentration was measured by G250 analysis. 50 μg of tissue lysate was prepared for separation and blotting. Samples were loaded onto 10% polyacrylamide gels, separated by SDS-PAGE, and transferred to PVDF membranes for 2.5 h at 80 to 120 V. Membranes were incubated through prescribed antibodies (1:500–1000) at 4 °C overnight after being blocked by 5% BSA in TBST for 2 h at room temperature. After having been thrice-washed with TBST, membranes were incubated with secondary antibody for 2 h (at room temperature); bands were analyzed by chemiluminescence detection (Tanon Science & Technology Co., Ltd, Shanghai, China).
Co-Immunoprecipitation (Co-IP) Analysis
SGC7901 cells were dissolved with IP lysis and incubated with antibody for 2 h. Then protein A/G beads (Santa Cruz) were added and the specimen incubated on a mixer overnight at 4 °C. After centrifugation for 5 min at 700 g at 4 °C, we collected the beads the next day, and cleaned them in IP lysis solution three times (each time for 10 min). The beads were then resuspended with 2× SDS sample buffer for WB.
Glucose Consumption and Lactate Production Analysis
Cells were seeded in six-well culture plates. The medium was changed to a phenol-red-free DMEM medium after 6 h and harvested after 48 h. Glucose consumption was measured between the media before and after an incubation of 48 h by an assay kit (Sigma, GAHK20). Extracellular lactate levels were normalized to the protein concentration of the samples by using a lactate assay kit (Sigma, MAK065).
Cell Proliferation Assay
A Cell counting Kit-8 (CCK8) (Abbkine, KTA1020) was used to evaluate the cell proliferation ability. Cells were seeded into 96-well plates at a density of 5 × 10³ cells/well for 6 h, 24 h, 48 h, and 72 h. The culture medium was then replaced with 90 μL of basal DMEM and 10 μL CCK8. After incubation at 37 °C for 3 h, the absorbance was measured using an absorbance reader (TECAN, Switzerland) at 450 nm.
Transwell Migration Assay
SGC7901 or MGC803 cells (3 × 10⁴) were resuspended with serum-free DMEM medium and seeded into the upper chamber while 10%-FBS DMEM with added to the lower chambers (Corning, 3422). After incubation for 24 h, invasive cells on the underside were fixed in methanol for 10 min and stained with hematoxylin for 30 min at room temperature. An image was captured through an inverted microscope (Nikon Corp., Tokyo, Japan). Three independent experiments were performed, and five individual fields were counted each for statistical analysis.
In vivo Xenograft Tumor Growth
For the xenograft tumor growth assay, SGC7901 stable cell lines with PolG silencing were injected subcutaneously into the right flank of 6-week-old male BALB/C nude mice (N = 10). Sodium Butyrate (NaB) was intraperitoneally injected into mice in the PolG-silencing group (200 mg/kg) (N = 5). The NC group was used for comparative purposes (N = 5). Tumors were cultivated for 14 days. All animal experiments were approved by the Committee of China Medical University.
Statistical Analysis
Three independent experimental values were expressed as the mean ± standard deviation. Statistical significance was analyzed by using a t-test or a one-way analysis of variance. All statistical analysis was performed using SPSS 17.0 and Prism 5.0 software. Values of P < 0.05 were defined as statistically significant.
Results
GC Patients with Low PolG Expression Have Poorer Prognosis
GC samples with survival data and gene expression profiles were obtained from the GSE62254 dataset, as shown in Table 1. The sample characteristics of GSE62254 were consistent with randomized clinical studies of GC.14,15 The prognostic value of PolG was evaluated by KM analysis which showed that low expression of PolG was associated with poorer overall survival (OS, log-rank P < 0.001) as well as progression-free survival (PFS, log-rank P < 0.001) (Figure 1A). Furthermore, COX regression analysis indicated that PolG was an independent prognostic factor both in univariate (HR 0.611, 95% CI; 0.432–0.866; P = 0.006) and multivariate analyses (HR 0.679, 95% CI; 0.479–0.963; P = 0.03) (Table 2). An external validation analysis based on KM plotter showed a favorable prognosis of PolG in GC (log-rank P = 0.004) (Figure 1B). To further assess the predictive value of PolG in a prognostic model, a nomogram of OS that combined the significant prognostic factors identified from multivariate analysis was adopted (Figure 1C). The C-Index of OS prediction was 0.75 (95% CI, 0.71 to 0.79). The calibration curve was applied to reflect the probability of survival at 1 and 3 years, which indicated the consistency between the nomogram prediction and the objective observations (Figure 1D).
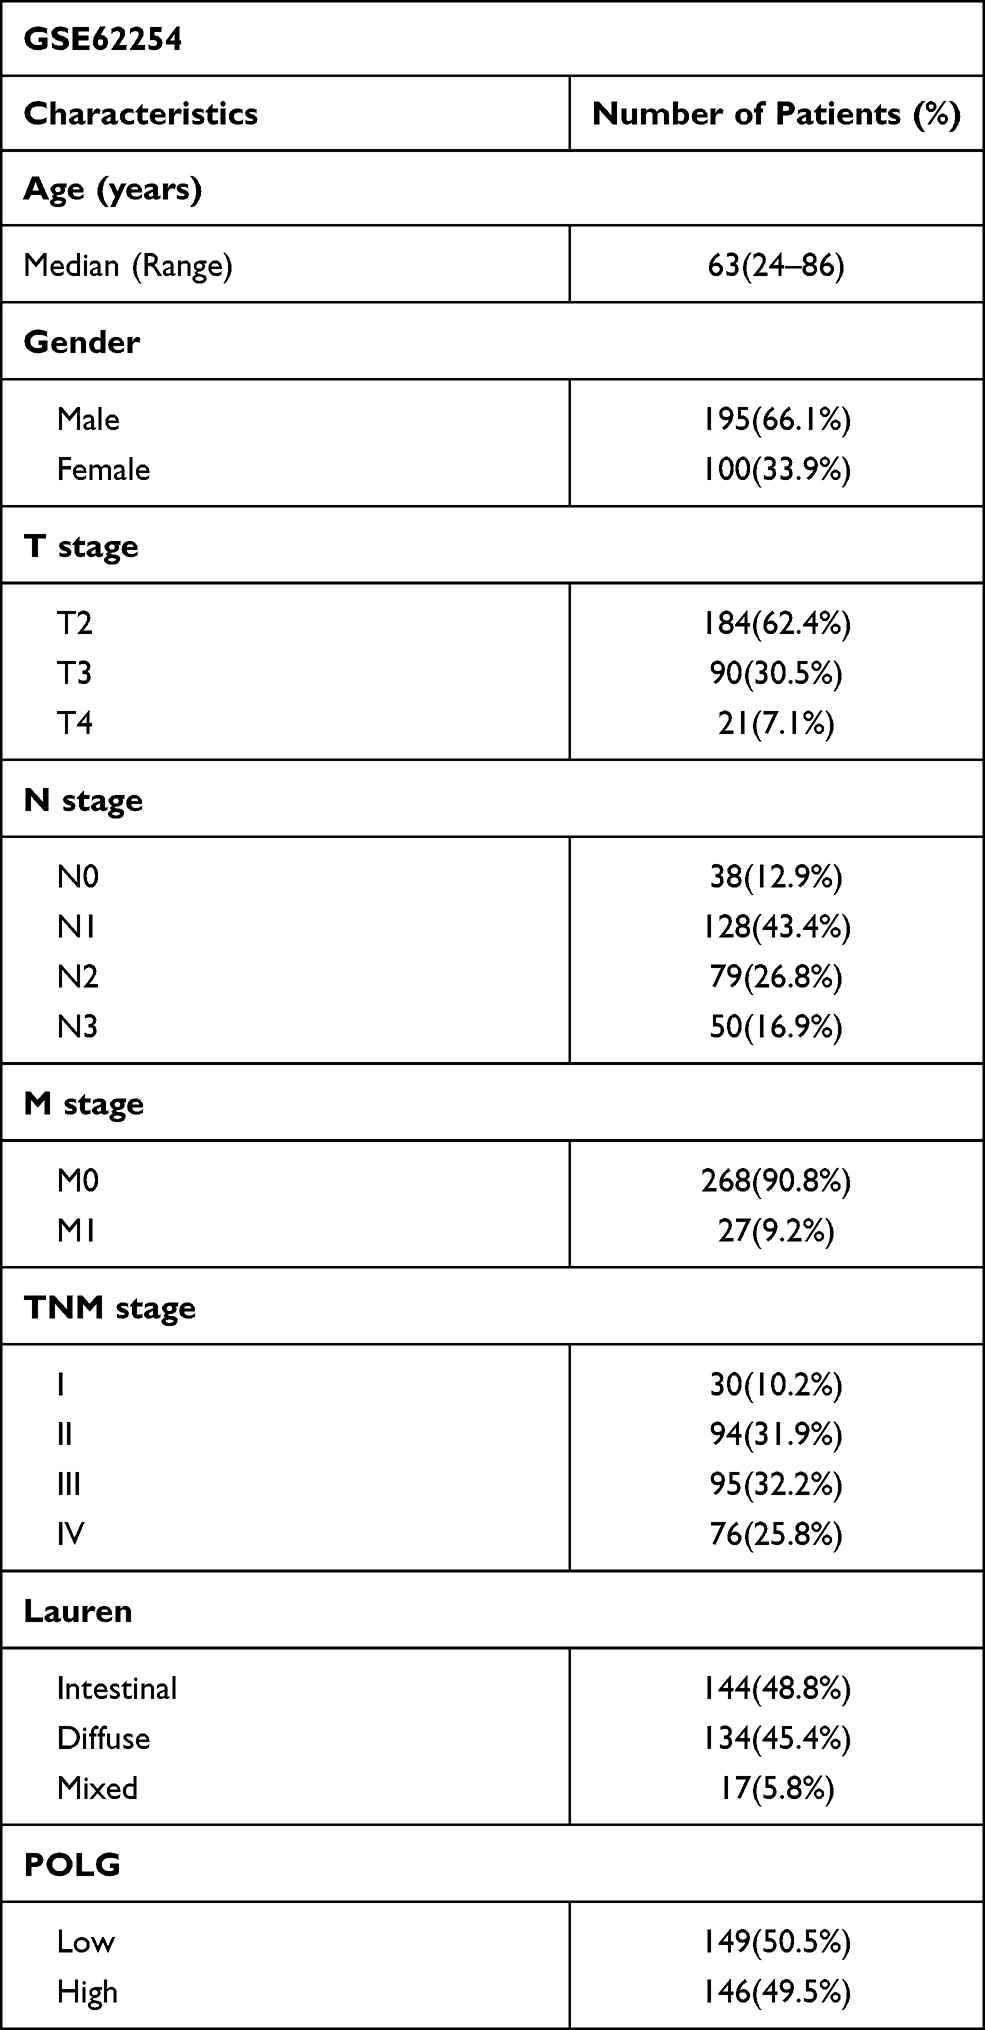 |
Table 1 Characteristics of GSE62254 and GSE29272 Cohort |
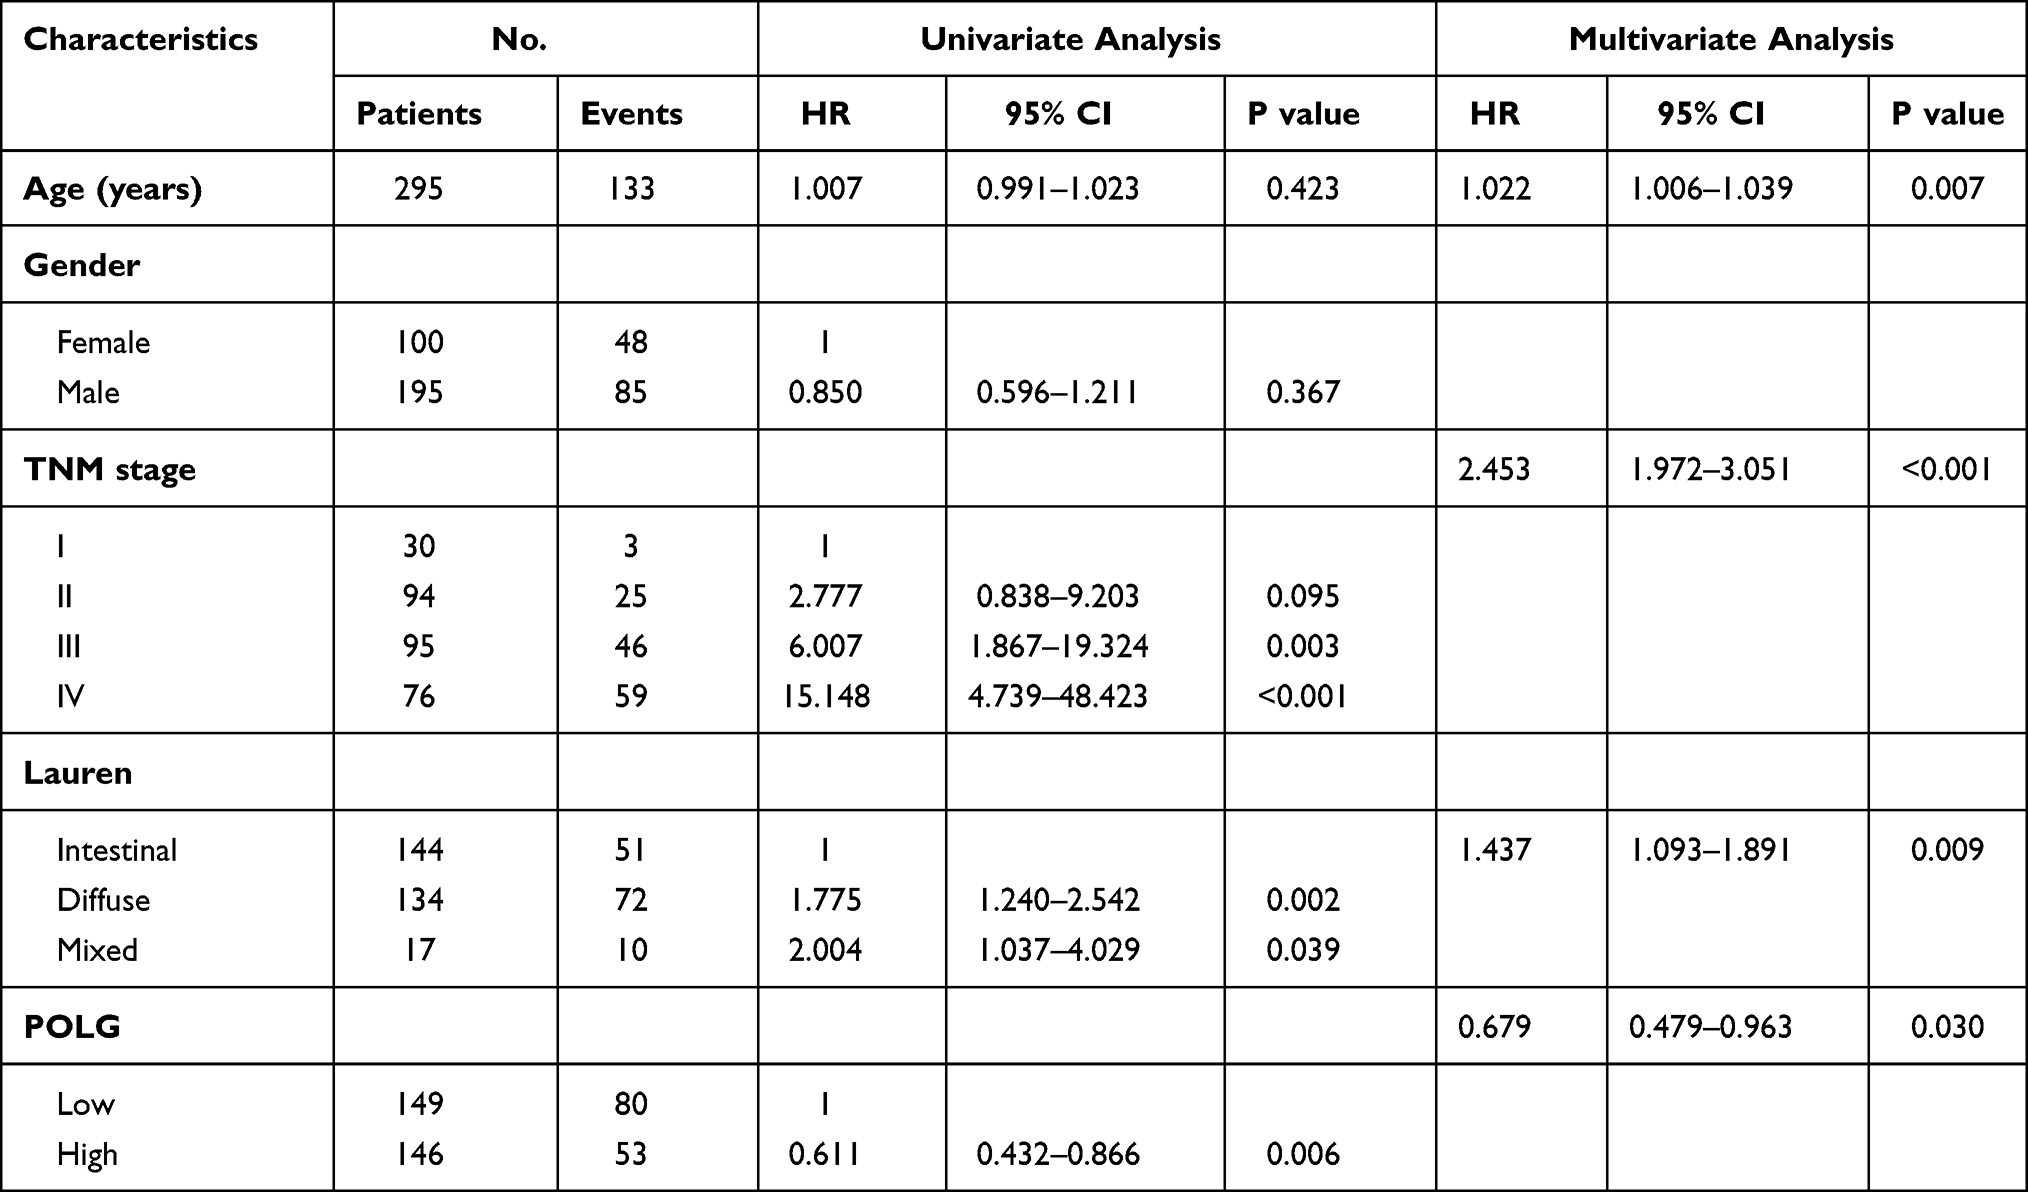 |
Table 2 Univariate and Multivariate Analysis of Overall Survival in GSE62254 by Cox Regression Model |
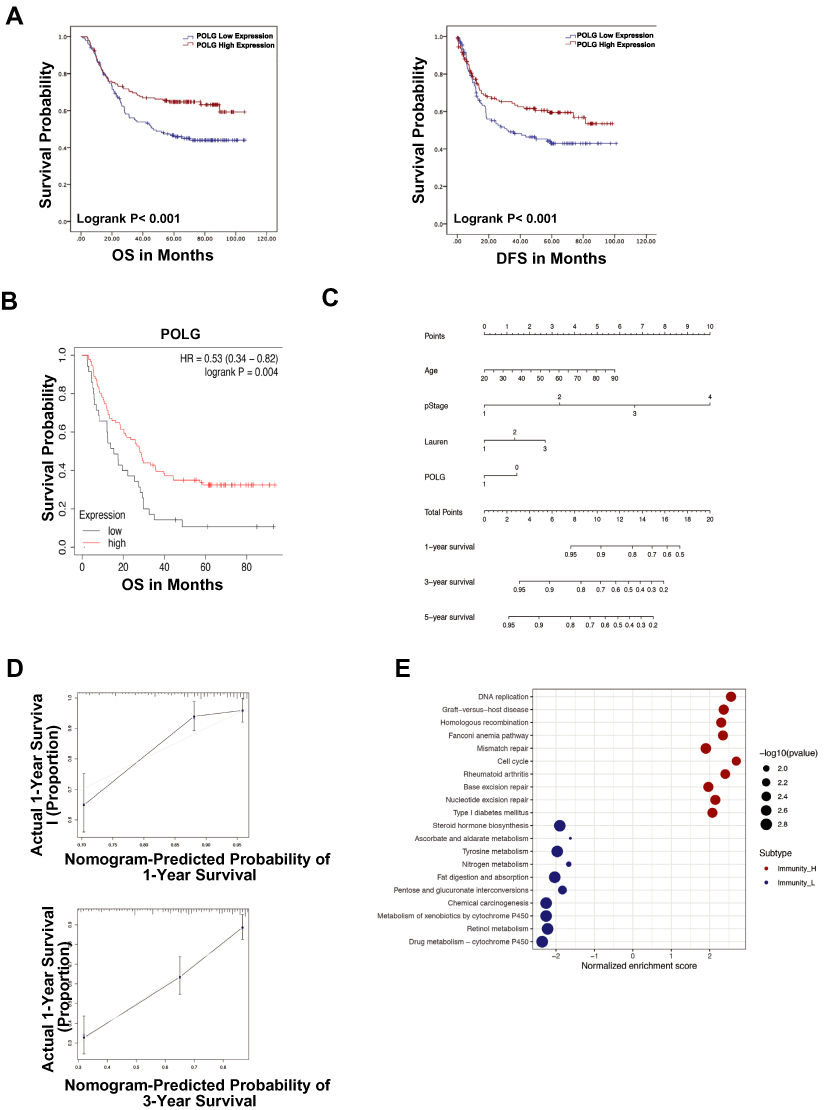 |
Figure 1 (A) Overall Survival (OS) and Progression-Free survival (PFS) of PolG in the GSE62254 cohort by Kaplan–Meier (KM) analysis. (B) External validation of OS of KM plotter cohort by KM analysis (log-rank P = 0.004). (C) The parameters of individual patients correspond to the axis of each variable to obtain the points displayed above the model. The sum of the point of a single variable is reflected in the total points on the axis. The probability of survival at 1 and 3 years was determined by correspondence between the total points and survival axis. (D) Probability of survival at 1 and 3 years in the GSE62254 GC cohort. (E) Gene set enrichment analysis of the biological processes associated with PolG expression. |
The potential molecular mechanisms of high PolG expression in GC subtypes were investigated by gene set enrichment analysis. The results showed that DNA replication and cell cycle were the most significantly enriched biological processes associated with PolG expression (Figure 1E). In contrast, cytochrome P450, chemical carcinogenesis and retinol metabolism were highly enriched in samples with low expression of PolG.
PolG-Silencing Promotes GC Cells Viability
To elaborate upon the association of PolG with survival in GC patients, SGC7901 and MGC803 cells were used to explore the potential molecular mechanisms of action therein. We evaluated the consequence of shRNA-mediated silencing of PolG in SGC7901 and MGC803 cells. As shown in Figure 2A, the proliferation of PolG-silencing SGC7901and MGC803 cells was increased by 55% and 25% as evinced by CCK-8 detection and assay, when compared to the NC group (P < 0.001). The migration abilities of GC cells were significantly increased as well in both PolG-silencing cell lines through Transwell analysis (P < 0.0001, Figure 2B).
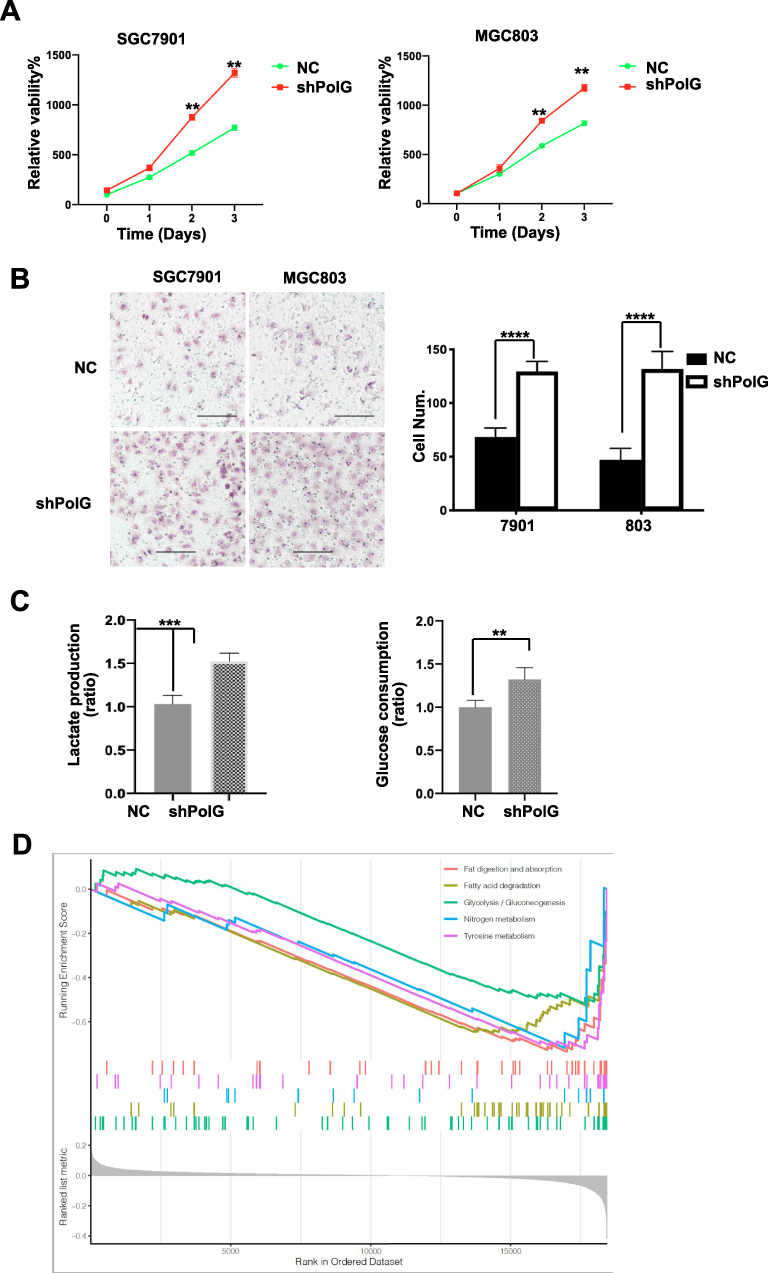 |
Figure 2 PolG silencing inhibits proliferation and migration of GC cells. The effect of PolG silencing by shRNA or negative control (NC) in SGC7901and MGC803 cells. (A) Proliferation was performed by cell counting Kit-8. (B) Migration abilities were determined by the Transwell assay, scale bar = 100 μm. (C) Lactate production and glucose consumption were elevated in PolG-silencing group. (D) KEGG enrichment analysis by GSEA in the low PolG expression group. All quantifications are shown as the mean ± S.E.M. for n ≥ 3 technical replicates and are representative of three independent experiments, ****P < 0.0001, ***P < 0.001, **P < 0.01. |
To investigate the potential causes of these phenomena, we examined the rates of lactate production and glucose consumption of each cell line. The results showed that the decrease of PolG expression in GC cells increased both lactate production and glucose consumption (P < 0.001, Figure 2C). These data suggested that silencing of PolG increased the basal glycolytic rate of, and Warburg effect in tumor cells. Furthermore, KEGG enrichment analysis by GSEA indicated that metabolism-related pathways were highly enriched in the group with low PolG expression (Figure 2D), which may be related to PolG effects on the tumor metabolic key kinase activity.
PolG Inhibits Tumor Glycolysis by Interactions with PKM2
To explore the mechanism of PolG on GC glycolysis, we detected some of the key molecules related to GC glycolysis. PKM2 is a main regulator for glycolysis, and PKM2-Tyr105 phosphorylation leads to a reduction in kinase activity which can promote the Warburg effect.16 Western blot (WB) assay indicated that PKM2-Tyr105 increased significantly after PolG silencing (P < 0.01, Figure 3A). We then analyzed the potential interactions of PolG with PKM2. Endogenous PolG interacted with endogenous PKM2 in SGC7901 cells (Figure 3B and C). Similarly, Myc-tagged PolG was co-immunoprecipitated with Flag-tagged PKM2 in 293T cells (Figure 3D and E).
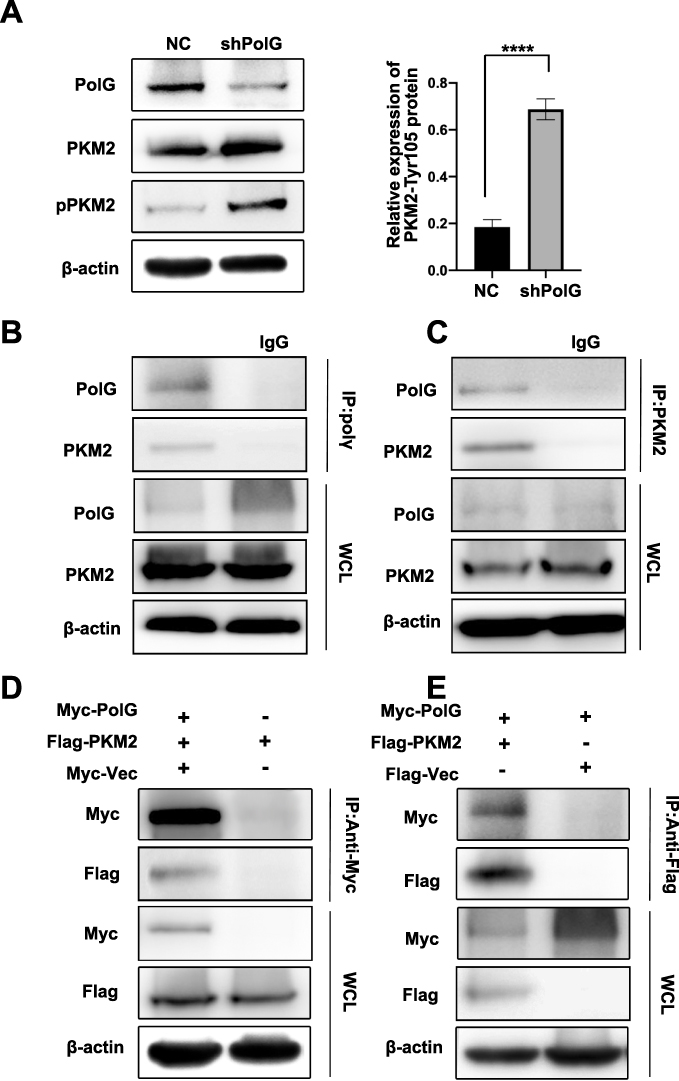 |
Figure 3 PolG inhibits PKM2 phosphorylation by interactions with PKM2. (A) Western blot (WB) analysis of the total and Tyr105 phosphorylation of PKM2 in stable PolG-silencing SGC7901 cells. Quantification of protein expression (Tyr105 phosphorylation of PKM2) is shown in (A) normalized to β-actin. Data are shown as the mean ± S.E.M. of n ≥ 3 technical replicates and are representative of three independent experiments, ****P < 0.0001. (B, C) Co-immunoprecipitation (Co-IP) of endogenous PolG with PKM2 in SGC7901 cells is illustrated. Cell lysates were subjected to Co-IP using anti-PKM2 (rabbit) or anti-PolG(mouse) and unrelated rabbit (or mouse) IgG as a control. Precipitates were subjected to WB analysis with anti-PolG or anti-PKM2. A portion of the whole-cell lysates (WCLs) of the input for Co-IP were subjected to IB analysis. (D, E) SGC7901 cells were co-transfected with expression plasmids encoding Myc-tag or Myc-tagged PolG, and Flag-tagged PKM2 as indicated. Cells were lysed and subjected to Co-IP with an anti-Myc (or anti-Flag) antibody. The resulting precipitates were subjected to WB analysis with anti-Flag (or anti-Myc) antibody. A portion of the WCLs of the input for Co-IP were also subjected to IB analysis. |
Based on these results, we hypothesized that the observed changes in cellular metabolism caused by PolG silencing were due to interactions with PKM2, which interfered with the phosphorylation of PKM2-Tyr105.
PolG Affect GC Viability by Inhibiting PKM2 Phosphorylation
As PolG can interact with PKM2 to inhibit the glycolytic ability of tumor cells and affect GC viability. To further investigate its effect on PKM2-Tyr105 phosphorylation to assess its potential to be used in clinical GC treatment, we compared PolG-silencing with NaB, which can promote PKM2 dephosphorylation and tetramerization, thereby inhibiting the Warburg effect in cancer cells.17
In the preliminary experiment, we treated the SGC7901 cells with different concentrations of NaB (0–10 mM) for 24 h, and found that after the concentration was increased to 5 mM, the suppression of tumor cells entered a plateau phase, so we chose 5 mM as the final stimulation concentration (Figure 4A) in subsequent analyses.
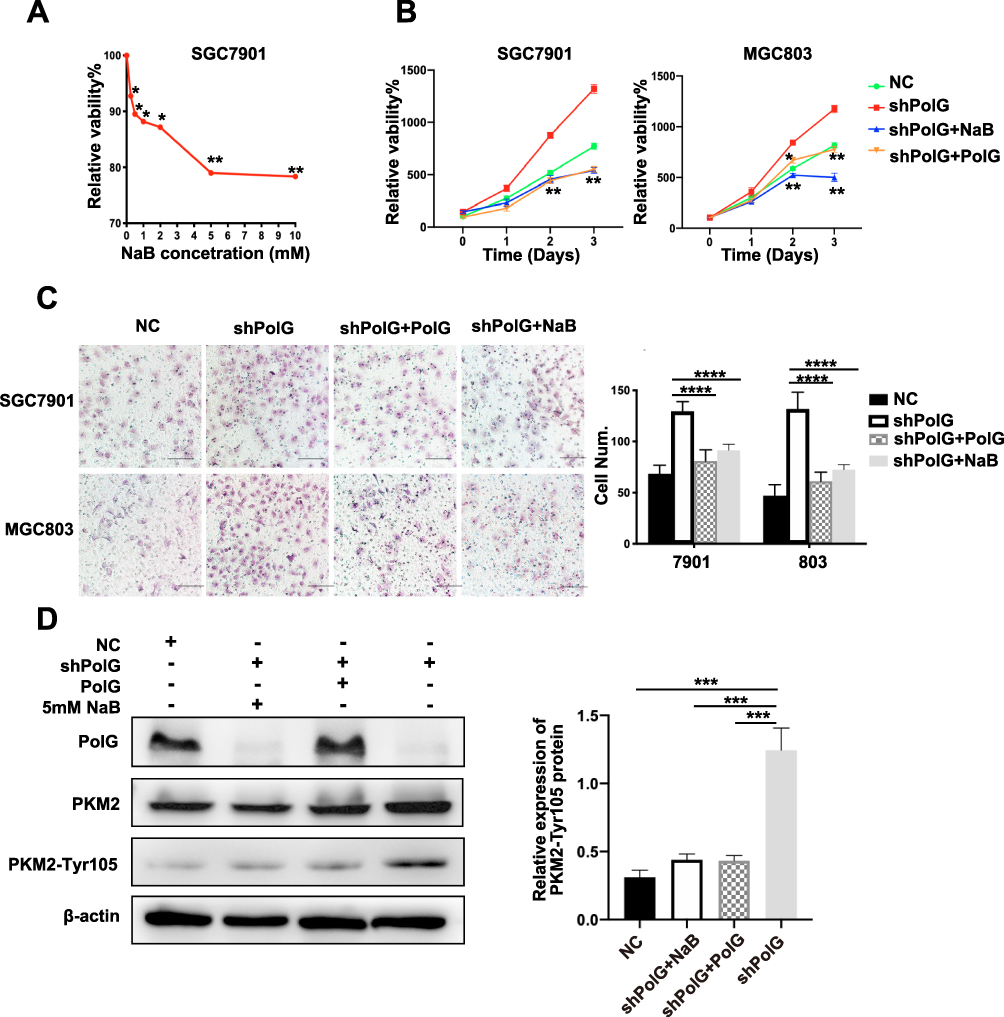 |
Figure 4 Replenishment of PolG and PKM2 inhibitors can suppress tumor proliferation in PolG-silencing cells. (A) SGC7901 cells were treated with different concentrations of butyrate (0 to 10 mM) for 24 h and the number of viable cells in response to the treatment was determined by CCK-8 cell viability assay (n = 5). (B) Proliferation was determined using a CCK-8, Myc-PolG and NaB were respectively compared with the silencing group. (C) Transwell assays and quantification of migration ability in SGC7901 and MGC803 cells were undertaken, scale bar = 100 μm. (D) WB analysis of total and Tyr105 phosphorylation of PKM2 expressing in SGC7901 cells transfected with shRNA and treated with myc-PolG or NaB. Quantification of protein expression is demonstrated in (D) normalized to β-actin. All quantifications are shown as the mean ± S.E.M. of n ≥ 3 technical replicates and are representative of three independent experiments, ****P < 0.0001, ***P < 0.001, **P < 0.01, *P < 0.05. |
We then selectively performed PolG supplementation, as well as adding NaB (5 mM) to the PolG-silencing cell lines. The cell proliferation assay (using a CCK8 kit) showed that cell viability in the PolG supplementation group (shPolG+Polg) was significantly reduced when compared with the PolG-silencing group (shPolG) which was similar to the effect on the NaB (shPolG+NaB) group. Both PolG supplementation and NaB can induce tumor proliferation in normal level (NC) specimens (Figure 4B). The cell migration test (Transwell) data in Figure 4C showed the same results. In addition, WB for PKM2-Tyr105 exhibited significantly decreased levels in the PolG supplementation and NaB groups (Figure 4D). These results confirm that by interacting with PKM2, PolG can cause dephosphorylation in a manner similar to NaB, thereby inhibiting tumor growth. PolG may be a potential key factor in clinical GC treatment.
PolG Silencing Promotes GC Cell Growth in vivo
To explore the effects of PolG on GC cell growth in vivo, we injected the stable PolG-silencing SGC7901 cell line (shPolG) and NC SGC7901 cell line (NC) into nude mice. NaB (200 mg/kg) was intraperitoneally injected into mice in half of the PolG-silencing group (shPolG+NaB) for comparative observation.18 The tumor size in specimens in the shPolG group was larger than that in the NC group, and tumor growth in those in the shPolG+NaB group was suppressed (Figure 5A). Furthermore, compared with the NC and shPOlG+NaB groups, the shPolG group had larger tumor masses (P < 0.001, Figure 5B and C). These data indicated that PolG can interfere with GC cell growth in vivo.
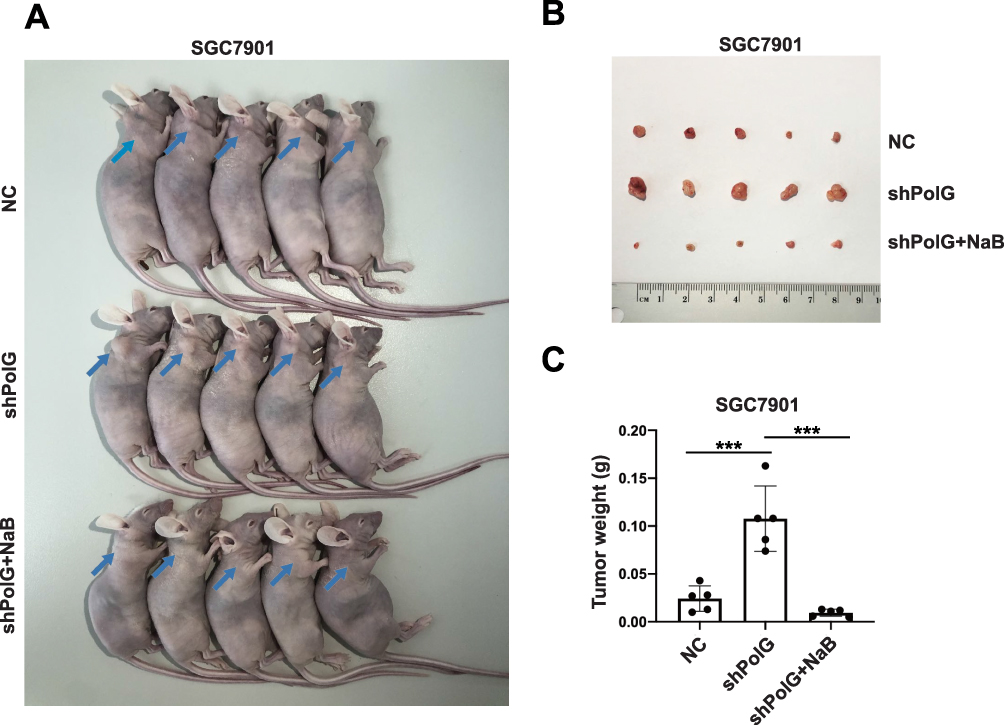 |
Figure 5 SGC7901 xenografts treated with stable silencing of PolG or with simultaneous intraperitoneal injection of NaB. (A) Mice were sacrificed and photographed on day 14. The blue arrow indicates tumor growth sites after xenografting. (B) PolG silencing promoted xenograft tumor growth. At 14 days after injection, tumors were removed and photographed. (C) The tumor weight was calculated on day 14. Data are presented as the mean ± SD (n = 5), ***P < 0.001 versus control. |
Discussion
Through on-line GC data analysis, we found that GC patients with low PolG expression have poorer OS and PFS, but the molecular mechanism remains unclear. PolG silencing in GC cells in vitro, showed increased proliferation and migration capabilities compared to control cells. KEGG enrichment analysis of GSEA suggested that these phenomena are closely related to the effect of PolG on the reprogramming of tumor cell metabolism.
In previous studies, it was shown that PolG is a mitochondrial DNA polymerase, which plays an important role in maintaining the stability of mitochondrial DNA. The abnormality of PolG could directly affect the function of the respiratory chain which is composed of proteins synthesized by transcription of mitochondrial DNA and downstream signal modulation of cellular metabolism.19–21 It has also been reported that PolG promotes metabolic reprogramming in various types of tumor cells by affecting mitochondrial function in tumor cells.11–13 Although more than 90% of the cellular ATP is produced by mitochondria in normal differentiated cells, tumor cells undergo the Warburg effect by relying on aerobic glycolysis as their primary energy source. Metabolic reprogramming is an important feature during tumorigenesis and development. Glycolysis is an insufficient means of ATP production that allows tumor cells to uptake more nutrients, and synthesizes organic molecules to support their proliferation and invasion.22,23
In this study, for the first time we confirmed the molecular interaction between PolG and the glycolysis of GC cells. This mechanism is closely related to the inhibition of phosphorylation at PKM2-Tyr105. Recently, research has shown that PKM2 is up-regulated in tumor cells, and that PKM2-Tyr105-site phosphorylation can prevent its tetramer formation which directly impacts the kinase activity of PKM2 and enhances the Warburg effect.16,24,25 In the current study, both glucose consumption and lactate production were increased in PolG-silencing GC cells. We revealed the molecular mechanism through which PolG can interact with PKM2 and affect the phosphorylation of PKM2-Tyr105. In addition, we performed PolG replenishment for PolG-silencing GC cells and experiments using PKM2 inhibitors (NaB). These experiments showed reduced proliferation and migration abilities. These data confirmed that PolG can suppress the energy metabolism of tumor cells by inhibiting PKM2 phosphorylation, further validating PolG as a potential therapeutic target.
However, our study did not include a comprehensive investigation on the specific mechanism through which PolG affects phosphorylation of Tyr105 after binding to PKM2. We also did not determine the balance between the effect of PolG on PKM2 and the specific effects on mitochondrial function. In future studies, we will continue to elucidate the potential role of PolG in GC.
Conclusion
The present study indicated that PolG is an independent factor in the treatment of GC. PolG can interact with PKM2 and affects the activation of Tyr105-site phosphorylation, then can suppress the energy metabolism of GC cells, finally interfering with GC cell viability both in vivo and in vitro. PolG may be a potential therapeutic target for GC treatment.
Abbreviation
GC, gastric cancer; PolG, DNA polymerase gamma; PKM2, pyruvate kinase M2; VEGF, vascular endothelial growth factor; ICIs, immune checkpoint inhibitors; KM, Kaplan–Meier method; OS, overall survival; PFS, progression-free survival; CCK-8, Cell Counting Kit-8.
Ethics Approval and Informed Consent
All animal experiments were approved by the Committee of China Medical University (IACUC Issue No. CMU2020166).
Consent for Publication
Written informed consent for publication was obtained from all participants.
Author Contributions
All authors made substantial contributions to conception and design, acquisition of data, or analysis and interpretation of data; took part in drafting the article or its revision and agreed to its submission to this journal; all authors gave their final approval of the version to be published; and agree to be accountable for all aspects of the work.
Funding
This study is supported by The National Natural Science Foundation of China (Grant No. 51872332), The Natural Science Foundation of Liaoning Province (Grant No. 20170541040), and the China Medical University Youth Support Program (Grant No. 111/1210519020).
Disclosure
The authors report no conflicts of interest in this work.
References
1. Bray F, Ferlay J, Soerjomataram I, Siegel RL, Torre LA, Jemal A. Global cancer statistics 2018: GLOBOCAN estimates of incidence and mortality worldwide for 36 cancers in 185 countries. CA Cancer J Clin. 2018;68(6):394–424. doi:10.3322/caac.21492
2. Mullen JT, Ryan DP. Neoadjuvant chemotherapy for gastric cancer: what are we trying to accomplish? Ann Surg Oncol. 2014;21(1):13–15. doi:10.1245/s10434-013-3250-9
3. Arai H, Nakajima TE. Recent developments of systemic chemotherapy for gastric cancer. Cancers (Basel). 2020;12(5):1100. doi:10.3390/cancers12051100
4. Ciccarone F, Vegliante R, Di Leo L, Ciriolo MR. The TCA cycle as a bridge between oncometabolism and DNA transactions in cancer. Semin Cancer Biol. 2017;47:50–56. doi:10.1016/j.semcancer.2017.06.008
5. Warburg O. On the origin of cancer cells. Science. 1956;123(3191):309–314. doi:10.1126/science.123.3191.309
6. Soga T. Cancer metabolism: key players in metabolic reprogramming. Cancer Sci. 2013;104(3):275–281. doi:10.1111/cas.12085
7. Trifunovic A, Wredenberg A, Falkenberg M, et al. Premature ageing in mice expressing defective mitochondrial DNA polymerase. Nature. 2004;429(6990):417–423. doi:10.1038/nature02517
8. Kujoth GC, Hiona A, Pugh TD, et al. Mitochondrial DNA mutations, oxidative stress, and apoptosis in mammalian aging. Science. 2005;309(5733):481–484. doi:10.1126/science.1112125
9. Bibb MJ, Van Etten RA, Wright CT, Walberg MW, Clayton DA. Sequence and gene organization of mouse mitochondrial DNA. Cell. 1981;26(2):167–180. doi:10.1016/0092-8674(81)90300-7
10. Maiuri AR, Li H, Stein BD, Tennessen JM, O’Hagan HM. Inflammation-induced DNA methylation of DNA polymerase gamma alters the metabolic profile of colon tumors. Cancer Metab. 2018;6(1):9. doi:10.1186/s40170-018-0182-7
11. Tervasmäki A, Mantere T, Hartikainen JM, et al. Rare missense mutations in RECQL and POLG associate with inherited predisposition to breast cancer. Int J Cancer. 2018;142(11):2286–2292. doi:10.1002/ijc.31259
12. Wang LC, Du X, Li Z, et al. Curcumin suppresses gastric tumor cell growth via ROS-mediated DNA polymerase gamma depletion disrupting cellular bioenergetics. J Exp Clin Cancer Res. 2017;36(1):47. doi:10.1186/s13046-017-0513-5
13. Xie C, Jin J, Bao X, et al. Inhibition of mitochondrial glutaminase activity reverses acquired erlotinib resistance in non-small cell lung cancer. Oncotarget. 2016;7(1):610–621. doi:10.18632/oncotarget.6311
14. Bang Y-J, Kim Y-W, Yang H-K, et al. Adjuvant capecitabine and oxaliplatin for gastric cancer after D2 gastrectomy (CLASSIC): a Phase 3 open-label, randomised controlled trial. Lancet. 2012;379(9813):315–321. doi:10.1016/S0140-6736(11)61873-4
15. Sakuramoto S, Sasako M, Yamaguchi T, et al. Adjuvant chemotherapy for gastric cancer with S-1, an oral fluoropyrimidine. N Engl J Med. 2007;357(18):1810–1820. doi:10.1056/NEJMoa072252
16. Hitosugi T, Kang S, Vander Heiden MG, et al. Tyrosine phosphorylation inhibits PKM2 to promote the warburg effect and tumor growth. Sci Signal. 2009;2(97):ra73. doi:10.1126/scisignal.2000431
17. Li QC, Cao L, Tian Y, et al. Butyrate suppresses the proliferation of colorectal cancer cells via targeting pyruvate kinase M2 and metabolic reprogramming. Mol Cell Proteomics. 2018;17(8):1531–1545. doi:10.1074/mcp.RA118.000752
18. Andrade-Oliveira V, Amano MT, Correa-Costa M, et al. Gut bacteria products prevent AKI induced by ischemia-reperfusion. J Am Soc Nephrol. 2015;26(8):1877–1888. doi:10.1681/ASN.2014030288
19. Kotrys AV, Szczesny RJ. Mitochondrial gene expression and beyond-novel aspects of cellular physiology. Cells. 2019;9(1):17. doi:10.3390/cells9010017
20. Barchiesi A, Vascotto C. Transcription, processing, and decay of mitochondrial RNA in health and disease. Int J Mol Sci. 2019;20(9):2221. doi:10.3390/ijms20092221
21. Wiley CD, Velarde MC, Lecot P, et al. Mitochondrial dysfunction induces senescence with a distinct secretory phenotype. Cell Metab. 2016;23(2):303–314. doi:10.1016/j.cmet.2015.11.011
22. Vander Heiden MG, Cantley LC, Thompson CB. Understanding the warburg effect: the metabolic requirements of cell proliferation. Science. 2009;324:1029–1033. doi:10.1126/science.1160809
23. Wallace DC. Mitochondria and cancer. Nat Rev Cancer. 2012;12(10):685–698. doi:10.1038/nrc3365
24. Lu Z, Hunter T. Metabolic kinases moonlighting as protein kinases. Trends Biochem Sci. 2018;43(4):301–310. doi:10.1016/j.tibs.2018.01.006
25. Dell’ Antone P. Energy metabolism in cancer cells: how to explain the warburg and crabtree effects? Med Hypotheses. 2012;79(3):388–392. doi:10.1016/j.mehy.2012.06.002
 © 2021 The Author(s). This work is published and licensed by Dove Medical Press Limited. The full terms of this license are available at https://www.dovepress.com/terms.php and incorporate the Creative Commons Attribution - Non Commercial (unported, v3.0) License.
By accessing the work you hereby accept the Terms. Non-commercial uses of the work are permitted without any further permission from Dove Medical Press Limited, provided the work is properly attributed. For permission for commercial use of this work, please see paragraphs 4.2 and 5 of our Terms.
© 2021 The Author(s). This work is published and licensed by Dove Medical Press Limited. The full terms of this license are available at https://www.dovepress.com/terms.php and incorporate the Creative Commons Attribution - Non Commercial (unported, v3.0) License.
By accessing the work you hereby accept the Terms. Non-commercial uses of the work are permitted without any further permission from Dove Medical Press Limited, provided the work is properly attributed. For permission for commercial use of this work, please see paragraphs 4.2 and 5 of our Terms.