")
Back to Journals » International Journal of General Medicine » Volume 15
Poincaré Plot Can Be a Useful Tool to Select Potential Responders to Metoprolol Therapy in Children with Vasovagal Syncope
Authors Yuan P, Li X, Tao C, Du X, Zhang C, Du J, Huang Y, Liao Y
Received 7 December 2021
Accepted for publication 11 February 2022
Published 8 March 2022 Volume 2022:15 Pages 2681—2693
DOI https://doi.org/10.2147/IJGM.S352928
Checked for plagiarism Yes
Review by Single anonymous peer review
Peer reviewer comments 2
Editor who approved publication: Dr Scott Fraser
Piaoliu Yuan,1 Xueying Li,2 Chunyan Tao,1 Xiaojuan Du,1 Chunyu Zhang,1 Junbao Du,1,3 Yaqian Huang,1 Ying Liao1
1Department of Pediatrics, Peking University First Hospital, Beijing, People’s Republic of China; 2Department of Medical Statistics, Peking University First Hospital, Beijing, People’s Republic of China; 3Key Laboratory of Molecular Cardiovascular Sciences, Ministry of Education, Beijing, People’s Republic of China
Correspondence: Ying Liao; Yaqian Huang, Department of Pediatrics, Peking University First Hospital, Xi-An Men Street No. 1, West District, Beijing, 100034, People’s Republic of China, Tel +8610-83573238 ; +8610-83575807, Fax +8610-66530532, Email [email protected]; [email protected]
Purpose: To explore the value of the longitudinal axis/transverse axis ratio (L/T) of Poincaré plot in selecting children with vasovagal syncope (VVS) who were suitable for metoprolol therapy.
Patients and Methods: Children with VVS hospitalized in Peking University First Hospital between January 2012 and June 2019 and treated with metoprolol were retrospectively included as the training set, and children with VVS hospitalized between July 2019 and December 2020 were included as the validation set. The sex, age at admission, height, weight, body mass index, course of disease, syncope symptom score before metoprolol treatment, treatment duration, supine heart rate (HR), supine systolic pressure, supine diastolic pressure, peak HR during the head-up tilt test (HUTT), changes of HR during HUTT, hemodynamic response during HUTT, left ventricular ejection fraction, left ventricular fractional shortening and the L/T of Poincaré plot were compared between responders and nonresponders in the training set. Logistic regression analysis was conducted to explore predictors. Receiver operating characteristic curve was utilized to determine the value of the predictors for selecting potential responders. Finally, the value of the predictors was further verified.
Results: In the training set including 105 children, the L/T in responders was distinctly higher than that in nonresponders (P < 0.001), and there was no apparent difference between the two groups in other indexes. The L/T was statistically related to the efficacy of metoprolol (P < 0.001). The L/T > 2.7 yielded a sensitivity of 88.2% and a specificity of 82.8% for indicating responders to metoprolol. Taking L/T > 2.7 to select potential responders in another 43 children with VVS in the validation set, the sensitivity was 96.6%, specificity 71.4%, and accuracy 88.4%.
Conclusion: The L/T of Poincaré plot > 2.7 can be a useful tool to select potential responders to metoprolol therapy in children with VVS.
Keywords: Poincaré plot, metoprolol, vasovagal syncope, children, Holter
Introduction
Syncope which accounts for 1%−2% of emergency visits is common in children.1,2 Vasovagal syncope (VVS) is the leading cause of syncope in children, constituting 75%−80% of the causes of pediatric syncope.3,4 VVS refers to a syndrome in which various stimuli, mediated by vagal reflex, dilate the peripheral vascular bed in muscles and viscera and slow the heart rate (HR), leading to the drop of blood pressure (BP), sudden bradycardia and subsequent cerebral hypoperfusion.5 The patients present with temporary loss of consciousness in specific situations, such as long-term standing and emotional stress, and can recover spontaneously in a short time without signs indicating abnormalities in nervous system.5 Children with VVS may suffer from accidental injuries caused by syncope episodes.6,7 In addition, recurrent syncope and the anxiety about the recurrence prevent some children from going to school and participating in daily activities, which seriously affects the physical and mental health of the children.1,8 Therefore, appropriate and effective management for children with VVS is an essential issue to be concerned. However, a recent meta-analysis of previous randomized controlled trials (RCTs) has shown that non-drug therapies (health education, trigger avoidance, and increased salt and water intake, etc) could only work in less than 60% of the patients with VVS.9 Drug therapies are recommended by the guidelines for patients with VVS who have failed to respond to non-drug therapies.1,10 Although the mechanisms underlying VVS have not yet been fully elucidated, excessive sympathetic activity is thought to play an important role in some cases, providing a rationale for the treatment of VVS with beta-blockers.11–16 Some studies have shown that beta-blockers can be effective for VVS.17–24 Therefore, beta-blockers (such as metoprolol) are mentioned for VVS in current guidelines for pediatric/adult syncope.1,10,25 However, of note, not all patients with VVS responded to metoprolol therapy and the previous studies showed response rates of only about 50−77% with empirical use of metoprolol.19,21,23,26,27 The poor efficacy of the unselected use (instead of target therapy) of metoprolol may be due to the complexity and diversity of the pathogenesis of VVS.28 The classic pathogenesis of VVS includes Bezold-Jarisch reflex, abnormal autonomic nervous activities (enhanced or weakened), insufficient circulating blood volume, excessive vasodilation.29–31 Metoprolol, which acts as a beta1-selective adrenoreceptor blocker and counteracts sympathetic overactivation, is presumed to be effective especially in the children with enhanced sympathetic activity and/or high catecholamine status.29,32,33 Therefore, in clinical practice, it is urgent to identify the patients with enhanced sympathetic activity simply and then to achieve individualized treatment with metoprolol for pediatric VVS.
To accurately identify the children with VVS who were suitable for beta-blockers therapy, several studies were conducted to find the biomarkers. Previous studies showed that the changes of HR during the head-up tilt test (HUTT),34 baseline left ventricular ejection fraction (LVEF) and left ventricular fractional shortening (LVFS)29 were of predictive value for the efficacy of metoprolol in the treatment of pediatric VVS. However, the HR of children during HUTT can be affected by many factors during the limited 45 minutes, while the values of LVEF and LVFS may fluctuate not only due to the different states of preload, afterload, and myocardial contractility of the patients, but also due to the different experience and operative techniques of the ultrasound operators. Consequently, the predictive accuracy of the above indicators may be affected. Therefore, it is necessary to explore more stable and targeted indicators that reflect sympathetic activity to help to select patients with VVS who are suitable for metoprolol therapy.
Poincaré plot, also known as Lorenz-RR scatterplot, is a “visible graph” for the cardiac rhythm converted from the long-term (usually 24 hours) electrocardiogram (ECG) monitoring data. It is a set of points marking the positions of all adjacent RR intervals (ie, time between heartbeats) on a rectangular coordinate system and intuitively reflects the distribution of adjacent RR intervals during a whole day. Studies have shown that the graph of Poincaré plot can be used to assess autonomic nervous activity.35,36 The longitudinal axis (L, also known as length) of Poincaré plot represents the overall variability of the 24-hour HR; and the transverse axis (T, also known as width) of Poincaré plot represents the difference between adjacent RR intervals, indicating the change of instantaneous HR (Figure 1).36–38 Studies have shown that longitudinal axis/transverse axis ratio (L/T) is an indicator of cardiac sympathetic activity, known as cardiac sympathetic index,39 and it can provide a comprehensive assessment of autonomic nervous functions since it integrates the 24-hour ECG data as a whole.36–39 Therefore, the L/T of Poincaré plot is supposed to be a stable, visual, non-invasive, and easy-to-apply predictor for the efficacy of metoprolol therapy for pediatric VVS. Thus, this study intended to explore the value of the L/T of Poincaré plot as an indicator for selecting potential responders to metoprolol therapy for pediatric VVS.
Patients and Methods
Participants
Children admitted to the Pediatric Syncope Center, Peking University First Hospital between January 2012 and December 2020, diagnosed with VVS and treated with oral metoprolol were retrospectively included as the study participants, among whom the patients hospitalized between January 2012 and June 2019 were included in a training set, while the patients hospitalized between July 2019 and December 2020 were included in a validation set.
We included the patients diagnosed with VVS and treated with oral metoprolol for at least 1 month in the Pediatric Syncope Center, Peking University First Hospital between January 2012 and December 2020.
We excluded the patients who had no episodes of syncope within 3 months before admission; those who combined diagnosis of other diseases affecting autonomic nervous activities or the shape of Poincaré plot, such as peripheral neuropathy, thyroid dysfunction, diabetes, premature contraction, infection, hypertension, or anemia; those who were receiving pharmacological interventions other than metoprolol for VVS (such as midodrine hydrochloride) or other treatments affecting autonomic nervous activities; those who showed poor treatment compliance or irregular medication; and those who had incomplete data or poor quality of Poincaré plot.
The data we collected included demographic data [sex, age at admission, height, weight, and body mass index (BMI)], case history [course of disease, syncope symptom score before metoprolol treatment (ie, baseline syncope symptom score), and treatment duration], hemodynamic data (supine HR, supine systolic pressure, supine diastolic pressure, peak HR during HUTT, changes of HR during HUTT and hemodynamic response during HUTT), echocardiogram data (LVEF and LVFS) and the L/T of Poincaré plot.
The present study was performed according to the Declaration of Helsinki and approved by the Ethics Committee of Peking University First Hospital (2021 [150]). As the study design was retrospective, the verbal consent was obtained from the legal guardians of the participants by a professional investigator over the telephone before the study, and the verbal consent protocol was approved by the Ethics Committee of Peking University First Hospital (2021 [150]).
Diagnosis of VVS
The diagnosis of VVS referred to the guidelines for the diagnosis of syncope made by European Society of Cardiology (ESC) in 2018, in which VVS was defined as syncope caused by pain, fear, or standing typically with progressive prodrome (pallor, sweating, and/or nausea).10 The diagnosis for patients with typical manifestations was made primarily in view of a comprehensive history evaluation, physical examination as well as necessary investigations (eg, electrocardiogram). For those with atypical triggers, prodromes or presentations, the diagnosis of VVS was made by at least two experts when other causes of syncope were excluded and symptoms were reproduced during the HUTT.10,40
HUTT and the Hemodynamic Response During HUTT
All the patients were required to stop taking any vasoactive drugs for at least 5 half-life periods and fast for at least 4 hours before the HUTT. A quiet, warm, dimly lit examination environment equipped with first aid medicines and equipment was prepared. The children rested quietly on the examination bed (HUT-821, Juchi, China) for about 10 minutes, and their HR, BP, and ECG data were continuously monitored. After the above parameters were stable, the children then stood passively on a 60° inclined bed until a positive response occurred or the 45-minute test was completed. The standards for a positive response of VVS during the HUTT were syncope or presyncope accompanied by at least one of the following: 1) the systolic pressure fell to ≤80 mmHg and/or the diastolic pressure fell to ≤50 mmHg and/or the mean BP drop ≥25%; 2) the HR descended below the following lower limits: 75 bpm for 4−6-year-old subjects; 65 bpm for 7−8-year-old subjects; 60 bpm for subjects over 8 years of age; 3) sinus arrest with compensatory junctional escape rhythm; and 4) transient second- or third-degree atrioventricular block or asystole ≥3 seconds.1 The hemodynamic response during HUTT was defined according to the Vasovagal Syncope International Study (VASIS) classification, which included vasodepressor type, cardioinhibitory type, and mixed type.25,41 A vasodepressor type was characterized by a significant diminution in BP without a significant reduction in HR; a cardioinhibitory type was defined by a significant diminution in HR without a significant decrease in BP; and a mixed type included significant drops in both HR and BP.25,41 All the included patients underwent HUTT before the metoprolol treatment.
Baseline LVEF and LVFS Calculation
Baseline LVEF and LVFS were measured by an echocardiography machine (Aplio Artida SSH-880CV, TOSHIBA, Japan) with a linear 2.5−5 MHz transducer before the metoprolol therapy. Left ventricular end diastolic diameter (LVDd) and systolic diameter (LVDs) were detected by M type echocardiography through the parasternal long axis view when patients were in a supine position. LVEF and LVFS were calculated automatically and digitally recorded by the echocardiography machine, and the calculation formulas were:29,42
LVEF = (LVDd3 − LVDs3)/LVDd3
LVFS = (LVDd − LVDs)/LVDd
Twenty-Four-Hour Holter Monitoring and the Measurement and Calculation of Poincaré Plot
The 24-hour Holter monitoring was performed before metoprolol therapy. The patients were required to avoid emotional agitation, strenuous exercise, or taking food and drugs that could affect autonomic activities on the day of 24-hour Holter monitoring and the day before. None of the children included in this study had an episode of syncope during the Holter recording period. The Mortara Holter dynamic electrocardiogram monitor (Mortara Instrument H3+TM/H12+TM, Milwaukee, Wisconsin, USA) was used to continuously record the 24-hour dynamic ECG data, and the Mortara analyzer (Mortara H-Scribe 7.0, Milwaukee, Wisconsin, USA) was used to analyze the data and automatically construct a Poincaré plot.
Figure 1A shows the forming principle of Poincaré plot. A point in the two-dimensional coordinated system is determined by the abscissa and ordinate values. Taking a point determined by two adjacent cardiac cycles as an example, the point in the rectangular coordinate system is identified with a cardiac cycle length a (ms) as the abscissa value and the subsequent cardiac cycle length b (ms) as the ordinate value (Figure 1A). As a result, such a point is determined by three successive QRS waves (R waves) and the two RR intervals. It is stipulated that the first RR interval (R1R2) and the second RR interval (R2R3) (R1→R2→R3) constitute the first point, and the second RR interval (R2R3) and the third RR interval (R3R4) (R2→R3→R4) constitute the second point, and so on. The Poincaré plot derived from 24-hour Holter recording will be formed when the points with the same characteristics are clustered together, showing a graph with cardiac rhythm features.37,43,44 In other words, the Poincaré plot is a type of statistical chart of RR intervals. If the two adjacent RR intervals are equal, the corresponding point will be distributed on the 45° line (ie, the line of identity). The L of Poincaré plot was defined as the maximum length of the distribution of Poincaré plot along the line of identity;45 and the T of Poincaré plot was defined as the distance between the two straight lines that were parallel to the line of identity and tangent to the boundary of the dense part of the graph35,45 (Figure 1B). Adobe Photoshop 2020 software (CS6, 13.0.1, Adobe Inc., USA) was used to measure L and T of Poincaré plot, and then the L/T of Poincaré plot was calculated.
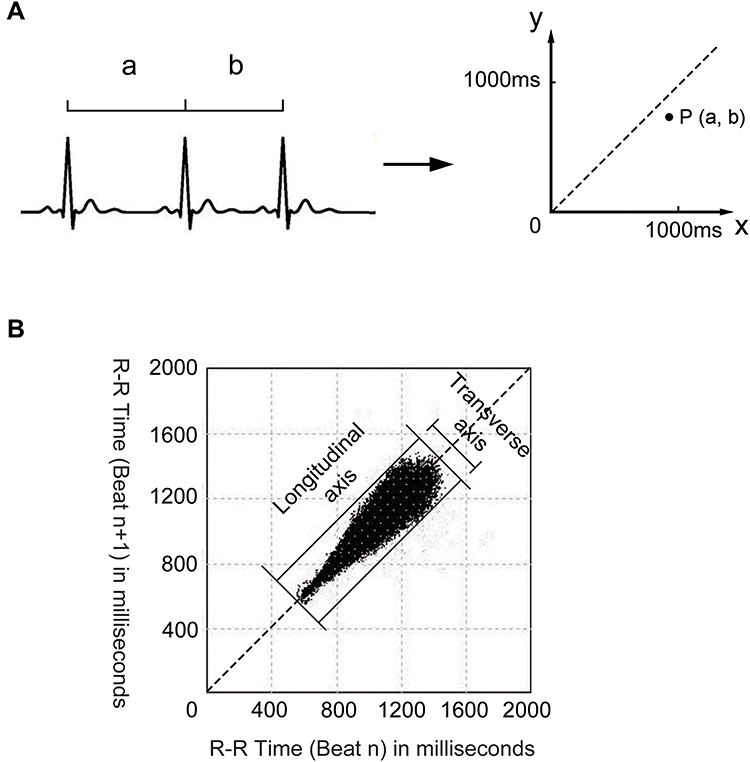 |
Figure 1 The illustration for forming principle and measurement method of Poincaré plot. (A) Schematic illustration of the forming principle of Poincaré plot. A point in the Poincaré plot is constructed from the value of a cardiac cycle (abscissa a) and the value of a subsequent cardiac cycle (ordinate b). (B) The illustration for the measurement method of a Poincaré plot from an 11-year-old girl. The longitudinal axis of Poincaré plot was defined as the maximum length of the distribution of Poincaré plot along the 45° line (ie, the line of identity); and the transverse axis of Poincaré plot was defined as the distance between the two straight lines that were parallel to the line of identity and tangent to the boundary of the dense part of the graph. |
The L and T of Poincaré plots of all included children were measured by a dedicated investigator. Prior to this, the stability and repeatability of the measurements were tested. In the stability test, the dedicated investigator performed two measurements on the Poincaré plots from 15 subjects with an interval of 1 week, and then the values of the two measurements were compared. In the repeatability test, two investigators (including the dedicated one) measured the Poincaré plots from 15 subjects independently, and then the measured values of Poincaré plots from each subject were compared.
Metoprolol Therapy and Follow-Up
All the patients included were instructed with hygienic measures (ie, health education, trigger avoidance, increased salt and water intake and physical counter-pressure maneuvers) before and during the metoprolol therapy. All the patients included were treated with oral metoprolol (25 mg/tablet, AstraZeneca Pharmaceutical Co., Ltd., London, UK) at an initial dose of 0.5 mg·kg−1 per day in two oral sessions and the dose was progressively increased to a tolerable one, with a maximum dosage of 2 mg·kg−1 or 50 mg per day (whichever is lower). The contraindications of metoprolol were obvious sinus bradycardia, second- or third-degree atrioventricular block, bronchial asthma, and allergy to the medicine.1 The severity of the disease was assessed by the syncope symptom score based on the frequency of syncope episodes.29,46,47 The syncope symptom score was as follows: 0, no syncope; 1, once/month; 2, two to four times/month; 3, two to seven times/week; 4, more than once per day.29,30,46,47 The baseline syncope symptom score was evaluated by the average frequency of syncope episodes within 3 months before metoprolol treatment. After 3 months of metoprolol treatment, all the patients were followed up by hospitalization, outpatient clinics or telephone, and their frequency of syncope episodes during the metoprolol treatment and the treatment compliance were collected, recorded, and checked by professional investigators. The primary endpoint was a reduction of syncope symptom score by at least one point at the end of the 3-month follow-up. That is, if the syncope symptom score at the end of 3 months of metoprolol therapy, which was evaluated by the average frequency of syncope episodes during the 3 months of metoprolol treatment, decreased by at least one point from the baseline syncope symptom score, the therapy was considered effective, otherwise, it was considered ineffective.29,46,47 The patients were divided into the effective group (responders) and the ineffective group (nonresponders) depending on their response to the metoprolol therapy.
Statistical Analysis
Statistical analyses were conducted using SPSS version 21.0 (IBM, New York, USA). The normality was tested by Shapiro−Wilk. Data conforming to the normal distribution were represented by mean ± standard deviation and independent sample t-test was used for comparison between groups. Data not normally distributed were represented by median (interquartile range) and nonparametric Mann−Whitney U-test was used for comparison between groups. The stability and repeatability of the Poincaré plots measurements were tested by paired t-test. Categorical data were expressed as n (%) and comparison was performed using Chi-square test or Fisher’s exact test. Indexes of P < 0.1 in the univariate analysis were taken as potential predictors and were brought into the binary logistic regression to obtain the correlative factors for the efficacy of metoprolol therapy using the forward-step selection method. Receiver operating characteristic (ROC) curve was utilized to estimate the value of the determined index in identifying potential responders to metoprolol. P < 0.05 was considered statistically significant.
Results
Baseline Characteristics
Based on the inclusion and exclusion criteria, 148 patients were included in the study (Figure 2). One hundred and five patients with VVS treated by metoprolol constituted the training set, including 76 patients (29 boys and 47 girls; median age, 12.0 years with a range of 5.0−17.0 years) in the effective group and 29 patients (14 boys and 15 girls; median age, 11.0 years with a range of 6.0−16.0 years) in the ineffective group according to the changes of syncope symptom score. Forty-three children (21 boys and 22 girls; median age, 11.0 years with a range of 5.0−16.0 years) were included in the validation set, of which 29 (67.4%) got good response to metoprolol and 14 (32.6%) did not.
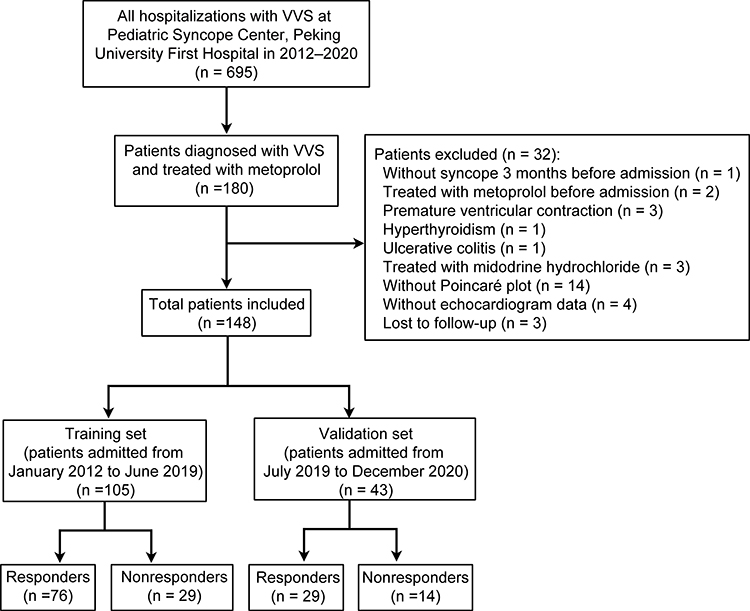 |
Figure 2 Flowchart of patient selection. Abbreviation: VVS, vasovagal syncope. |
Comparison of Clinical Data Between Responders and Nonresponders
In the training set, the L/T of Poincaré plot of the responders was distinctly higher than that of the nonresponders (P < 0.001). No obvious difference was found in sex, age at admission, height, weight, BMI, course of disease, baseline syncope symptom score, treatment duration, supine HR, supine systolic pressure, supine diastolic pressure, peak HR during HUTT, changes of HR during HUTT, hemodynamic response during HUTT, LVEF and LVFS between the two groups (P > 0.05) (Table 1). The stability and repeatability of Poincaré plot measurements were good (P > 0.05; Supplemental Table 1 and Supplemental Table 2).
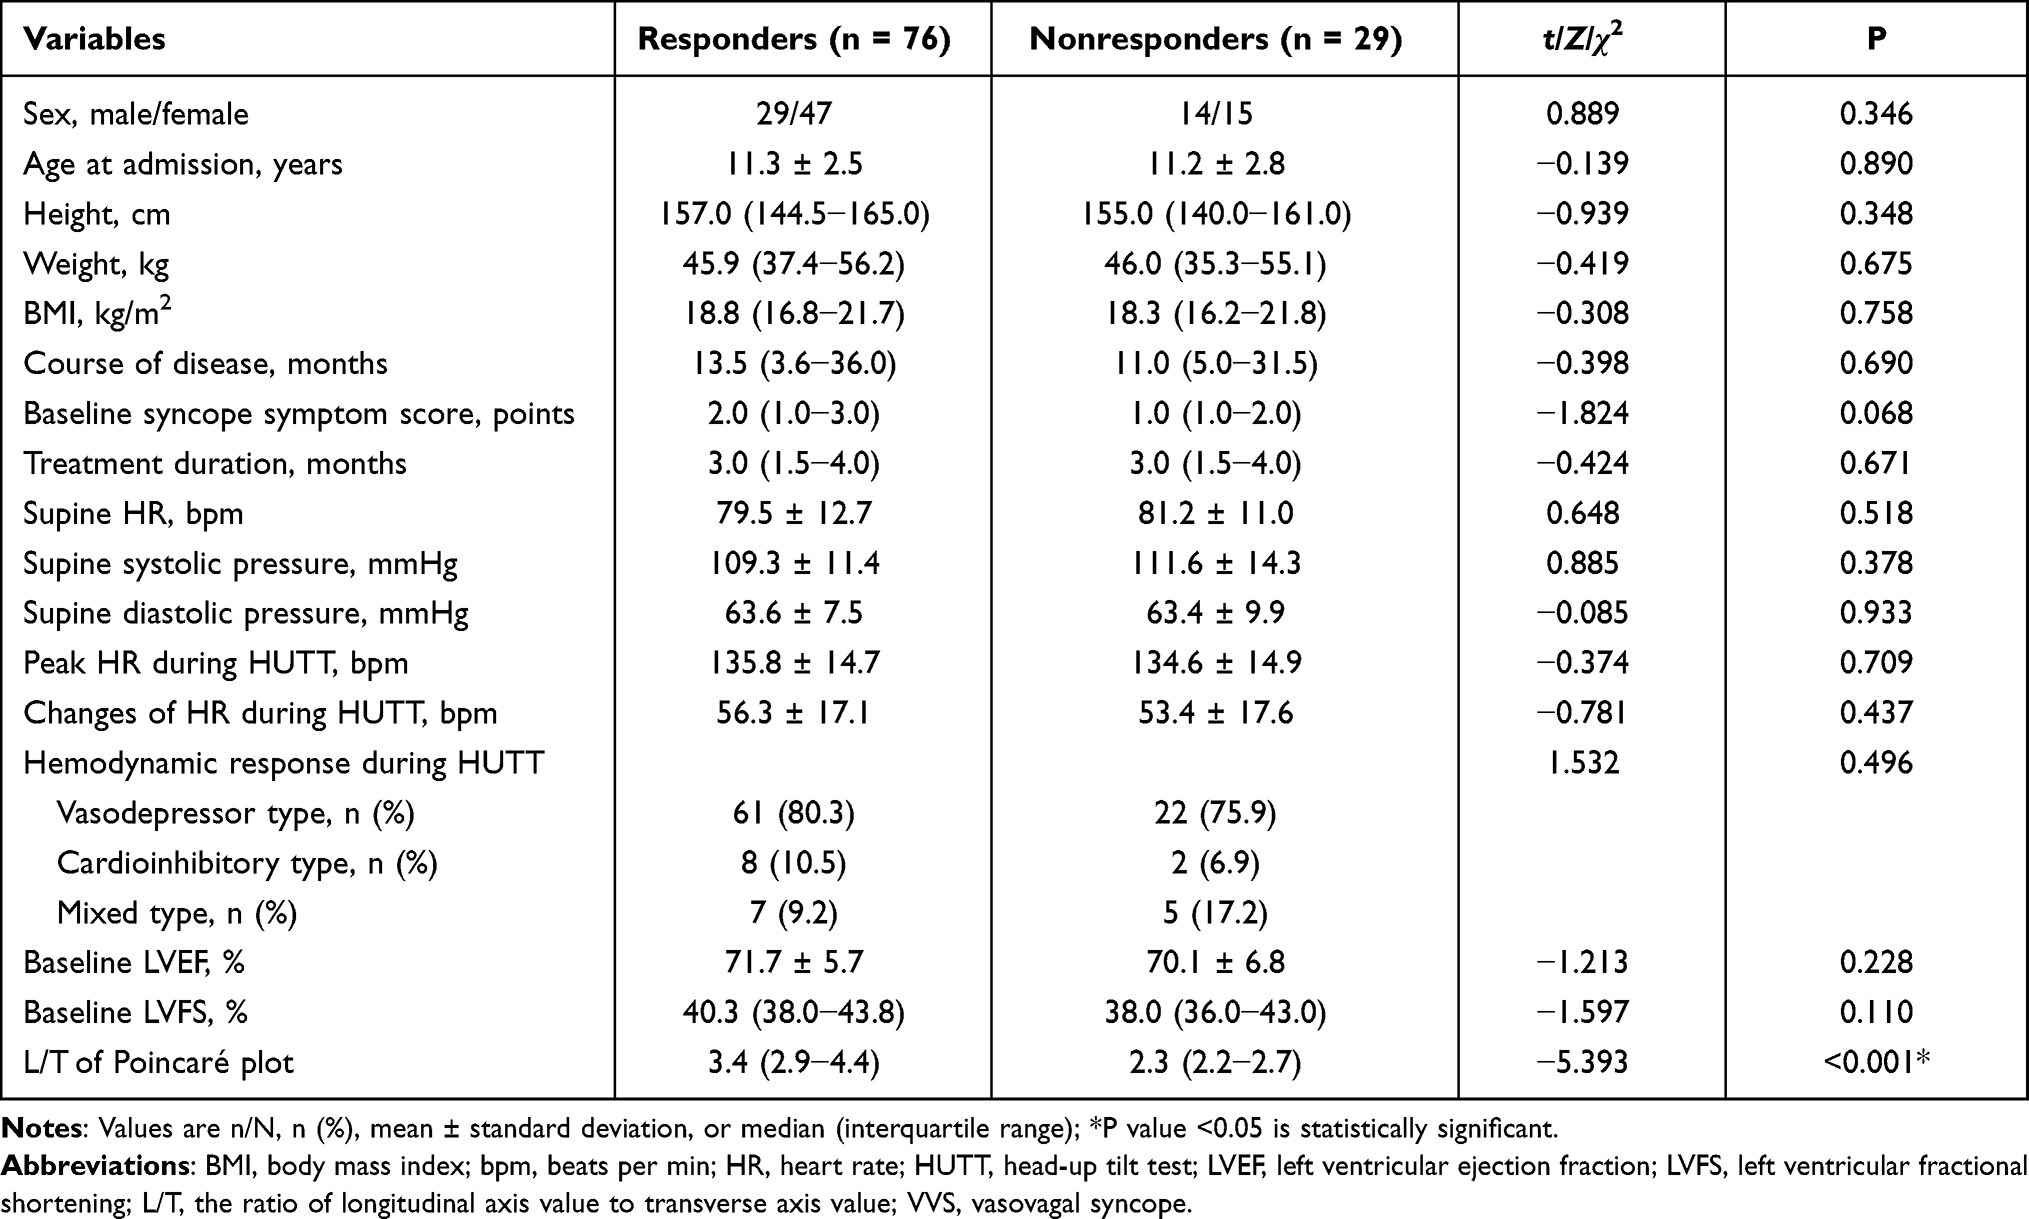 |
Table 1 Comparisons of Baseline Characteristics Between Children with VVS Showing Different Responses to Metoprolol in the Training Set |
Exploration of the Factors Related to Curative Effect of Metoprolol by Binary Logistic Regression
Baseline syncope symptom score (P = 0.068 in the above analysis) and the L/T of Poincaré plot (P < 0.001 in the above analysis) were brought into binary logistic regression. The results suggested that the L/T of Poincaré plot was a correlative factor for the curative effect of metoprolol in treating pediatric VVS (OR 5.103, 95% CI 2.318−11.235, P < 0.001).
The Value of L/T in Selecting Children with VVS Suitable for Metoprolol Therapy
ROC curve analysis on the value of L/T as an indicator to select children with VVS suitable for metoprolol therapy showed that the area under the curve was 0.841 (95% CI 0.746−0.937, P < 0.001) (Figure 3), and the Youden index reached the maximum when taking an L/T of 2.7 as the cutoff value. When using the condition of L/T >2.7 to identify responders to metoprolol, the sensitivity and specificity were 88.2% and 82.8%, respectively.
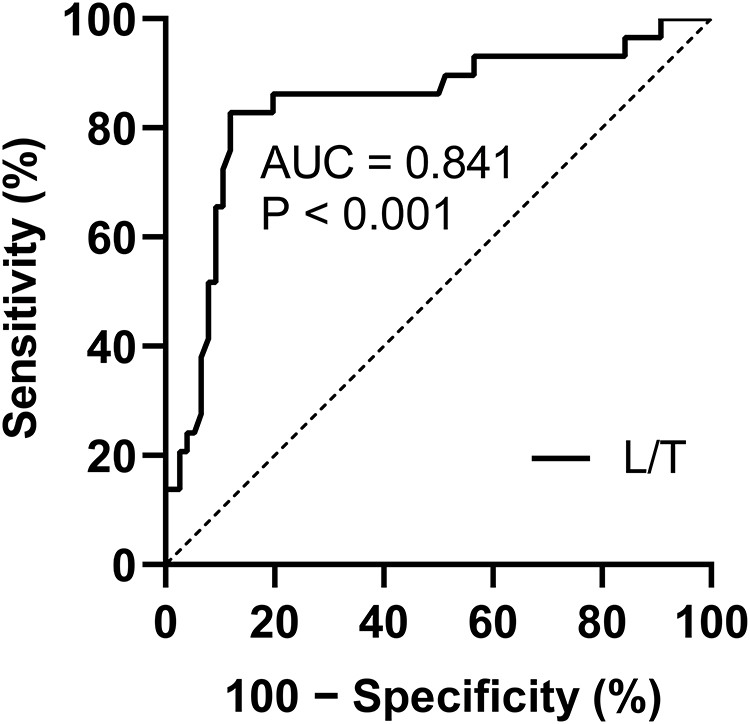 |
Figure 3 ROC curve on the value of L/T of Poincaré plot in selecting children with VVS suitable for metoprolol therapy. The sensitivity is expressed on the ordinate and the false-positive rate [100 – specificity (%)] on the abscissa. The 45° oblique dotted line represents the sensitivity equals the false-positive rate, not indicating any value for selection. Abbreviations: AUC, area under the curve; ROC, receiver operating characteristic; L/T, the ratio of longitudinal axis value to transverse axis value; VVS, vasovagal syncope. |
Validation of the Value of L/T in Selecting Patients Suitable for Metoprolol Therapy
Children with L/T >2.7 in the validation set were predicted to be responders to the metoprolol therapy, otherwise nonresponders. The predictions on the response to metoprolol based on the L/T of Poincaré plot were verified by the therapeutic outcomes during follow-up based on the changes of syncope symptom score, which was the primary endpoint of the present study. The results showed that the L/T >2.7 yielded a sensitivity of 96.6%, specificity of 71.4%, and accuracy of 88.4%, respectively, in identifying responders to metoprolol therapy (Table 2).
 |
Table 2 The Value of L/T of Poincaré Plot in Indicating Responders to Metoprolol in Children with VVS in the Validation Set (n = 43) |
Discussion
The graphic features (L/T) of the Poincaré plot were innovatively used as a tool to select children with VVS suitable for metoprolol therapy in this hypothesis generating study. It was found that the L/T of Poincaré plot before metoprolol therapy of the responders was distinctly higher than that of the nonresponders, and the L/T of Poincaré plot was a correlative factor for the efficacy of metoprolol therapy. The L/T >2.7 had a sensitivity of 88.2% and a specificity of 82.8% in indicating responders to metoprolol therapy. Verified by treatment outcomes during follow-up, the sensitivity, specificity, and accuracy of L/T >2.7 in predicting the responders to metoprolol were 96.6%, 71.4% and 88.4%, respectively.
Under physiological conditions, blood will be pooled in the capacitance vessels of abdominal viscera as well as lower limbs when one stands up due to the gravity, resulting in reduced venous return, reduced cardiac output, and the subsequent fall in BP. Sensing the drop of local pressure by the baroreceptors located in sinus caroticus and arcus aortae, the impulse of afferent nerve to the cardiovascular regulation center in brainstem attenuates, which leads to a sympathetic excitation, and a subsequent vasoconstriction and an increase in HR to maintain the proper BP and organ perfusion. It was found that the sympathetic activity was excessively enhanced in a subset of VVS cases in their supine position or prior to syncope,11,12,48 and the relatively obvious vagal excitation would be a compensation to maintain the autonomic stability.49 After standing up, the vagal activity decreases, while the sympathetic activity even further increases. Then, the resulting significantly enhanced myocardial contractility acts on the relatively insufficiently filled ventricle, which can activate the mechanoreceptors located in the posterior inferior wall of the left ventricle and trigger an paradoxical reflex that causes a sudden drop in BP and/or marked bradycardia, even a transient asystole.50–52 According to these results in the previous studies, beta-blockers may play a role in treating VVS because they are known to reduce the sympathetic activity and then abate the stimulation of the mechanoreceptors in cardiovascular system.32,33,53 However, not all the patients with VVS share the same mechanisms as mentioned above. The main pathogenesis of some patients with VVS may be related to blood volume insufficiency, abnormal cerebrovascular self-regulation, or vascular dysfunction, etc.29,30 Therefore, the therapeutic effect of beta-blockers for all the patients with VVS is not consistent.17,54 Even worse, for those patients without sympathetic overactivation, beta-blocker therapy may lead to autonomic nervous dysfunction and aggravate symptoms.55,56 Therefore, it is necessary to correctly identify children with the enhanced sympathetic excitation before making an individualized treatment with metoprolol. Poincaré plot is a practical tool in 24-hour Holter analysis that has been increasingly valued in recent years. Poincaré plot not only helps to make the diagnose for arrhythmia,57 but also reflects the autonomic nervous activity directly through graphic features in a relatively simple and intuitive way.39,43 For example, in an RCT, the authors used the geometric analysis of Poincaré plot to describe the HR variability in the patients with congestive heart failure treated with beta-blockers to assess their cardiovascular autonomic nervous functions.58 The T of Poincaré plot reflects the transient variation of RR intervals and is deemed to be proportional to parasympathetic activity;35,36 while the physiological significance of L in Poincaré plot has not been fully clarified, although some studies believed that it may be related to both sympathetic and parasympathetic activities.38,43 The ratio of L to T of Poincaré plot is commonly used to assess the interaction between sympathetic and parasympathetic activities.38,43 A previous study showed that the L/T of Poincaré plot was an indicator of cardiac sympathetic function, and called it the “cardiac sympathetic index”.39 It was found that as the sympathetic activity of patients was increased, the shape of Poincaré plots became “longer and narrower” and the L/T of Poincaré plots increased.39 These facts in the previous studies constitute the theoretical basis for using the Poincaré plot to select children with VVS who were appropriate for metoprolol therapy.
In previous studies, Zhang et al retrospectively analyzed the predictive value of the changes of HR during HUTT in the treatment effect of metoprolol for pediatric VVS, and found that the increase of HR during HUTT in responders was significantly higher than that in nonresponders (42 ± 16 bpm vs 18 ± 13 bpm, P < 0.01). With the increase of HR > 30 bpm, the sensitivity and specificity for the prediction of the effectiveness of metoprolol therapy were 81% and 80%, respectively.34 A previous study retrospectively explored the efficiency of LVEF and LVFS in predicting the outcomes of metoprolol therapy for pediatric VVS and found that the baseline LVEF and LVFS of the children who responded well were significantly higher than those of the children who responded poorly after 6 months of treatment.29 The study proposed through ROC analysis that metoprolol therapy was more likely to be efficient in the children with LVEF > 70.5% (sensitivity 81.3%; specificity 88.9%) or LVFS > 37.5% (sensitivity 93.8%; specificity 66.7%).29 Another study took the 24-hour urinary norepinephrine levels as the predictive markers to select suitable patients in the treatment of pediatric VVS with metoprolol and found that the 24-hour urinary norepinephrine levels in the responders were distinctly higher than that in the nonresponders (40.75 ± 12.86 μg vs 21.48 ± 6.49 μg, P < 0.001). The sensitivity and specificity for predicting the good response of metoprolol treatment with the condition of 24-hour urinary norepinephrine levels >34.84 μg/24 h were 70% and 100%, respectively.30 However, as mentioned before, the increase of HR during HUTT and the measured values of LVEF and LVFS may fluctuate due to many factors. In addition, a reliable 24-hour urinary norepinephrine level depends on an accurate collection of the total volume of urine for the children and strict preservation conditions for the urine, otherwise the randomness of the results may be inevitable. All these above limitations may restrict their clinical applications. Therefore, it is necessary to explore other indicators that are more stable and easy-to-operate. In the present hypothesis generating study, we first assessed the value of a graphic biomarker from the Poincaré plot in selecting potential responders to metoprolol therapy for pediatric VVS and found that it showed relatively high sensitivity and specificity in indicating responders. The graph of Poincaré plot is relative stable and is believed to objectively reflect autonomic nervous function state of the children over the whole day, which greatly reduces the randomness of the results. More importantly, the Poincaré plot is visualized, and more intuitive and vivid than all the previous predictors. Finally, the Poincaré plots used in this study can be automatically produced by Holter analysis software, which is convenient for application. In brief, the shape of Poincaré plot can be a useful indicator to help determining whether children with VVS are suitable for metoprolol therapy. That is, from a graphic point of view, for children diagnosed with VVS, those with “baseball bat-shaped” Poincaré plots (L/T >2.7) are more likely to respond well to metoprolol treatment, and those with “tennis racket-shaped” Poincaré plots (L/T ≤2.7) are more likely to respond poorly to metoprolol treatment (Figure 4).
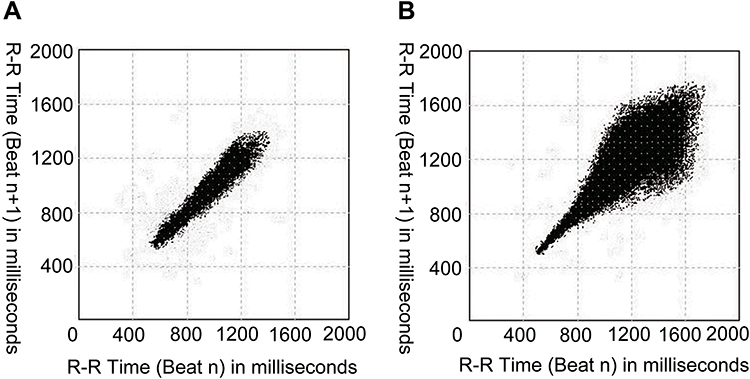 |
Figure 4 Typical Poincaré plots of children with VVS showing different responses to metoprolol therapy. (A) The Poincaré plot of a 12-year-old boy with VVS who responded well to metoprolol treatment (baseball bat-shaped). (B) The Poincaré plot of a 12-year-old boy with VVS who failed to response to metoprolol treatment (tennis racket-shaped). Abbreviation: VVS, vasovagal syncope. |
However, this study also had some limitations, including the potential selection bias and inevitable recall bias due to the retrospective design, the relatively limited sample size, the short duration of medication and follow-up periods, and the applicability to children who experienced syncope episodes during the Holter recording period remains to be explored although we believe that a brief episode of syncope may not have a significant effect on the overall graph of the Poincaré plot derived from 24-hour Holter. Because of the retrospective nature of this study, the metoprolol therapies were empirical choice of the doctors who managed the patients. Generally, those with frequent syncope attacks and poor response to non-pharmacological treatment were more likely to be treated with metoprolol, which may cause certain selection bias. In the future, large-sample multicenter prospective studies are required to further validate the value of L/T of Poincaré plot in helping pediatricians to select suitable patients for metoprolol therapy in the management of pediatric VVS.
Conclusion
This study was the first to evaluate the value of the graphic features of Poincaré plot in selecting children with VVS who were suitable for metoprolol therapy. The L/T of Poincaré plot was significantly higher in children with VVS who responded well to metoprolol than that in children with VVS who responded poorly. The L/T of Poincaré plot >2.7 can be a useful tool to select potential responders to metoprolol therapy in children with VVS.
Abbreviations
BMI, body mass index; BP, blood pressure; bpm, beats per min; HR, heart rate; HUTT, head-up tilt test; L, longitudinal axis; L/T, the ratio of longitudinal axis value to transverse axis value; LVEF, left ventricular ejection fraction; LVFS, left ventricular fractional shortening; RCT, randomized controlled trial; ROC, receiver operating characteristic; T, transverse axis; VVS, vasovagal syncope.
Data Sharing Statement
The data described in this study are available upon reasonable request from Ying Liao (email: [email protected]) or Yaqian Huang (email: [email protected]).
Ethics Approval and Informed Consent
The present study was performed according to the Declaration of Helsinki and approved by the Ethics Committee of Peking University First Hospital (2021 [150]). As the study design was retrospective, the verbal consent was obtained from the legal guardians of the participants by a professional investigator over the telephone before the study, and the verbal consent protocol was approved by the Ethics Committee of Peking University First Hospital (2021 [150]).
Acknowledgments
The authors would like to thank the enrolled patients and their guardians.
Funding
This work was supported by the Peking University Clinical Scientist Program (BMU2019LCKXJ001) and the Fundamental Research Funds for the Central Universities.
Disclosure
The authors report no conflicts of interest in this work.
References
1. Wang C, Li Y, Liao Y, et al. 2018 Chinese Pediatric Cardiology Society (CPCS) guideline for diagnosis and treatment of syncope in children and adolescents. Sci Bull. 2018;63(23):1558–1564. doi:10.1016/j.scib.2018.09.019
2. Moya A, Sutton R, Ammirati F, et al. Guidelines for the diagnosis and management of syncope (version 2009). Eur Heart J. 2009;30(21):2631–2671. doi:10.1093/eurheartj/ehp298
3. Massin MM, Bourguignont A, Coremans C, Comté L, Lepage P, Gérard P. Syncope in pediatric patients presenting to an emergency Department. J Pediatr. 2004;145(2):223–228. doi:10.1016/j.jpeds.2004.01.048
4. Kanjwal K, Calkins H. Syncope in children and adolescents. Cardiol Clin. 2015;33(3):397–409. doi:10.1016/j.ccl.2015.04.008
5. Freeman R, Wieling W, Axelrod FB, et al. Consensus statement on the definition of orthostatic hypotension, neurally mediated syncope and the postural tachycardia syndrome. Clin Auton Res. 2011;21(2):69–72. doi:10.1007/s10286-011-0119-5
6. Tanrıverdi Yılmaz S, Binnetoğlu K, Babaoğlu K, Altun G. Predictors of vasovagal syncope recurrence in children and adolescents and value of head-up tilt table test. Anadolu Kardiyol Derg. 2013;13(7):688–694. doi:10.5152/akd.2013.194
7. Kouakam C, Vaksmann G, Pachy E, Lacroix D, Rey C, Kacet S. Long-term follow-up of children and adolescents with syncope; predictor of syncope recurrence. Eur Heart J. 2001;22(17):1618–1625. doi:10.1053/euhj.2000.2577
8. Alhuzaimi A, Aljohar A, Alhadi AN, Aljenedil A, Hersi AS. Psychiatric traits in patients with vasovagal and unexplained syncope. Int J Gen Med. 2018;11:99–104. doi:10.2147/ijgm.s157335
9. Wang Y, Wang Y, Li X, et al. Efficacy of increased salt and water intake on pediatric vasovagal syncope: a meta-analysis based on global published data. Front Pediatr. 2021;9:663016. doi:10.3389/fped.2021.663016.
10. Brignole M, Moya A, de Lange FJ, et al. 2018 ESC Guidelines for the diagnosis and management of syncope. Eur Heart J. 2018;39(21):1883–1948. doi:10.1093/eurheartj/ehy037
11. Sehra R, Hubbard JE, Straka SP, Fineberg NS, Engelstein ED, Zipes DP. Autonomic changes and heart rate variability in children with neurocardiac syncope. Pediatr Cardiol. 1999;20(4):242–247. doi:10.1007/s002469900456
12. Alehan D, Ayabakan C, Ozer S. Heart rate variability and autonomic nervous system changes in children with vasovagal syncope. Pacing Clin Electrophysiol. 2002;25(9):1331–1338. doi:10.1046/j.1460-9592.2002.01331.x
13. Raj SR, Faris PD, Semeniuk L, et al. Rationale for the assessment of metoprolol in the prevention of vasovagal syncope in aging subjects trial (POST5). Am Heart J. 2016;174:89–94. doi:10.1016/j.ahj.2016.01.017
14. Márquez MF, Gómez-Flores JR, González-Hermosillo JA, Ruíz-Siller TJ, Cárdenas M. Role of the sympathetic nervous system in vasovagal syncope and rationale for beta-blockers and norepinephrine transporter inhibitors. Medwave. 2016;16(Suppl 4):e6824. doi:10.5867/medwave.2016.6824
15. Sra JS, Murthy V, Natale A, et al. Circulatory and catecholamine changes during head-up tilt testing in neurocardiogenic (vasovagal) syncope. Am J Cardiol. 1994;73(1):33–37. doi:10.1016/0002-9149(94)90723-4
16. Goldstein DS, Holmes C, Frank SM, et al. Sympathoadrenal imbalance before neurocardiogenic syncope. Am J Cardiol. 2003;91(1):53–58. doi:10.1016/s0002-9149(02)02997-1
17. Liao Y, Li XY, Zhang YW, Du JB. Meta-analysis of beta-adrenoceptor blockers for the treatment of vasovagal syncope. Beijing Da Xue Xue Bao Yi Xue Ban. 2008;40(6):603–609.
18. Sheldon RS, Morillo CA, Klingenheben T, Krahn AD, Sheldon A, Rose MS. Age-dependent effect of β-blockers in preventing vasovagal syncope. Circ Arrhythm Electrophysiol. 2012;5(5):920–926. doi:10.1161/circep.112.974386
19. Cox MM, Perlman BA, Mayor MR, et al. Acute and long-term beta-adrenergic blockade for patients with neurocardiogenic syncope. J Am Coll Cardiol. 1995;26(5):1293–1298. doi:10.1016/0735-1097(95)00320-7
20. Mahanonda N, Bhuripanyo K, Kangkagate C, et al. Randomized double-blind, placebo-controlled trial of oral atenolol in patients with unexplained syncope and positive upright tilt table test results. Am Heart J. 1995;130(6):1250–1253. doi:10.1016/0002-8703(95)90150-7
21. Natale A, Sra J, Dhala A, et al. Efficacy of different treatment strategies for neurocardiogenic syncope. Pacing Clin Electrophysiol. 1995;18(4 Pt 1):655–662. doi:10.1111/j.1540-8159.1995.tb04660.x
22. Ventura R, Maas R, Zeidler D, et al. A randomized and controlled pilot trial of beta-blockers for the treatment of recurrent syncope in patients with a positive or negative response to head-up tilt test. Pacing Clin Electrophysiol. 2002;25(5):816–821. doi:10.1046/j.1460-9592.2002.t01-1-00816.x
23. Natale A, Newby KH, Dhala A, Akhtar M, Sra J. Response to beta blockers in patients with neurocardiogenic syncope: how to predict beneficial effects. J Cardiovasc Electrophysiol. 1996;7(12):1154–1158. doi:10.1111/j.1540-8167.1996.tb00494.x
24. Nair N, Padder FA, Kutalek SP, Kantharia BK. Usefulness of pindolol for treatment of neurocardiogenic syncope. Am J Cardiol. 2004;94(9):1189–1191. doi:10.1016/j.amjcard.2004.07.093
25. Shen WK, Sheldon RS, Benditt DG, et al. 2017 ACC/AHA/HRS guideline for the evaluation and management of patients with syncope: a report of the American College of Cardiology/American Heart Association Task Force on Clinical Practice Guidelines and the Heart Rhythm Society. Heart Rhythm. 2017;14(8):e155–e217. doi:10.1016/j.hrthm.2017.03.004
26. Sheldon R, Connolly S, Rose S, et al. Prevention of Syncope Trial (POST): a randomized, placebo-controlled study of metoprolol in the prevention of vasovagal syncope. Circulation. 2006;113(9):1164–1170. doi:10.1161/circulationaha.105.535161
27. Zhang Q, Jin H, Wang L, Chen J, Tang C, Du J. Randomized comparison of metoprolol versus conventional treatment in preventing recurrence of vasovagal syncope in children and adolescents. Med Sci Monit. 2008;14(4):Cr199–Cr203.
28. Kanjwal K, Marine JE. Sympathoadrenal imbalance and beta-blockers revisited. Heart Rhythm. 2012;9(11):1853–1854. doi:10.1016/j.hrthm.2012.08.028
29. Song J, Li H, Wang Y, et al. Left ventricular ejection fraction and fractional shortening are useful for the prediction of the therapeutic response to metoprolol in children with vasovagal syncope. Pediatr Cardiol. 2018;39(7):1366–1372. doi:10.1007/s00246-018-1904-x
30. Kong Q, Yang X, Cai Z, et al. Twenty-four-hour urine NE level as a predictor of the therapeutic response to metoprolol in children with recurrent vasovagal syncope. Ir J Med Sci. 2019;188(4):1279–1287. doi:10.1007/s11845-019-01979-9
31. Li HX, Gao L, Yuan Y. Advance in the understanding of vasovagal syncope in children and adolescents. World J Pediatr. 2021;17(1):58–62. doi:10.1007/s12519-020-00367-z
32. Dendi R, Goldstein DS. Meta-analysis of nonselective versus beta-1 adrenoceptor-selective blockade in prevention of tilt-induced neurocardiogenic syncope. Am J Cardiol. 2002;89(11):1319–1321. doi:10.1016/s0002-9149(02)02338-x
33. Benditt DG, Ermis C, Padanilam B, Samniah N, Sakaguchi S. Catecholamine response during haemodynamically stable upright posture in individuals with and without tilt-table induced vasovagal syncope. Europace. 2003;5(1):65–70. doi:10.1053/eupc.2002.0271
34. Zhang QY, Du JB, Zhen JL, Li WZ, Wang YL. Hemodynamic changes during head-up tilt test and predictive value thereof in predicting the efficacy of metoprolol therapy in children with vasovagal syncope. Zhonghua Yi Xue Za Zhi. 2007;87(18):1260–1262.
35. Chaidas K, Tsaoussoglou M, Theodorou E, Lianou L, Chrousos G, Kaditis AG. Poincaré plot width, morning urine norepinephrine levels, and autonomic imbalance in children with obstructive sleep apnea. Pediatr Neurol. 2014;51(2):246–251. doi:10.1016/j.pediatrneurol.2014.05.003
36. Kamen PW, Krum H, Tonkin AM. Poincaré plot of heart rate variability allows quantitative display of parasympathetic nervous activity in humans. Clin Sci. 1996;91(2):201–208. doi:10.1042/cs0910201
37. Tulppo MP, Mäkikallio TH, Takala TE, Seppänen T, Huikuri HV. Quantitative beat-to-beat analysis of heart rate dynamics during exercise. Am J Physiol. 1996;271(1 Pt 2):H244–252. doi:10.1152/ajpheart.1996.271.1.H244
38. Naranjo Orellana J, de la Cruz Torres B, Sarabia Cachadiña E, de Hoyo M, Domínguez Cobo S. Two new indexes for the assessment of autonomic balance in elite soccer players. Int J Sports Physiol Perform. 2015;10(4):452–457. doi:10.1123/ijspp.2014-0235
39. Toichi M, Sugiura T, Murai T, Sengoku A. A new method of assessing cardiac autonomic function and its comparison with spectral analysis and coefficient of variation of R-R interval. J Auton Nerv Syst. 1997;62(1–2):79–84. doi:10.1016/s0165-1838(96)00112-9
40. Brignole M, Moya A, de Lange FJ, et al. Practical Instructions for the 2018 ESC Guidelines for the diagnosis and management of syncope. Eur Heart J. 2018;39(21):e43–e80. doi:10.1093/eurheartj/ehy071
41. Brignole M, Menozzi C, Del Rosso A, et al. New classification of haemodynamics of vasovagal syncope: beyond the VASIS classification: analysis of the pre-syncopal phase of the tilt test without and with nitroglycerin challenge. EP Europace. 2000;2(1):66–76. doi:10.1053/eupc.1999.0064
42. Wang YY, Han ZH, Wang YL, et al. Baseline left ventricular ejection fraction associated with symptom improvements in both children and adolescents with postural tachycardia syndrome under metoprolol therapy. Chin Med J. 2021;134(16):1977–1982. doi:10.1097/cm9.0000000000001698
43. Blake RR, Shaw DJ, Culshaw GJ, Martinez-Pereira Y. Poincaré plots as a measure of heart rate variability in healthy dogs. J Vet Cardiol. 2018;20(1):20–32. doi:10.1016/j.jvc.2017.10.006
44. Woo MA, Stevenson WG, Moser DK, Trelease RB, Harper RM. Patterns of beat-to-beat heart rate variability in advanced heart failure. Am Heart J. 1992;123(3):704–710. doi:10.1016/0002-8703(92)90510-3
45. Ueda T, Nakatsu T, Yamane S, et al. Correlation of Lorenz scatterplots with frequency domain heart rate variability. Clin Exp Hypertens. 2002;24(1–2):11–21. doi:10.1081/ceh-100108711
46. Tao C, Li X, Tang C, Jin H, Du J. Baroreflex sensitivity predicts response to metoprolol in children with vasovagal syncope: a pilot study. Front Neurosci. 2019;13:1329. doi:10.3389/fnins.2019.01329
47. Tao CY, Chen S, Li XY, Tang CS, Du JB, Jin HF. Body mass index is a promising predictor of response to oral rehydration saline in children with vasovagal syncope. Chin Med J. 2020;134(4):463–468. doi:10.1097/cm9.0000000000001168
48. Tao C, Tang C, Chen S, Jin H, Du J. Autonomic nervous function in vasovagal syncope of children and adolescents. Neurosci Bull. 2019;35(5):937–940. doi:10.1007/s12264-019-00383-8
49. Shim SH, Park SY, Moon SN, et al. Baseline heart rate variability in children and adolescents with vasovagal syncope. Korean J Pediatr. 2014;57(4):193–198. doi:10.3345/kjp.2014.57.4.193
50. Nair N, Padder FA, Kantharia BK. Pathophysiology and management of neurocardiogenic syncope. Am J Manag Care. 2003;9(4):
51. Salo LM, Woods RL, Anderson CR, McAllen RM. Nonuniformity in the von Bezold-Jarisch reflex. Am J Physiol Regul Integr Comp Physiol. 2007;293(2):R714–R720. doi:10.1152/ajpregu.00099.2007
52. He W, Wang X, Liu S, et al. Sympathetic mechanisms in an animal model of vasovagal syncope. Clin Auton Res. 2018;28(3):333–340. doi:10.1007/s10286-018-0503-5
53. Grubb BP. Clinical practice. Neurocardiogenic syncope. N Engl J Med. 2005;352(10):1004–1010. doi:10.1056/NEJMcp042601
54. Vyas A, Swaminathan PD, Zimmerman MB, Olshansky B. Are treatments for vasovagal syncope effective? A meta-analysis. Int J Cardiol. 2013;167(5):1906–1911. doi:10.1016/j.ijcard.2012.04.144
55. Vallurupalli S, Das S. Clinical efficacy of beta1 selective adrenergic blockers in the treatment of neurocardiogenic syncope - a meta-analysis. Clin Pharmacol. 2010;2:163–167. doi:10.2147/cpaa.s12873
56. Alegria JR, Gersh BJ, Scott CG, Hodge DO, Hammill SC, Shen WK. Comparison of frequency of recurrent syncope after beta-blocker therapy versus conservative management for patients with vasovagal syncope. Am J Cardiol. 2003;92(1):82–84. doi:10.1016/s0002-9149(03)00475-2
57. Esperer HD, Esperer C, Cohen RJ. Cardiac arrhythmias imprint specific signatures on Lorenz plots. Ann Noninvasive Electrocardiol. 2008;13(1):44–60. doi:10.1111/j.1542-474X.2007.00200.x
58. Copie X, Pousset F, Lechat P, Jaillon P, Guize L, Le Heuzey JY. Effects of beta-blockade with bisoprolol on heart rate variability in advanced heart failure: analysis of scatterplots of R-R intervals at selected heart rates. Am Heart J. 1996;132(2 Pt 1):369–375. doi:10.1016/s0002-8703(96)90435-4
 © 2022 The Author(s). This work is published and licensed by Dove Medical Press Limited. The full terms of this license are available at https://www.dovepress.com/terms.php and incorporate the Creative Commons Attribution - Non Commercial (unported, v3.0) License.
By accessing the work you hereby accept the Terms. Non-commercial uses of the work are permitted without any further permission from Dove Medical Press Limited, provided the work is properly attributed. For permission for commercial use of this work, please see paragraphs 4.2 and 5 of our Terms.
© 2022 The Author(s). This work is published and licensed by Dove Medical Press Limited. The full terms of this license are available at https://www.dovepress.com/terms.php and incorporate the Creative Commons Attribution - Non Commercial (unported, v3.0) License.
By accessing the work you hereby accept the Terms. Non-commercial uses of the work are permitted without any further permission from Dove Medical Press Limited, provided the work is properly attributed. For permission for commercial use of this work, please see paragraphs 4.2 and 5 of our Terms.