")
Back to Journals » International Journal of Nephrology and Renovascular Disease » Volume 13
Podocyte Density and Albuminuria in Aging Diabetic Ins2± Mice with or Without Adenosine A1 Receptor Signaling
Authors Faulhaber-Walter R , Jiang L , Mizel D, Zerfas PM, Kopp JB , Schnermann JB, Chen L , Schiffer M
Received 5 February 2019
Accepted for publication 27 November 2019
Published 21 February 2020 Volume 2020:13 Pages 19—26
DOI https://doi.org/10.2147/IJNRD.S203810
Checked for plagiarism Yes
Review by Single anonymous peer review
Peer reviewer comments 3
Editor who approved publication: Professor Pravin Singhal
Robert Faulhaber-Walter, 1–3 Lanping Jiang, 4 Diane Mizel, 2 Patricia M Zerfas, 2 Jeffrey B Kopp, 2 Jurgen B Schnermann, 2 Limeng Chen, 2, 4 Mario Schiffer 3, 5
1Facharztzentrum Aarberg, Waldshut-Tiengen, Germany; 2NIDDK, National Institutes of Health, Bethesda, MD, USA; 3Department of Nephrology, Medical School Hannover, Hannover, Germany; 4Peking Union Medical College Hospital, Beijing, People’s Republic of China; 5Department of Nephrology, University of Erlangen, Erlangen, Germany
Correspondence: Robert Faulhaber-Walter
Facharztzentrum Aarberg, Tannenstrasse 4, Waldshut-Tiengen 79761, Germany
Tel +49-151-27164882
Fax +49-321-21036268
Email [email protected]
Aim of Study: To investigate podocyte density in aging diabetic Ins2± and Ins2±, A1AR-/- mouse models in C57Bl/6 background.
Methods: Ins2± mice and especially Ins2±, adenosine A1 receptor knockout mice (Ins2±, A1AR-/-) are mouse models with a phenotype of diabetic nephropathy. Aged mice (at ∼ 40 weeks) were assessed for glomerular filtration barrier function by measuring albuminuria, glomerular filtration, glomerular damage by electron microscopy, and podocyte numbers by Wilms Tumor protein (WT-1) staining.
Results: Compared to healthy wild-type mice, both diabetic mouse models developed diabetic nephropathy, including hyperfiltration (p< 0.01) and albuminuria (p< 0.05). Typical diabetic structural glomerular and podocyte damage was visualized by electron microscopy. Podocyte count per glomerular area (podocyte density) was significantly decreased in both diabetic mouse models (p< 0.01). In contrast, no significant correlation was detected between albuminuria and absolute podocyte count per glomerulus.
Conclusion: The amount of albuminuria as marker of diabetic nephropathy does not correlate with the podocytes density; however, a relative podocyte deficiency became evident with an increase in glomerular area in the diabetic animals, suggesting a relative podocytopenia.
Keywords: diabetes nephropathy podocyte mouse Akita WT-1
Introduction
Diabetic nephropathy is a serious complication of type 1 and type 2 diabetes mellitus and the most frequent prevalent cause for progression to end-stage renal disease in the developed world with rising incidence.1 Diabetic nephropathy typically progresses through distinct stages with increasing amounts of protein being excreted, advancing from microalbuminuria to overt gross proteinuria and possibly nephrotic syndrome.2 In advanced stages, kidney damage includes glomerulosclerosis, demise of glomerular capillaries, tubulointerstitial atrophy and fibrosis associated with progressive loss of glomerular filtration rate.3 Very early after the onset of diabetes, podocytes frequently show distinguished pathologic and functional features like broadening of the width of foot processes, reduced nephrin expression, increased urinary excretion of nephrin, increased VEGF or TGF-ß/Smad 3.4 Podocyte proteins like nephrin or podocin among others are crucial for maintaining the intact glomerular filtration barrier5 and their dysregulation in the hyperglycaemic milieu leads to diabetic podocytopathy with foot process fusion, effacement and detachment from the glomerular basement membrane.6 In addition, a decline in podocyte numbers has been demonstrated in mouse models of both type 1 and type 2 diabetes, and apoptosis and epithelial-to-mesenchymal transition likely contribute to podocyte loss.7,8 The reduction of podocyte numbers has been associated with the progression of diabetic glomerulosclerosis.9,10 The loss of the intact glomerular filtration barrier seems to be implicated with the increasing amounts of proteinuria which in turn results in tubulointerstitial inflammation and fibrosis.11 The ongoing decline of podocyte numbers has a stronger correlation with the progressive decline of GFR in diabetic nephropathy, than the amount of protein excreted in the urine. This indicates a major role of the podocytes not only in early stages but also in advanced diabetic nephropathy.12,13
To our knowledge, only one study reports data for podocyte numbers of older diabetic mice (OVE26 at ~64 weeks).14 Our own experience with severely diabetic mice suggested that a reduced life expectancy (as for instance in Ins2± models15) causes difficulties maintaining sufficient high sample numbers in the time course of a longitudinal study to gain valid data.16,17 Therefore, in view of the major role of podocyte dysfunction and loss in initiation, development and progression of diabetic nephropathy, our study aimed to further clarify the role of podocytes in aged mice with long-term diabetic nephropathy.
Materials and Methods
Animals
Experiments were performed in mice on a C57Bl/6 background that were bred in our laboratory as described previously.18 In brief: Male Ins2± mice (Ins2±; C57Bl/6 background) from Jackson Laboratories (Bar Harbor, ME, USA) were crossed with female C57Bl/6 wild-type mice. To generate Ins2±, A1AR-/- double mutants, female A1AR-/- mice (C57Bl/6 background) were crossed with male F2 mice heterozygous for both the Ins2± and A1AR mutations. Mice had unrestricted access to tap water and received standard rodent chow (NIH-07 rodent diet), containing 24 cal% protein 12 cal% fat, and 64 cal% carbohydrate. Experiments were performed in male mice of 35–42 weeks of age to assure an advanced diabetic renal phenotype. For electron microscopy, mice from 16 to 46 weeks of age were examined for signs of developing and/or evolved diabetic nephropathy. All animal studies were examined and approved by the Animal Use and Care Committee of the National Institute of Diabetes and Digestive and Kidney Diseases, and carried out in accordance with the National Institutes of Health Guide for the Care and Use of Laboratory Animals.
Glomerular Filtration Rate (GFR)
GFR was measured by single injection FITC inulin clearance as described by Qi et al19 modified to minimize plasma withdrawal. FITC-inulin (5%), dialyzed overnight against 0.9% NaCl (final concentration ~3%), was injected at 3.7 µL/g BW into the retroorbital plexus during brief isoflurane anesthesia (recovery within about 20 s). At 3, 7, 10, 15, 35, 55 and 75 min, the mice were placed in a restrainer, the tail vein was punctured with a 30 g atraumatic needle, and ~2 µL blood was collected into heparinised 5-μL microcaps (Drummond Scientific, Broomall, PA). Five hundred nanolitres of plasma was diluted 1:10 in 500 mmol HEPES (pH 7.4) and measured against a standard curve (1 µL of ~3%-FITC-inulin diluted 1:50, 1:100 and 1:500 in 500 mmol HEPES). Fluorescence was determined in 1.7 µL in a Nanodrop-ND-3300 spectrometer (Nanodrop Technologies Inc, Wilmington, DE). GFR was calculated using a two-compartment model of two-phase exponential decay.
Blood Sampling and Determination of Blood Glucose
Blood samples were taken at midmorning after ~16 h fasting from conscious mice by tail vein puncture using 30 g needles. Blood glucose concentration was measured with Glucostix AccuCheck active (Roche Diagnostics, Indianapolis, IN, USA).
Urine Albumin and Glucose Excretion
Urine collections for 24 hr were obtained in metabolic cages (Hatteras Instruments, Cary, NC, USA) at ambient room temperature with unrestricted access to tap water and standard rodent diet. Urine albumin was measured by ELISA (Albuwell M, Exocell, Philadelphia, PA, USA) according to the manufacturer’s guidelines. Twenty-fourhour albuminuria was calculated from concentration and volume. Urine glucose excretion was calculated from concentration and volume after measuring glucose in urine (for Wt) or 1:10 aqua bidest-diluted urine (for diabetic mice) with Glucostix AccuCheck active (Roche Diagnostics, Indianapolis, IN, USA).
Tissue Sampling and Histochemistry
Selected mice were euthanized by rapid cervical dislocation. Kidneys were excised, gently squeezed to release urine and then weighted to measure the wet kidney weight. Thereafter, the kidneys were cut longitudinally and frozen in liquid nitrogen. Frozen sections were cut under a layer of Tissue-Tek O.C.T. Tissue preparation for histochemistry was provided by Histoserv (Germantown, MD, USA). Three µm sections were cut from paraffin-embedded tissue and stained with haematoxylin–eosin (HE), Masson's trichrome and periodic acid Schiff (PAS)-staining.
Immunolabeling Podocytes and Measurement of Glomerular Area
Tissue sections were dewaxed with xylene and rehydrated with graded ethanol. After boiling in Tris-EDTA buffer (10 mM Tris Base, 1mM EDTA Solution, 0.05% Tween 20, pH 9.0) for 25 min, sections were blocked in 10% normal goat serum with 1% BSA in TBS for 2 hrs at room temperature. Sections were stained with primary WT-1 (Wilms Tumor protein) antibody (Ab89001, Abcam, Cambridge, MA, USA) using ABC Kit (PV-9001, Zhongshan Goldenbridge, Beijing, China) that functions as podocyte marker.20 Figure 1 shows representative WT-1 stained glomerula. Analysis software (Image-Pro Plus 6.0), Media Cybernetics, Rockville, MD) generated a binary image in which the stained number, density and area could be automatically calculated as percentage of every glomerular area. Fifty fields per specimen were randomly selected that covered nearly the whole piece of cortex. Staining and scoring was performed by a single observer who was masked to slide identity.
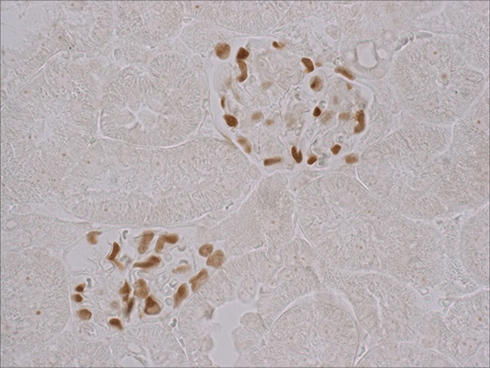 |
Figure 1 WT-1 stained glomeruli. Sections from kidney tissue s were stained with primary WT-1 (Wilms Tumor protein) antibody (Ab89001, Abcam, Cambridge, MA, USA) using ABC Kit (PV-9001, Zhongshan Goldenbridge, Beijing, China) that functions as podocyte marker 400×. |
Electron Microscopy
Kidney tissue specimens were prepared, processed and visualized as described previously.18 Visual analysis was descriptive.
Statistical Analyses
Data are presented as mean ± standard deviation (SD). Multivariable data were compared by one-sided ANOVA with Tukey or Bonferroni post-hoc testing. Two-sided Student's test was used for univariable comparison, adding Welch's correction in case of unequal variances. Correlations were tested by linear regression analysis.
Results
Diabetic Phenotype
The diabetic phenotype of the aged diabetic mice was shown in both Ins2± strains. Mice lacking also the A1-adenosine receptor (Ins2/+-, A1AR-/-) develop a more severe diabetic phenotype and more severe diabetic nephropathy, as described below. Several mice from our study groups died early and did not reach an advanced age of about 40 weeks, as intended in our study. However, those surviving displayed a continuously increasing severity of the diabetic phenotype with age. The same applies for the development of the diabetic nephropathy. Despite our demonstration of severe scarring and sclerosis of the kidney at 27 weeks of age, as reported previously,18 especially in the Ins2±/A1AR-/- model the hallmarks of diabetic nephropathy, like hyperfiltration and overt proteinuria, did not climax but were continuing to worsen further within the observed age span. Thus, both diabetic mouse models developed diabetes and diabetic nephropathy with a progressing phenotype with increasing age. At about 40 weeks of age, the kidneys were significantly hypertrophic compared to wild-type mice (WT) and at least doubled in wet weight. The high fasting blood glucose (WT: 208±29 mg/dl vs. Ins2±: 786±99 mg/dl vs. Ins2±, A1AR-/-: 914±100mg/dl, n=4-6; p<0.001 [Figure 2A]) led to a significant rise in glucosuria that was accompanied by a very large increase of daily urine volume in both diabetic mouse models. Moreover, as expected, the double knockout model displayed a more pronounced diabetic phenotype compared to the Ins2±, excreting up to ~12 g of glucose daily in a urine volume that reached about half its body weight. The metabolic disturbance caused significant albuminuria, the hallmark of diabetic nephropathy. However, the glomerular filtration rate per g of bodyweight was still hypercompensated, with a significant hyperfiltration in both diabetic mice models, and particularly pronounced in the double knockout model (GFR/g/Bw: WT: 732±149 µL/100g BW vs. Ins2±: 1743±360 µL/100g BW vs. Ins2±/A1AR-/-: 2795±541 µL/100g BW, n=4-6; p<0.001 [Figure 2B]). Table 1 summarizes the main findings.
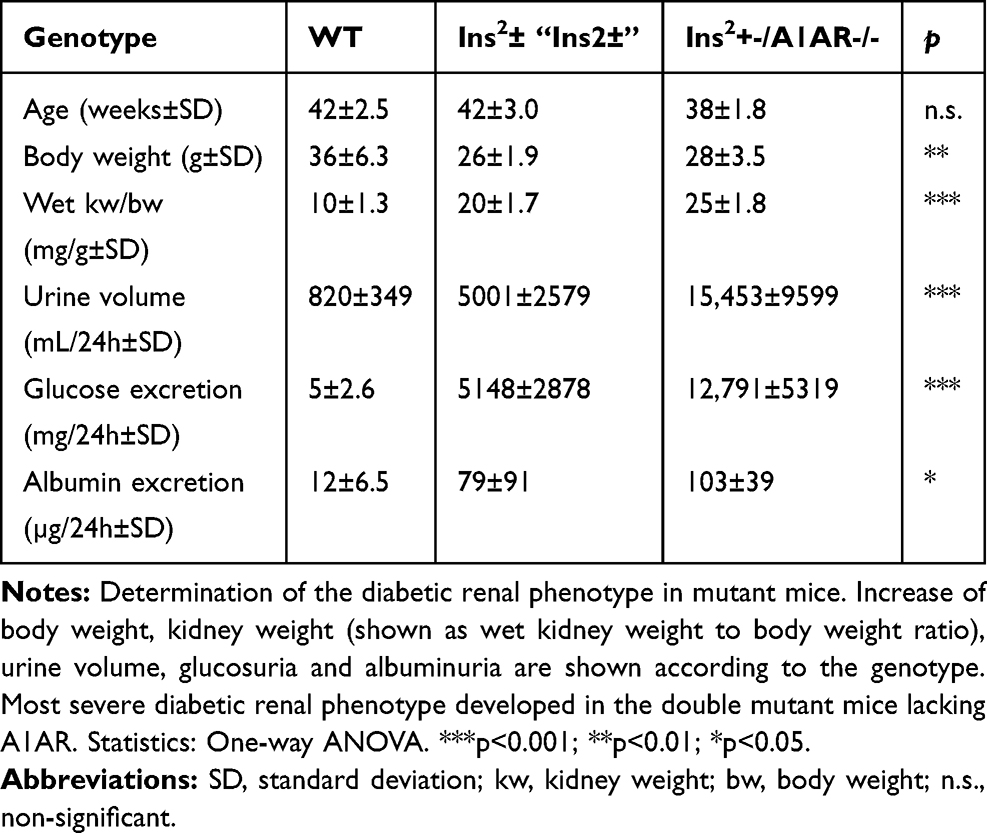 |
Table 1 Diabetic Phenotype: Characteristics of Mice, Age >37 Weeks |
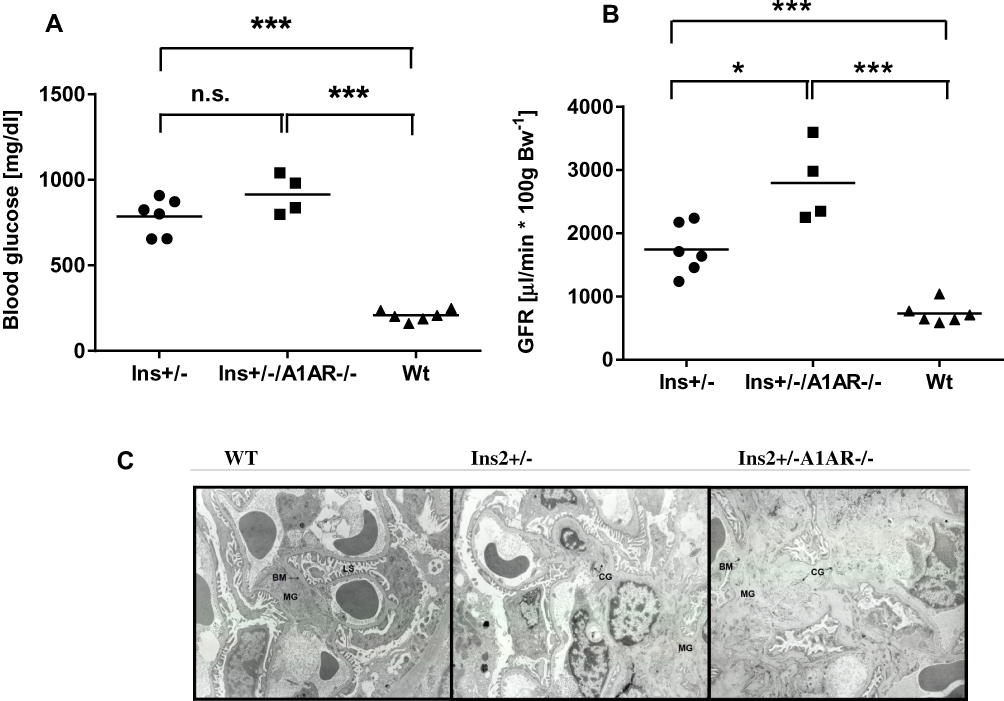 |
Figure 2 (A) Fasting blood glucose. Both diabetic phenotypes increased fasting blood glucose compared to the Wt mice, with the highest levels in the double mutant mice lacking A1AR. Whole blood glucose in mg/dl after 12–16 h fasting period. Wt vs. Ins2± and Ins2±/A1AR-/- mice. n=4-6; age 39 weeks; *** p<0.0001. (B) FITCI-GFR. Significant hyperfiltration in the mutant diabetic mice, with the highest values in the double mutant mice lacking A1AR, shown by Fluorescence-inulin-thiocyanate (FITCI) single bolus excretion kinetics glomerular filtration rate calculated as µL/min by 100 g of body weight. Wt vs. Ins2± and Ins2±, A1AR-/- mice. n=4-6; age 39 weeks; *p<0.05, ***p<0.0001. (C) Fibrotic lesions in diabetic nephropathy of adult mice. Electron-microscopic images of mice kidney samples at ~25 weeks of age demonstrate pronounced mesangial expansion with thickening of basal membrane, compression of luminal space and diffuse deposition of collagen fibres in Ins2±A1AR-/- kidney, consistent with severe diabetic nephropathy. Milder diabetic lesions in Ins2± kidney. Enlargement x11880. Abbreviations: n.s., non-significant; MG, mesangium; BM, basal membrane; LS, Luminal Space; CG, Collagen fibres. |
Histology
In our previous study light microscopy analysis revealed a significant increase of PAS-positive material in the mesangial areas of the adult diabetic Ins2±, A1AR-/- mouse, present at 26 weeks, compared to the diabetic Ins2± mouse and normal glomeruli in the WT mouse.18 Interestingly, in that study we could not find significant mesangial expansion in the Ins2± mice despite the diabetic phenotype, suggesting a protecting effect of the tubular glomerular feedback mechanism in diabetic nephropathy. However, progressive diabetic nephropathy features interstitial fibrosis and glomerulosclerosis. Therefore, in this study, electron microscopic sampling was employed to visualize the extent of structural diabetic lesions: The differences between WT, Ins2± and Ins2±/A1AR-/- mice were clearly apparent at 25 weeks of age. Both diabetic mouse models displayed an increased amount of collagen fibers, thickening of the glomerular basement membrane and compression of the glomerular capillary lumens. Effacement of podocyte foot processes as one sign of diabetic podocytopathy was clearly visible in both Ins2± models, but again much more pronounced in the Ins2±/A1AR-/-, consistent with a more advanced phenotype (Figure 2C).
Podocyte Count and Glomerular Size
We found no difference in absolute podocyte numbers, as determined by WT-1 staining. The means of 50 measurements per specimen in each group were n=17.6±5.2 in Ins2± vs. n= 18.9±5.4 in Ins2±, A1AR-/- vs. 18.3±5.6 in WT mice (ANOVA: n.s.) (Figure 3A). The WT-1 positive area as well did not differ significantly, but an enlarged WT-1 positive area was obvious in the Ins2±, A1AR-/- mice compared to the Ins2± and the wild-type mice (308.8±122 µm2 vs. 256.8 ±100 µm2 vs. 259.7±103.5 µm2; ANOVA: n.s.; t-test diabetic groups: p=0.159, data not shown). The effect could possibly be explained by a trend towards enlargement of the podocyte nuclei in A1AR-/- mice, but further inquiries to enlighten this finding were not part of the current project.
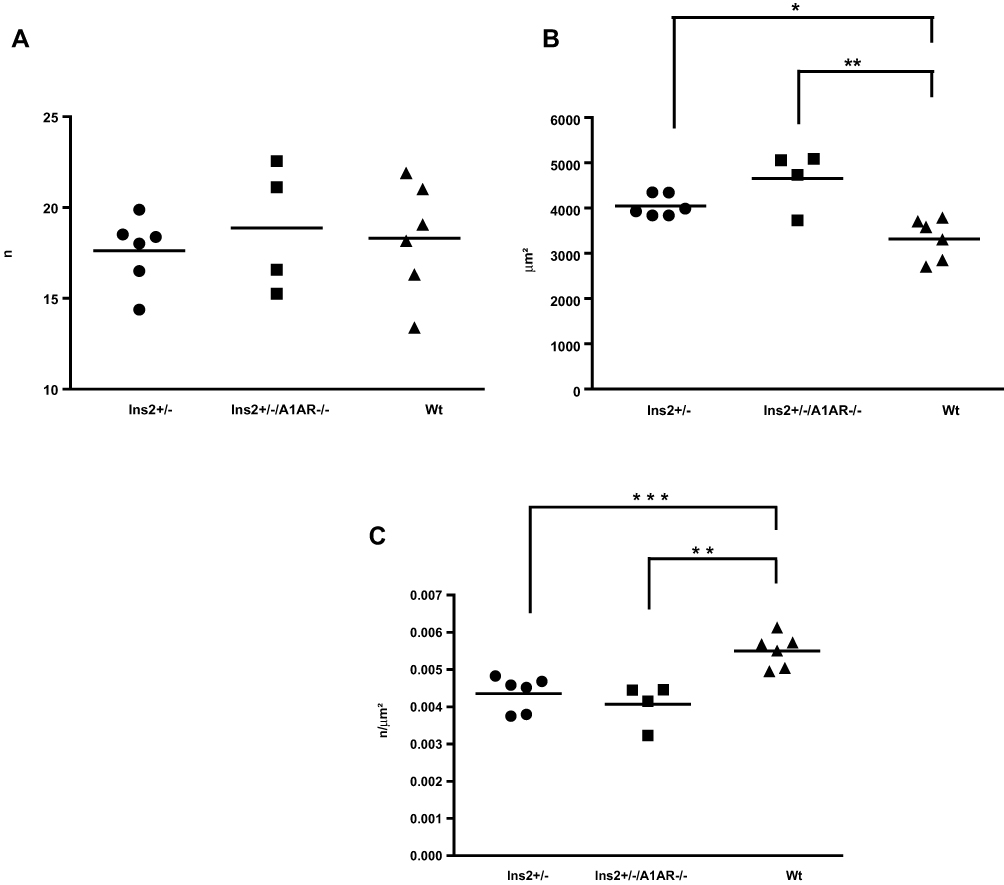 |
Figure 3 (A) Absolute podocyte numbers. No significant differences of absolute numbers of podocytes after immunostaining of glomeruli for the specific podocyte marker Wilms-tumor-1 antigen (WT-1). n=mean of 50 measurements per specimen. Mean per group. (B) Glomerular area. Glomeruli were enlarged in both Ins2± and Ins2±/A1AR-/- mice, with a non-significantly greater effect in the latter. Glomerular area calculated by computerized automated scoring of 50 glomeruli. Mean per group. *p<0.05, **p<0.01. (C) Podocytes per glomerular area (podocyte density). Podocyte density was reduced both in Ins2± and Ins2±/A1AR-/- mice compared to WT mice. Mean per group. **p<0.01, ***p<0.001. |
As expected, the diabetic phenotype led to a highly significant glomerular hypertrophy of both aged diabetic phenotypes when compared to the WT mice (Ins2±, A1AR-/-: 4.65±1.2 mm2 vs. Ins2±: 4.05±1.0 mm2 vs. wild-type 3.32±1.0 mm2; ANOVA p<0.01) (Figure 3B). Loss of the adenosine A1 receptor function resulted in a more pronounced increase of the glomerular area when compared to the pure Ins2± diabetic phenotype; however, due to the small sample size the trend was not significant (p=0.062). Therefore, the relative podocyte densities were significantly reduced in both diabetic phenotypes compared to the WT mice (Figure 3C).
Albuminuria versus Podocyte Numbers
Although glomerular hypertrophy was not clearly different between the two diabetic models, the Ins2±, A1AR-/- mice had a significantly higher urine albumin excretion compared to the WT and the Ins2± mice. Of note, there was no proportional correlation of albuminuria of the Ins2±, A1AR-/- model in comparison to the Ins2± mouse model. In addition, there was no correlation of albuminuria and absolute podocyte numbers (data not shown). Therefore, the amount of albuminuria as an indicator of disease severity was not determined by the absolute number of podocytes in this model of diabetic nephropathy. When we correlated albuminuria in the 24 hr urine with the number of podocytes per unit glomerular area (podocyte density), we found, that with aggravating diabetic phenotype, the correlation was increasingly lost, with R2=0.0613 in the Ins2± model and R2=0.0089 in the Ins2±, A1AR-/- model (Figure 4).
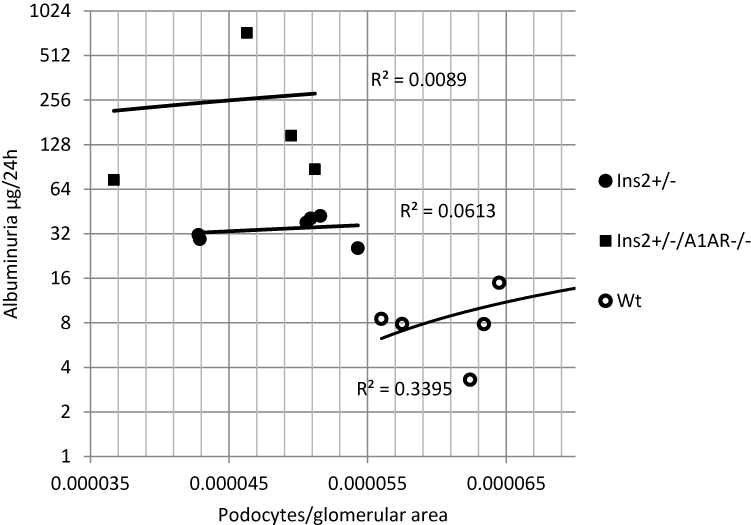 |
Figure 4 24h-albuminuria vs. podocyte density. Log2- display of total 24 h albuminuria versus podocytes per glomerular area (podocyte density). Linear regression analysis. R2 values (=coefficients of determination) show a decreasing trend of correlation of albuminuria and podocyte density with the severity of diabetic phenotype. |
Discussion
In our study, we focused on the correlation of a diabetic nephropathy phenotype with the podocyte numbers in two different Ins2± mice strains. Next to the well-characterized and commercially available (Jax laboratories) Ins2± (Akita) strain, we used a self-bred double mutant strain (Ins2±, A1AR-/-), that lacks the adenosine A1 receptor and develops a more pronounced diabetic phenotype and nephropathy.17,18 Our main findings were to demonstrate the progressive worsening with age of the dysregulated hyperglycaemic phenotype with increasing blood glucose levels, rising urinary glucose excretion, rising glomerular hyperfiltration and increasing albuminuria in both diabetic mouse models, but especially in the Ins2+, -A1AR-/-. In contrast, this progression of severity does not seem to concur with a progressive loss of absolute podocyte numbers. We conclude that in the late phases of diabetic nephropathy in aging mice, podocytopathy does not play the same pathophysiological role in the Ins2± mouse model of type 1 diabetes as it does in early and moderate diabetic nephropathy.
Podocytes are responsive to insulin, glucose, AGE and TGF-β, which are important factors of the diabetic milieu that promote podocyte survival, cellular hypertrophy and apoptosis.21–23 We previously described that in the early phase of diabetes there is an initial loss of podocytes that is detectable coinciding with the beginning of hyperglycaemia. After that, the number of podocytes appears stable, while proteinuria further increases.7 This indicates that the remaining podocytes are able to adapt to the diabetic conditions, presumably via a change in their metabolic profile.22
Our results confirm now, that in our chosen mouse model of type 1 diabetes with diabetic nephropathy, the podocyte numbers do not play a major role for the peculiarity of the phenotype in terms of proteinuria. Although we could clearly define a much more pronounced diabetic phenotype in the Ins2±. A1AR-/- model compared to the Ins2± mouse, the differences in absolute podocyte numbers and podocyte density were not significant. Therefore, these data do not support a leading role for the injured podocyte function in progression of the diabetic nephropathy in the chosen models of aging diabetic mice. It is well known that the amounts of proteinuria correlate with the dynamics of loss of glomerular function since it is a measure of glomerular and tubular injury in diabetic nephropathy. After an initial loss of podocyte integrity, detectable as microalbuminuria,24 with progress through the stages of diabetic nephropathy, the amount of proteinuria gradually increases, e.g. to overt proteinuria or even a nephrotic range proteinuria, and may change in pattern to a, for instance, selective-glomerular type or even non-selective-glomerular and tubular type of proteinuria. The occurrence of protein in the urine is also a function of an increased glomerular filtration and reduced tubular reabsorption urinary protein. Thus, the changing pattern that occurs during the progression of diabetic nephropathy probably reflects a differentiation of the causal mechanisms. Due to cytokines like TGF-β and others, the progressive diabetic nephropathy in later stages is eventually dominated by interstitial fibrosis and nephron loss, which finally terminates the kidney function. Thereby, in view of our results, the role of the podocyte after initiating the disease process seems not to be a leading trigger for further progress through the later stages. Our data show that absolute podocyte numbers remain relatively stable in the advanced stages of diabetic nephropathy in the Ins2± mouse model and do not correlate to the amount of albuminuria. However, we speculate, that the decreased podocytes density of the increased glomerular size of the diabetic kidney indicates reduced total functional efficacy of the remaining podocyte population, thus nevertheless contributing to the diabetic renal phenotype.
The pursuit of the optimal mouse model for advanced diabetic nephropathy continues.
Two well-established contenders are the Ins2± mouse25 and STZ induced eNOS-/-26,27 model of type 1 diabetes. Alpers and Hudkins, in a recent review,28 have discussed two newer models: BTBR ob/ob, a genetically engineered type 2 mouse model in C57bl/6 background which lacks leptin,29 the other, a diabetes type 1 model, the OEV26 mouse.30 Investigations into the role of podocytes in these diabetic nephropathy models mostly were obtained by studying the mouse models in early or moderately progressed diabetic nephropathy the Ins2± model with 28 weeks being an example.7 Our study is limited since we studied podocyte number but not podocyte function or differentiation. Thus, more studies in advanced aged study populations of diabetic mice should be undertaken since this age group might mirror the long-term diabetic nephropathy in many of the human patients we treat.
Acknowledgments
This work was funded in part by a Postdoctoral Fellowship award to RFW within the Intramural Research Program of the National Institutes of Health, National Institute of Diabetes and Digestive and Kidney Diseases, Bethesda, Maryland, USA. LC was funded by the National Natural Scientific Foundation, China (Grant No.81470937).
The data were presented in part as poster contributions at the Annual Meeting of the German Society of Nephrology 2011 in Munich, Germany and at the Annual Meeting of Chinese Nephrologists 2011 in Zhengzhou, China (best abstract reward).
Disclosure
Dr Robert Faulhaber-Walter reports Postdoctoral Fellowship award within the Intramural Research Program of the National Institutes of Health, during the conduct of the study. Prof Dr Limeng Chen reports grants from Baxter’s Global Scientific Review Council: Renal PD Grant Program, outside the submitted work. Prof. Dr. Mario Schiffer reports grants from Bundesministerium fuer Bildung und Forschung (#01GM1901D). The authors declare no other conflict of interest.
References
1. Reutens AT, Atkins RC. Epidemiology of diabetic nephropathy. Contrib Nephrol. 2011;170:1–7.
2. Mogensen CE, Christensen CK, Vittinghus E. The stages in diabetic renal disease. With emphasis on the stage of incipient diabetic nephropathy. Diabetes. 1983;32(Suppl 2):64–78. doi:10.2337/diab.32.2.S64
3. Najafian B, Alpers CE, Fogo AB. Pathology of human diabetic nephropathy. Contrib Nephrol. 2011;170:36–47.
4. Wolf G, Ziyadeh FN. Cellular and molecular mechanisms of proteinuria in diabetic nephropathy. Nephron Physiol. 2007;106(2):p26–p31. doi:10.1159/000101797
5. Mundel P, Shankland SJ. Podocyte biology and response to injury. J Am Soc Nephrol. 2002;13(12):3005–3015. doi:10.1097/01.ASN.0000039661.06947.FD
6. Stitt-Cavanagh E, MacLeod L, Kennedy C. The podocyte in diabetic kidney disease. ScientificWorldJournal. 2009;9:1127–1139. doi:10.1100/tsw.2009.133
7. Susztak K, Raff AC, Schiffer M, Bottinger EP. Glucose-induced reactive oxygen species cause apoptosis of podocytes and podocyte depletion at the onset of diabetic nephropathy. Diabetes. 2006;55(1):225–233. doi:10.2337/diabetes.55.01.06.db05-0894
8. Li Y, Kang YS, Dai C, Kiss LP, Wen X, Liu Y. Epithelial-to-mesenchymal transition is a potential pathway leading to podocyte dysfunction and proteinuria. Am J Pathol. 2008;172(2):299–308. doi:10.2353/ajpath.2008.070057
9. Pagtalunan ME, Miller PL, Jumping-Eagle S, et al. Podocyte loss and progressive glomerular injury in type II diabetes. J Clin Invest. 1997;99(2):342–348. doi:10.1172/JCI119163
10. Yamaguchi Y, Iwano M, Suzuki D, et al. Epithelial-mesenchymal transition as a potential explanation for podocyte depletion in diabetic nephropathy. Am J Kidney Dis. 2009;54(4):653–664. doi:10.1053/j.ajkd.2009.05.009
11. Ziyadeh FN, Wolf G. Pathogenesis of the podocytopathy and proteinuria in diabetic glomerulopathy. Curr Diabetes Rev. 2008;4(1):39–45. doi:10.2174/157339908783502370
12. Yu D, Petermann A, Kunter U, Rong S, Shankland SJ, Floege J. Urinary podocyte loss is a more specific marker of ongoing glomerular damage than proteinuria. J Am Soc Nephrol. 2005;16(6):1733–1741. doi:10.1681/ASN.2005020159
13. Steffes MW, Schmidt D, McCrery R, Basgen JM. Glomerular cell number in normal subjects and in type 1 diabetic patients. Kidney Int. 2001;59(6):2104–2113. doi:10.1046/j.1523-1755.2001.00725.x
14. Teiken JM, Audettey JL, Laturnus DI, Zheng S, Epstein PN, Carlson EC. Podocyte loss in aging OVE26 diabetic mice. Anat Rec (Hoboken). 2008;291(1):114–121. doi:10.1002/ar.20625
15. Naito M, Fujikura J, Ebihara K, et al. Therapeutic impact of leptin on diabetes, diabetic complications, and longevity in insulin-deficient diabetic mice. Diabetes. 2011;60(9):2265–2273. doi:10.2337/db10-1795
16. Faulhaber-Walter R unpublished data. 2013.
17. Faulhaber-Walter R, Jou W, Mizel D, et al. Impaired glucose tolerance in the absence of adenosine A1 receptor signaling. Diabetes. 2011;60(10):2578–2587. doi:10.2337/db11-0058
18. Faulhaber-Walter R, Chen L, Oppermann M, et al. Lack of A1 adenosine receptors augments diabetic hyperfiltration and glomerular injury. J Am Soc Nephrol. 2008;19(4):722–730. doi:10.1681/ASN.2007060721
19. Qi Z, Whitt I, Mehta A, et al. Serial determination of glomerular filtration rate in conscious mice using FITC-inulin clearance. Am J Physiol Renal Physiol. 2004;286(3):F590–F596. doi:10.1152/ajprenal.00324.2003
20. Sanden SK, Wiggins JE, Goyal M, Riggs LK, Wiggins RC. Evaluation of a thick and thin section method for estimation of podocyte number, glomerular volume, and glomerular volume per podocyte in rat kidney with wilms’ tumor-1 protein used as a podocyte nuclear marker. J Am Soc Nephrol. 2003;14(10):2484–2493. doi:10.1097/01.ASN.0000089829.45296.7C
21. Coward RJ, Welsh GI, Yang J, et al. The human glomerular podocyte is a novel target for insulin action. Diabetes. 2005;54(11):3095–3102. doi:10.2337/diabetes.54.11.3095
22. Stieger N, Worthmann K, Schiffer M. The role of metabolic and haemodynamic factors in podocyte injury in diabetes. Diabetes Metab Res Rev. 2011;27(3):207–215. doi:10.1002/dmrr.v27.3
23. Schiffer M, Park JK, Tossidou I, et al. Erythropoietin prevents diabetes-induced podocyte damage. Kidney Blood Press Res. 2008;31(6):411–415. doi:10.1159/000186368
24. Fornoni A. Proteinuria, the podocyte, and insulin resistance. N Engl J Med. 2010;363(21):2068–2069. doi:10.1056/NEJMcibr1008395
25. Yoshioka M, Kayo T, Ikeda T, Koizumi A. A novel locus, Mody4, distal to D7Mit189 on chromosome 7 determines early-onset NIDDM in nonobese C57BL/6 (Akita) mutant mice. Diabetes. 1997;46(5):887–894. doi:10.2337/diab.46.5.887
26. Nakagawa T. A new mouse model resembling human diabetic nephropathy: uncoupling of VEGF with eNOS as a novel pathogenic mechanism. Clin Nephrol. 2009;71(2):103–109. doi:10.5414/CNP71103
27. Kanetsuna Y, Takahashi K, Nagata M, et al. Deficiency of endothelial nitric-oxide synthase confers susceptibility to diabetic nephropathy in nephropathy-resistant inbred mice. Am J Pathol. 2007;170(5):1473–1484. doi:10.2353/ajpath.2007.060481
28. Alpers CE, Hudkins KL. Mouse models of diabetic nephropathy. Curr Opin Nephrol Hypertens. 2011;20(3):278–284. doi:10.1097/MNH.0b013e3283451901
29. Hudkins KL, Pichaiwong W, Wietecha T, et al. BTBR Ob/Ob mutant mice model progressive diabetic nephropathy. J Am Soc Nephrol. 2010;21(9):1533–1542. doi:10.1681/ASN.2009121290
30. Zheng S, Noonan WT, Metreveli NS, et al. Development of late-stage diabetic nephropathy in OVE26 diabetic mice. Diabetes. 2004;53(12):3248–3257. doi:10.2337/diabetes.53.12.3248
 © 2020 The Author(s). This work is published and licensed by Dove Medical Press Limited. The full terms of this license are available at https://www.dovepress.com/terms.php and incorporate the Creative Commons Attribution - Non Commercial (unported, v3.0) License.
By accessing the work you hereby accept the Terms. Non-commercial uses of the work are permitted without any further permission from Dove Medical Press Limited, provided the work is properly attributed. For permission for commercial use of this work, please see paragraphs 4.2 and 5 of our Terms.
© 2020 The Author(s). This work is published and licensed by Dove Medical Press Limited. The full terms of this license are available at https://www.dovepress.com/terms.php and incorporate the Creative Commons Attribution - Non Commercial (unported, v3.0) License.
By accessing the work you hereby accept the Terms. Non-commercial uses of the work are permitted without any further permission from Dove Medical Press Limited, provided the work is properly attributed. For permission for commercial use of this work, please see paragraphs 4.2 and 5 of our Terms.