")
Back to Journals » OncoTargets and Therapy » Volume 11
Platelet-to-lymphocyte ratio and lymphocyte-to-white blood cell ratio predict the efficacy of neoadjuvant chemotherapy and the prognosis of locally advanced gastric cancer patients treated with the oxaliplatin and capecitabine regimen
Authors Tang C, Cheng X, Yu S, Wang Y, Hou J, Li Q, Shen Z, Liu T , Cui Y
Received 10 June 2018
Accepted for publication 14 September 2018
Published 17 October 2018 Volume 2018:11 Pages 7061—7075
DOI https://doi.org/10.2147/OTT.S176768
Checked for plagiarism Yes
Review by Single anonymous peer review
Peer reviewer comments 2
Editor who approved publication: Dr XuYu Yang
Cheng Tang,1 Xi Cheng,1 Shan Yu,1 Yan Wang,1 Jun Hou,2 Qian Li,1 Zhenbin Shen,3 Tianshu Liu,1 Yuehong Cui1
1Department of Medical Oncology, Zhongshan Hospital, Fudan University, Shanghai, China; 2Department of Pathology, Zhongshan Hospital, Fudan University, Shanghai, China; 3Department of General Surgery, Zhongshan Hospital, Fudan University, Shanghai, China
Background: Many studies have discussed the relationship between routine blood parameters and the prognosis of gastric cancer patients; however, few studies focused on the association of routine blood parameters with the efficacy of neoadjuvant chemotherapy (NAC).
Patients and methods: We retrospectively collected routine blood parameters and other clinicopathological data of 104 patients with locally advanced gastric cancer (LAGC) who received the oxaliplatin and capecitabine regimen as NAC from June 2010 to March 2016. The objective response rate (ORR), pathological remission rate (pRR), overall survival (OS), and time to recurrence (TTR) were analyzed through different statistical methods, such as Chi-squared test, log-rank test, logistic regression, and Cox regression.
Results: In the multivariate analysis, a high platelet-to-lymphocyte ratio (PLR) (≥130.7) predicted a low ORR (OR =5.927, 95% CI: 2.184–16.089) and a low pRR (OR =8.343, 95% CI: 2.178–31.962), while a high lymphocyte-to-white blood cell ratio (LWR) (≥0.228) independently predicted a high ORR (OR =0.118, 95% CI: 0.031–0.448) and a high pRR (OR =0.096, 95% CI: 0.021–0.426). High lymphocyte level (≥1.750×10⁹/L) was an independent predictor of long OS (HR =0.428, 95% CI: 0.190–0.964) and long TTR (HR =0.328, 95% CI: 0.156–0.690). High monocyte level (≥0.215×10⁹/L) was associated with a high pRR (OR =0.072, 95% CI: 0.008–0.636) and a long OS (HR = 0.506, 95% CI: 0.257–0.997).
Conclusion: In patients with LAGC treated with the oxaliplatin and capecitabine regimen as NAC, a low PLR (<130.7) and a high LWR (≥0.228) independently predicted a high ORR and pRR. High monocyte level (≥0.215×10⁹/L) was an independent predictor for a high pRR and long OS, while patients with high lymphocyte level (≥1.750×10⁹/L) tended to have a long OS and TTR.
Keywords: chemotherapy, PLR, LWR, gastric cancer
Introduction
Recently, several large-scale studies have confirmed the effect of neoadjuvant chemotherapy (NAC) in the treatment of locally advanced gastric cancer (LAGC).1,2 The capecitabine and oxaliplatin (CAPOX) regimen is one of the recommended NACs.3 The use of NAC has several potential benefits, including controlling micro-metastasis, increasing the chance of complete pathological response and the rate of R0 resection, and helping choose the postoperative regimen based on the pathological response.4
Researchers are continuously devoted to seeking predictors in gastric cancer (GC) patients who received NAC. It has been reported that lymph node stage, neural invasion, serum CA199 level, and resection type were associated with the disease-free survival (DFS) or overall survival (OS) of GC patients treated with NAC.5 In addition, a growing body of studies investigating the influence of routine blood parameter ratios on prognosis have been published recently6,7 and there are several potential reasons for this intriguing trend: first, these ratios, such as the neutrophil-to-lymphocyte ratio (NLR),6,8 lymphocyte-to-monocyte ratio (LMR),9 and platelet-to-lymphocyte ratio (PLR),10 reflect the systemic inflammatory response11 and emerging evidence indicates that inflammation plays a critical role in tumor initiation and progression12,13 and, second, routine blood results are easy to obtain and blood sampling is a safe procedure. Therefore, we think it necessary to investigate whether routine blood parameters and their ratios prior to chemotherapy can predict the efficacy of NAC in GC patients.
Patients and methods
Patient selection
One hundred and four eligible patients were enrolled from June 2010 to March 2016. The inclusion criteria for the study were as follows: 1) locally advanced gastric adenocarcinoma; 2) the CAPOX regimen as NAC; 3) gastrectomy with lymph node dissection and pathological evaluation for patients with no signs of disease progression, otherwise chemotherapy regimen would be changed; 4) Eastern Cooperative Oncology Group (ECOG) performance status ≤1; 5) available routine blood results before chemotherapy; 6) measurable tumor lesion or lymph node metastasis evaluated by multidetector spiral computed tomography (CT) scanning; and 7) no prior anticancer treatment. Tumors were staged according to the American Joint Committee on Cancer (AJCC) TNM stage classification, seventh edition, for GC.14 The CAPOX regimen was delivered every 3 weeks: oxaliplatin (130 mg/m2) was administered by intravenous infusion over a period of 2 hours on day 1 and capecitabine (1,000 mg/m2) was administered orally twice daily from days 1 to 14. The ethics committee of Zhongshan Hospital Affiliated to Fudan University has approved this study, and the written informed consent was obtained from each patient before sample collection.
Follow-up
After initiating CAPOX, each patient was followed up regularly until July 2017 or death. The follow-up periods varied from 5 to 83 months, with a median follow-up period of 25 months. Medical histories and physical examinations were obtained every cycle. CT scans were performed every two chemotherapy cycles before the operation and every 3 months after the operation. When severe toxic effects occurred,15 the dosage of CAPOX was reduced by 25%–50%. The response to therapy was generally judged in the following two ways: through CT scans according to Response Evaluation Criteria in Solid Tumors (RECIST),16 which defines a complete response (CR) and a partial response (PR) as objective responses, and through pathological evaluation using surgery specimens in accordance with the Sataloff method,17 which defines tumor shrinkage greater than 50% as pathological remission and all other cases as no pathological remission. OS was calculated from diagnosis to death or the date of the last follow-up. Time to recurrence (TTR) was calculated from diagnosis to cancer recurrence, distant metastasis, or the last follow-up.
Blood sample analysis
All peripheral blood samples were collected in tubes containing EDTA before chemotherapy. Blood cell counts, including white blood cell (WBC), granulocyte, lymphocyte, monocyte, red blood cell (RBC), blood platelet, and hemoglobin, were detected by a XT-1800i Automated Hematology System (Sysmex, Shanghai, China). The monocyte-to-WBC ratio (MWR), lymphocyte-to-WBC ratio (LWR), NLR, derived neutrophil-to-lymphocyte ratio (dNLR), PLR, and LMR were calculated from peripheral blood cell counts.
Statistical analysis
The baseline routine blood results of eligible patients were presented as the median and range. The optimal cutoff levels of routine blood parameters, such as MWR, LWR, NLR, dNLR, PLR, and LMR, were determined by receiver operating curve (ROC) analysis.18 The objective response rate (ORR) was applied to select the optimal cutoff points. The Chi-squared test or Fisher’s exact test was used to compare the number of patients with an objective response or pathological remission between groups. Median OS or TTR and the corresponding 95% CI were calculated by Kaplan–Meier (K–M) survival analysis, and the significance was evaluated by the log-rank test. The predictors of objective response and pathological remission were determined by multivariate analysis using a logistic regression model, and the predictors of OS and TTR were evaluated by multivariate analysis using Cox’s proportional hazards model. All statistical analyses were conducted using the SPSS 17.0 software (IBM Corporation, Armonk, NY, USA). P-values less than 0.05 indicated statistical significance.
Results
The baseline characteristics of eligible patients
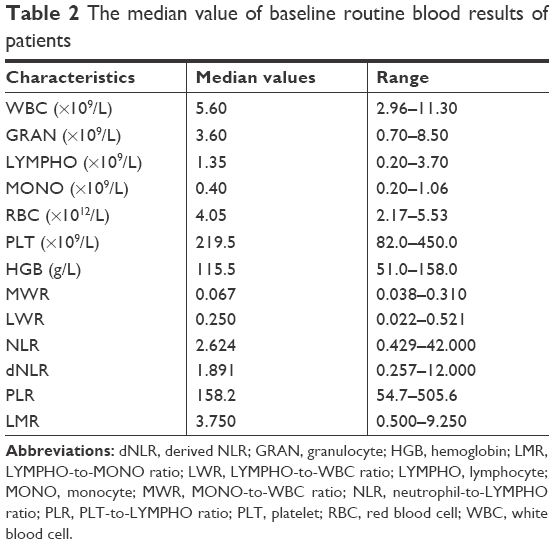
A total of 104 patients who were diagnosed with LAGC and received CAPOX as NAC were studied retrospectively in our hospital. Among these patients, there were 74 (71.2%) males and 30 (28.8%) females aged 31–78 years. According to Lauren’s classification, the numbers of intestinal, mixed, and diffusal type carcinoma were 50 (48.1%), 20 (19.2%), and 34 (32.7%), respectively. Upon classification by tumor location, 29 (27.9%), 38 (36.5%), and 37 (35.6%) patients had tumors located at the cardia and fundus, angle and body, and antrum, respectively. Clinical tumor staging was based on the seventh edition of the AJCC TNM classification, and details are listed in Table 1. The median value and range of each baseline routine blood parameter among eligible patients are listed in Table 2.
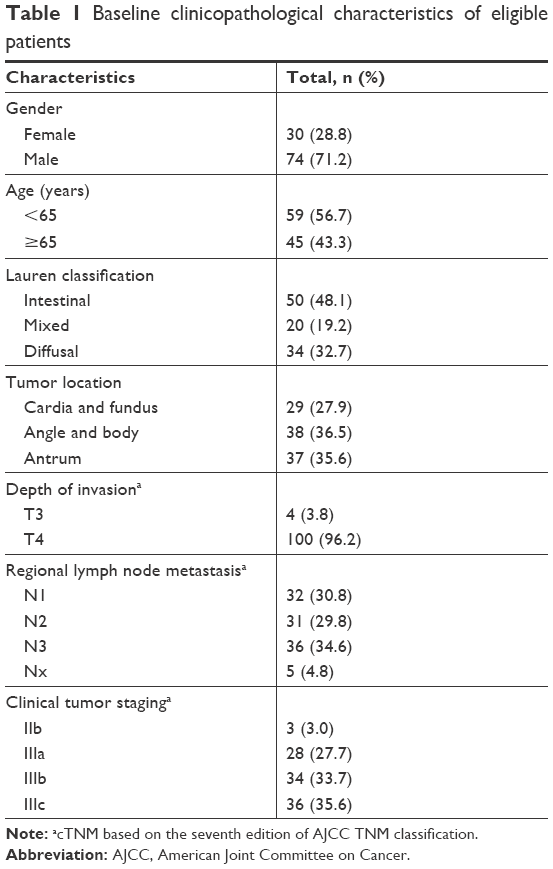 | Table 1 Baseline clinicopathological characteristics of eligible patients |
 | Table 2 The median value of baseline routine blood results of patients |
Efficacy of chemotherapy and patient survival analysis
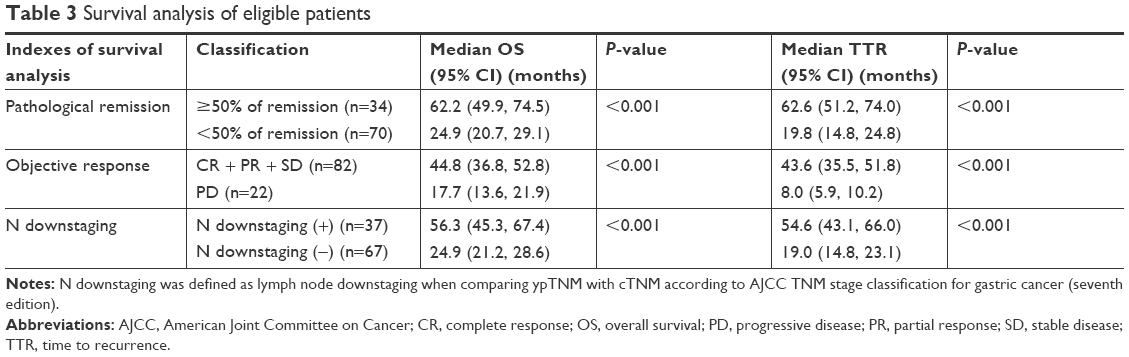
During the follow-up period, 82 (78.8%) patients achieved CR, PR, or stable disease (SD) by CT scans and subsequently underwent surgery, whereas 22 (21.2%) patients had local recurrence or distant metastasis. The median TTR and OS were 17.5 and 25.0 months, respectively. The 3-year recurrence-free survival rate and the OS rate were 37.8 and 42.9%, respectively. Among the patients who underwent surgery, 34 (41.5%) patients achieved pathological remission.
Patients with ≥50% of pathological remission had a much longer OS (P<0.001) and TTR (P<0.001). The median OS in patients with ≥50 and <50% of pathological remission was 62.2 and 24.9 months, respectively. The median TTR in patients with ≥50 and <50% of pathological remission was 62.6 and 19.8 months, respectively (Table 3). Figure 1 illustrates pathological sections from four patients: two patients (one intestinal type GC + one diffusal type GC) showed pathological remission and the other two patients (one intestinal type GC + one diffusal type GC) showed no pathological remission. In addition, the patients with CR, PR, or SD had longer OS and TTR. The patients with N downstaging after NAC also tended to have longer OS and TTR (Table 3). Figure 2 shows the K–M curves for OS or TTR according to pathological remission, objective response, and N downstaging.
 | Table 3 Survival analysis of eligible patients |
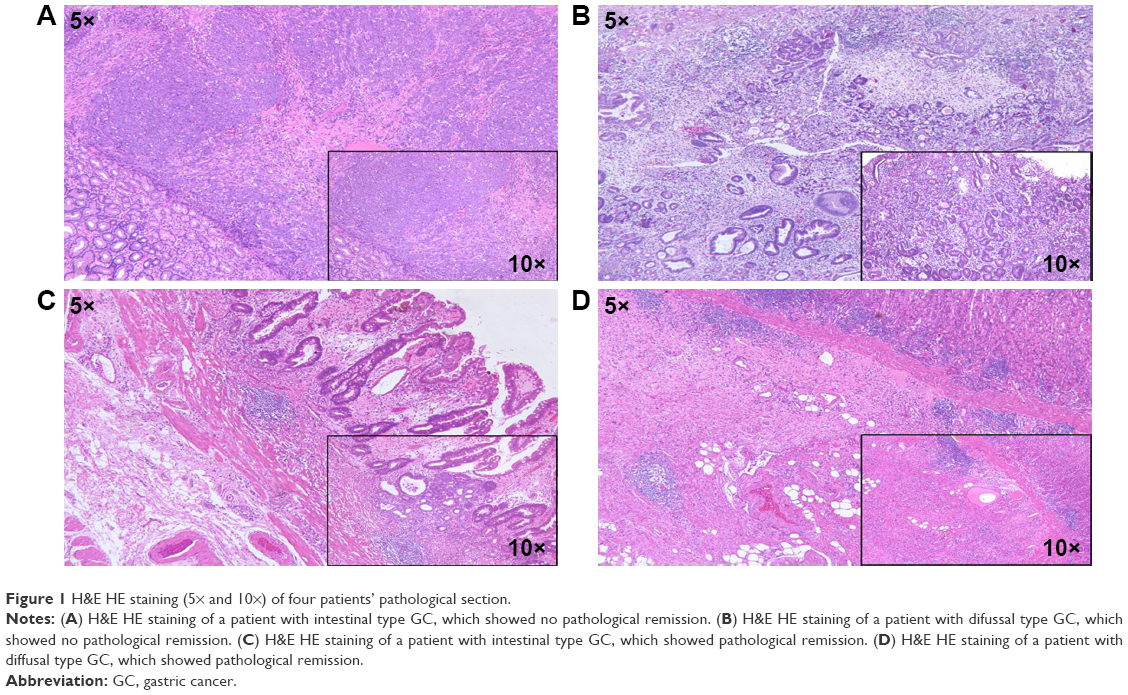 | Figure 1 H&E HE staining (5× and 10×) of four patients’ pathological section. |
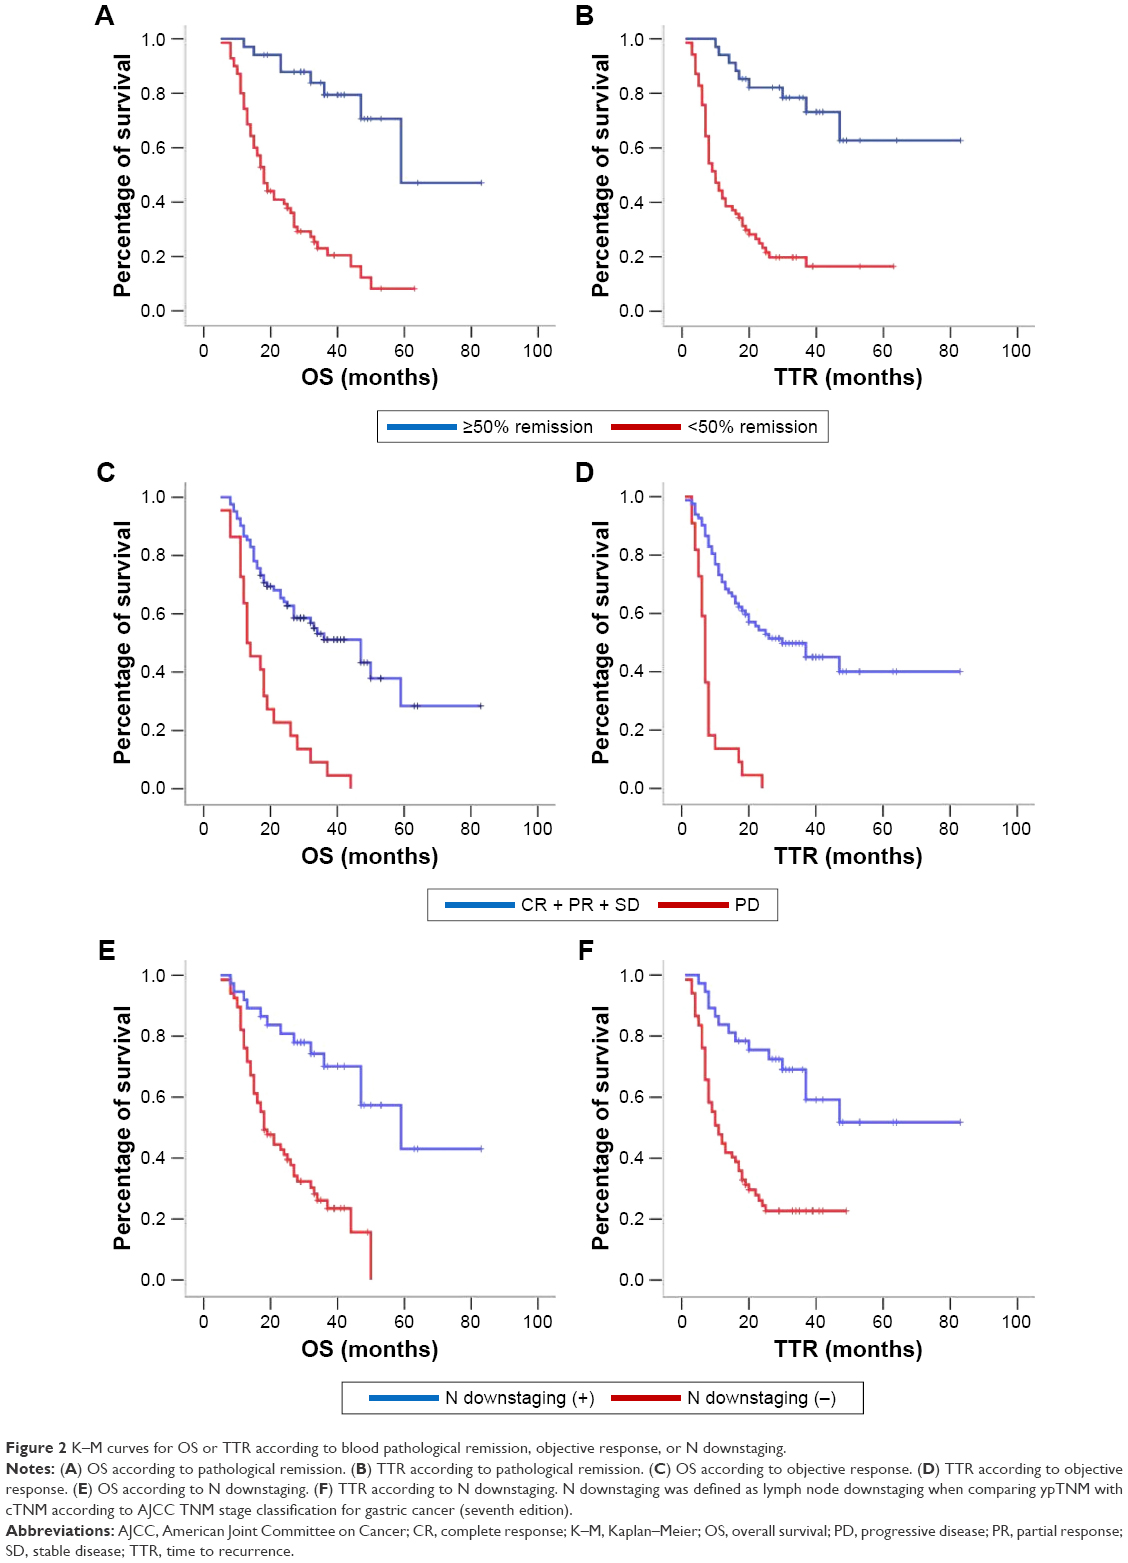 | Figure 2 K–M curves for OS or TTR according to blood pathological remission, objective response, or N downstaging. |
The optimal cutoff levels for routine blood parameters and their ratios
Here, we calculated the optimal cutoff levels based on the objective response because the main purpose of this research was to identify the predictors for efficacy of the neoadjuvant CAPOX regimen. Through ROC curve analysis (Figure 3), we obtained the optimal cutoff levels and areas under the curve (AUCs) of routine blood parameters and their ratios, as shown in Table 4. Patients were subsequently divided into two groups according to the cutoff value for each parameter.
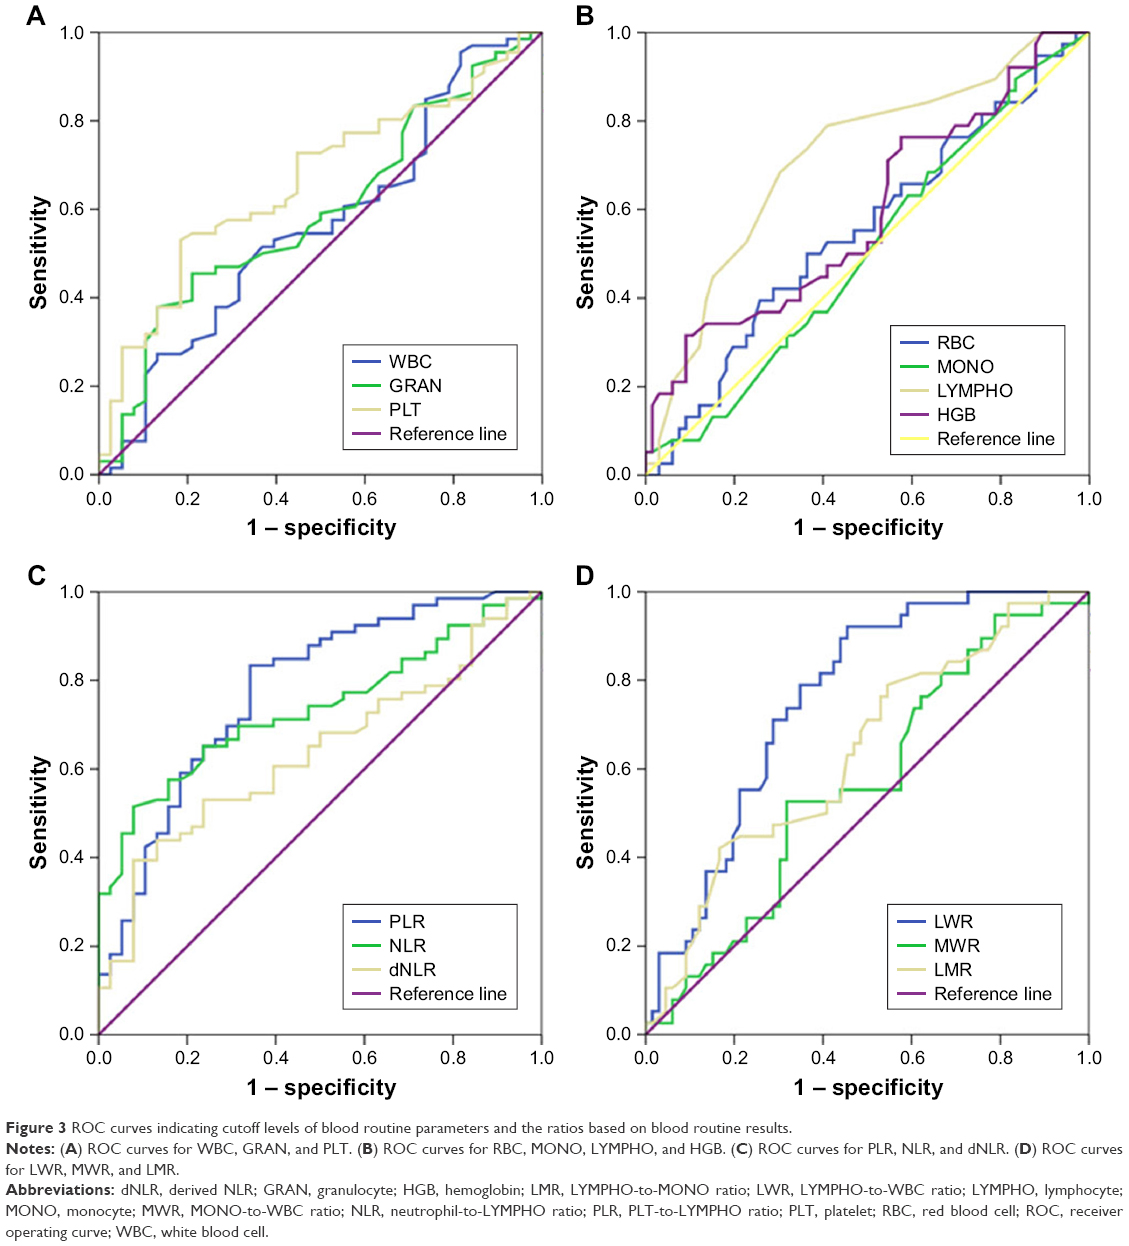 | Figure 3 ROC curves indicating cutoff levels of blood routine parameters and the ratios based on blood routine results. |
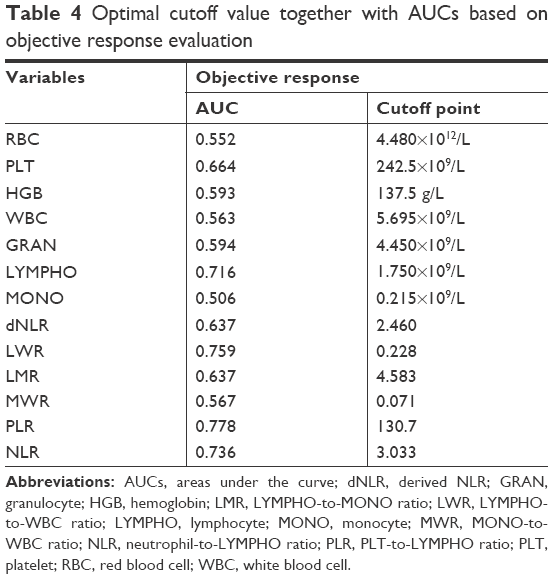 | Table 4 Optimal cutoff value together with AUCs based on objective response evaluation |
Relationship between routine blood parameters and the efficacy of chemotherapy
As listed in Table 5, a higher lymphocyte count (≥1.750×10⁹/L), LWR (≥0.228), and LMR (≥4.583) and a lower platelet count (<242.5×10⁹/L), dNLR (<2.460), NLR (<3.033), and PLR (<130.7) were significantly associated with a higher ORR and pathological remission rate (pRR). In addition, a higher response rate was associated with a lower granulocyte count (<4.450×10⁹/L) and a higher MWR (≥0.071) and hemoglobin level (≥137.5 g/L).
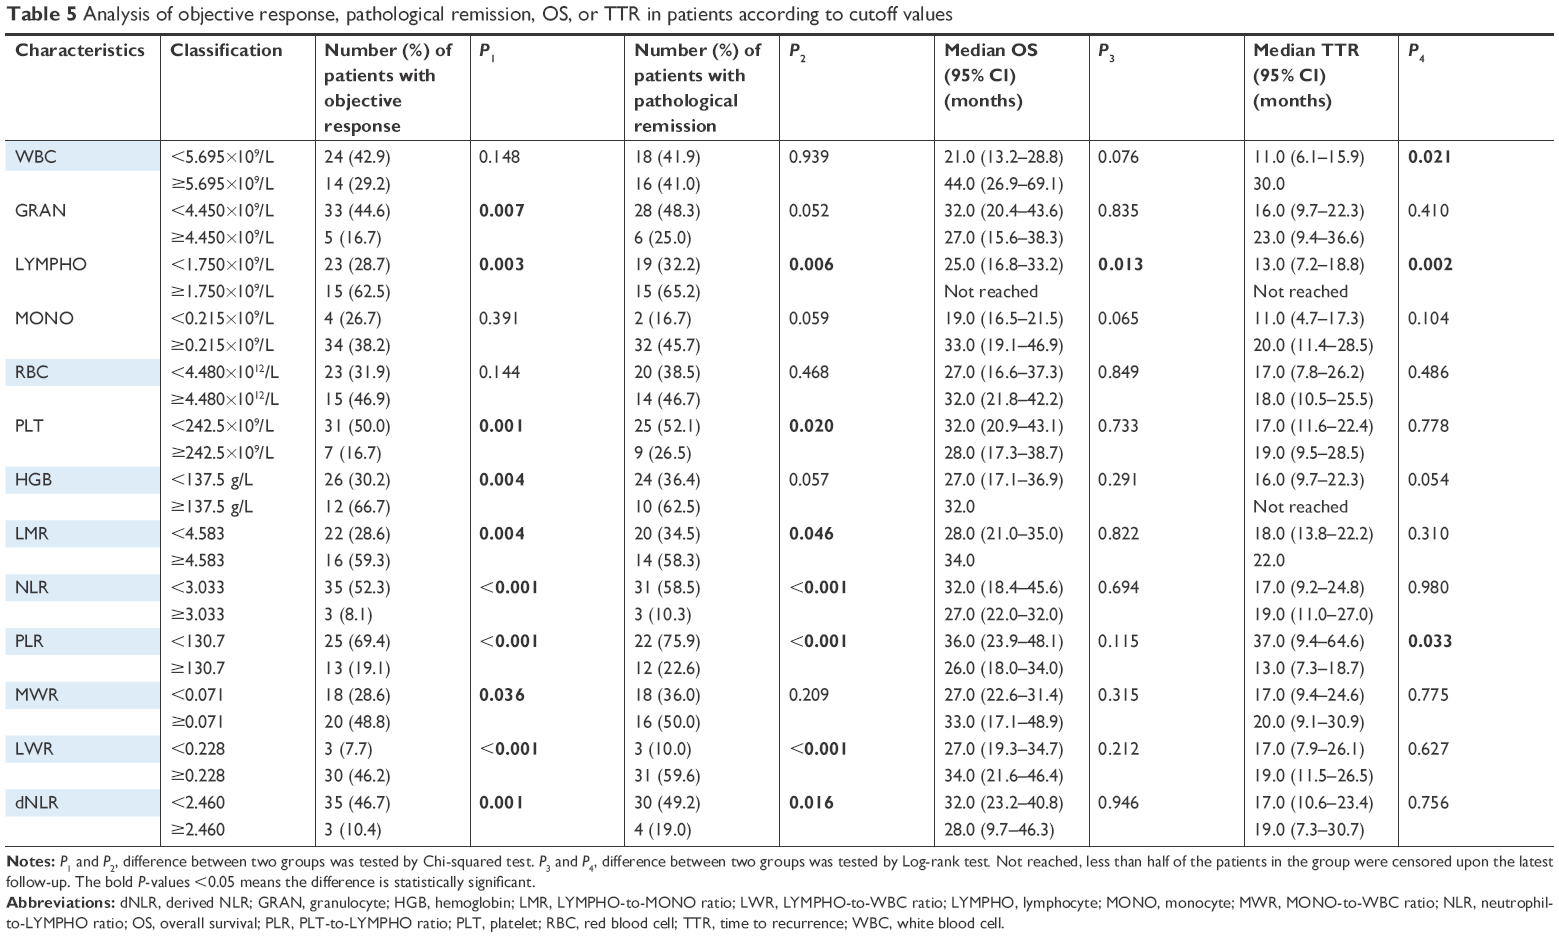 | Table 5 Analysis of objective response, pathological remission, OS, or TTR in patients according to cutoff values |
Relationship between routine blood parameters and patient survival time
Our results showed that the group with a lower lymphocyte count (<1.750×10⁹/L) had a shorter OS and TTR. The median OS and TTR of patients with low lymphocyte level (<1.750×10⁹/L) were 25.0 and 13.0 months, respectively. Meanwhile, a shorter TTR was observed in the group with a lower WBC count (<5.695×10⁹/L) and a higher PLR (≥130.7). The median TTR of patients with a low WBC count (<5.695×10⁹/L) and a high PLR (≥130.7) was 11.0 and 13.0 months, respectively (Table 5). In addition, K–M survival curves showing the differences in OS or TTR between patients with different routine blood parameter values and ratios are shown in Figures 4 and 5.
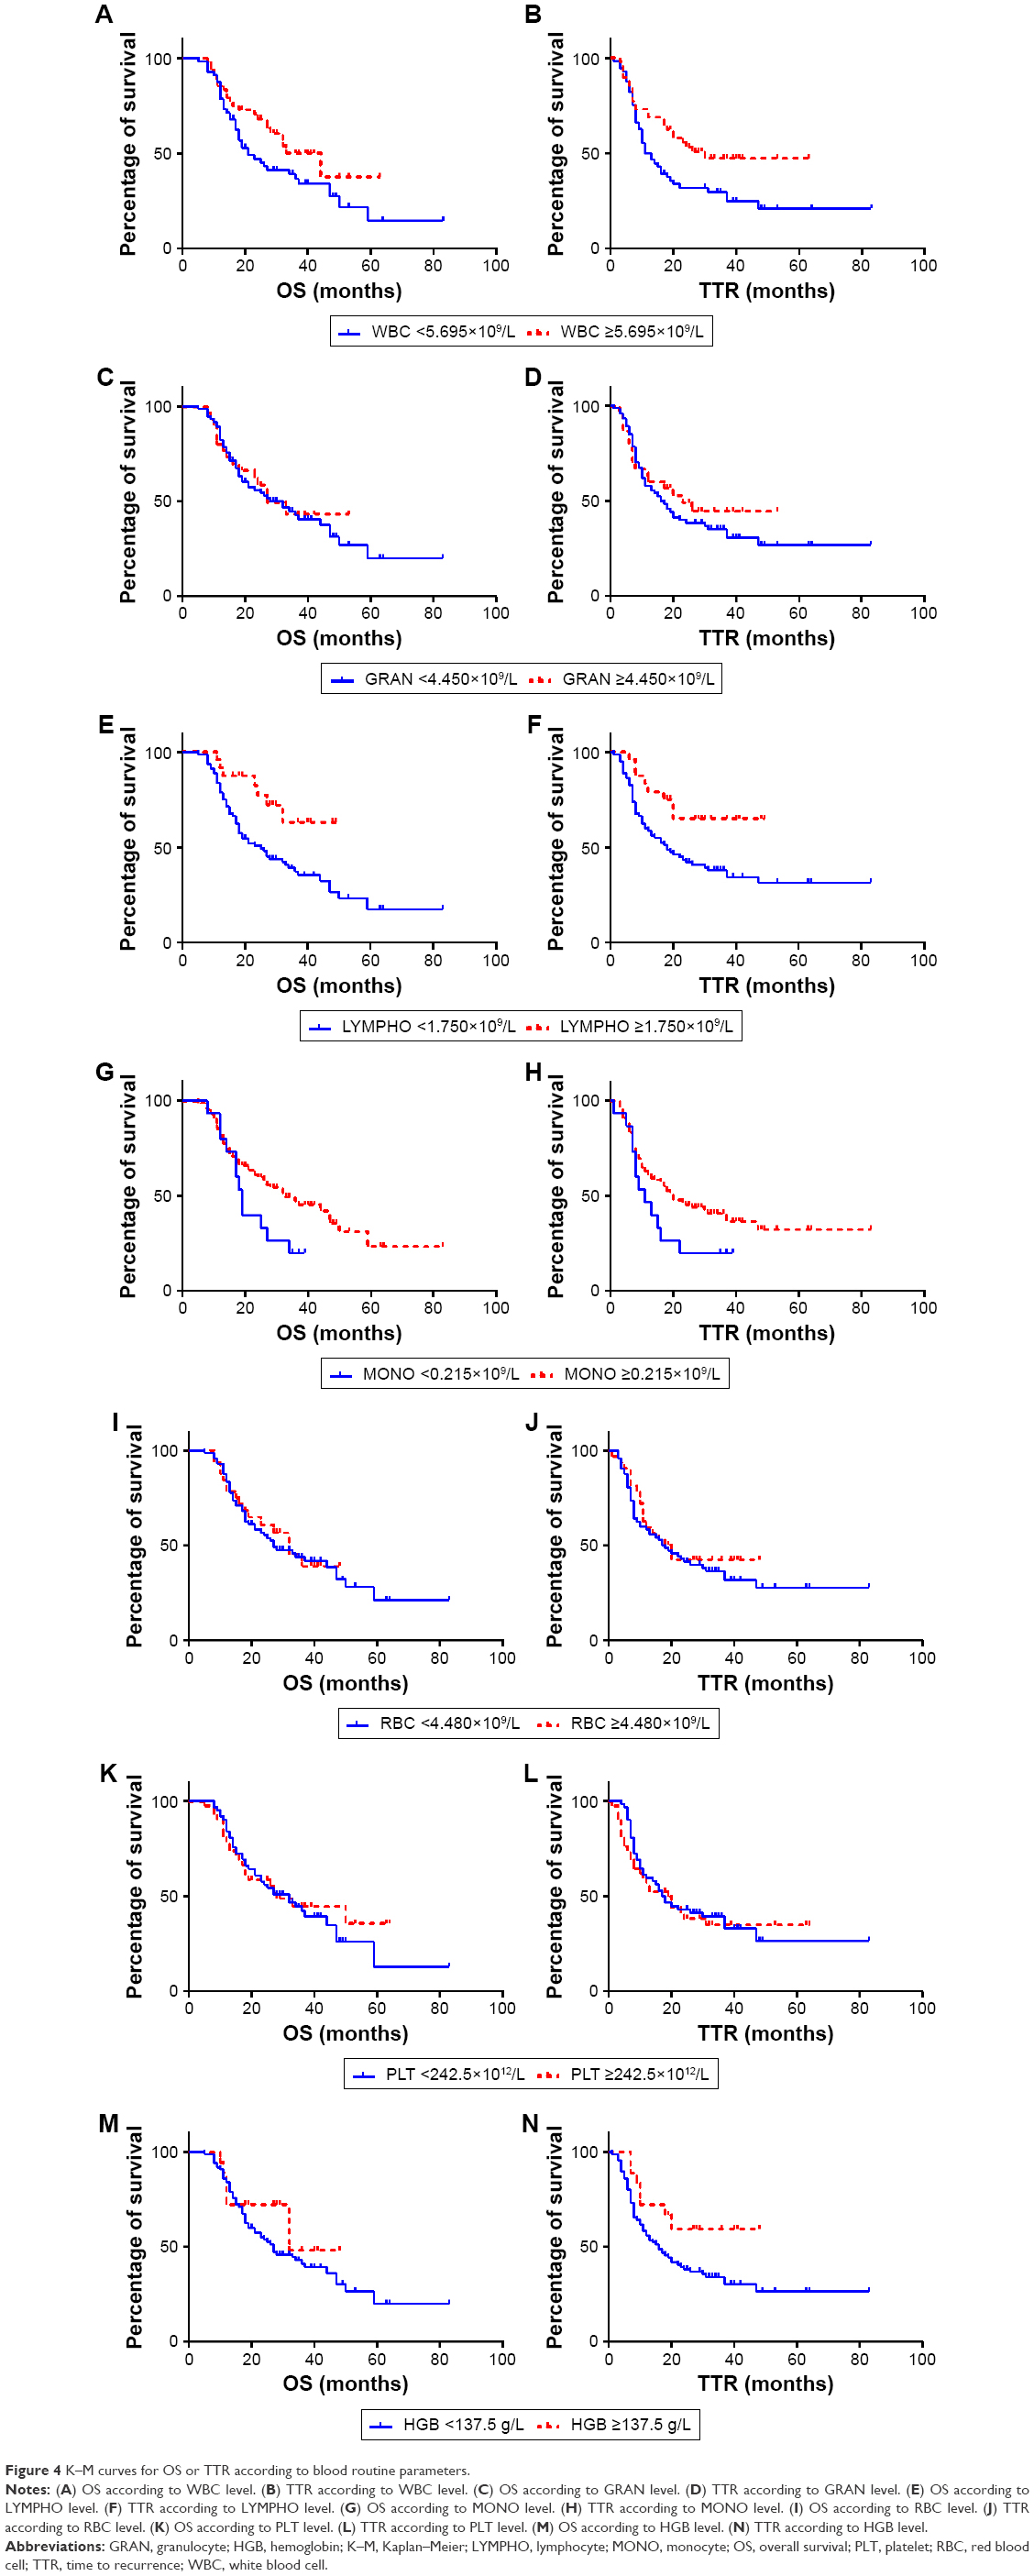 | Figure 4 K–M curves for OS or TTR according to blood routine parameters. |
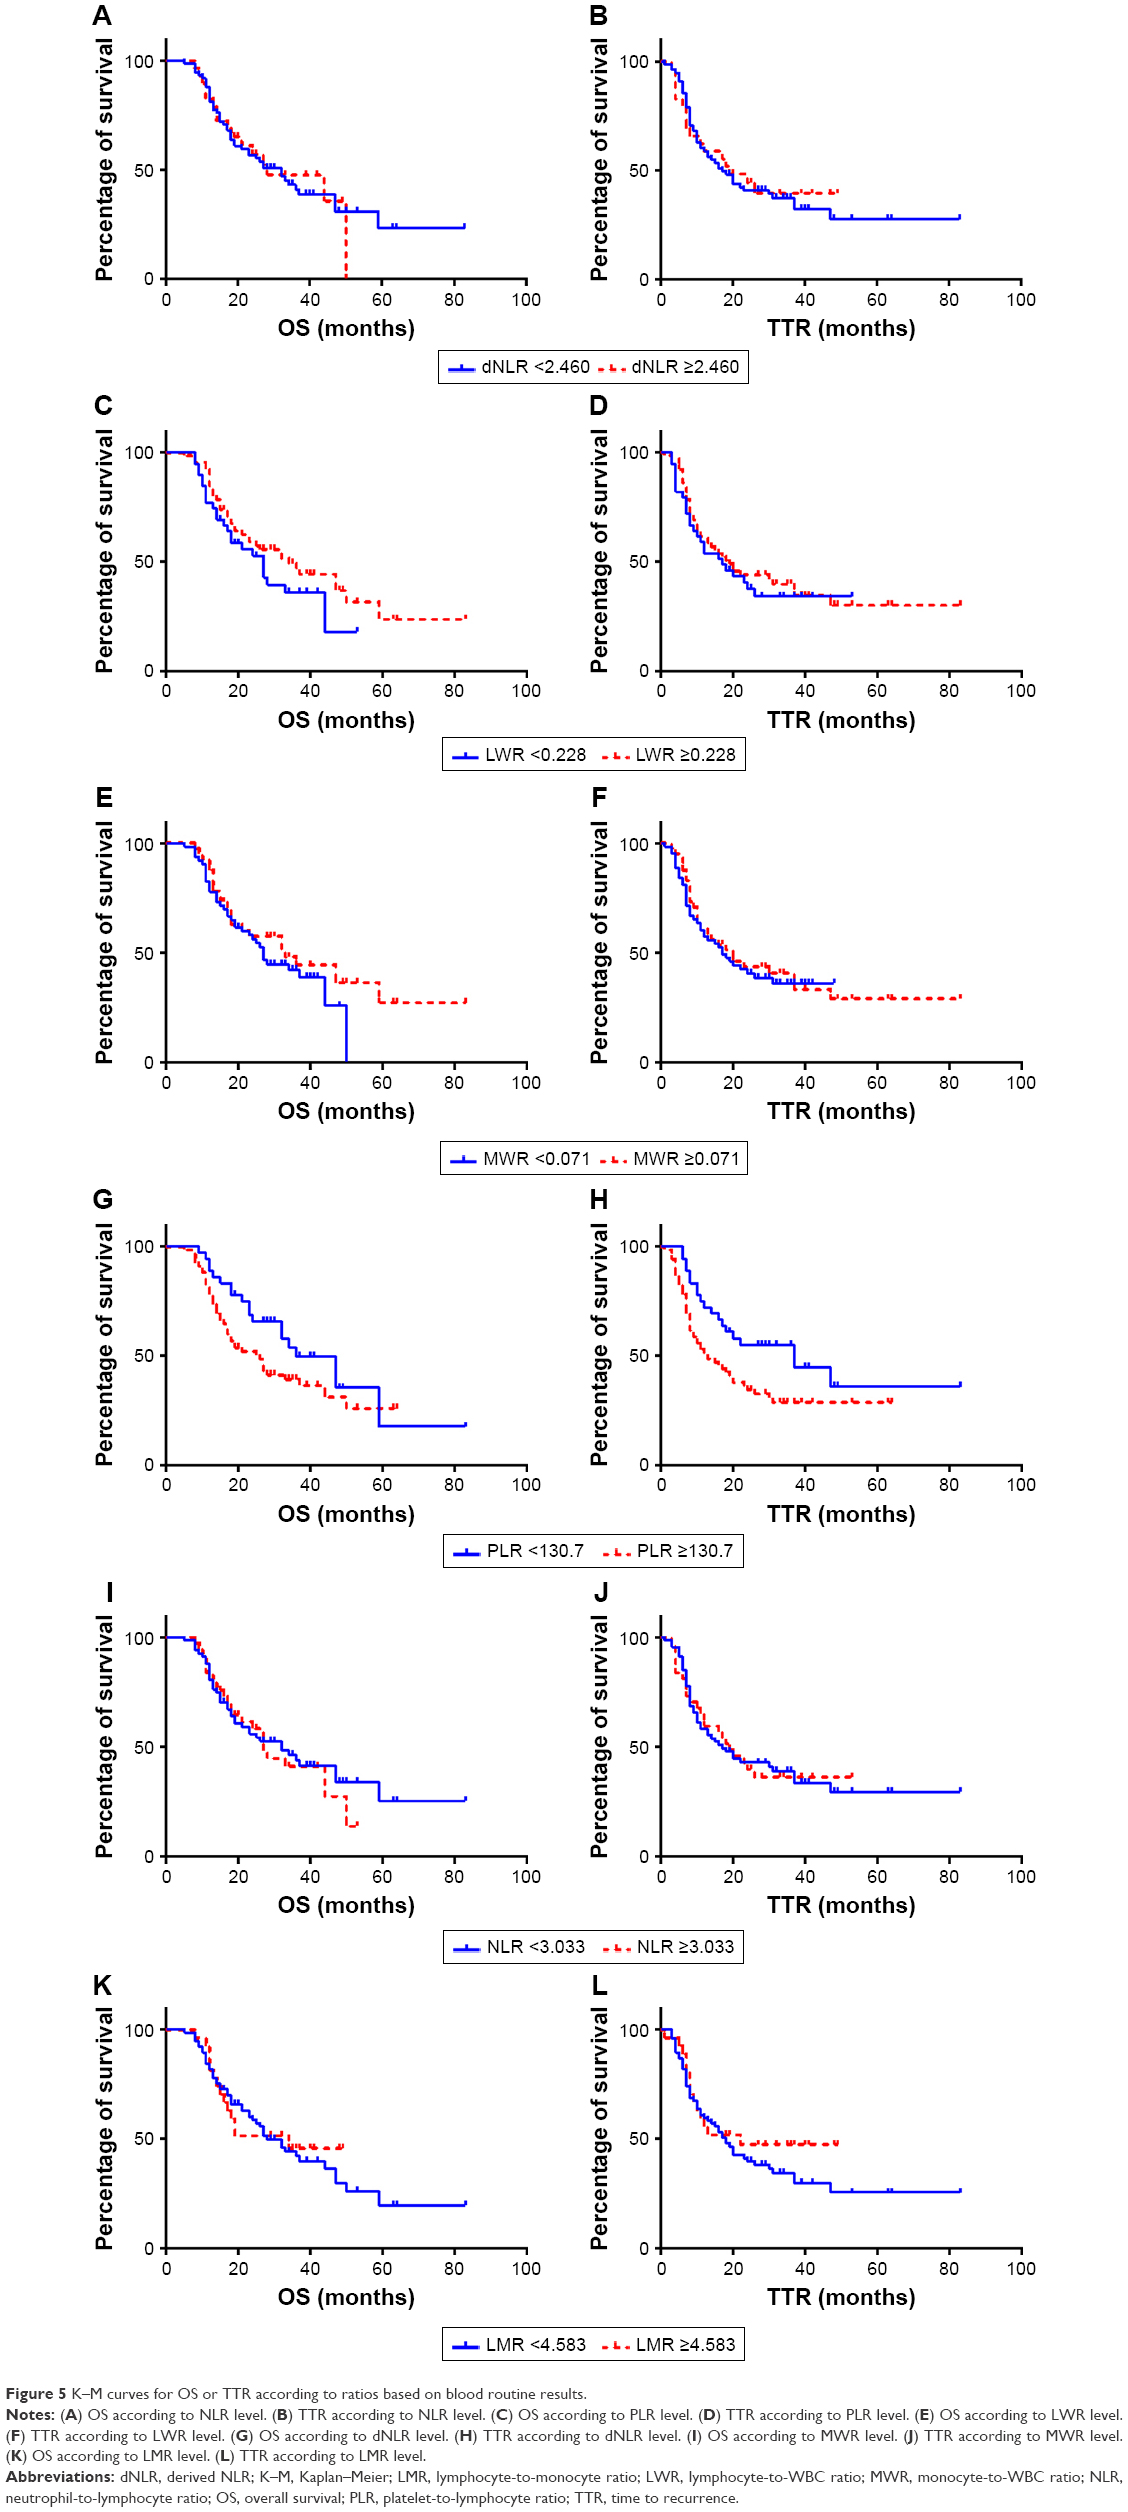 | Figure 5 K–M curves for OS or TTR according to ratios based on blood routine results. |
Independent predictors for the efficacy of chemotherapy in the multivariate analysis
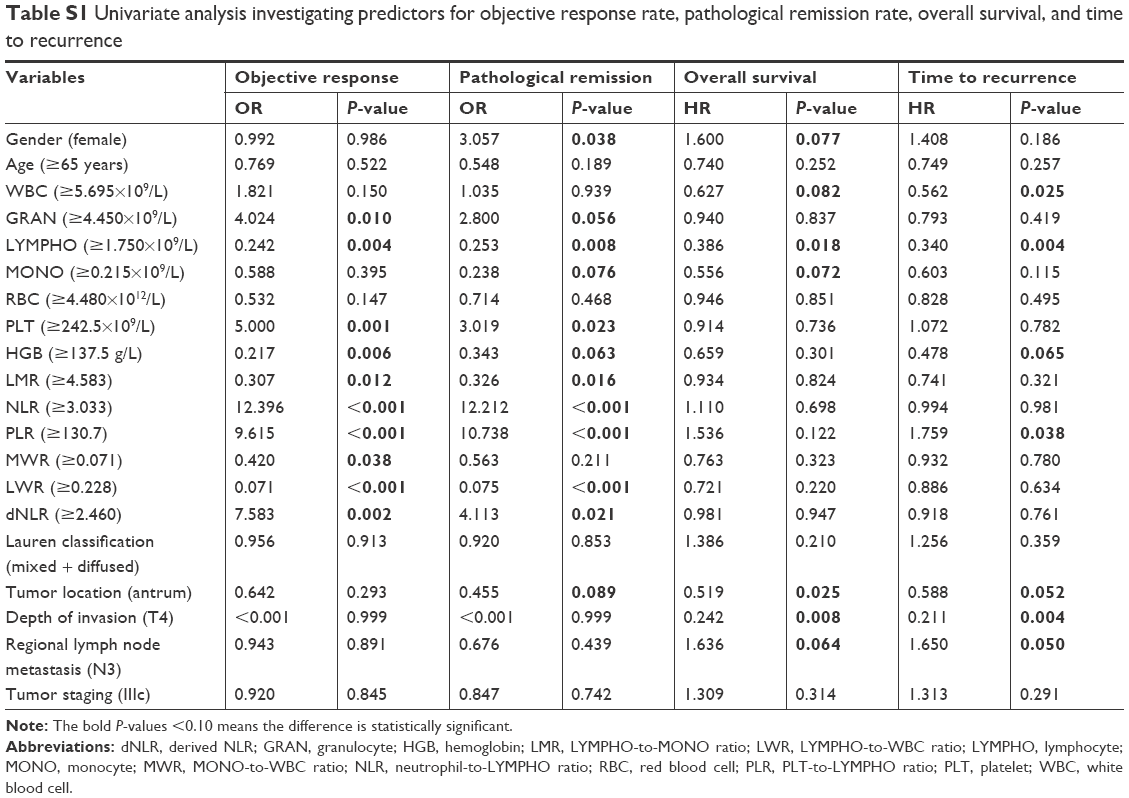
In the multivariate logistic regression analysis, a higher PLR (≥130.7) predicted a lower ORR (OR =5.927, 95% CI: 2.184–16.089) and pRR (OR =8.343, 95% CI: 2.178–31.962), while a higher LWR (≥0.228) independently predicted a higher ORR (OR =0.118, 95% CI: 0.031–0.448) and pRR (OR =0.096, 95% CI: 0.021–0.426). In addition, a higher monocyte count (≥0.215×10⁹/L) (OR =0.072, 95% CI: 0.008–0.636) and tumor located at the antrum (OR =0.154, 95% CI: 0.036–0.657) were another two independent predictors of a higher pRR (Table 6). The variables in the multivariate analysis were selected through univariate logistic regression analysis (P<0.10) (Table S1).
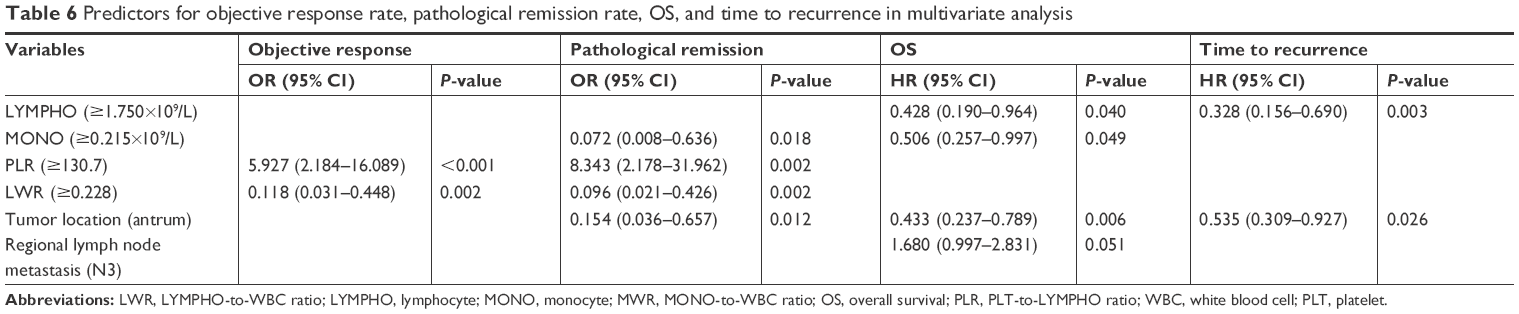 | Table 6 Predictors for objective response rate, pathological remission rate, OS, and time to recurrence in multivariate analysis |
Independent predictors of patient prognosis in the multivariate analysis
Multivariate Cox regression analysis revealed that tumors located at the antrum (HR =0.433, 95% CI: 0.237–0.789), high lymphocyte count (≥1.750×10⁹/L) (HR =0.428, 95% CI: 0.190–0.964), and high monocyte count (≥0.215×10⁹/L) (HR =0.506, 95% CI: 0.257–0.997) were independent predictors of long OS, while regional lymph node metastasis (N3) (HR =1.680, 95% CI: 0.997–2.831) was an independent predictor of short OS. Independent factors that prolonged the TTR were tumor located at the antrum (HR =0.535, 95% CI: 0.309–0.927) and high lymphocyte count (≥1.750×10⁹/L) (HR =0.328, 95% CI: 0.156–0.690) (Table 6). The variables in the multivariate analysis were selected through univariate Cox regression analysis (P<0.10) (Table S1).
Discussion
The relationship between preoperative NLR, PLR, or LMR and prognosis in GC patients has been discussed at great lengths; however, the association of these ratios with chemotherapeutic efficacy has seldom been discussed.9,10 Notwithstanding the model of perioperative chemotherapy with surgery that has almost become a consensus in LAGC recently,3 few people have investigated the value of routine blood parameters in predicting the efficacy of chemotherapy or the prognosis of patients in a neoadjuvant setting; thus, we tried to ascertain whether these parameters and their ratios would be applicable and useful in GC patients treated with the neoadjuvant CAPOX regimen.
According to the results of our multivariate analysis, a high PLR (≥130.7) was an independent predictor of poor efficacy when patients were treated with neoadjuvant CAPOX regimen, as evidenced by the ORR and pRR analyses. In addition, the negative effect of a high PLR on GC patient prognosis was supported by data from several studies: a meta-analysis published in 2015 demonstrated a higher risk of short OS in GC patients with a high PLR.19
The association of a high PLR with low chemotherapeutic efficacy or poor prognosis could result from an elevated platelet count or a decreased lymphocyte count. Activated platelets created a procoagulant microenvironment that enabled tumor cells to cover themselves with platelets and evaded the host immune system.20 Through aggregation, degranulation, and the consequent release of different types of factors, platelets contributed to chemoresistance by immunosuppression and induction of epithelial–mesenchymal transition (EMT) in GC. For example, platelet-derived transforming growth factor-β (TGF-β) and vascular endothelial growth factor (VEGF) was often investigated in this context. 5-Fluorouracil-resistant GC cells displayed mesenchymal characteristics, and overexpression of TGF-β receptor 2 (TGFBR2) could decrease 5-fluorouracil sensitivity of GC cells.21 Besides, TGF-β1 was shown to promote immune tolerance in GC cell lines by inducing regulatory T cells22 and immunosuppressive macrophages.23 VEGF-C mediated GC cell metastasis and cisplatin resistance, while VEGF-C-targeted microRNA-101 could reverse the resistance through inducing apoptosis.24
For lymphocytes, which played a large role in cancer immunosurveillance,25 the decrease of both count and function indicated the suppression of antitumor responses26 and might be caused by the inhibition of neutrophils surrounding the tumor.27 Our results showed that a high lymphocyte level independently predicted a long OS and TTR. However, the different subsets of lymphocytes actually played quite different, even opposite roles in the tumor immunity of GC. Our team published one study in 2017, which showed that the reduction in CD19+ CD24hCD27+ B cell in peripheral blood predicted favorable outcome in CAPOX-treated patients with advanced GC.28 As for the expression of CD4+ T, CD8+ T, Treg, and Th17 cells in GC patients’ peripheral blood, we only found that the percentage of high CD3+ CD8+ lymphocytes and low Tregs were strongly associated with response to chemotherapy and the prognosis of GC. Neither CD3+ T cells nor CD3+ CD4+ T cells showed significant changes after chemotherapy or correlations with the clinical course.29
In the multivariate analysis, high monocyte level independently predicted high pRR and long OS. It was well-known that tumor-associated macrophages (TAMs) mainly derived from circulating monocytes and could be divided into two phenotypic subtypes. One type was tumoricidal M1 macrophage producing proinflammatory cytokines, chemokines, and reactive nitrogen/oxygen intermediates. Another type was tumor-promoting M2 macrophage induced by immunoregulatory cytokines such as interleukin (IL)-10 and IL-13.30,31 As TAMs were more closely linked to M2-type macrophages rather than M1-type macrophages, many studies have shown that high levels of TAMs were associated with poor clinical outcome by promoting invasion, metastasis, and angiogenesis.32 However, conflicting results also have been reported that TAMs were independent good prognostic factors in GC.33 There were also researches showing that TAMs in GCs had no significant association with OS.34 Perhaps further studies focusing on the specific role of each TAMs’ subset (M1 and M2) in GCs would be needed.
High NLR, PLR, and the changes in these parameters after one cycle of chemotherapy have been reported to be independent prognostic factors for poor OS in patients with advanced GC receiving palliative FOLFOX (5-fluorouracil with calcium folinate and oxaliplatin) regimen.6 Another article reported that short OS and progression-free survival (PFS) were independently associated with a high NLR in patients with LAGC receiving the neoadjuvant FOLFOX regimen.35 Both of these studies focused on the FOLFOX regimen, while our research focused on the CAPOX regimen, and our multivariate analysis did not reveal a significant association between the prognosis and NLR or PLR as those articles did. However, we discovered that high PLR level was an independent predictor for poor efficacy of the neoadjuvant CAPOX regimen. Furthermore, we included only the CAPOX regimen as NAC for advanced GC; thus, bias from different chemotherapy regimens was avoided. The pRR classified by the Sataloff method has not often been utilized in previous studies investigating GC patients. We discovered that the Sataloff method was a very effective way of evaluating the pathological response in GC patients (especially those in stage III) receiving NAC.
There was still a limitation that we should point out here. As a retrospective study, we did not gather the comprehensive data of immunocellular subsets’ counts (such as CD4+/CD8+ T cells, CD19+ B cells, and CD68+ monocytes) in peripheral blood. The analysis of these subsets would probably provide us with more insight into the cross-talk between GC cells, tumor microenvironment, and immune cells. We considered that it would be meaningful to conduct such analysis in future researches.
Conclusion
For patients with LAGC who received the neoadjuvant CAPOX regimen, we identified prechemotherapy routine blood results that were closely associated with chemotherapeutic efficacy and prognosis. A high PLR (≥130.7) predicted a low ORR and pRR, while a high LWR (≥0.228) independently predicted a high ORR and pRR. A high lymphocyte level (≥1.750×10⁹/L) was an independent predictor of long OS and TTR, while a high monocyte level (≥0.215×10⁹/L) was an independent predictor of a high pRR and long OS. Therefore, large, randomized, and prospective studies will be designed to determine the significance of routine blood results on the efficacy of NAC for LAGC patients and the mechanism by which WBCs interact with the tumor microenvironment deserves further study.
Acknowledgments
We acknowledge the support of our Department of Medical Oncology. We are grateful to Professor Sun Yihong and his team in the Department of General Surgery for providing cases, Professor Ji Yuan from the Department of Pathology for conducting the pathological analysis, and Professor Rao Shengxiang from the Department of Radiology for conducting the CT scanning analysis. Finally, we would like to thank the patients who participated in this research. This research was supported by 1) study on the prevention and control of major chronic non-infectious diseases, National Key Research and Development Plan of China, 2017YFC1308902 and 2) the Science and Technology Commission of Shanghai Municipality, 15411961900.
Disclosure
The authors report no conflicts of interest in this work.
References
Ronellenfitsch U, Schwarzbach M, Hofheinz R, et al. Preoperative chemo(radio)therapy versus primary surgery for gastroesophageal adenocarcinoma: systematic review with meta-analysis combining individual patient and aggregate data. Eur J Cancer. 2013;49(15):3149–3158. | ||
Cunningham D, Allum WH, Stenning SP, et al. Perioperative chemotherapy versus surgery alone for resectable gastroesophageal cancer. N Engl J Med. 2006;355(1):11–20. | ||
Guideline Working Committees of Chinese Society of Clinical Oncology. Primary Gastric Cancer Guidelines of Chinese Society of Clinical Oncology. 1st ed. Beijing: People’s Medical Publishing Company; 2017:33–35. | ||
Choi AH, Kim J, Chao J, Audrey HC, Joseph K, Joseph C. Perioperative chemotherapy for resectable gastric cancer: MAGIC and beyond. World J Gastroenterol. 2015;21(24):7343–7348. | ||
Sun Y, Yang L, Wang C, et al. Prognostic factors associated with locally advanced gastric cancer patients treated with neoadjuvant chemotherapy followed by surgical resection. Oncotarget. 2017;8(43):75186–75194. | ||
Lee S, Oh SY, Kim SH, et al. Prognostic significance of neutrophil lymphocyte ratio and platelet lymphocyte ratio in advanced gastric cancer patients treated with FOLFOX chemotherapy. BMC Cancer. 2013;13:350. | ||
Lian L, Xia YY, Zhou C, et al. Application of platelet/lymphocyte and neutrophil/lymphocyte ratios in early diagnosis and prognostic prediction in patients with resectable gastric cancer. Cancer Biomark. 2015;15(6):899–907. | ||
Hu D, Zhang H, Lin X, et al. Elevated preoperative neutrophil-to-lymphocyte ratio can predict poor survival in early stage gastric cancer patients receiving radical gastrectomy: The Fujian prospective investigation of cancer (FIESTA) study. J Cancer. 2017;8(7):1214–1222. | ||
Hsu JT, Wang CC, Le PH, et al. Lymphocyte-to-monocyte ratios predict gastric cancer surgical outcomes. J Surg Res. 2016;202(2):284–290. | ||
Zhou X, Du Y, Huang Z, et al. Prognostic value of PLR in various cancers: a meta-analysis. PLoS One. 2014;9(6):e101119. | ||
Deng Q, He B, Liu X, et al. Prognostic value of pre-operative inflammatory response biomarkers in gastric cancer patients and the construction of a predictive model. J Transl Med. 2015;13:66. | ||
Mantovani A, Allavena P, Sica A, Balkwill F. Cancer-related inflammation. Nature. 2008;454(7203):436–444. | ||
Lee K, Hwang H, Nam KT. Immune response and the tumor microenvironment: how they communicate to regulate gastric cancer. Gut Liver. 2014;8(2):131–139. | ||
Ha TK, Kim HJ, Kwon SJ. Does the new UICC/AJCC TNM staging system (7th Edition) improve assessing prognosis in gastric cancer compared to the old system (6th Edition)? J Korean Gastric Cancer Assoc. 2009;9:159–166. | ||
Common Terminology Criteria for Adverse Events (CTCAE). Version 4.0. Published on May 28, 2009. National Cancer Institute. U.S. Department of Health and Human Services. | ||
Eisenhauer EA, Therasse P, Bogaerts J, et al. New response evaluation criteria in solid tumours: revised RECIST guideline (version 1.1). Eur J Cancer. 2009;45(2):228–247. | ||
Sataloff DM, Mason BA, Prestipino AJ, Seinige UL, Lieber CP, Baloch Z. Pathologic response to induction chemotherapy in locally advanced carcinoma of the breast: a determinant of outcome. J Am Coll Surg. 1995;180(3):297–306. | ||
Greiner M, Pfeiffer D, Smith RD. Principles and practical application of the receiver-operating characteristic analysis for diagnostic tests. Prev Vet Med. 2000;45(1–2):23–41. | ||
Xin-Ji Z, Yong-Gang L, Xiao-Jun S, Xiao-Wu C, Dong Z, Da-Jian Z. The prognostic role of neutrophils to lymphocytes ratio and platelet count in gastric cancer: A meta-analysis. Int J Surg. 2015;21:84–91. | ||
Zhang X, Cui MM, Fu S, et al. Platelet distribution width correlates with prognosis of gastric cancer. Oncotarget. 2017;8(12):20213–20219. | ||
Li LQ, Pan D, Chen Q, et al. Sensitization of gastric cancer cells to 5-FU by microRNA-204 through targeting the TGFBR2-mediated epithelial to mesenchymal transition. Cell Physiol Biochem. 2018;47(4):1533–1545. | ||
Deng B, Zhu JM, Wang Y, et al. Intratumor hypoxia promotes immune tolerance by inducing regulatory T cells via TGF-β1 in gastric cancer. PLoS One. 2013;8(5):e63777. | ||
Luo H, Hao Y, Tang B, et al. Mouse forestomach carcinoma cells immunosuppress macrophages through transforming growth factor-β1. Mol Med Rep. 2012;5(4):988–992. | ||
Li G, Yang F, Gu S, Li Z, Xue M. MicroRNA-101 induces apoptosis in cisplatin-resistant gastric cancer cells by targeting VEGF-C. Mol Med Rep. 2016;13(1):572–578. | ||
Dunn GP, Old LJ, Schreiber RD. The immunobiology of cancer immunosurveillance and immunoediting. Immunity. 2004;21(2):137–148. | ||
Dolcetti R, Viel A, Doglioni C, et al. High prevalence of activated intraepithelial cytotoxic T lymphocytes and increased neoplastic cell apoptosis in colorectal carcinomas with microsatellite instability. Am J Pathol. 1999;154(6):1805–1813. | ||
Müller I, Munder M, Kropf P, Hänsch GM. Polymorphonuclear neutrophils and T lymphocytes: strange bedfellows or brothers in arms? Trends Immunol. 2009;30(11):522–530. | ||
Li W, Song D, Li H, Liang L, Zhao N, Liu T. Reduction in Peripheral CD19+CD24hCD27+ B Cell Frequency Predicts Favourable Clinical Course in XELOX-Treated Patients with Advanced Gastric Cancer. Cell Physiol Biochem. 2017;41(5):2045–2052. | ||
He Q, Li G, Ji X, et al. Impact of the immune cell population in peripheral blood on response and survival in patients receiving neoadjuvant chemotherapy for advanced gastric cancer. Tumour Biol. 2017;39(5):1010428317697571. | ||
Biswas SK, Allavena P, Mantovani A. Tumor-associated macrophages: functional diversity, clinical significance, and open questions. Semin Immunopathol. 2013;35(5):585–600. | ||
Ramanathan S, Jagannathan N. Tumor associated macrophage: a review on the phenotypes, traits and functions. Iran J Cancer Prev. 2014;7(1):1–8. | ||
Kim KJ, Wen XY, Yang HK, Kim WH, Kang GH. Prognostic implication of M2 macrophages are determined by the proportional balance of tumor associated macrophages and tumor infiltrating lymphocytes in microsatellite-unstable gastric carcinoma. PLoS One. 2015;10(12):e0144192. | ||
Wang B, Xu D, Yu X, et al. Association of intra-tumoral infiltrating macrophages and regulatory T cells is an independent prognostic factor in gastric cancer after radical resection. Ann Surg Oncol. 2011;18(9):2585–2593. | ||
Zhang H, Wang X, Shen Z, et al. Infiltration of diametrically polarized macrophages predicts overall survival of patients with gastric cancer after surgical resection. Gastric Cancer. 2015;18(4):740–750. | ||
El Aziz LM. Blood neutrophil-lymphocyte ratio predicts survival in locally advanced cancer stomach treated with neoadjuvant chemotherapy FOLFOX 4. Med Oncol. 2014;31(12):311. |
Supplementary material
 | Table S1 Univariate analysis investigating predictors for objective response rate, pathological remission rate, overall survival, and time to recurrence |
 © 2018 The Author(s). This work is published and licensed by Dove Medical Press Limited. The full terms of this license are available at https://www.dovepress.com/terms.php and incorporate the Creative Commons Attribution - Non Commercial (unported, v3.0) License.
By accessing the work you hereby accept the Terms. Non-commercial uses of the work are permitted without any further permission from Dove Medical Press Limited, provided the work is properly attributed. For permission for commercial use of this work, please see paragraphs 4.2 and 5 of our Terms.
© 2018 The Author(s). This work is published and licensed by Dove Medical Press Limited. The full terms of this license are available at https://www.dovepress.com/terms.php and incorporate the Creative Commons Attribution - Non Commercial (unported, v3.0) License.
By accessing the work you hereby accept the Terms. Non-commercial uses of the work are permitted without any further permission from Dove Medical Press Limited, provided the work is properly attributed. For permission for commercial use of this work, please see paragraphs 4.2 and 5 of our Terms.