")
Back to Journals » Journal of Hepatocellular Carcinoma » Volume 9
Platelet-Related Molecular Subtype to Predict Prognosis in Hepatocellular Carcinoma
Authors Zhang G
Received 25 February 2022
Accepted for publication 27 April 2022
Published 19 May 2022 Volume 2022:9 Pages 423—436
DOI https://doi.org/10.2147/JHC.S363200
Checked for plagiarism Yes
Review by Single anonymous peer review
Peer reviewer comments 3
Editor who approved publication: Prof. Dr. Imam Waked
Genhao Zhang
Department of Blood Transfusion, The First Affiliated Hospital of Zhengzhou University, Zhengzhou, People’s Republic of China
Correspondence: Genhao Zhang, Email [email protected]
Purpose: Complex crosstalk between tumor cells and platelets is closely related to the development, relapse, and drug resistance of hepatocellular carcinoma (HCC). Therefore, an intensive analysis of the relationship between platelet-related genes and the effectiveness of immunotherapy is necessary for improving the poor prognosis of HCC patients.
Methods: Genes associated with platelets in the GeneCards database were collected and were used to identify molecular subtypes using a non-negative matrix decomposition algorithm (NMF) and constructed a platelet-related genes-based prognostic stratification model by the LASSO-Cox regression and stepwise Cox regression analysis. The effect of this feature on the immune microenvironment of HCC and the response to immune checkpoint inhibitors was also explored.
Results: After identifying two molecular subtypes, we constructed a platelet-related genes-based prognostic stratification model that can be effectively used for immune checkpoint inhibitor (PD1, PD-L1, PD-L2, and CTLA4) efficacy and prognosis prediction in HCC patients, which was subsequently validated using patient samples from ICGC, GSE14520 and a small sample size clinical cohort. We also found downregulation of PAFAH1B3 remarkably inhibited the proliferation and migration ability of Hep3B cells by cytological experiments.
Conclusion: We constructed a prognostic classifier based on platelet-related genes that could effectively classify HCC patients for prognostic prediction and provide new light on the selection of optimal individualized antiplatelet therapy for HCC patients in future clinical practice.
Keywords: HCC, prognosis, immunotherapy, PAFAH1B3, NMF, platelet
Introduction
Platelets are small, non-nucleated blood cells produced by megakaryocytes in the bone marrow, which play an important role in clotting and maintaining hemostasis after mechanical injury to blood vessels. In recent years, an increasing number of studies have demonstrated the strong link between platelets and tumors.1 Tumor cells can cause abnormal platelet counts as well as platelet activation and aggregation function through the release of endogenous thrombin, TXA2, and ADP.2 Platelet counts are a prognostic predictor for patients with a variety of tumors, including lung, ovarian, prostate, colon cancers, and melanoma.3–6 Tumor cells can also trigger platelet activation by modulating glycoprotein VI-mediated immunoreceptor tyrosine-based activation motif (ITAM) signaling, thereby regulating platelet adhesion, aggregation, and procoagulant activity.7 Abnormal activation and aggregation of platelets, especially tumor-activated platelets aggregation, may lead to cancer-related thrombosis and facilitate vasculogenesis and tumor cell migration, which may cause death in cancer patients.8–10 Interestingly, platelets contain a large number of bioactive molecules within them and express different receptors on their surface that can also, in turn, facilitate the growth and metastasis of tumors.11,12 Platelets can secrete transforming growth factor beta (TGF-β) to increase the proliferation of ovarian cancer cells, and the proliferation capacity is diminished with TGF-β1 blocking antibodies.13 Platelet granules contain various proangiogenic factors, including vascular endothelial growth factor (VEGF), platelet-derived growth factor (PDGF), angiopoietin-1 and IL-6, which can induce intratumor blood vessel formation and promote the proliferation of tumor-associated pericytes in the tumor microenvironment (TME).14–16 In addition, platelets can reduce E-cadherin levels and upregulate Snail, vimentin, and fibronectin levels in tumor cells, inducing invasive EMT phenotype, and promoting tumor cell metastasis.16 In brief, there is a variety of crosstalk between platelets and cancer cells, and a deeper understanding of them can help clinicians develop strategies for the use of antiplatelet drugs in cancer prevention and treatment.
Considering that cancer and platelet crosstalk is a complex process involving multiple genes, we constructed and validated a prognostic stratification model in public datasets based on the platelet-related genes which could be efficiently applied for prognostic categorization of HCC patients. In addition, we found that platelet-activating factor acetylhydrolase 1B catalytic subunit 3 (PAFAH1B3) was an independent prognostic factor in HCC patients and that reducing its expression inhibited tumor cell proliferation and migration.
Materials and Methods
Public Datasets and Collection of Genes Related to Platelet
This study includes transcriptomic expression data and clinical characteristics of HCC patients from three publicly available datasets, including TCGA-LIHC, ICGC (LIRI-JP), and GSE14520, and the clinical features of HCC patients in the three cohorts were showed in Table S1. Genes associated with platelets in the GeneCards database (https://www.genecards.org/) were collected.17 Genes with a correlation score >12 were considered platelet-associated genes using “platelet” as the keyword for the search.
Molecular Subtypes Identification by Non-Negative Matrix Factorization (NMF) Algorithm
Based on the platelet-associated genes, the HCC samples were clustered using the NMF algorithm with the criterion “brunet” and 50 iterations. The number of clusters (K) ranged from 2 to 6 while the optimal number of clusters was determined based on cophenetic, dispersion, and profile. Kaplan-Meier survival examination was further performed to assess survival differences between different subtypes identified by NMF.
DEG Identification and Functional Analysis
The expression levels of platelet-associated genes were explored in Gene Expression Profiling Interactive Analysis (GEPIA)18 (http://gepia.cancer-pku.cn/) and genes with statistically significant differences were defined as differential expression genes (DEGs). Then functional annotation of DEGs for GO and KEGG pathway analysis was explored in the Metascape database19 (http://metascape.org/). P<0.05 was considered statistically significant.
TME and Tumor-Infiltrating Immune Cells Analysis
Stromal and immune scores in tumor tissue were estimated by ESTIMATE based on gene expression profiles of HCC samples to assess the abundance of stromal and immune cells within the tumor.20 In addition, abundance ratios of 22 tumor-infiltrating immune cells (TIICs) in HCC TME were measured by CIBERSORT21 (http://cibersort.stanford.edu/).
Prognostic Risk Score Model Construction
Univariate Cox regression was performed to calculate the association between platelet-associated genes and survival outcomes of HCC patients. Overlapping genes between prognosis-related genes and DEGs were used for further analysis. Then LASSO-Cox regression strategy and stepwise Cox regression examination were performed to investigate the quality and establish the classifier associated with prognosis. A risk score was at last set up based on the premise of directly combining the equation underneath with the mRNA expression level duplicated the multivariate Cox relapse coefficient (β) demonstrate. Risk score = (βmRNA1 × mRNA1) + (βmRNA2 × mRNA2) + … + (βmRNAn × mRNAn). We stratified patients in TCGA dataset into two subgroups due to the ideal hazard score edge. The prescient control and autonomy of the prognostic signature in TCGA were evaluated by ROC examination, Kaplan-Meier survival examination and cox relative risks relapse investigation. Gene set enrichment analysis (GSEA) between the two subgroups was performed to distinguish the altogether cautioned GO and KEGG items with FDR < 0.05.
Clinical Specimens and Quantitative Real-TME PCR (qRT-PCR) Analysis
Fresh frozen tumor tissues from previously collected HCC patients were selected as a small sample size clinical validation cohort22 and the clinical characteristics of HCC patients were shown in Table S1. qRT-PCR was used to detect the mRNA levels of genes in the model.23 After the relative mRNAs expression levels were normalized to β-ACTIN and log2 transformed, patients were stratified into two subgroups according to the above formula. Primer sequences are shown in Table S2.
Genetic Alterations and Immune Checkpoint Genes Analysis
The mutation and CNA data of 350 HCC patients were downloaded from TCGA to analyze the difference in genetic alterations between different subgroups with R package “maftools”. Furthermore, to explore the impacts of the prognostic classifier on immunotherapies, we calculated the relationship between risk score and 4 potentially available targeted immune checkpoint genes including PD1, PD-L1, PD-L2, and CTLA4.
Drug Susceptibility Analysis
The association between anticancer drug sensitivity and mRNA molecules in our risk model was directly explored in the CellMiner database.24 574 in advanced clinical trials and 216 Food and Drug Administration (FDA)-approved drugs were used for follow-up analyses. Drugs with adjusted P value <0.001 and Pearson correlation coefficient >0.3 as cut-off criteria were considered tumor-sensitive drugs.
Cell Culture and Cell Infection
Hep3B cells purchased from the Cell Bank of the Shanghai Institute of Cells, Chinese Academy of Science (Shanghai, China) were cultured in recommended DMEM medium (Sangon Biotech, China) with 10% fetal bovine serum (FBS, Sangon Biotech, Shanghai, China) in 100% humidity at 37 °C with 5% CO2. Small interfering RNA (siRNA) (5′-CCUCUGCAUGCACUUAACUTT-3′) and negative control (5′-UUCUCCGAACGUGUCACGUTT-3′) were selected for reducing PAFAH1B3 expression in Hep3B cells using lipofectamine TM 3000 transfection reagent (Invitrogen, Carlsbad, USA) according to the manufacturer’s instructions.
Cell Proliferation and Migration Assay
The viability of cells was assessed through the cell counting kit-8 (CCK-8, Sangon Biotech, Shanghai, China) under the manufacturer’s instructions. For the CCK-8 assay, in short, cells were seeded in 96-well cell culture clusters at a density of 1×10⁵ cells per well and cultured for 1 day, 2 days, and 3 days, respectively. After culturing, 10 μL CCK-8 solution was added to each well, and then the absorbance was detected at a wavelength of 450 nm within 4 h with a microplate reader. For the colony-formation assay, 500 treated Hep3B cells were plated into six-well plates and cultured for 10 days. Then cell colonies were fixed and stained with crystal violet (Sangon Biotech, Shanghai, China) in 10% ethanol for 5 minutes. Finally, cell colonies were imaged and counted. For the wound-healing assay, cells were seeded in 6-well plates and cultured to approximately 80% confluence in serum-free medium and then cell monolayers were scratched with a sterile pipette tip. Cells were cultured in DMEM medium with 10% FBS for the next 24h after removal of cell debris by PBS washing. The area of the wound width was measured after photographing the wound width of the cell monolayers. Three independent duplicates were needed to ensure the accuracy of this assay and the wound closure rate was calculated as [1 - (wound area/original wound area)] from photographs. For the transwell assay, after transwell filters were coated with Matrigel, cultured cells were resuspended in 200 μL serum-free DMEM at a density of 1×10⁴ cells per mL, and plated into the transwell inserts while the wells were filled with 500 μL DMEM supplemented with 10% FBS. After incubated at 37°C for 48h, cells attached to the downside of the transwell filters were stained with 0.1% crystal violet in PBS for 15min and counted under microscopy at 200 x magnification.
Statistical Analysis
Quantitative variables were analyzed using the independent-samples t test. ROC curve analysis and Kaplan-Meier survival analysis were performed to assess the prediction performance of survival outcomes with R software (Version 4.0.3). Cox proportional model was performed to analyze the relationship between a prognostic classifier and survival outcomes, together with other clinical features. Results were considered statistically significant when the P value was <0.05.
Results
Molecular Subtypes Identification
A total of 160 platelet-associated genes were collected in the GeneCards database. The optimal number of clusters was identified as two based on cophenetic, dispersion, and profile (Figure 1A, Supplementary Figure S1). HCC samples were divided into two subcategories based on the platelet-associated genes and significant differences between patients in the two subgroups were observed (Figure 1B). Furthermore, patients in Cluster 2 had significantly higher PD1, PD-L1, PD-L2, and CTLA4 expression when compared with patients in Cluster 1 (Figure 1C–F). In addition, TME characteristics among the two subgroups were also compared. As shown in Figure 2A, samples from Cluster 1 had lower immune, stromal, and ESTIMATE scores compared with samples from Cluster 2. According to the CIBISORT, five types of TIICs, including T cell, CD4+ T cell, Dendritic cell, Mast cell, and NK cell, differed between Cluster 1 and Cluster 2 subgroups (Figure 2B). GO items with FDR < 0.05 were identified based on gene set enrichment analysis (GSEA) performed between Cluster 1 and Cluster 2 subgroups, which were mainly involved in homeostasis (Figure S2). Subsequently, genetic alteration analysis demonstrated that the mutation rates of the top 10 most significantly mutated genes were significantly different in the two subgroups. CTNNB1 (34%) was the most commonly mutated gene in the Cluster 1 subgroup, while TP53 (37%) was the most commonly mutated gene in the Cluster 2 subgroup (Figure S3). All the above results demonstrated that prognosis, TME characteristics, TIICs infiltration, functional alterations, and somatic mutations were different between patients in the two subgroups, and patients in the Cluster 2 subgroup might be more effective against immune checkpoint blockade therapy.
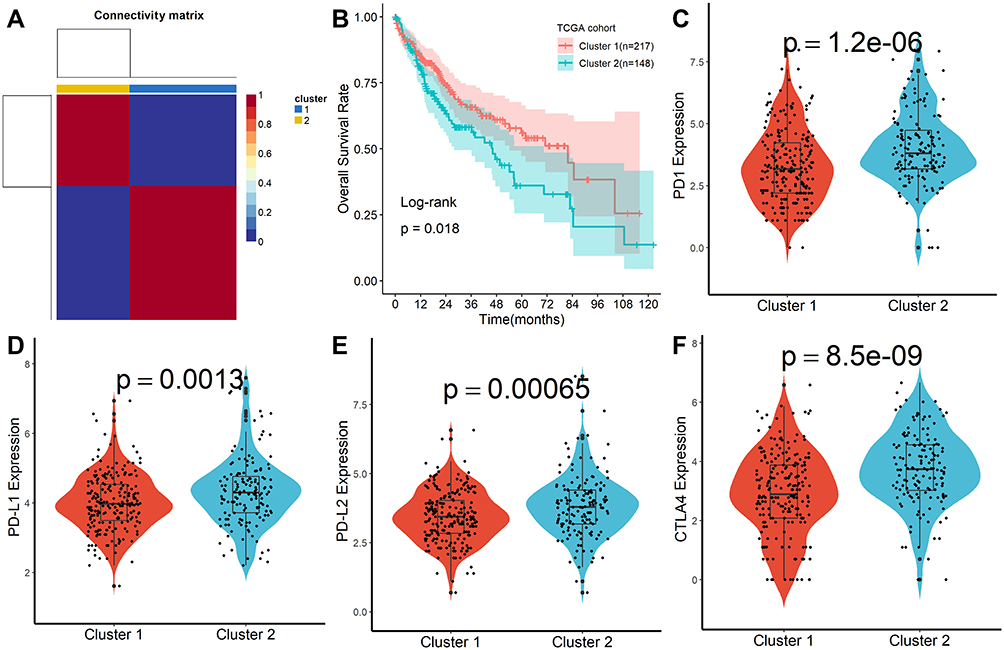 |
Figure 1 Molecular subtypes identification by NMF algorithm. (A) Consensus map of NMF clustering. (B) Kaplan-Meier survival plot of different molecular subtypes. (C–F) Difference of PD1, PD-L1, PD-L2, and CTLA4 expression in different molecular subtypes. |
 |
Figure 2 TME characteristics evaluation. (A) Difference of immune score, stroma score, and ESTIMATE score in different molecular subtypes. (B) Abundance differentiation of TIICs in different molecular subtypes. |
Establishment of a Signature for Cancer Stem Cell Characteristics in HCC
After 24 DEGs between normal and tumor tissues were identified from the GEPIA database, 52 prognosis-related genes were calculated by univariate Cox regression. Ten overlapping genes between prognosis-related genes and DEGs were identified (Figure 3A and B) and their enriched GO and KEGG items were shown in Figure S4. Then the ten platelet-associated genes were selected by performing the LASSO-Cox regression model based on the minimum value of λ and 7 genes including DTNBP1, PAFAH1B3, SERPINE1, VEGFA, AP3B1, CD63 and PDGFA were screened as shown in Figure 3C. These 7 genes were then placed into a stepwise Cox proportional model and finally, a prognostic six-gene signature was identified. Risk score = (0. 0.2579817×PAFAH1B3) + (0.1354325×SERPINE1) + (0.3748835×AP3B1). Risk scores for HCC patients were calculated with the above formula, and patients were stratified into high- or low-risk subgroups with an optimal risk score threshold (Figure 3D). The association between risk score and clinical characteristics including age, gender, grade, TNM stage, vascular invasion, T stage, the value of AFP, cirrhosis, HBV infection status, and tumor status were evaluated. The results revealed that higher risk scores were linked to vascular invasion, advanced TNM stage, AFP values, later grade, later T stage, and recurrence (Supplementary Figure S5). Kaplan-Meier survival analysis revealed that patients with higher risk scores were significantly relevant to poorer survival outcomes (Figure 3E). Furthermore, ROC analysis revealed that this classifier had a good prognostic performance with AUCs at 1-, 2-, 3-, 5-year of 0.727, 0.654, 0.683, 0.644 (Figure 3F). The decision curve analysis (DCA) of the model as shown in Figure 3G. Finally, to explore whether this classifier could be acted as an independent prognostic model for HCC patients, univariable and multivariate Cox analyses were performed. Univariable Cox regression analysis revealed that this classifier was statistically associated with survival outcomes for HCC patients (HR=4.263, 95% CI 2.478–7.335, P < 0.001). Then statistically significant variables obtained above were entered into multivariate Cox regression analysis, which revealed that this classifier could be served as an independent prognostic factor for HCC patients (HR=2.677, 95% CI 1.538–4.667, P < 0.001) after adjusting for other clinical features. The expression levels of the three platelet-associated genes between normal and tumor tissues in the GEPIA database were shown in Figure S6A. The results of the survival variance analysis showed that all the three genes were significantly related to overall survival (Figure S6B) while only PAFAH1B3 and AP3B1 were significantly related to disease-free survival (Figure S6C). Moreover, the protein expression in tissues (Figure S6D) and mRNA expression in HCC cell lines (Figure S6E) of the three genes were explored in Human Protein Atlas database25 (HPA, www.proteinatlas.org) and Cancer Cell Line Encyclopedia (CCLE) database26 (https://portals.broadinstitute.org/ccle), respectively. However, SERPINE1 protein was not detected in HCC.
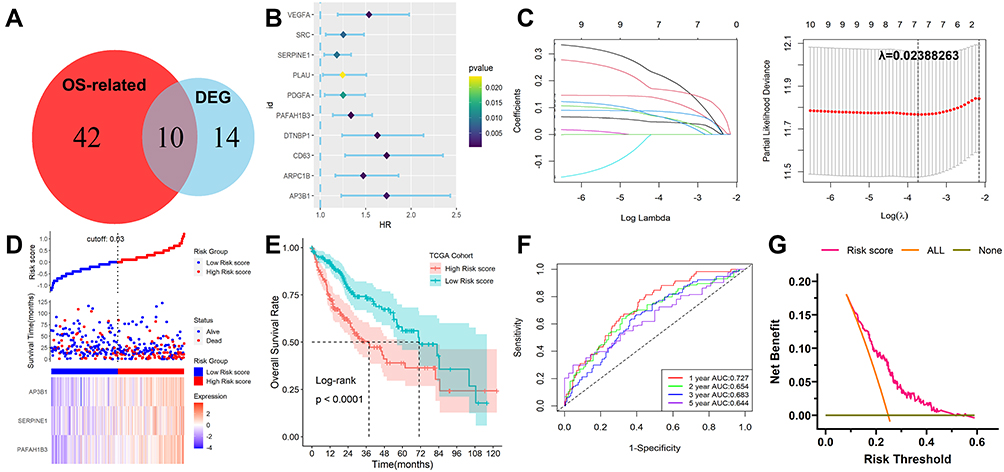 |
Figure 3 Development and survival examination of a prognostic classifier in TCGA. (A) Identification of overlapping genes between OS-related genes and DEGs. (B) Univariate Cox regression analysis of overlapping genes. (C) The parameter selection in the LASSO-Cox analysis was adjusted by 10 cross-validations. (D) Distribution of risk scores, OS status, and gene expression profiles. (E) Kaplan-Meier survival plot. (F) Characteristics of predicted 1-, 2-, 3- and 5-year OS rates in ROC analysis. (G) DCA plot. |
Functional, Genetic Alterations, and Immune Checkpoint Genes Analysis
GO and KEGG items with FDR < 0.05 were identified based on gene set enrichment analysis (GSEA) performed between high- and low-risk score subgroups, which were mainly involved in the catabolic and metabolism process (Figure S7A and B). Subsequently, genetic alteration analysis demonstrated that the mutation rates of the top 10 most significantly mutated genes were significantly different in the two subgroups. TP53 (41%) was the most commonly mutated gene in the high-risk score subgroup, while CTNNB1 (31%) was the most commonly mutated gene in the low-risk score subgroup (Figure S8). Finally, we calculated the relationship between risk scores and expression levels of PD1, PD-L1, PD-L2, and CTLA4 genes to explore the impact of the prognostic model on immunotherapy and observed significant differences and positive correlations between them (Figure 4A and B). According to the CIBISORT, five types of TIICs, including T cell, CD4+ T cell, Dendritic cell, Mast cell, and NK cell, differed between high- and low-risk score subgroups (Figure S9). All the above results demonstrated that functional alterations and somatic mutations were different between patients with higher and lower risk scores and patients in the high-risk score subgroup might be more effective against immune checkpoint blockade therapy.
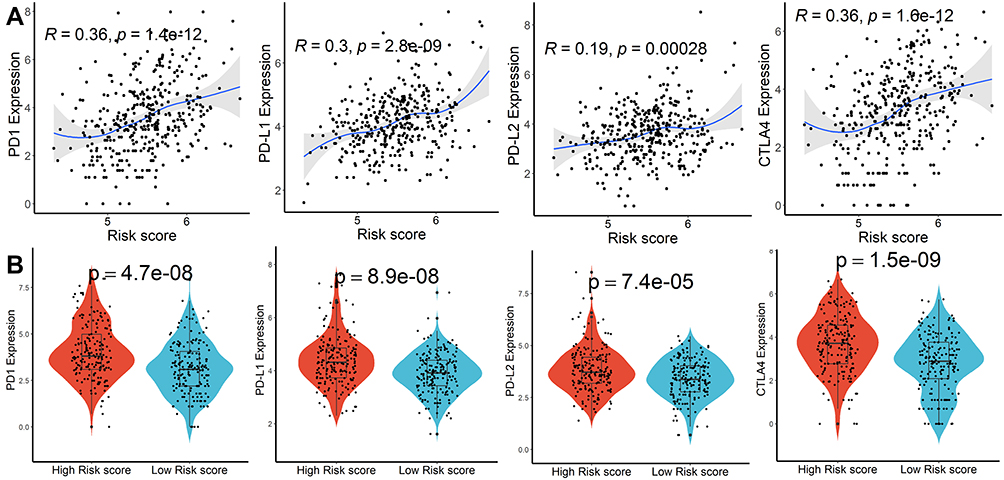 |
Figure 4 Immune checkpoint genes analysis. (A) Association between risk scores and PD1, PD-L1, PD-L2, and CTLA4 expression. (B) Difference of PD1, PD-L1, PD-L2, and CTLA4 expression in higher and lower risk scores subgroups. |
Verification of the Signature in ICGC and GSE14520 Cohort
To validate the signature, ICGC and GSE14520 datasets were applied as validation cohorts. Risk scores of patients were calculated with the same formula, and patients were stratified into high- or low-risk subgroups in the ICGC cohort (Figure 5A) and GSE14520 cohort (Figure 5D). Kaplan-Meier survival analysis revealed that patients with higher risk scores were prominently relevant to poorer OS rates in the ICGC cohort (Figure 5B), as well as in the GSE14520 cohort (Figure 5E). ROC analysis revealed that this signature had a good prognostic performance with AUCs at 1-, 2-, 3-year of 0.675, 0.647, 0.652 in the ICGC cohort (Figure 5C) and 0.543, 0.608, 0.604 in the GSE14520 cohort (Figure 5F), respectively. Univariable and multivariate Cox analyses were performed to explore whether the six-gene signature could be acted as an independent prognostic factor for HCC patients. Univariable Cox regression analysis revealed that this six-gene signature was statistically associated with survival outcomes for HCC patients (IGGC: HR=5.228, 95% CI 1.985–13.770, P < 0.001; GSE14520: HR=2.529, 95% CI 1.333–4.798, P = 0.004). Then statistically significant variables obtained above were entered into multivariate Cox regression analyses, which revealed that this classifier could be served as an independent prognostic factor for HCC patients (IGGC: HR=3.372, 95% CI 1.258–90.38, P = 0.015; GSE14520: HR=1.982, 95% CI 1.055–3.711, P = 0.032) after adjusting for other clinical features.
 |
Figure 5 Validation of this classifier in ICGC and GSE14520 cohorts. (A) Distribution of risk scores, OS status, and gene expression profiles in ICGC cohort. (B) Kaplan-Meier survival plot in ICGC cohort. (C) Characteristics of predicted 1-, 2-, and 3-year OS rates in ROC analysis in ICGC cohort. (D) Distribution of risk scores, OS status, and gene expression profiles in the GSE14520 cohort. (E) Kaplan-Meier survival plot in GSE14520 cohort. (F) Characteristics of predicted 1-, 2-, and 3-year OS rates in ROC analysis in GSE14520 cohort. |
Establishment of a Nomogram Model in TCGA
To explore the coefficient prediction efficiency of this classifier, a nomogram model was built in the TCGA dataset, and the result revealed that the nomogram with a C-index of 0.708 could help us provide a quantitative method for predicting the 1-, 2-, 3-, 5-year survival rate accurately (Figure 6A). The overlap between the forecasted and actual probabilities of 1-, 2-, 3-, 5-year survival rates in the calibration curves indicated good agreement (Figure 6B).
 |
Figure 6 The predictive significance of this classifier was verified in the nomogram model. (A) Nomogram combining this classifier. (B) Calibration plots of 1-, 2-, 3- and 5-year survival probabilities. |
Drug Susceptibility Analysis
Among the 574 in advanced clinical trials and 216 Food and Drug Administration (FDA)-approved drugs, 60 were considered tumor-sensitive drugs (Table S3), and the top 16 most significant tumor-sensitive drugs were shown in Figure S10.
Expression Levels of Genes in This Classifier
The expression levels of the three genes in our model were explored by qRT-PCR in an independent clinical cohort. All three genes showed differential expression in normal and tumor tissues (Figure 7A), while only PAFAH1B3 was significantly associated with overall survival in HCC patients (Figure 7B). Furthermore, the risk scores of patients were calculated with the same formula, and patients were stratified into high- or low-risk subgroups after normalization (Figure 7C). Kaplan-Meier survival analysis revealed that patients with higher risk scores were prominently relevant to poorer OS rates (Figure 7D). ROC analysis revealed that this signature had a good prognostic performance with AUCs at 1-, 2-, 3-year of 0.754, 0.657, 0.688 (Figure 7E). All the above demonstrated that our model could act as a good classification indicator for HCC prognosis.
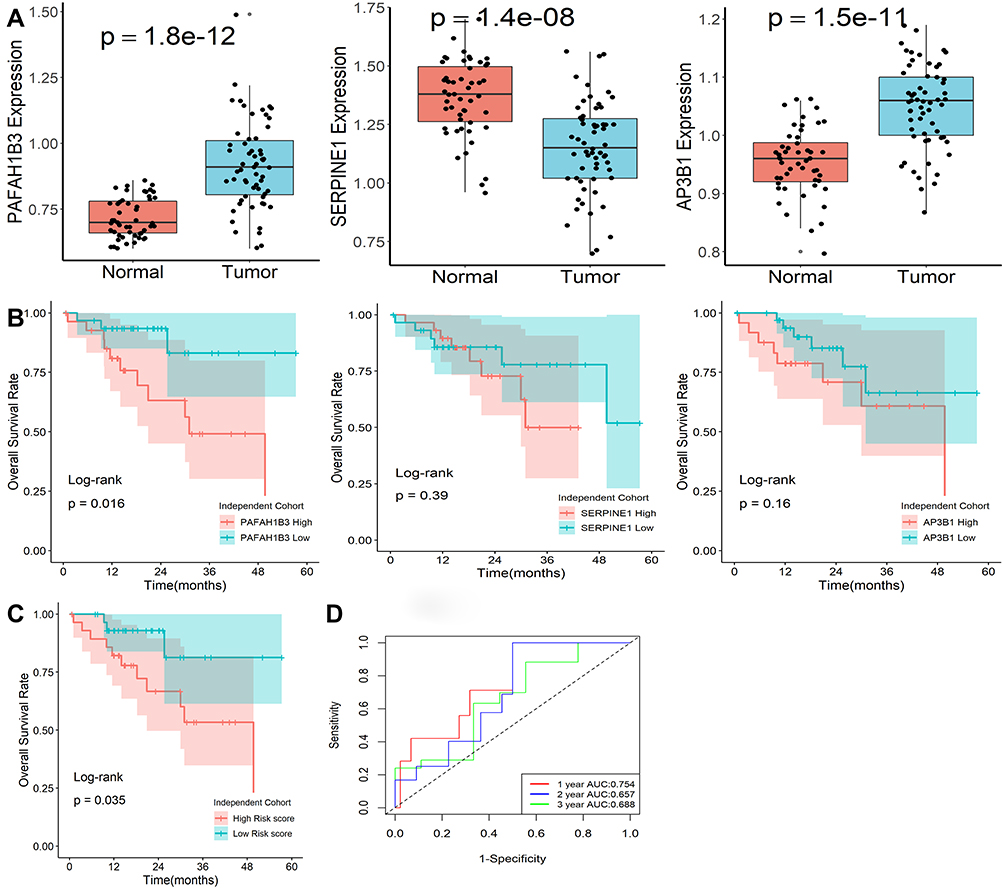 |
Figure 7 Expression levels of genes in this classifier detected by qRT-PCR. (A) Expression levels of the three mRNA molecules were explored in 50 normal and 59 HCC tissues. (B) Kaplan-Meier survival plot of the three genes in 59 HCC tissues. (C) Kaplan-Meier survival plot of risk score. (D) Characteristics of predicted 1-, 2-, and 3-year OS rates in ROC analysis. |
Downregulation of PAFAH1B3 Remarkably Inhibited the Proliferation and Migration Ability of Hep3B Cells
Considering that only PAFAH1B3 was associated with overall survival among the three genes in our collected clinical samples, we further explored the relationship between PAFAH1B3 expression and cell proliferation and migratory capacity. PAFAH1B3 siRNA transfection could significantly reduce PAFAH1B3 expression in Hep3B cells (Figure 8A). Cell proliferation capacity was significantly inhibited in Hep3B cells transfected with PAFAH1B3 siRNA according to the result of the CCK-8 assay (Figure 8B) and colony-formation assay (Figure 8C). In addition, the proportion of wound closure (Figure 8D) and the number of cells crossing the membrane (Figure 8E) in the siPAFAH1B3 group were significantly lower than in the negative control group, indicating that cell migration capacity was significantly inhibited in Hep3B cells by downregulating the expression of PAFAH1B3.
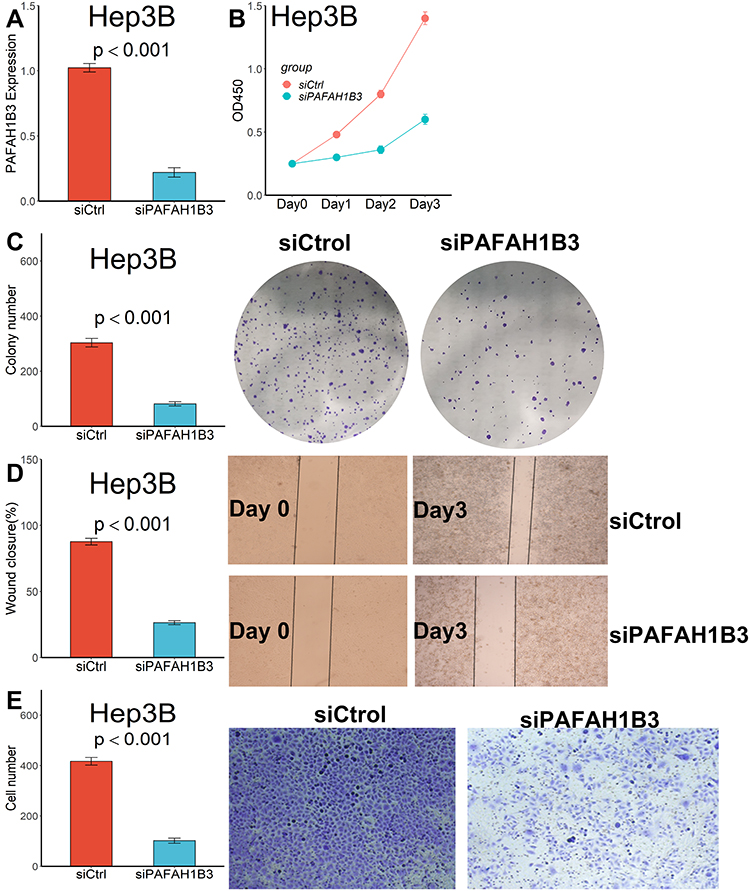 |
Figure 8 Downregulated PAFAH1B3 inhibited the proliferation and migration capacity in Hep3B cells. (A) PAFAH1B3 expression in Hep3B cells was significantly reduced by siRNA. (B) CCK-8 assay. (C) Colony-formation assay. (D) Wound healing assay. (E) Transwell assay. |
Discussion
There is growing evidence of complex mutual crosstalk between tumor cells and platelets not only in the blood but also in the TME.1,27 Tumor cells can transfer mutated RNA into platelets by releasing tumor-derived exosomes, thus altering the platelet RNA profile.28 Tumor cells may also promote increased platelet counts in patients by secreting thrombopoietic cytokines such as interleukin-1 (IL1), IL3, IL6, and IL11.29 In turn, platelets can promote tumor cells to maintain proliferative activity, assist tumor cells to resist cell death, and induce tumor angiogenesis.13,15 Platelets can also facilitate tumor invasion and migration by inducing an aggressive epithelial-mesenchymal transition (EMT) phenotype in tumor cells.30 Tumor-activated platelets can release large amounts of TGF-β and downregulate NKG2D expression, thereby protecting tumor cells from NK cell-mediated lysis.31 Therefore, tumor-associated platelet protein and RNA profiles may be useful biomarkers for cancer detection, prognosis prediction, and clinical treatment monitoring of HCC patients. In this study, after platelet-associated genes were collected in the GeneCards database, we first utilized a non-negative matrix decomposition algorithm to classify HCC patients into two molecular subtypes and significant differences in survival outcomes, and expression of ICIs genes, and TME of HCC patients between the two subtypes were found. Subsequently, we constructed and validated a prognostic stratification model based on platelet-related genes that can be effectively applied to the prognostic classification of HCC patients. Finally, we found that downregulation of PAFAH1B3 remarkably inhibited the proliferation and migration ability of Hep3B cells. Our findings may potentially guide the selection of optimal individualized antiplatelet therapy for HCC patients in future clinical practice.
Antiplatelet therapy has been abundantly shown to prevent the development of liver fibrosis and HCC by reducing platelet activation and infiltration of CD8+ T cells.32–34 In patients with poor efficacy of antiviral therapy, antiplatelet therapy may augment antiviral therapy to reduce the risk of HCC development.33 In addition, antiplatelet therapy was effective in preserving liver function and significantly improved the poor prognosis of HCC patients,35 and the same results were observed in mouse models.36 Antiplatelet therapy may also reduce the recurrence rate of HCC.37 Therefore, in clinical practice, patients with HCC should receive targeted antiplatelet therapy, such as oral aspirin, to reduce the number of liver-related deaths. Considering that most HCC patients have underlying cirrhosis, although antiplatelet therapy can effectively mitigate the progression of cirrhosis, there is still a chance that cirrhosis will occur and that pancytopenia will follow, including thrombocytopenia.38 For this reason, we propose a bold conjecture that the spontaneous reduction of platelets in HCC patients may be a protective mechanism to slow down their tumor progression. With the reduction of platelet count, the total expression of PAFAH1B3 in platelets also decreases, which is undoubtedly, and the reduced PAFAH1B3 can significantly inhibit the proliferation and migration of HCC cells, which confirms the effect of antiplatelet therapy from another perspective. However, when moderate or severe thrombocytopenia occurs, HCC patients are at risk for bleeding and antiplatelet therapy may not be appropriate at this time. Transfusion of gene-edited platelets containing PAFAH1B3 siRNA may be a good option. Of course, these need to be validated in vivo in vitro experiments in the future.
Serine family E member 1 (SERPINE1) is a serine protease inhibitor that regulates urokinase and plasminogen activator with the function of reducing excessive degradation of the extracellular matrix, regulating cell adhesion balance, and stimulating cell growth and vascular generation.39 It has been demonstrated that overexpressed SERPINE1 could facilitate the aggressiveness and invasiveness of tumor cells in colorectal cancer,40 esophageal cancer,41 gastric cancer,42 and breast cancer.43 SERPINE1 was also involved as a downstream of ELK3 in the regulation of prostate cancer proliferation, migration, and apoptosis.44 Adaptor protein complex 3 subunit β3A (AP3B1) was a protein-coding gene whose mutations could cause a rare autosomal recessive primary immunodeficiency called Hermansky Pudlak type 2 syndrome (HPS2)45 and Hemophagocytic lymphohistiocytosis (HLH).46 AP3B1 might also be involved in regulating the prognosis of HCC patients as a target of microRNA-9.47 In our study, we found SERPINE1 and AP3B1 expression significantly differed between normal and HCC tissues, while both of them were not associated with the overall survival of HCC patients, which may be related to our relatively small sample size, and follow-up experiments are still needed to verify it. Platelet-activating factor acetylhydrolase 1B catalytic subunit 3 (PAFAH1B3) is a member of the PAFAH1B complex, which could regulate the deacetylation activity of platelet-activating factor (PAF). In recent years, aberrant expression of PAFAH1B3 has been detected as a metabolic oncogene in different kinds of tumors, including gastric cancer,48 hypopharyngeal squamous cell carcinoma,49 and osteosarcoma.50 When analyzed using pan-cancer TCGA data, upregulated PAFAH1B3 was strongly associated with poor prognosis in a variety of tumors, including HCC.51 Consistent with previous studies, we found that PAFAH1B3 expression levels were significantly higher in HCC tissues compared to normal tissues and were independently associated with patient prognosis, and that reducing PAFAH1B3 with siRNA significantly inhibited the proliferative and migratory properties of Hep3B cells. All these results suggested that PAFAH1B3 could be utilized as a biomarker for HCC prognosis.
Undeniably, our study has some limitations. The diversity and individual variability of HCC patients may reduce the performance of this feature. In addition, the small sample size limits the validation of the model, and future multicenter randomized controlled studies are needed to evaluate this feature. Finally, the specific mechanism of the PAFAH1B3 gene in HCC needs to be further evaluated by more in vivo and in vitro experiments in the future.
Conclusions
In summary, we constructed and validated a prognostic stratification model based on platelet-related genes that can be effectively applied to the prognostic classification of HCC patients, and we found that downregulation of PAFAH1B3 remarkably inhibited the proliferation and migration ability of Hep3B cells. Our findings may potentially provide new light on the selection of optimal individualized antiplatelet therapy for HCC patients in future clinical practice.
Data Sharing Statement
The datasets analyzed in this study can be found at https://xena.ucsc.edu, https://dcc.icgc.org/projects/LIRI-JP, and https://www.ncbi.nlm.nih.gov/geo.
Ethics Approval and Consent to Participate
This study was carried out following the Declaration of Helsinki and supported by the Ethics Committees of Zhengzhou University. All patients signed written informed consent.
Funding
There is no funding to report.
Disclosure
The author reports no conflicts of interest in relation to this work.
References
1. Xu XR, Yousef GM, Ni H. Cancer and platelet crosstalk: opportunities and challenges for aspirin and other antiplatelet agents. Blood. 2018;131(16):1777–1789. doi:10.1182/blood-2017-05-743187
2. Palacios-Acedo AL, Mège D, Crescence L, Dignat-George F, Dubois C, Panicot-Dubois L. Platelets, thrombo-inflammation, and cancer: collaborating with the enemy. Front Immunol. 2019;10:1805. doi:10.3389/fimmu.2019.01805
3. Sylman JL, Boyce HB, Mitrugno A, et al. A temporal examination of platelet counts as a predictor of prognosis in lung, prostate, and colon cancer patients. Sci Rep. 2018;8(1):6564. doi:10.1038/s41598-018-25019-1
4. Zu R, Yu S, Yang G, et al. Integration of platelet features in blood and platelet rich plasma for detection of lung cancer. Clin Chim Acta. 2020;509:43–51. doi:10.1016/j.cca.2020.05.043
5. Rachidi S, Md P, Kaur MM, Lautenschlaeger TM, Li Z, Md P. Platelet count correlates with stage and predicts survival in melanoma. Platelets. 2019;30(8):1042–1046. doi:10.1080/09537104.2019.1572879
6. Hu Q, Hada A, Han L. Platelet count as a biomarker for monitoring treatment response and disease recurrence in recurrent epithelial ovarian cancer. J Ovarian Res. 2020;13(1):78. doi:10.1186/s13048-020-00682-z
7. Mammadova-Bach E, Gil-Pulido J, Sarukhanyan E, et al. Platelet glycoprotein VI promotes metastasis through interaction with cancer cell-derived galectin-3. Blood. 2020;135(14):1146–1160. doi:10.1182/blood.2019002649
8. Meikle CK, Kelly CA, Garg P, Wuescher LM, Ali RA, Worth RG. Cancer and thrombosis: the platelet perspective. Front Cell Dev Biol. 2016;4:147. doi:10.3389/fcell.2016.00147
9. Schulman S. How I treat recurrent venous thromboembolism in patients receiving anticoagulant therapy. Blood. 2017;129(25):3285–3293. doi:10.1182/blood-2017-03-742304
10. D’Ambrosi S, Nilsson RJ, Wurdinger T. Platelets and tumor-associated RNA transfer. Blood. 2021;137(23):3181–3191. doi:10.1182/blood.2019003978
11. Leblanc R, Peyruchaud O. Metastasis: new functional implications of platelets and megakaryocytes. Blood. 2016;128(1):24–31. doi:10.1182/blood-2016-01-636399
12. Li N. Platelets in cancer metastasis: to help the “villain” to do evil. Int J Cancer. 2016;138(9):2078–2087. doi:10.1002/ijc.29847
13. Cho MS, Bottsford-Miller J, Vasquez HG, et al. Platelets increase the proliferation of ovarian cancer cells. Blood. 2012;120(24):4869–4872. doi:10.1182/blood-2012-06-438598
14. Battinelli EM, Markens BA, Kulenthirarajan RA, Machlus KR, Flaumenhaft R, Italiano JE
15. Farooqi AA, Siddik ZH. Platelet-derived growth factor (PDGF) signalling in cancer: rapidly emerging signalling landscape. Cell Biochem Funct. 2015;33(5):257–265. doi:10.1002/cbf.3120
16. Holmes CE, Levis JE, Schneider DJ, et al. Platelet phenotype changes associated with breast cancer and its treatment. Platelets. 2016;27(7):703–711. doi:10.3109/09537104.2016.1171302
17. Paolacci S, Precone V, Acquaviva F, et al. Genetics of lipedema: new perspectives on genetic research and molecular diagnoses. Eur Rev Med Pharmacol Sci. 2019;23(13):5581–5594. doi:10.26355/eurrev_201907_18292
18. Tang Z, Li C, Kang B, Gao G, Li C, Zhang Z. GEPIA: a web server for cancer and normal gene expression profiling and interactive analyses. Nucleic Acids Res. 2017;45(W1):W98–w102. doi:10.1093/nar/gkx247
19. Zhou Y, Zhou B, Pache L, et al. Metascape provides a biologist-oriented resource for the analysis of systems-level datasets. Nat Commun. 2019;10(1):1523. doi:10.1038/s41467-019-09234-6
20. Yoshihara K, Shahmoradgoli M, Martínez E, et al. Inferring tumour purity and stromal and immune cell admixture from expression data. Nat Commun. 2013;4(1):2612. doi:10.1038/ncomms3612
21. Gentles AJ, Newman AM, Liu CL, et al. The prognostic landscape of genes and infiltrating immune cells across human cancers. Nat Med. 2015;21(8):938–945. doi:10.1038/nm.3909
22. Su L, Zhang G, Kong X. Prognostic significance of pregnancy zone protein and its correlation with immune infiltrates in hepatocellular carcinoma. Cancer Manag Res. 2020;12:9883–9891. doi:10.2147/CMAR.S269215
23. Zhang G. Expression and prognostic significance of BANF1 in triple-negative breast cancer. Cancer Manag Res. 2020;12:145–150. doi:10.2147/CMAR.S229022
24. Reinhold WC, Sunshine M, Liu H, et al. CellMiner: a web-based suite of genomic and pharmacologic tools to explore transcript and drug patterns in the NCI-60 cell line set. Cancer Res. 2012;72(14):3499–3511. doi:10.1158/0008-5472.CAN-12-1370
25. Colwill K, Gräslund S. A roadmap to generate renewable protein binders to the human proteome. Nat Methods. 2011;8(7):551–558. doi:10.1038/nmeth.1607
26. Nusinow DP, Szpyt J, Ghandi M, et al. Quantitative proteomics of the cancer cell line encyclopedia. Cell. 2020;180(2):387–402.e316. doi:10.1016/j.cell.2019.12.023
27. Schlesinger M. Role of platelets and platelet receptors in cancer metastasis. J Hematol Oncol. 2018;11(1):125. doi:10.1186/s13045-018-0669-2
28. Best MG, Sol N, Kooi I, et al. RNA-seq of tumor-educated platelets enables blood-based pan-cancer, multiclass, and molecular pathway cancer diagnostics. Cancer Cell. 2015;28(5):666–676. doi:10.1016/j.ccell.2015.09.018
29. Lin RJ, Afshar-Kharghan V, Schafer AI. Paraneoplastic thrombocytosis: the secrets of tumor self-promotion. Blood. 2014;124(2):184–187. doi:10.1182/blood-2014-03-562538
30. Labelle M, Begum S, Hynes RO. Direct signaling between platelets and cancer cells induces an epithelial-mesenchymal-like transition and promotes metastasis. Cancer Cell. 2011;20(5):576–590. doi:10.1016/j.ccr.2011.09.009
31. Placke T, Salih HR, Kopp HG. GITR ligand provided by thrombopoietic cells inhibits NK cell antitumor activity. J Immunol. 2012;189(1):154–160. doi:10.4049/jimmunol.1103194
32. Iqbal U, Dennis BB, Li AA, et al. Use of anti-platelet agents in the prevention of hepatic fibrosis in patients at risk for chronic liver disease: a systematic review and meta-analysis. Hepatol Int. 2019;13(1):84–90. doi:10.1007/s12072-018-9918-2
33. Lee M, Chung GE, Lee JH, et al. Antiplatelet therapy and the risk of hepatocellular carcinoma in chronic hepatitis B patients on antiviral treatment. Hepatology. 2017;66(5):1556–1569. doi:10.1002/hep.29318
34. Sitia G, Iannacone M, Guidotti LG. Anti-platelet therapy in the prevention of hepatitis B virus-associated hepatocellular carcinoma. J Hepatol. 2013;59(5):1135–1138. doi:10.1016/j.jhep.2013.05.040
35. Hayashi T, Shibata M, Oe S, Miyagawa K, Honma Y, Harada M. Antiplatelet therapy improves the prognosis of patients with hepatocellular carcinoma. Cancers. 2020;12(11):3215. doi:10.3390/cancers12113215
36. Sitia G, Aiolfi R, Di Lucia P, et al. Antiplatelet therapy prevents hepatocellular carcinoma and improves survival in a mouse model of chronic hepatitis B. Proc Natl Acad Sci U S A. 2012;109(32):E2165–2172. doi:10.1073/pnas.1209182109
37. Tan RZH, Lockart I, Abdel Shaheed C, Danta M. Systematic review with meta-analysis: the effects of non-steroidal anti-inflammatory drugs and anti-platelet therapy on the incidence and recurrence of hepatocellular carcinoma. Aliment Pharmacol Ther. 2021;54(4):356–367. doi:10.1111/apt.16515
38. Alvaro D, Caporaso N, Giannini EG, et al. Procedure-related bleeding risk in patients with cirrhosis and severe thrombocytopenia. Eur J Clin Invest. 2021;51(6):e13508. doi:10.1111/eci.13508
39. Azimi I, Petersen RM, Thompson EW, Roberts-Thomson SJ, Monteith GR. Hypoxia-induced reactive oxygen species mediate N-cadherin and SERPINE1 expression, EGFR signalling and motility in MDA-MB-468 breast cancer cells. Sci Rep. 2017;7(1):15140. doi:10.1038/s41598-017-15474-7
40. Mazzoccoli G, Pazienza V, Panza A, et al. ARNTL2 and SERPINE1: potential biomarkers for tumor aggressiveness in colorectal cancer. J Cancer Res Clin Oncol. 2012;138(3):501–511. doi:10.1007/s00432-011-1126-6
41. Klimczak-Bitner AA, Kordek R, Bitner J, Musiał J, Szemraj J. Expression of MMP9, SERPINE1 and miR-134 as prognostic factors in esophageal cancer. Oncol Lett. 2016;12(5):4133–4138. doi:10.3892/ol.2016.5211
42. Liao P, Li W, Liu R, et al. Genome-scale analysis identifies SERPINE1 and SPARC as diagnostic and prognostic biomarkers in gastric cancer. Onco Targets Ther. 2018;11:6969–6980. doi:10.2147/OTT.S173934
43. Zhang Q, Lei L, Jing D. Knockdown of SERPINE1 reverses resistance of triple‑negative breast cancer to paclitaxel via suppression of VEGFA. Oncol Rep. 2020;44(5):1875–1884. doi:10.3892/or.2020.7770
44. Mao Y, Li W, Hua B, et al. Silencing of ELK3 induces S-M phase arrest and apoptosis and upregulates SERPINE1 expression reducing migration in prostate cancer cells. Biomed Res Int. 2020;2020:2406159. doi:10.1155/2020/2406159
45. Lorenzi L, Tabellini G, Vermi W, et al. Occurrence of nodular lymphocyte-predominant Hodgkin lymphoma in hermansky-pudlak type 2 syndrome is associated to natural killer and natural killer T cell defects. PLoS One. 2013;8(11):e80131. doi:10.1371/journal.pone.0080131
46. Miao Y, Zhu HY, Qiao C, et al. Pathogenic gene mutations or variants identified by targeted gene sequencing in adults with hemophagocytic lymphohistiocytosis. Front Immunol. 2019;10:395.
47. Zhang J, Cheng J, Zeng Z, et al. Comprehensive profiling of novel microRNA-9 targets and a tumor suppressor role of microRNA-9 via targeting IGF2BP1 in hepatocellular carcinoma. Oncotarget. 2015;6(39):42040–42052. doi:10.18632/oncotarget.5969
48. Xie T, Guo X, Wu D, et al. PAFAH1B3 expression is correlated with gastric cancer cell proliferation and immune infiltration. Front Oncol. 2021;11:591545. doi:10.3389/fonc.2021.591545
49. Xu J, Zang Y, Cao S, Lei D, Pan X. Aberrant expression of PAFAH1B3 associates with poor prognosis and affects proliferation and aggressiveness in hypopharyngeal squamous cell carcinoma. Onco Targets Ther. 2019;12:2799–2808. doi:10.2147/OTT.S196324
50. Fan J, Yang Y, Qian JK, et al. Aberrant expression of PAFAH1B3 affects proliferation and apoptosis in osteosarcoma. Front Oncol. 2021;11:664478. doi:10.3389/fonc.2021.664478
51. Kumari R, Majumder MM, Lievonen J, et al. Prognostic significance of esterase gene expression in multiple myeloma. Br J Cancer. 2021;124(8):1428–1436. doi:10.1038/s41416-020-01237-1
 © 2022 The Author(s). This work is published and licensed by Dove Medical Press Limited. The full terms of this license are available at https://www.dovepress.com/terms.php and incorporate the Creative Commons Attribution - Non Commercial (unported, v3.0) License.
By accessing the work you hereby accept the Terms. Non-commercial uses of the work are permitted without any further permission from Dove Medical Press Limited, provided the work is properly attributed. For permission for commercial use of this work, please see paragraphs 4.2 and 5 of our Terms.
© 2022 The Author(s). This work is published and licensed by Dove Medical Press Limited. The full terms of this license are available at https://www.dovepress.com/terms.php and incorporate the Creative Commons Attribution - Non Commercial (unported, v3.0) License.
By accessing the work you hereby accept the Terms. Non-commercial uses of the work are permitted without any further permission from Dove Medical Press Limited, provided the work is properly attributed. For permission for commercial use of this work, please see paragraphs 4.2 and 5 of our Terms.