")
Back to Journals » Diabetes, Metabolic Syndrome and Obesity » Volume 11
Plasma stearoyl-CoA desaturase activity indices and bile acid concentrations after a low-fat meal: association with a genetic variant in the FTO gene
Authors Skuladottir GV , Oskarsdottir H , Pisanu C , Sjödin M, Lindberg J , Mwinyi J, Schiöth HB
Received 30 May 2018
Accepted for publication 23 July 2018
Published 9 October 2018 Volume 2018:11 Pages 611—618
DOI https://doi.org/10.2147/DMSO.S175730
Checked for plagiarism Yes
Review by Single anonymous peer review
Peer reviewer comments 3
Editor who approved publication: Professor Ming-Hui Zou
Gudrun Valgerdur Skuladottir,1,2 Harpa Oskarsdottir1 Claudia Pisanu,2,3 Marcus Sjödin,4 Johan Lindberg,4 Jessica Mwinyi,2 Helgi Birgir Schiöth2
1Department of Physiology, Faculty of Medicine, University of Iceland, Reykjavik, Iceland; 2Department of Neuroscience, Functional Pharmacology, Uppsala University, Uppsala, Sweden; 3Department of Biomedical Sciences, University of Cagliari, Cagliari, Italy; 4Swetox, Karolinska Institutet, Unit of Toxicological Sciences, Södertälje, Sweden
Purpose: Dietary macronutrient composition, stearoyl-CoA desaturase (SCD) activity indices, and primary bile acid (BA) concentrations are among the factors that have been associated with lipid metabolism and contributed to obesity. We investigated the association between the polymorphic expression of the fat mass and obesity-associated (FTO) gene and its relationship with SCD activity indices and primary BA concentrations after a low-fat meal.
Subjects and methods: Blood plasma samples were collected from 56 young (20–36 years) healthy subjects with different rs9939609 FTO genotypes. Fasting and post-meal (2 hours after a low-fat breakfast) blood samples were collected on the subsequent morning for the analysis of DNA methylation, SCD activity indices (product-to-precursor fatty acid ratios; 16:1n-7/16:0 and 18:1n-9/18:0), and chenodeoxycholic acid (CDCA) and cholic acid (CA) concentrations. Expression of lipogenic genes was investigated post-meal to assess the relationship between the CDCA and CA concentrations and mRNA levels of lipogenic genes.
Results: The FTO AA (obesity risk) genotype group (n=18) had higher (P<0.05) post-meal SCD-16 activity index than the FTO TT (wild type) genotype group (n=26). In both the FTO TT (n=16) and AA (n=8) genotype groups, the post-meal concentrations of CDCA and CA were lower (P<0.05) compared with the fasted state. No difference in BA concentrations between the FTO TT and AA genotype groups in both meal states was observed. After adjusting for the body mass index, the highest 50% post-meal concentrations of CA were inversely (P=0.010) correlated with the level of mRNA SCD expression.
Conclusion: FTO AA carriers may be at a higher risk for obesity through higher SCD activity in a low-fat diet environment. This effect may be partly pronounced by very low CA concentrations.
Keywords: rs9939609, dietary fat, SCD activity, cholic acid, lipid metabolism
Introduction
Obesity is a complex disease resulting from the interactions of a wide variety of hereditary and environmental factors and is the major cause of human morbidity as there is an increased mortality of overweight and obesity.1–3 The first common genetic polymorphisms to be associated with increased body weight and obesity were the genetic variants of the fat mass and obesity-associated (FTO) gene,4 predominantly the single-nucleotide polymorphism (SNP) rs9939609 within intron one of the FTO genes.5 Both animal and human studies have indicated that dietary macronutrient composition may modify the association between the FTO variant and obesity. However, the association between FTO gene expression and dietary macronutrient intake is somewhat controversial.6,7
Body mass index (BMI) is associated with the induction of triglyceride (TG) synthesis, which is highly dependent on stearoyl-CoA desaturase 1 (SCD1) gene expression.8 The enzyme SCD, predominantly expressed in the liver, plays a central role in the desaturation of saturated fatty acids and has been associated with the onset of obesity and obesity-related diseases.9–12 The SCD activity index (product-to-precursor fatty acid ratios; 16:1n-7/16:0 and 18:1n-9/18:0) derived from total lipids in plasma explained 44% of the variance in TGs, when human subjects were exposed to a high carbohydrate diet.9 According to the literature, high-carbohydrate diets act through modulation of hepatic SCD activity and increase the conversion of carbohydrates to monounsaturated fatty acids (16:1n-7 and 18:1n-9). This step enhances hepatic TG synthesis, secretion, and storage in the adipose tissue, contributing to the development of obesity.11 Furthermore, animal studies have shown that the hepatic expression of the Scd1 gene is differentially affected by dietary content of carbohydrate and lipid, indicating that macronutrient diets affect lipid metabolism in the liver via epigenetic mechanisms.13
Bile acids (BAs) are recognized as nutrient signaling hormones in the body and regulate their own synthesis and enterohepatic circulation through the activation of various signaling pathways, along with maintaining TG, cholesterol, glucose, and energy homeostasis.14 The primary BAs in humans, chenodeoxycholic acid (CDCA) and cholic acid (CA), are synthesized from cholesterol in liver hepatocytes,15 where they are natural ligands of the nuclear transcription factor farnesoid X receptor (FXR).16 Studies suggest that FXR plays a role in mediating the TG-lowering effects of BAs by reducing the expression of lipogenic genes and their regulators, including the SCD enzyme.17,18 It is indicated that one of the underlying mechanisms of FXR in preventing hepatic TG accumulation is due to the activation of FXR-mediated small heterodimer partner (SHP).17 Moreover, CA-treated animal models of hypertriglyceridemia significantly reduced the expression of genes encoding enzymes involved in fatty acid and TG biosynthesis, such as SCD-1, in liver.17.
Today, the impact of dietary macronutrient composition is controversially discussed regarding the field of genetic factors that are involved in the etiology of obesity. We, therefore, wanted to investigate the effect of a low-fat breakfast on plasma SCD activity indices and concentrations of the primary BAs, CDCA and CA, in young and healthy subjects with focus on different rs9939609 FTO alleles. Importantly, we also investigated the relationship between the post-meal plasma concentrations of CDCA and CA and their associations with the expression of the lipogenic genes, SCD, FXR, and SHP, to obtain a further insight into the role of BA in lipid homeostasis under different strong lipogenic conditions taking FTO genotype and macronutrient composition of a diet into an account.
Subjects and methods
Subjects
This study is a part of a larger project aimed at recruiting healthy volunteers to investigate the epigenetic influences on food intake and metabolic effects in subjects carrying genetic variants predisposing to obesity, such as the common risk variant rs9939609 in the FTO gene. Inclusion and exclusion criteria have been previously described.19 This study was registered with ClinicalTrials.gov LSF008786. A total of 56 young (median age 25.5 years, range 20–36 years) healthy subjects (86% men and 14% women) of three genotypes of the FTO gene were recruited. Of whom, 18 subjects were homozygous for the FTO rs9939609 obesity-risk A allele (FTO AA genotype group), 26 subjects were homozygous for the FTO rs9939609 wild-type T allele (FTO TT genotype group), and 12 subjects were heterozygous for the FTO rs9939609 obesity-risk A allele (FTO AT genotype group). Written informed consent was obtained from each participant included in the study, and the study protocol conforms to the ethical guidelines of the 1975 Declaration of Helsinki. The study was approved by the local ethical committee in Uppsala (EPN), number: 2010/201.
Study design
After an overnight (10–12 hours) fast, the subjects were admitted to the University of Uppsala at 9.00 am and the first blood samples were collected in EDTA tubes (fasted state). Subsequently, the subjects were taken a breakfast containing one jar of Kvarg Arla (0.1% fat), one piece of Fruktkusar bread, and three slices of Leerdammer cheese. The total energy of the diet was 581 kcal, which provided 37% as carbohydrate (13.6% glucose), 18% as fat (10% saturated fat), and 45% as protein. The weight and height of subjects were recorded. Two hours after the breakfast, blood samples were collected again (post-meal state). The fasting and post-meal plasma samples were separated from whole blood samples, frozen at –80°C, and stored until fatty acid and BA analyses.
Determination of SCD activity indices
The analysis of fatty acids in plasma phospholipids (PL) was carried out at the University of Iceland. The total plasma lipid fraction was extracted with chloroform–methanol (2:1, v/v), using a well-established method.20 PL were separated on a thin layer chromatograph plate using the solvent system petroleum ether/diethyl ether/acetic acid (80:20:1, v/v/v). The PL fatty acids were methylated with 14% boron trifluoride in methanol, and the fatty acid methyl esters (FAME) were analyzed by an HP Series II 5890 A, Gas Chromatograph (Hewlett Packard Co/Agilent Technologies, Palo Alto, CA, USA). The FAME were identified and calibrated against commercial standards (Sigma Chemical Co./Nu-Check-Prep, Elysian, MN, USA). The results were expressed as percentage of total fatty acids in plasma PL. Activity indices of SCD-16 and SCD-18 were determined calculating the ratios of 16:1n-7/16:0 and 18:1n-9/18:0, respectively, derived from plasma PL.
Determination of BAs
The analysis of CDCA and CA in plasma of a subgroup of the FTO TT genotype (n=16) and FTO AA genotype (n=8) was carried out at the Karolinska Institutet, Unit of Toxicological Sciences (Swetox). Briefly, a total of 60 µL of plasma collected at fasted state and post-meal state were mixed with methanol containing isotopically labeled internal standards of d4-CA (10 nM) and d4-CDCA (20 nM). The precipitated proteins were removed by centrifugation, and the supernatant was subjected for LC–MS/MS analysis. The BAs were chromatographically separated on an Acquity™ (Waters, Milford, MA, USA) using gradient elution (solvent A: 10 mM NH4Ac, pH 5; solvent B: acetonitrile) on a 100×2.1 mm HSS T3 column (Waters, Milford, MA, USA). The mass spectrometer was a Xevo™ TQD (Waters, Milford, MA, USA) operating in multiple reaction monitoring negative electrospray ionization mode. The quantification was achieved using external calibrators (n=6) prepared in methanol. Interleaved with the primary samples, a set of QC samples at three different concentration levels were also analyzed. The used method covered a set of 67 conjugated and unconjugated BAs. For this report, only the primary BAs, CA and CDCA, were quantified and subjected for further statistical analysis.
Gene expression
For each subject, fasting and post-meal blood samples were collected into PAXgene Blood RNA tubes and RNA extracted using the PreAnalytiX PAXgene Blood RNA Kit (Qiagen NV, Venlo, the Netherlands). RNA concentration and quality were evaluated using the NanoDrop Technologies ND-1000 spectrophotometer and the Agilent 2100 Bioanalyzer system, respectively. Total RNA (250 ng) from each sample was used to obtain amplified and biotinylated sense strand complementary DNA from the expressed genome, and RNA expression was measured using the GeneChip Human Gene 2.1 ST arrays as previously described19 at the Uppsala University Biomedical Center. In the present study, only mRNA levels of selected genes (SCD, FXR, and SHP) were extracted and analyzed.
Statistical analyses
Kruskal–Wallis test was used to compare the data of age and BMI between the FTO TT, AT, and AA genotype groups. Differences in plasma PL levels of 16:0, 16:1n-7, 18:0, and 18:ln-9 and the ratios 16:1n-7/16:0 and 18:ln-9/18:0, fasted and 2 hours after the low-fat breakfast, within each FTO TT, AT, and AA genotype groups, and between those groups were compared with one-way ANOVA and post hoc Tukey test. A P-value of <0.05 was considered to be statistically significant.
The BAs, CDCA and CA, with nonmissing values in ≥90% of subjects were selected. Values under the detectability concentrations were coded as missing. The Shapiro–Wilk test was used to check the normality of distribution. To compare concentrations of normally or nonnormally distributed BA concentrations between FTO AA and TT genotype groups, Student’s t-test and Mann–Whitney test were used, respectively. In the second step, differences in BA concentrations between fasted and post-meal states (effect of breakfast) were compared using a nonparametric paired test (Wilcoxon signed-rank test) in both FTO TT and AA genotype groups. Analyses were conducted using SPSS v.20.
mRNA levels were available for SCD, FXR, and SHP genes. Transcriptomic raw intensity data were normalized using the RNA algorithm with the oligo package in R (v.3.3.1). Duplicated and nonannotated probes were excluded using the genefilter package. Expression levels of selected genes were extracted using R, and for each gene, a linear model was constructed using mRNA levels as predictors, BMI as a covariate, and BA concentrations as the outcome. The same models were constructed stratifying the sample in two groups according to low (n=6) or high (n=6) concentrations of the two BAs compared with the median concentrations. Multiple-testing correction was done according to Bonferroni: a P-value of 0.016 (=0.05/3) was considered to be statistically significant.
Results
There was no difference in age (years) or BMI (kg/m2) between the FTO TT, AT, and AA genotype groups (Table 1). One subject in the FTO TT genotype group (n=26), three subjects in the FTO AA genotype group (n=18), and no subject in the FTO AT genotype group (n=12) had BMI >30 kg/m2.
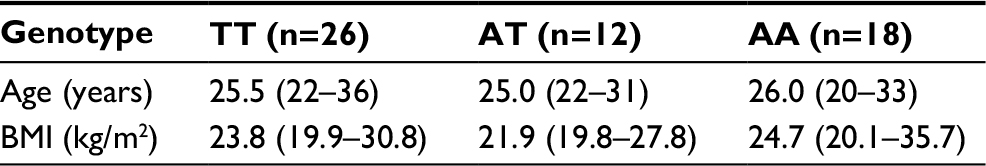 | Table 1 Characteristics of study subjects homozygous for the low-risk T allele (TT), heterozygous for the obesity-risk A allele (AT), and homozygous for the obesity-risk A allele (AA) Notes: Data are presented as median (range). No difference (P>0.05) in age and BMI between the study groups was observed; Kruskal–Wallis test. Abbreviation: BMI, body mass index. |
In the fasted state, there was no significant difference between the levels of the SCD precursors and products, 16:0 and 16:1n-7, and 18:0 and 18:1n-9, respectively, between the three FTO genotype groups (Table 2). However, 2 hours after the low-fat breakfast, the level of 16:1n-7 in plasma PL was significantly higher (P<0.05) in the FTO AA genotype group than in the FTO TT genotype group (Table 2), resulting in a significantly elevated (P<0.05) SCD-16 activity index in the FTO AA genotype group than in the FTO TT genotype group (Figure 1).
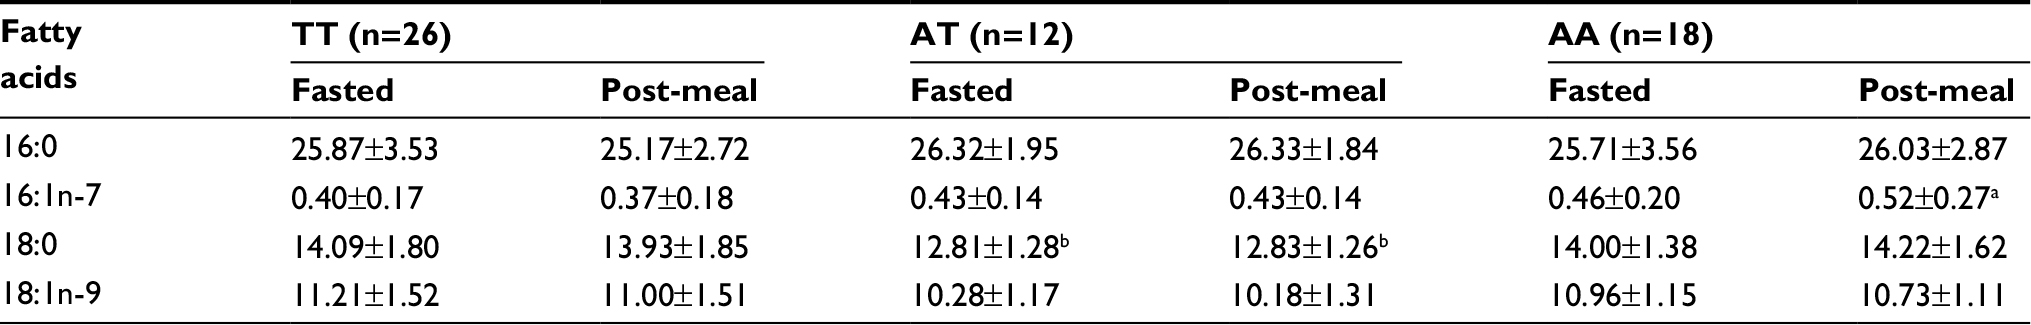 | Table 2 Fatty acid levels (% of total fatty acids) in plasma phospholipids of the FTO TT, AT, and AA genotype groups both at fasted state and 2 hours after the low-fat breakfast (post-meal state) Notes: Data are presented as mean±SD. aP<0.05 compared with the FTO TT genotype group at post-meal state; one-way ANOVA with post hoc Tukey test. bP<0.05 compared with the FTO TT and AA genotype groups at fasted and post-meal states; one-way ANOVA with post hoc Tukey test. |
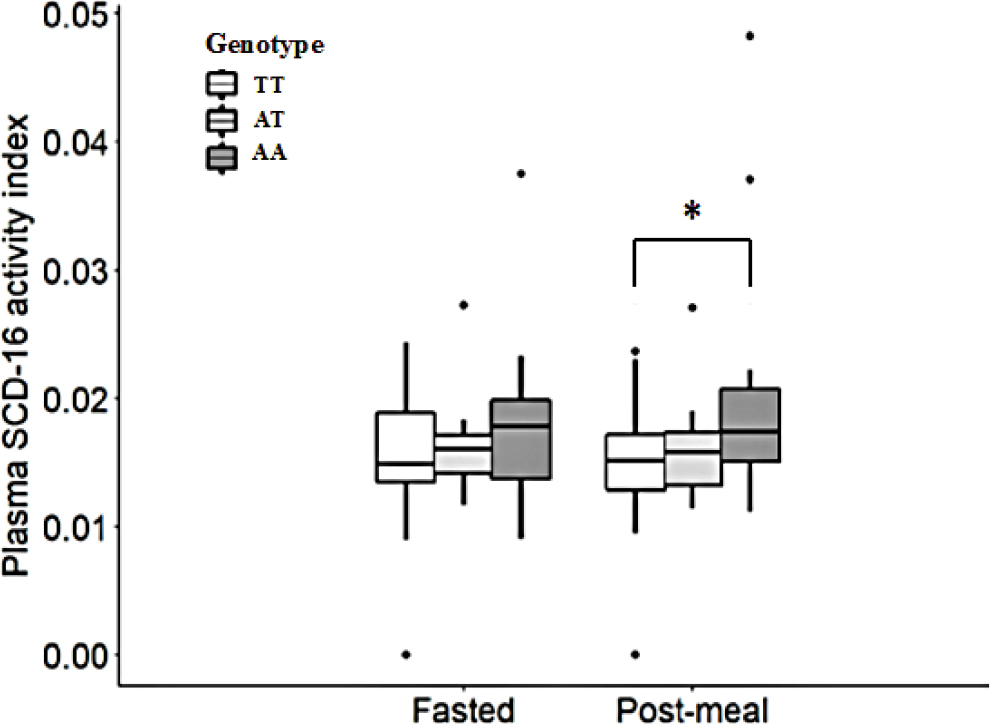 | Figure 1 Plasma SCD-16 activity index (16:1n-7/16:0) (medium [range]) derived from plasma phospholipids of the subjects with the FTO TT (n=26), AT (n=12), and AA (n=18) genotypes at fasted state and 2 hours after the low-fat breakfast (post-meal state). Notes: *P<0.05, compared with the FTO TT genotype group at post-meal state. One-way ANOVA with post hoc Tukey test. Abbreviations: SCD, stearoyl-CoA desaturase. |
Expression of lipogenic genes was investigated 2 hours after the low-fat breakfast in a subgroup of the participants, eight subjects with FTO TT genotype and four subjects with FTO AA genotype. Subgroups were chosen based on the amount CDCA and CA produced, ie, including individuals (n=6) in the highest and individuals (n=6) in the lowest quartile to investigate any CDCA-FXR- and CA-FXR-related differences in the expression of lipogenic genes, since no significant difference was found in the plasma concentrations of CDCA and CA between the FTO TT and AA genotype groups 2 hours after the low-fat breakfast (Figure 2). Linear regression analysis was then used to assess the relationship between the plasma concentrations of CDCA and CA and the mRNA levels of SCD, FXR, and SHP. After adjusting for BMI, the highest 50% concentrations of CA were negatively (P=0.010) correlated with the level of SCD mRNA expression (Table 3), while no significant association was observed for expression mRNA levels of FXR and SHP. No significant relationship was observed between the post-meal plasma concentrations of CDCA and CA and mRNA levels of SCD, FXR, and SHP in the whole FTO genotype groups (n=12), in those corresponding to the lowest or the highest 50% of the CDCA and CA concentrations when unadjusted for BMI, or the lowest or the highest 50% concentrations of CDCA adjusted for BMI (data not shown).
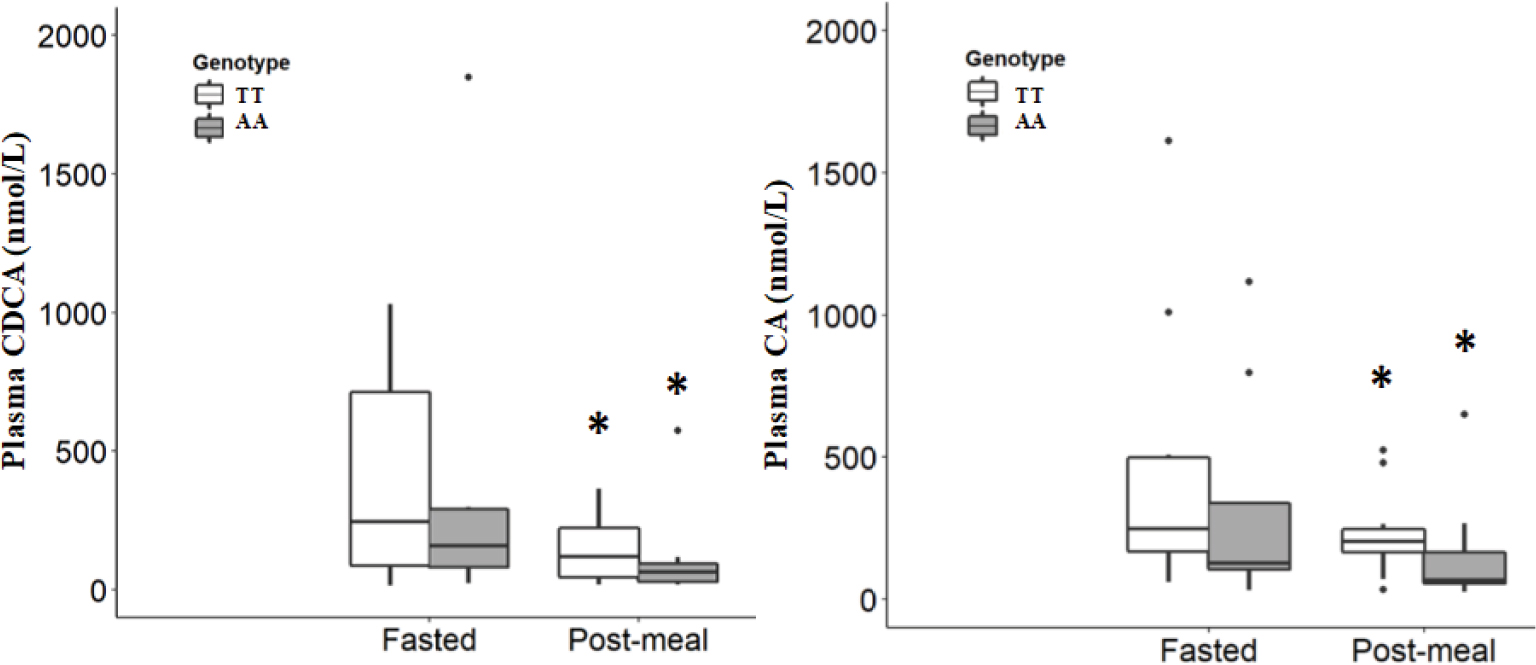 | Figure 2 Plasma concentrations (medium [range]) of the bile acids CDCA (left) and CA (right) in the FTO TT (n=16) and AA (n=8) genotype groups at fasted state and 2 hours after the low-fat breakfast (post-meal state). Notes: *P<0.05, compared with the fasted state within each genotype group. Wilcoxon signed-rank test. Abbreviations: CA, cholic acid; CDCA, chenodeoxycholic acid. |
 | Table 3 Relationship between plasma concentrations of CA and gene expression of SCD mRNA 2 hours after a low-fat breakfast (post-meal state) Notes: Linear regression analyses were performed for the estimation of relationship between plasma concentrations of CA as outcome variable and SCD mRNA and BMI as independent variables. Abbreviations: BMI, body mass index; CA, cholic acid; SCD, stearoyl-CoA desaturase. |
Plasma CDCA and CA concentrations from a subgroup of the participants were analyzed, 16 subjects with the FTO TT genotype and eight subjects with the FTO AA genotype. No significant difference was found in the plasma concentrations of CDCA and CA between the FTO TT and AA genotype groups at fasted state or 2 hours after the low-fat breakfast. In contrast, 2 hours after the breakfast, the plasma concentrations of both CDCA and CA were significantly decreased (P<0.05) compared with those concentrations in fasted state within each FTO TT and AA genotype groups (Figure 2).
Discussion
To our knowledge, this is the first study that investigates the association between the polymorphic expression of FTO (rs9939609) and its relationship with SCD activity indices and concentrations of the primary BAs, CDCA and CA, in a low-fat diet environment. We noted that after the low-fat breakfast, the plasma SCD-16 activity index was significantly higher in the young healthy subjects homozygous for the FTO rs9939609 obesity-risk A allele than in those homozygous for the FTO rs9939609 wild-type T allele. In addition, we observed that after the low-fat breakfast, the plasma concentrations of CDCA and CA decreased independently of rs9939609 FTO allele variants and that high post-meal plasma CA concentrations were negatively correlated with the level of mRNA SCD expression when adjusted for BMI.
The FTO gene has been extensively studied in relation to dietary macronutrient composition and susceptibility for obesity.7,21 In a population-based prospective cohort study among middle-aged subjects in Sweden using dietary data of high validity, the subjects homozygous for the FTO rs9939609 obesity-risk A allele reported higher percentages of energy from fat and lower percentages of energy from carbohydrate compared with the obese subjects not carrying any FTO risk alleles.7 However, no increased risk of obesity was observed among the subjects homozygous for the FTO rs9939609 obesity-risk A allele who consumed <41% of energy from fat. The most commonly used measure of obesity in epidemiological studies is BMI >30 kg/m2. In our study, no significant difference in BMI was observed between the groups with different variants of rs9939609 FTO alleles, which could be explained by the fact that only four of the subjects had BMI >30 kg/m2, ie, one with the FTO TT genotype (1.8%) and three with the FTO AA genotype (5.4%).
Over the last decade, there has been much interest in estimating the SCD activity (16:1n-7/16:0 ratio) derived from plasma lipids as a putative biomarker for the body fat regulation and development of obesity.22 The SCD activity has been shown to negatively correlate with cholesterol, to positively correlate with TG and plasma very-low density lipoprotein,9 and to be highly regulated by food intake.23 Higher SCD activity in plasma TG has been observed following a high-carbohydrate diet compared with a high-fat diet both in animals9 and humans.9,24 In addition, a study on mice that were deficient in the SCD gene showed that this made them resistant to high-carbohydrate diet-induced obesity and fatty liver.25 Moreover, higher SCD protein levels in the livers were observed in animals fed with a high-carbohydrate diet than in livers of those fed with a high-fat diet.13 Although this finding suggests that the SCD enzyme and de novo lipogenesis are upregulated in parallel, studies evaluating association between SCD activity in the liver and dietary macronutrients intake have been somewhat conflicting. There is evidence that SCD mRNA expression in the liver is associated with the major source of the carbohydrate-derived fatty acids that end up as TG in adipose tissue, since high relative expression levels of SCD mRNA was observed after a high-carbohydrate diet.13,24 Schwenk et al13 indicated that the different effects of dietary macronutrients on SCD mRNA expression are associated with altered promoter methylation, such that the SCD mRNA expression in the liver being affected by both hormones (leptin and ghrelin) and dietary macronutrients, ie, via epigenetic mechanisms. Our study manifests the data that increased genetic susceptibility to obesity is involved in lipid metabolism among young healthy normal weight subjects with the FTO rs9939609 obesity-risk A allele, since the plasma SCD-16 activity index derived from plasma PL was significantly higher (P<0.05) than in subjects with the FTO rs9939609 wild-type T allele 2 hours after a relatively low-fat breakfast (0.020±0.09 [mean±SD] and 0.014±0.006, respectively) (Figure 1). We assume that our result strengthens the hypothesis that polymorphic expression of the FTO gene in a dietary environment is associated with SCD mRNA expression in the liver and thereby related to the SCD activity index and the development of obesity.
The BA receptor FXR plays a pivotal role in regulating the transcription of several genes important for BAs and glucose and TG metabolism.17,18,26,27 BA-activated FXR has been shown to lead the repression of hepatic lipogenesis by reducing the activation of the SCD enzyme in the liver.17,18 Within the human liver, the acetyl-CoA subunits, originating mostly from dietary carbohydrates, are the precursors of cholesterol from where CDCA and CA are synthesized, and also precursors of the components of TG, saturated fatty acids, and monounsaturated fatty acids. In hypertriglyceridemia mouse models, the expression of genes involved in cholesterol biosynthesis had a tendency to decrease, and the expression of genes encoding enzymes involved in fatty acid and TG biosynthesis in the liver, such as that of SCD1, was significantly reduced in livers of CA-treated animals fed with chow diet (containing 73.5% carbohydrate and 4.8% fat) compared with the livers of non-CA-treated animals on the same diet.17 It is known from several experimental studies that changes in the activity of SCD indices estimated from plasma or tissues are accompanied by simultaneous changes in the transcriptional level of the SCD1.28,29 In our study, subgroups were chosen based on the amount CA produced, ie, including individuals in the highest and lowest quartiles, to investigate any CA-FXR-related differences in the expression of lipogenic genes. In accordance with the findings of Watanabe et al,17 we observed that high post-meal plasma CA concentrations negatively correlate with the level of SCD mRNA expression when adjusted for BMI (Table 3). No such correlation was observed for the expression of SHP mRNA as could have been expected based on the inverse correlation between CA and SCD mRNA. In addition, our study subjects with the FTO AA genotype had nonsignificantly lower post-meal CA concentrations compared with those with the FTO TT genotype (Figure 2), which, in general, have the potential to act against the unbeneficial high SCD indices through a negative correlation with the transcriptional level of the SCD1 as we observed for high CA concentrations (Table 3). This also implies that subjects carrying the FTO AA genotype and showing very low CA concentrations may be at especially higher risk for obesity due to high SCD activity.
BAs are among the endogenous metabolites with the highest variability between subjects, and this large interindividual variation of fasting plasma BA concentrations may be determined by factors such as gender, diet composition, circadian oscillations, and individual capacities for the synthesis and transport of BAs.30 On the other hand, low intraindividual variation is seen in the postprandial state.31 In contrast to other reports, Steiner et al32 observed that the primary BA concentrations in serum increased dramatically during the night and early morning and that there were considerable interindividual variations in the time course of the concentrations. The authors indicated that the reason for the high degree of intraindividual variation in the primary BAs was due to the diurnal changes in the primary BAs independently of food intake. Furthermore, Steiner et al32 reported that it was unlikely that the peak of BA concentrations observed during the night reflects increased BA biosynthesis. Steiner et al32 suggested that the recovered BAs in the bloodstream are of intestinal rather than direct hepatic origin. Consistent with the study of Steiner et al,32 we observed that fasting CDCA and CA concentrations in the subjects with both the FTO TT genotype and the FTO AA genotype were higher (CDCA: 247.0 [15.2–1029.8] and 161.2 [23.4–1848.2] nmol/L, median [range], and CA: 248.3 [59.3–1613.0] and 127.6 [31.6–1118.1] nmol/L, respectively) compared with 2 hours after the low-fat breakfast (CDCA: 121.1 [19.2–365.1] and 66.0 [18.1–575.0] nmol/L and CA: 205.2 [33.9–525.2] and 69.3 [25.9–650.6] nmol/L, respectively) (Figure 2). The lower CDCA and CA concentrations observed in the post-meal plasma of our subjects are consistent with that of normal weight subjects having reduced serum primary BAs concentrations following either hyperinsulinemic–euglycemic clamp or mixed-meal (509 kcal, 28% fat, and 56% carbohydrate).31 An animal study has demonstrated that dietary glucose and insulin are key postprandial regulators that control hepatic BA synthesis.33 Our observation that the BA concentrations are higher following overnight fasting compared with post-meal status may be consistent with the data from rats on a time-restricted feeding schedule showing a significant day/night rhythm in plasma BA concentrations that followed food availability irrespective of dietary macronutrient composition.34 However, the coordinated regulation of postprandial glucose and BA metabolism in regulating lipid and glucose homeostasis in humans is complex and needs further investigation.
The strength of the present study is the inclusion of young healthy subjects, mostly within normal BMI, given the same low-fat breakfast. The median (range) post-meal SCD-16 activity index of the FTO AA genotype group is statistically higher compared with that of the FTO TT genotype group (Figure 1). However, study with a larger size of samples with sufficient statistical power is required to further explore to what extent the detected differences are of biological importance. In addition, the small study sample sizes and the large interindividual variability of BA concentrations may be some of the major limitations that may preclude the relationship between plasma BA concentrations and the gene expressions of SCD mRNA, FXR mRNA, and SHP mRNA 2 hours after the low-fat breakfast. The SCD is highly regulated (induced) by dietary and hormonal factors, such as glucose and insulin, among others.35 A study shows that the plasma insulin levels are significantly increased after 1 hour, when normal-weight subjects are given a high-fat, high-carbohydrate meal after an overnight fast.36 The breakfast of our study subjects, which consisted mainly of complex carbohydrates with a relatively high glycemic index, is digested quickly, which leads to elevated blood insulin levels, and stimulation of the blood glucose transport into liver, and glucose metabolization. According to the study of Patel et al,36 our 2-hour postprandial SCD activity indices and concentrations of the primary BAs CDCA and CA should show their associations with a genetic variant of FTO (rs9939609).
Conclusion
The increased prevalence of obesity is a worldwide health concern. In this study, we have shown that carriers of the FTO AA (obesity risk) allele may be additively at higher risk for obesity, because of the unbeneficial effect of a higher SCD activity index, as demonstrated with data obtained in humans before and after low-fat (ie, high carbohydrate) dietary intake. This risk may be even pronounced for subjects who show very low postprandial CA concentrations. Further study requires to determine the role of dietary macronutrient composition (a low fat vs a high fat) on the SCD activity indices and the primary BA concentrations, whereas understanding the development of obesity and metabolic syndrome is essential for the prevention and treatment of these disorders.
Acknowledgments
The authors thank the volunteers for their contributions to the study. This study was supported by the Swedish Research Council.
Disclosure
The authors report no conflicts of interest in this work.
References
Flegal KM, Kit BK, Orpana H, Graubard BI. Association of all-cause mortality with overweight and obesity using standard body mass index categories: a systematic review and meta-analysis. JAMA. 2013;309(1):71–82. | ||
Kalantari N, Doaei S, Keshavarz-Mohammadi N, Gholamalizadeh M, Pazan N. Review of studies on the fat mass and obesity-associated (FTO) gene interactions with environmental factors affecting on obesity and its impact on lifestyle interventions. ARYA Atheroscler. 2016;12(6):281–290. | ||
Abdelaal M, Le Roux CW, Docherty NG. Morbidity and mortality associated with obesity. Ann Transl Med. 2017;5(7):161–172. | ||
Frayling TM, Timpson NJ, Weedon MN, et al. A common variant in the FTO gene is associated with body mass index and predisposes to childhood and adult obesity. Science. 2007;316(5826):889–894. | ||
Berulava T, Horsthemke B. The obesity-associated SNPs in intron 1 of the FTO gene affect primary transcript levels. Eur J Hum Genet. 2010;18(9):1054–1056. | ||
Church C, Moir L, Mcmurray F, et al. Overexpression of Fto leads to increased food intake and results in obesity. Nat Genet. 2010;42(12):1086–1092. | ||
Sonestedt E, Roos C, Gullberg B, et al. Fat and carbohydrate intake modify the association between genetic variation in the FTO genotype and obesity. Am J Clin Nutr. 2009;90(5):1418–1425. | ||
Miyazaki M, Kim YC, Ntambi JM. A lipogenic diet in mice with a disruption of the stearoyl-CoA desaturase 1 gene reveals a stringent requirement of endogenous monounsaturated fatty acids for triglyceride synthesis. J Lipid Res. 2001;42(7):1018–1024. | ||
Attie AD, Krauss RM, Gray-Keller MP, et al. Relationship between stearoyl-CoA desaturase activity and plasma triglycerides in human and mouse hypertriglyceridemia. J Lipid Res. 2002;43(11):1899–1907. | ||
Sampath H, Ntambi JM. Role of stearoyl-CoA desaturase in human metabolic disease. Future Lipidol. 2008;3(2):163–173. | ||
Flowers MT, Ntambi JM. Stearoyl-CoA desaturase and its relation to high-carbohydrate diets and obesity. Biochim Biophys Acta. 2009;1791(2):85–91. | ||
Bjermo H, Risérus U. Role of hepatic desaturases in obesity-related metabolic disorders. Curr Opin Clin Nutr Metab Care. 2010;13(6):703–708. | ||
Schwenk RW, Jonas W, Ernst SB, et al. Diet-dependent alterations of hepatic Scd1 expression are accompanied by differences in promoter methylation. Horm Metab Res. 2013;45(11):786–794. | ||
Lefebvre P, Cariou B, Lien F, Kuipers F, Staels B. Role of bile acids and bile acid receptors in metabolic regulation. Physiol Rev. 2009;89(1):147–191. | ||
Li T, Chiang JY. Bile acid signaling in metabolic disease and drug therapy. Pharmacol Rev. 2014;66(4):948–983. | ||
Makishima M, Okamoto AY, Repa JJ, et al. Identification of a nuclear receptor for bile acids. Science. 1999;284(5418):1362–1365. | ||
Watanabe M, Houten SM, Wang L, et al. Bile acids lower triglyceride levels via a pathway involving FXR, SHP, and SREBP-1c. J Clin Invest. 2004;113(10):1408–1418. | ||
Zhang Y, Lee FY, Barrera G, et al. Activation of the nuclear receptor FXR improves hyperglycemia and hyperlipidemia in diabetic mice. Proc Natl Acad Sci U S A. 2006;103(4):1006–1011. | ||
Rask-Andersen M, Bringeland N, Nilsson EK, et al. Postprandial alterations in whole-blood DNA methylation are mediated by changes in white blood cell composition. Am J Clin Nutr. 2016;104(2):518–525. | ||
Folch J, Lees M, Sloane Stanley GH. A simple method for the isolation and purification of total lipides from animal tissues. J Biol Chem. 1957;226(1):497–509. | ||
Livingstone KM, Celis-Morales C, Lara J, et al. Associations between FTO genotype and total energy and macronutrient intake in adults: a systematic review and meta-analysis. Obes Rev. 2015;16(8):666–678. | ||
Flowers MT, Ntambi JM. Role of stearoyl-coenzyme A desaturase in regulating lipid metabolism. Curr Opin Lipidol. 2008;19(3):248–256. | ||
Mauvoisin D, Mounier C. Hormonal and nutritional regulation of SCD1 gene expression. Biochimie. 2011;93(1):78–86. | ||
Chong MF, Hodson L, Bickerton AS, et al. Parallel activation of de novo lipogenesis and stearoyl-CoA desaturase activity after 3 d of high-carbohydrate feeding. Am J Clin Nutr. 2008;87(4):817–823. | ||
Sampath H, Ntambi JM. The role of stearoyl-CoA desaturase in obesity, insulin resistance, and inflammation. Ann N Y Acad Sci. 2011;1243:47–53. | ||
Sinal CJ, Tohkin M, Miyata M, et al. Targeted disruption of the nuclear receptor FXR/BAR impairs bile acid and lipid homeostasis. Cell. 2000;102(6):731–744. | ||
Li T, Chiang JY. Bile acids as metabolic regulators. Curr Opin Gastroenterol. 2015;31(2):159–165. | ||
Sampath H, Ntambi JM. Stearoyl-coenzyme A desaturase 1, sterol regulatory element binding protein-1c and peroxisome proliferator-activated receptor-alpha: independent and interactive roles in the regulation of lipid metabolism. Curr Opin Clin Nutr Metab Care. 2006;9(2):84–88. | ||
Sjögren P, Sierra-Johnson J, Gertow K, et al. Fatty acid desaturases in human adipose tissue: relationships between gene expression, desaturation indexes and insulin resistance. Diabetologia. 2008;51(2):328–335. | ||
Fiamoncini J, Curi R, Daniel H. Metabolism of bile acids in the post-prandial state. Essays Biochem. 2016;60(5):409–418. | ||
Haeusler RA, Camastra S, Nannipieri M, et al. Increased bile acid synthesis and impaired bile acid transport in human obesity. J Clin Endocrinol Metab. 2016;101(5):1935–1944. | ||
Steiner C, Othman A, Saely CH, et al. Bile acid metabolites in serum: intraindividual variation and associations with coronary heart disease, metabolic syndrome and diabetes mellitus. PLoS One. 2011;6(11):e25006. | ||
Li T, Francl JM, Boehme S, et al. Glucose and insulin induction of bile acid synthesis: mechanisms and implication in diabetes and obesity. J Biol Chem. 2012;287(3):1861–1873. | ||
Eggink HM, Oosterman JE, de Goede P, et al. Complex interaction between circadian rhythm and diet on bile acid homeostasis in male rats. Chronobiol Int. 2017;34(10):1339–1353. | ||
Ntambi JM, Miyazaki M, Dobrzyn A. Regulation of stearoyl-CoA desaturase expression. Lipids. 2004;39(11):1061–1065. | ||
Patel C, Ghanim H, Ravishankar S, et al. Prolonged reactive oxygen species generation and nuclear factor-kappaB activation after a high-fat, high-carbohydrate meal in the obese. J Clin Endocrinol Metab. 2007;92(11):4476–4479. |
 © 2018 The Author(s). This work is published and licensed by Dove Medical Press Limited. The full terms of this license are available at https://www.dovepress.com/terms.php and incorporate the Creative Commons Attribution - Non Commercial (unported, v3.0) License.
By accessing the work you hereby accept the Terms. Non-commercial uses of the work are permitted without any further permission from Dove Medical Press Limited, provided the work is properly attributed. For permission for commercial use of this work, please see paragraphs 4.2 and 5 of our Terms.
© 2018 The Author(s). This work is published and licensed by Dove Medical Press Limited. The full terms of this license are available at https://www.dovepress.com/terms.php and incorporate the Creative Commons Attribution - Non Commercial (unported, v3.0) License.
By accessing the work you hereby accept the Terms. Non-commercial uses of the work are permitted without any further permission from Dove Medical Press Limited, provided the work is properly attributed. For permission for commercial use of this work, please see paragraphs 4.2 and 5 of our Terms.