")
Back to Journals » Diabetes, Metabolic Syndrome and Obesity » Volume 14
Plasma Nesfatin-1: Potential Predictor and Diagnostic Biomarker for Cognitive Dysfunction in T2DM Patient
Authors Xu D, Yu Y, Xu Y, Ge J
Received 2 June 2021
Accepted for publication 30 July 2021
Published 10 August 2021 Volume 2021:14 Pages 3555—3566
DOI https://doi.org/10.2147/DMSO.S323009
Checked for plagiarism Yes
Review by Single anonymous peer review
Peer reviewer comments 4
Editor who approved publication: Professor Ming-Hui Zou
Dandan Xu,1– 3,* Yue Yu,1,4,* Yayun Xu,5,* Jinfang Ge1– 3
1School of Pharmacy, Anhui Medical University, Hefei, People’s Republic of China; 2Anhui Province Key Laboratory of Major Autoimmune Diseases, Anhui Institute of Innovative Drugs, Hefei, People’s Republic of China; 3The Key Laboratory of Anti-inflammatory and Immune Medicine, Ministry of Education, Anhui Medical University, Hefei, People’s Republic of China; 4Department of Pharmacy, The Fourth Affiliated Hospital of Anhui Medical University, Hefei, People’s Republic of China; 5Department of Epidemiology and Biostatistics, School of Public Health, Anhui Medical University, Hefei, People’s Republic of China
*These authors contributed equally to this work
Correspondence: Jinfang Ge
School of Pharmacy, Anhui Medical University, 81 Mei-Shan Road, Hefei, Anhui, 230032, People’s Republic of China
Tel +86 551 65172131
Fax +86 551 65161115
Email [email protected]
Purpose: Nesfatin-1 plays a crucial role in glucose metabolism and cognitive function. This study aimed to investigate the correlation between plasma nesfatin-1 levels and clinical indicators and cognitive function in patients with type 2 diabetes mellitus (T2DM).
Methods: Demographic and medical history data, physical examination, and biochemical test results of 132 T2DM patients were collected. The plasma concentrations of nesfatin-1, C-reactive protein (CRP), interleukin-6 (IL-6), soluble triggering receptors expressed on myeloid cells 1 (sTREM1), and sTREM2 in T2DM patients were measured. Cognitive function was evaluated using the Behavior Rating Inventory of Executive Function-Adult (BRIEF-A). The patients were divided into two groups: a low-nesfatin-1 group (n = 75) and a high-nesfatin-1 group (n = 57) based on a plasma nesfatin-1 concentration less than or above the 50th percentile value of all the samples.
Results: The results showed that plasma HbA1c levels were positively correlated with CRP, IL-6, sTREM1, and sTREM2 levels in patients with T2DM (P < 0.05). Plasma nesfatin-1 concentrations were positively associated with diabetes-related biochemical indicators including glycated haemoglobin (HbA1c), insulin, and homeostatic model assessment of insulin resistance (HOMA-IR), and inflammation-related indicators including CRP, IL-6, sTREM1, and sTREM2 among patients with T2DM (P < 0.05). Moreover, T2DM patients with high nesfatin-1 levels showed higher HbA1c and fasting plasma glucose (FPG) levels (P < 0.05). Furthermore, T2DM patients with high nesfatin-1 levels also showed higher BRIEF-A scores (P = 0.01). Additionally, T2DM patients with high total scores of BRIEF-A (scores > 50th percentile) could be identified with a sensitivity of 59.1% and a specificity of 72.7% by nesfatin-1.
Conclusion: These findings indicate that plasma nesfatin-1 might be involved in the T2DM-associated comorbidities and the development of cognitive dysfunction, and the mechanism underlying this involvement is related to the imbalance in the expression of CRP, IL-6, sTREM1, and sTREM2 levels.
Keywords: type 2 diabetes mellitus, cognitive dysfunction, nesfatin-1, inflammatoryresponse, sTREM1/2
Introduction
Epidemiological data shows that the estimated global direct health expenditure on diabetes was USD 760 billion in 2019 and is projected to increase toUSD 825 billion by 2030 and USD 845 billion by 2045.1 Cognitive dysfunction is increasingly considered a significant comorbidity and complication of diabetes, affecting personal health and diabetes management.2 It has been reported that the prevalence of cognitive dysfunction, including dementia and cognitive impairment, among people with diabetes was 13.1% for individuals aged 65 to 74 years and 24.2% for those aged 75 years and older.3 Moreover, recent guidelines strongly recommend screening for cognitive dysfunction in elderly patients with type 2 diabetes mellitus (T2DM).4 Several possible mechanisms contributing to cognitive decline, including vascular damage, negative consequences of hypo- and hyperglycemia, and various dysfunctions in insulin action, summarized as insulin resistance, have been proposed.5 However, the exact mechanism that linksT2DM and cognitive dysfunction, as well as predictors of T2DM-associated cognitive dysfunction remain unclear.
Nesfatin-1 is an energy-regulating peptide that is widely expressed in the central and peripheral tissues. Apart from its crucial role in regulating glucose homeostasis,6 lipid metabolism,7 gastrointestinal,8 and cardiovascular function,9 nesfatin-1 is reported to be associated with neuropsychiatric diseases, including epilepsy,10 stress,11 sleep disorders,12 anxiety,13 and depression.14 In line with these findings, the results of our previous studies showed that increased nesfatin-1 concentration in stressed or high-fat diet-fed rats,15,16 and intraperitoneal injection of nesfatin-1 induces depression-like behavior together with the BDNF-associated alteration of synaptic plasticity.17 Thus, suggesting that nesfatin-1 may play a role in linking glucolipid dysfunction and neuropsychiatric injuries.
Recent studies have found aberrant expressions of nesfatin-1 in the blood of patients with diabetes-related diseases. Although it has been reported that the plasma nesfatin-1 level was significantly decreased in patients with T2DM compared with healthy controls,18 increasing evidence has indicated a higher level of blood nesfatin-1 in T2DM patients and a close relationship between nesfatin-1 concentration and clinical parameters known to be associated with insulin resistance.19–21 These findings suggest a potential role of nesfatin-1 in T2DM.
Inflammation is a common symptom or complication in both T2DM and neuropsychiatric diseases, including cognitive dysfunction.22,23 A number of studies have shown a relationship between inflammation markers and increased risks for dementia, mild cognitive impairment, and cognitive decline.24,25 It has been reported that serum IL-6 concentrations were significantly high in patients with mild cognitive impairment, indicating that inflammatory factors may be involved in the early stages of Alzheimer’s disease (AD).26 Recently, epidemiological studies have demonstrated that CRP and IL-6 are major risk factors for mild cognitive impairment in patients with T2DM, suggesting an association between inflammatory markers and the risk of mild cognitive impairment in T2DM patients.27,28 In our previous study, rats injected with nesfatin-1 presented not only anxiety and depression-like behavior, but also increased plasma concentrations of CRP and IL-6, with a significant correlation.17 Consistently, results of clinical studies also demonstrated a positive correlation between plasma nesfatin-1 and IL-6 or CRP concentrations in patients with depression.29 Therefore, it is assumed that the underlying mechanism of nesfatin-1 in the neuropsychiatric injury of T2DM might be involved in regulating the inflammatory response.
As members of the triggering receptors expressed on myeloid cells (TREM) family, TREM1 and TREM2 participate in the regulation of inflammation and immune response by modulating the secretion of inflammatory cytokines such as TNF-α, IL-1β, and IL-6.30 Recent studies have indicated that the missense mutation and expression changes of TREM1 and TREM2 are closely related to cognitive dysfunction in patients with AD.31,32 Clinical studies have shown that the level of TREM2 in the peripheral blood of patients with AD increased significantly.33 Animal experiments have found that knockdown of TREM2 expression in the brains of SAMP8 mice, a rapidly aging animal model, can cause neuronal and synaptic losses and cognitive impairment, accompanied by increased secretion of inflammatory factors such as TNF-α and IL-6.34 Our recent study has shown that abnormal expression of TREM1 and TREM2 in the hippocampus and prefrontal cortex may be involved in lipopolysaccharide (LPS)-induced depression-like behaviors and impaired learning and memory in rats.35 Collectively, these findings suggest that TREM1 and TREM2 are involved in the regulation of cognitive impairment, which may be related to inflammation. Considering that nesfatin-1 exhibits anti-inflammatory properties,36 the plasma concentrations of TREM1 and TREM2 and its correlation between plasma nesfatin-1 were investigated in patients with T2DM in the present study.
Materials and Methods
Study Subjects
A total of 132 patients diagnosed with T2DM were recruited consecutively from the Department of Endocrinology, the Fourth Affiliated Hospital of Anhui Medical University, from April 2017 to April 2018. All diabetic subjects met Guidelines for the Prevention and Treatment of Type 2 Diabetes in China (2017 edition) based on the World Health Organization diagnostic criteria in 1999 with a fasting plasma glucose ≥7.0 mmol/l or a 2-h plasma glucose ≥11.1 mmol/l, determined by oral glucose tolerance cation barriers. The inclusion criteria were as follows: 1) patients diagnosed with T2DM based on the World Health Organization diagnostic criteria in 1999; 2) adult patients older than 18 years;3) currently not receiving any medication (blood was collected when the patient was admitted to the hospital for treatment); and 4) no language communication barriers and could actively cooperate with the completion of the evaluation. The exclusion criteria were as follows: 1) suffering from acute diabetic complications, such as diabetic ketoacidosis and severe hypoglycemia coma; 2) suffering from acute cardiovascular and cerebrovascular events, epilepsy, head injury, moderate depression, or other psychiatric illnesses; 3) severe systemic disease (ie, thyroid disease, serious infection, and anemia); and 4) diagnosed with alcohol or other substance-dependent diseases. The study protocol was approved by the ethical committee of Anhui Medical University (No. 20170245). All subjects provided written informed consent in accordance with the Declaration of Helsinki.
Measurements
The height and weight of all subjects were measured, and body mass index (BMI) was calculated accordingly. To avoid the influence of daily energy intake on the plasma levels of nesfatin-1, all patients received the same food provided by the cafeteria of the Fourth Affiliated Hospital of Anhui Medical University. To avoid the influence of fasting time, blood samples were collected between 8:00 a.m. and 9:00 a.m. from the participants’ veins after a fasting period of 10 to 11 h. The blood samples were centrifuged at 2500 rpm for 20 min at 4°C, and the plasma was collected and stored at-80°C until detection. The concentrations of nesfatin-1, CRP, IL-6, sTREM1, sTREM2, and insulin were measured using commercially available enzyme-linked immunosorbent assay (ELISA) kits according to manufacturer’s instructions (nesfatin-1, CRP, and IL-6: Huamei Bio, Wuhan, China; and sTREM1, sTREM2, and insulin: Meilian Bio, Shanghai, China). Plasma concentrations of total cholesterol (TC), triglyceride (TG), high-density lipoprotein (HDL), low-density lipoprotein cholesterol (LDL), alanine aminotransferase (ALT), aspartate transaminase (AST), total bilirubin (TBIL), direct bilirubin (DBIL), indirect bilirubin (IBIL), serum creatinine (SCR), blood urea nitrogen (BUN), fasting plasma glucose (FPG), postprandial glucose (PPG); blood samples taken to measure PPG 2 h after breakfast, and glycated hemoglobin (HbA1c), were measured by the Department of Clinical Laboratory of the Fourth Affiliated Hospital of Anhui Medical University.
Self-Reported Executive Functions with Behavior Rating Inventory of Executive Function-Adult (BRIEF-A)
BRIEF-A was used to evaluate cognitive function in T2DM patients. BRIEF-A includes two composite scores, including sets of subscales. Specifically, the inhibit, shift, self-monitor, and emotional control subscales were used to calculate the behavioral regulation index (BRI). The initiate, plan/organize, working memory, organization of materials, and task monitor subscales were used to calculate the metacognition index.
Statistical Analysis
Data were entered into EpiData version 3.1, and analyzed using SPSS version 17.0 statistical software. A one-sample Kolmogorov–Smirnov test showed a normal distribution of continuous variables. The statistical results of the continuous variables are presented as means ± standard deviation (SD) for normal distribution and medians (first quartile to third quartile) for abnormal distribution. For variables with abnormal distribution, non-parametric tests were applied (Mann–Whitney U-test), and parametric tests were used for normal distribution (Student’s t-test). The chi-square test was used for dichotomous variables. Power calculations were performed using G* Power 3.1 software. Correlation analysis was performed using Pearson’s test or partial correlational analysis. Receiver operating characteristic (ROC) curve analysis was used to determine the area under the curve (AUC) and cut-off values of nesfatin-1 in the identification of T2DM patients with high total scores of BRIEF-A (scores > 50th percentile) from T2DM patients with low total scores of BRIEF-A (scores ≤ 50th percentile). Statistical significance was set at P<0.05.
Results
Comparison of Scales of BRIEF-A Between the HbA1c ≤ 7% Group and the HbA1c > 7% Group
According to the recommendation that a target HbA1c goal of < 7% for patients with diabetes should not be higher than 7% to avoid diabetes-related complications, the patients were divided into two groups according to HbA1c < 7% (HbA1c ≤ 7%) or above (HbA1c > 7%). There were 32 patients in the HbA1c ≤ 7% group and 100 patients in the HbA1c > 7% group. Table 1 shows that the total scales and all the terms of BRIEF-A were significantly higher in the HbA1c > 7% group than in the HbA1c ≤ 7% group (P < 0.05).
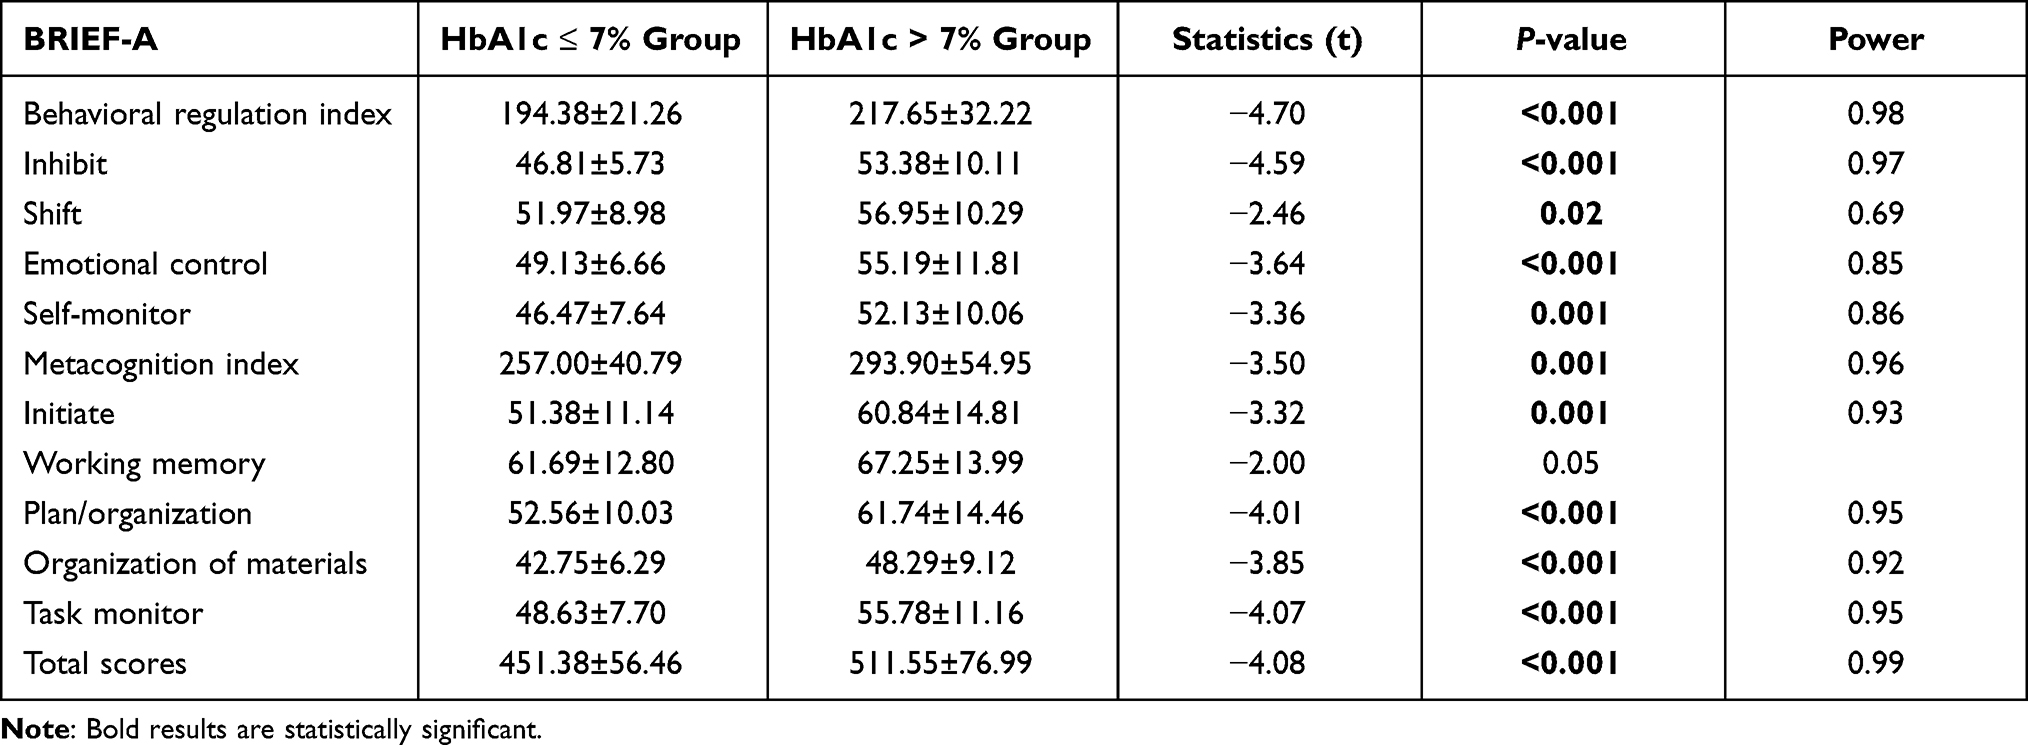 |
Table 1 Comparison of Scales of BRIEF-A Between the HbA1c≤7% Group and the HbA1c>7% Group |
Post hoc power analyses using G*power 3.1, demonstrated that sufficient power was available to distinguish the above significant differences (BRI: power = 0.98; inhibit: power = 0.97; shift: power = 0.69; emotional control: power = 0.85; self-monitor: power = 0.86; metacognition index: power = 0.96; initiate: power = 0.93; plan/organize: power = 0.95; organization of materials: power = 0.92; task monitor: power = 0.95; and total scores: power = 0.99).
As presented in Figures 1 and 2A–D, the results of correlation analysis showed that the plasma HbA1c concentration was positively correlated with CRP (r = 0.237, P = 0.006), IL-6 (r = 0.216, P = 0.013), sTREM1 (r = 0.211, P = 0.015), and sTREM2 (r = 0.189, P = 0.030) levels in patients with T2DM. Additionally, the plasma HbA1c concentration was positively correlated with the total scores of BRIEF-A (r = 0.269, P = 0.002), BRI (r = 0.201, P = 0.021), and metacognition index (r = 0.265, P =0.002) (Figures 1 and 2E–G).
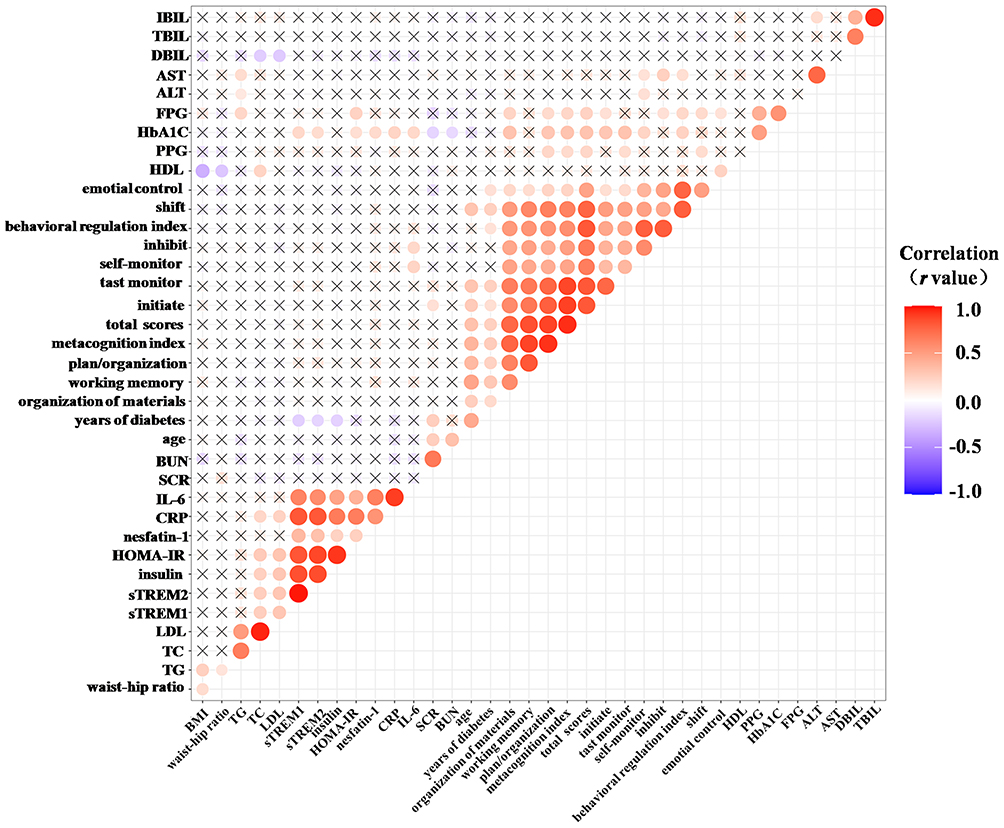 |
Figure 1 Correlation between plasma HbA1c or nesfatin-1 levels and biochemical indicators, inflammatory cytokines, or BRIEF-A in patients with T2DM. Abbreviations: ALT, alanine aminotransferase; AST, aspartate transaminase; BMI, body mass index; BUN, blood urea nitrogen; CRP, C-reactive protein; DBIL, direct bilirubin; FPG, fasting plasma glucose; HbA1c, glycated haemoglobin; HDL, high-density lipoprotein; HOMA-IR, homeostatic model assessment of insulin resistance; IBIL, indirect bilirubin; IL-6, interlin-6; LDL, low-density lipoprotein cholesterol; PPG, postprandial glucose; SCR, serum creatinine; sTREM1, soluble triggering receptors expressed on myeloid cells 1; TBIL, total bilirubin; TC, total bilirubin; TG, triglyceride. Note: The size of the circle represents the size of the P value; the symbol X represents no statistical significance. |
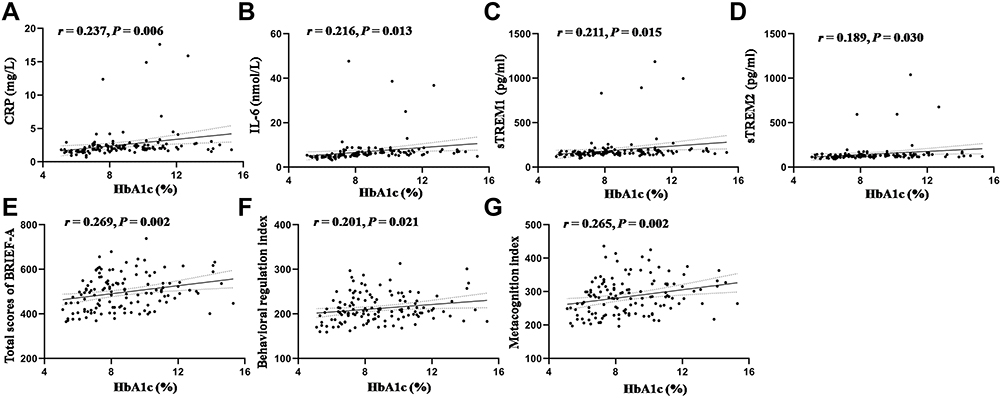 |
Figure 2 Positive relationship between plasma HbA1c and CRP, IL-6, sTREM1, sTREM2, or BRIEF-A in patients with T2DM. Notes: (A) Correlation between plasma HbA1c and CRP levels; (B) Correlation between plasma HbA1c and IL-6 levels; (C) Correlation between plasma HbA1c and sTREM1 levels; (D) Correlation between plasma HbA1c and sTREM2 levels; (E) Correlation between plasma HbA1c and total scores of BRIEF-A; (F) Correlation between plasma HbA1c and the scores of behavioral regulation index; (G) Correlation between plasma HbA1c and the scores of metacognition index. |
Relationship Between Plasma Nesfatin-1 Levels and Biochemical Indicators, Inflammatory Cytokines, or BRIEF-A in Patients with T2DM
As shown in Figures 1 and 3, the results of the correlation analysis showed that plasma nesfatin-1 concentration was positively correlated with HbA1c (r = 0.184, P = 0.035), insulin (r = 0.234, P = 0.007), homeostatic model assessment of insulin resistance (HOMA-IR) (r = 0.244, P = 0.005), CRP (r = 0.535, P < 0.001), IL-6 (r = 0.627, P < 0.001), sTREM1 (r = 0.352, P < 0.001), and sTREM2 (r = 0.316, P < 0.001) in patients with T2DM.
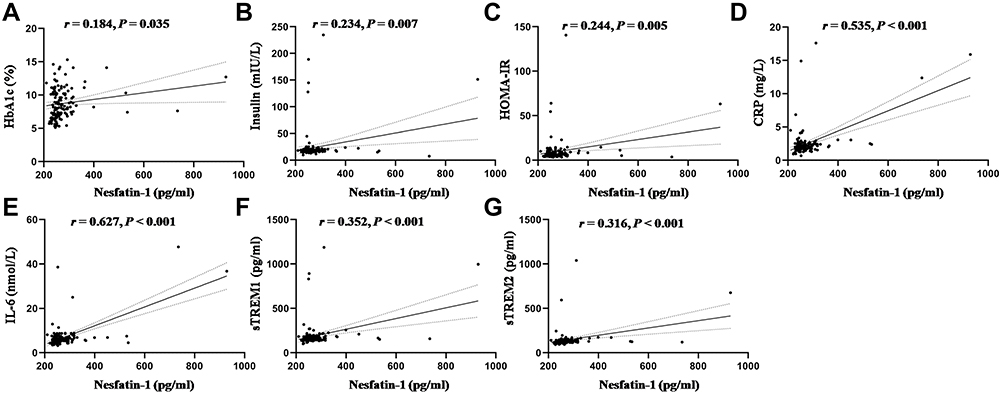 |
Figure 3 Positive relationship between plasma nesfatin-1 and HbA1c, insulin, HOMA-IR, CRP, IL-6, sTREM1, or sTREM2 in patients with T2DM. Notes: (A) Correlation between plasma nesfatin-1 and HbA1c levels; (B) Correlation between plasma nesfatin-1 and insulin levels; (C) Correlation between plasma nesfatin-1 and HOMA-IR levels; (D) Correlation between plasma nesfatin-1 and CRP levels; (E) Correlation between plasma nesfatin-1 and IL-6 levels; (F) Correlation between plasma nesfatin-1 and sTREM1 levels; (G) Correlation between plasma nesfatin-1 and sTREM2 levels. |
As shown in Figure 1, no correlation was observed between nesfatin-1 levels and cognitive function (P > 0.05). Because age and nutrition are factors influencing cognitive function, a partial correlational analysis was used to explore the relationship between nesfatin-1 levels and cognitive function after controlling for age and BMI as covariates. The correlation between nesfatin-1 level and cognitive function was still not statistically significant (P > 0.05).
Comparison of Demographic Values and Biochemical Indicators of the Low-Nesfatin-1 Group and the High-Nesfatin-1 Group
The patients were divided into two groups: a low-nesfatin-1 group, and a high-nesfatin-1 group based on the plasma nesfatin-1 concentration less than or above the 50th percentile value of all the samples. There were 75 and 57 patients in the low-nesfatin-1 group and in the high-nesfatin-1 group, respectively. As shown in Table 2, there were no significant differences in age, BMI, waist-hip ratio, year of diagnosis of diabetes, sex, or smoking between the two groups. In terms of the biochemical indicators, there were no significant differences in TC, TG, HDL, LDL, ALT, AST, TBIL, DBIL, IBIL, PPG, SCR, BUN, insulin, or HOMA-IR between the two groups. The mean HbA1c (t= −2.07, P = 0.04) and FPG (t= −2.43, P = 0.02) levels were significantly higher in the high-nesfatin-1 group than in the low-nesfatin-1 group (Table 2). In terms of inflammation-related indicators, there were no significant differences in CRP, IL-6, sTREM1, or sTREM2 between the two groups (P > 0.05).
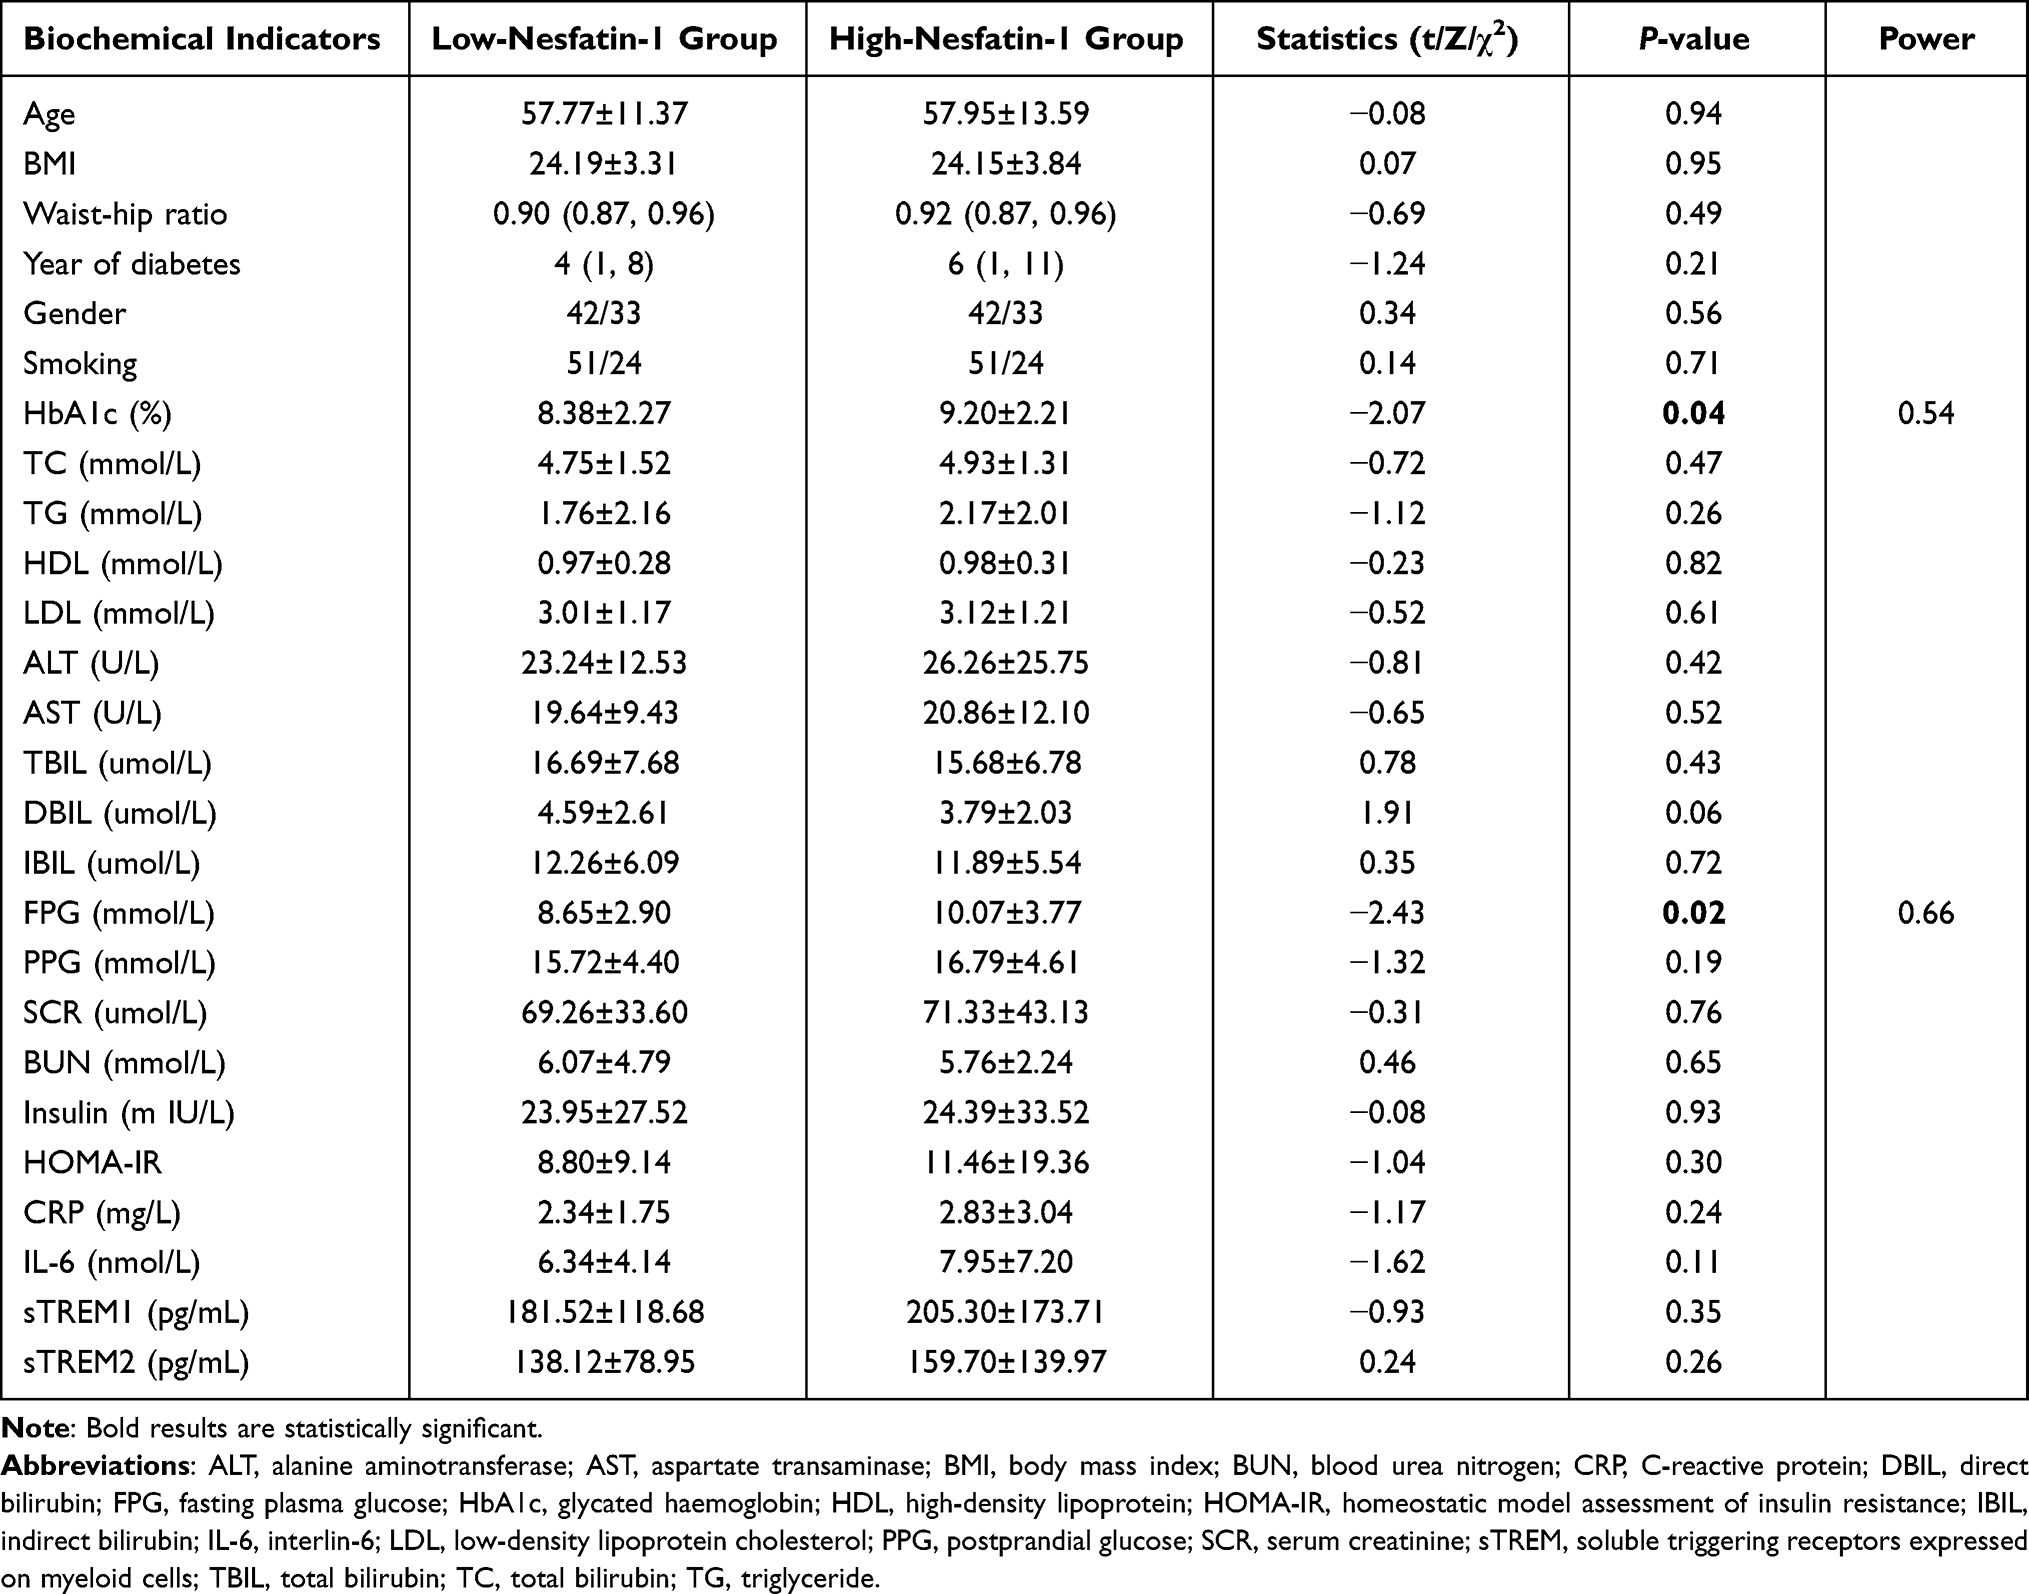 |
Table 2 Comparison of Demographic Values and Biochemical Indicators Between the Low-Nesfatin-1 Group and the High-Nesfatin-1 Group |
Receiver Operating Characteristic (ROC) Curve of Plasma Nesfatin-1 in Identification of T2DM Patients with High Total Scores of BRIEF-A (Scores > 50th Percentile) from T2DM Patients with Low Total Scores of BRIEF-A (Scores ≤ 50th Percentile)
Figure 4 shows the results of ROC curve analysis, indicating the potential diagnostic value of plasma nesfatin-1 in discriminating T2DM patients with high total scores of BRIEF-A (scores > 50th percentile) from T2DM patients with low total scores of BRIEF-A (scores ≤ 50th percentile). The area under the ROC curve (AUC) for nesfatin-1 was 0.663 (95% confidence interval, 0.571–0.756). Furthermore, at a cut-off nesfatin-1 value of 260.81pg/mL, the sensitivity and specificity for discriminating T2DM patients with high total scores of BRIEF-A (scores > 50th percentile) from T2DM patients with low total scores of BRIEF-A (scores ≤ 50th percentile) were 59.1% and 72.7%, respectively.
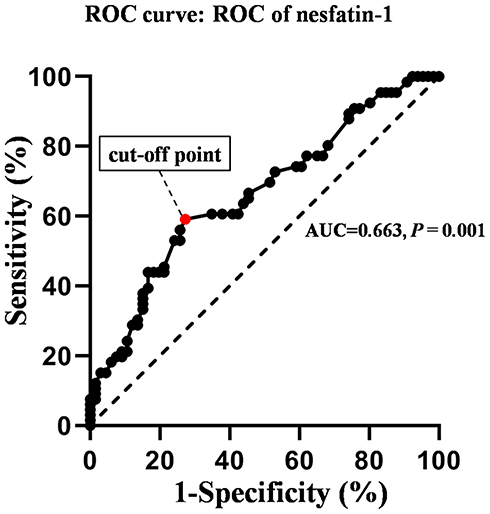 |
Figure 4 Receiver operating characteristic curve analysis of plasma nesfatin-1 in discriminating T2DM patients with high total scores of BRIEF-A (scores > 50th percentile) from T2DM patients with low total scores of BRIEF-A (scores ≤ 50th percentile). Notes: Plasma nesfatin-1 cut-off point of 260.81 pg/mL showed 59.1% sensitivity and 72.7% specificity, and with the AUC of 0.663 (95% CI 0.571–0.756) was the optimal cut-off point for identification of T2DM patients with high total scores of BRIEF-A (scores > 50th percentile) from T2DM patients with low total scores of BRIEF-A (scores ≤ 50th percentile). AUC, area under the curve. |
Comparison of Scales of BRIEF-A of the Low-Nesfatin-1 Group and the High-Nesfatin-1 Group
Table 3 shows that the total scales of BRIEF-A were significantly higher in the high-nesfatin-1 group than that of the low-nesfatin-1 group (t= −2.53, P = 0.01), with a power value of 0.71. In terms of the items, the BRI (including inhibit, shift, and self-monitor), and metacognition index (including initiate and plan/organization) were higher in the high-nesfatin-1 group (P < 0.05).
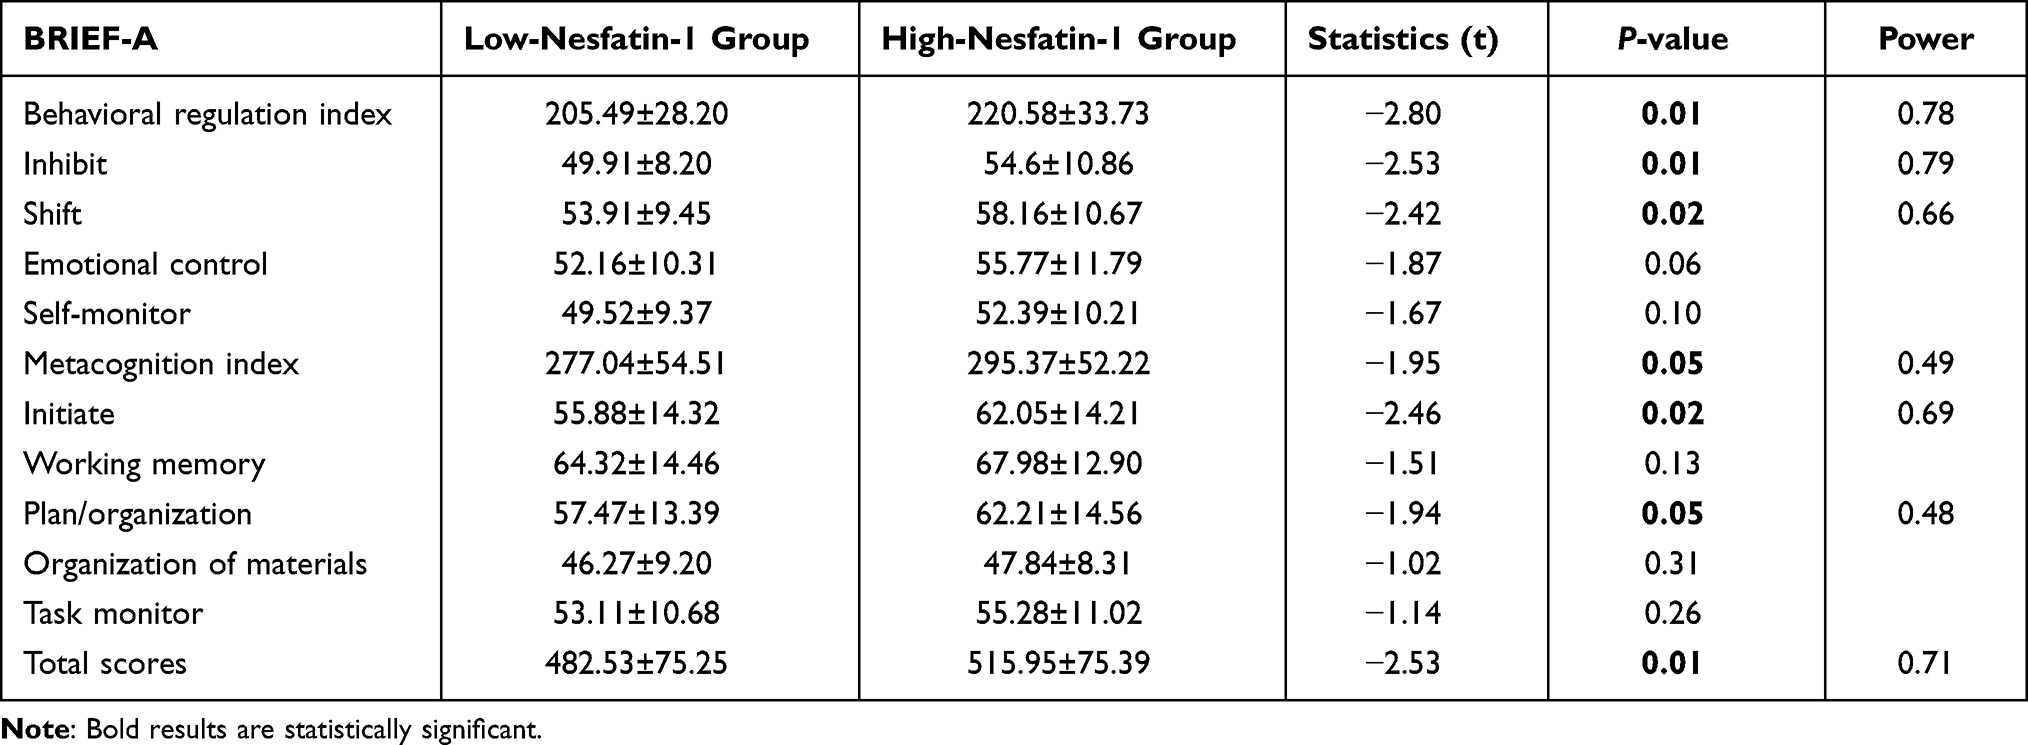 |
Table 3 Comparison of Scales of BRIEF-A of the Low-Nesfatin-1 Group and the High-Nesfatin-1 Group |
Discussion
In the present study, we demonstrated that the plasma HbA1c concentration was positively correlated with the CRP, IL-6, sTREM1, and sTREM2 levels in patients with T2DM, and that plasma nesfatin-1 concentrations were positively associated with diabetes-related biochemical indicators (including HbA1c, insulin, and HOMA-IR), and inflammation-related indicators (including CRP, IL-6, sTREM1, and sTREM2) among patients with T2DM. Moreover, T2DM patients with high nesfatin-1 levels showed higher HbA1c and FPG levels. Furthermore, T2DM patients with high nesfatin-1 levels also showed higher BRIEF-A scores. Additionally, T2DM patients with high scales of BRIEF-A (scores > 50th percentile) could be identified by plasma nesfatin-1. Therefore, plasma nesfatin-1 level may be considered as a biomarker to identify T2DM patients with cognitive dysfunction.
HbA1c is a convenient and stable indicator of long-term blood glucose concentrations, reflecting blood glucose levels over the last 2 to 3 months.37 Both the American Diabetes Association and World Health Organization (WHO) recommended that HbA1c should be included as a diagnostic test for diabetes in addition to oral glucose tolerance test or fasting blood glucose.38,39 Current treatment guidelines recommend an HbA1c level of < 7.0% as the goal for most people with T2DM.40,41 Moreover, accumulating evidence has indicated that HbA1c levels are closely related to the occurrence and development of diabetic complications, and HbA1c levels should not be higher than 7% to avoid these complications.42 Therefore, in the present study, 7% was used as the cut-off point for HbA1c in patients.
Previous evidence suggest that HbA1c levels are closely related to the occurrence and development of diabetic complications, and HbA1c levels should not be higher than 7% to avoid these complications.42 Consistently, in the present study, the total scales and all the terms of BRIEF-A were significantly higher in the HbA1c > 7% group than in the HbA1c ≤ 7% group. Furthermore, apart from the positive correlation between plasma HbA1c levels and inflammation-related indicators, our results showed that the plasma HbA1c level was also positively correlated with the total scores of BRIEF-A, the BRI, and metacognition index. Similarly, a positive significant correlation between HbA1c level and CRP and IL-6 has been demonstrated in several diabetes-related diseases.43–45 Moreover, HbA1c ≥ 8% has been reported to be an independent factor of cognitive decline and is associated with the severity of cognitive decline in elderly patients with T2DM.46 Collectively, the results of the present study reiterates the important role of plasma HbA1c level in diagnosing diabetes and predicting its severity.
Widely distributed in both the central and peripheral tissues, nesfatin-1 is reported to be involved in food intake, glucolipid metabolism, and the regulation of emotion and cognition. The results of our previous study showed that nesfatin-1 is a very important factor linking the dysfunction of glucolipid metabolism and impairment of learning and memory in nonalcoholic fatty liver disease (NAFLD) in rats.47 More recently, a significant correlation between HbA1c and serum nesfatin-1 levels was found in patients diagnosed with metabolic syndrome.48 Similar to these findings, plasma nesfatin-1 concentrations were positively associated with HbA1c in patients with T2DM in the present study. Considering its close relationship with insulin and HOMA-IR, nesfatin-1 may be a potential precursor in the diagnosis and treatment of T2DM.
BRIEF-A has been proven to be a tool for identifying executive function deficits in many clinical populations, including mild cognitive impairment,49 attention deficit hyperactivity disorder,50 and multiple sclerosis.51 Therefore, cognitive function deficits in T2DM patients were evaluated in the present study. The results showed that the total scores of BRIEF-A were significantly higher in T2DM patients with high nesfatin-1 levels than in T2DM patients with low nesfatin-1 levels. In terms of the subscales, the BRI (including inhibit, shift, and self-monitor) and metacognition index (including initiate and plan/organize) was also increased in the high-nesfatin-1 group. Moreover, T2DM patients with high scales of BRIEF-A (scores > 50th percentile) could be identified by plasma nesfatin-1. These findings suggest that there may be a potential link between plasma nesfatin-1 levels and cognitive decline in T2DM patients.
Inflammation and related diabetic dyslipidemia, oxidative stress, and magnesium deficiency are involved in the pathogenesis of T2DM and cognitive decline.52–54 It has been reported that the serum levels of IL-6 and CRP in T2DM patients were significantly higher than those in control participants.55 Higher IL-6 concentration was associated with an increased rate of cognitive decline in both executive and memory functions.56 In T2DM patients, cognitive impairment demonstrated association with IL-6,57 CRP,58 and IL-1β.59 Nesfatin-1 has recently been reported to have potent anti-inflammatory effects in several diseases.36 However, the relationship between nesfatin-1 and inflammatory factors in T2DM has not yet been explored. The results of the present study first confirmed that nesfatin-1 levels were positively correlated with IL-6 and CRP levels in patients with T2DM, further suggesting that abnormal inflammation may be one of the possible mechanisms by which nesfatin-1 participates in cognitive impairment in patients with T2DM.
As immunoglobulin superfamily receptors, TREM-1 and TREM-2 are responsible for the activation of the innate immune response and play a vital role in inflammation.60,61 Recently, TREM-1 and TREM-2 have been shown to participate in cognitive regulation. It has been reported that peripheral TREM-1 and TREM-2 mRNA levels were significantly higher in AD patients than in controls, indicating that TREM-1 and TREM-2 may be useful as early peripheral biomarkers for the development of AD.62,63 In the present study, the results of the Pearson’s correlation analysis showed a positive relationship between nesfatin-1, sTREM-1 and sTREM-2. Combined with the role of sTREM-1 and sTREM-2 in inflammation and cognitive regulation, it is reasonable to assume that nesfatin-1 may be involved in the comorbidity of T2DM and cognitive impairment through the regulation of peripheral sTREM-1 and sTREM-2 levels.
Several lines of evidence have indicated a close connection between nesfatin-1 and cognitive dysfunction. First, nesfatin-1 is widely expressed in the learning and memory-related brain regions, including the hippocampus and prefrontal cortex.64 Second, nesfatin-1 can cross the blood-brain barrier.65,66 The results of our previous study have demonstrated that consecutive IPinjections of nesfatin-1 for 3 weeks could induce a lower preference index of the novel arm in the Y-maze, accompanied by decreased BDNF protein expression in the hippocampus and prefrontal cortex.67 Third, the results of Pearson’s correlation analysis showed that the plasma nesfatin-1 concentration was negatively correlated with swimming distance in the target quadrant in the Morris water maze task, indicating the important role of nesfatin-1 in the pathogenesis of NAFLD-induced impairment of learning and memory in rats.16
Due to the cross-sectional study design, no causality between nesfatin-1 and cognitive dysfunction could be determined. Given that T2DM patients with high nesfatin-1 levels showed higher HbA1c levels and higher scales of BRIEF-A, we hypothesized that plasma nesfatin-1 might be involved in the comorbidity of T2DM and cognitive dysfunction. Moreover, considering that the plasma nesfatin-1 concentrations were positively associated with diabetes-related biochemical indicators (HbA1c, insulin, and HOMA-IR) and inflammation-related indicators (CRP, IL-6, sTREM1, and sTREM2) among patients with T2DM, we further speculated that the involvement of nesfatin-1 in the impairment of cognitive function in diabetic patients may be related to these factors. However, these hypotheses derived from clinical data, summarized in Figure 5, need to be verified by multidimensional and in-depth studies.
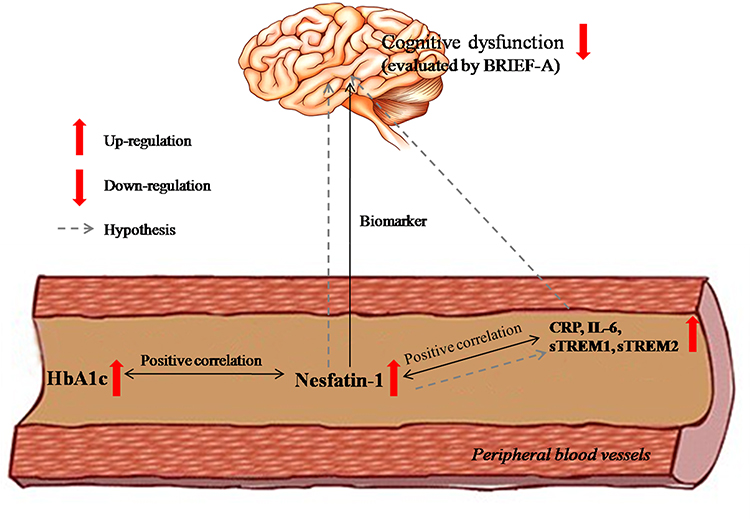 |
Figure 5 Plasma nesfatin-1 might be involved in the comorbidity of T2DM and cognitive dysfunction, and the mechanism underlying this involvement is related to the imbalance expression of CRP, IL-6, sTREM1, and sTREM2. Notes: The nesfatin-1 in plasma was positively correlated with the plasma HbA1c levels and the CRP, IL-6, sTREM1, and sTREM2 levels in patients with T2DM. Moreover, T2DM patients with high nesfatin-1 levels showed higher scales of BRIEF-A. Furthermore, the plasma nesfatin-1 level may be considered as a biomarker to identify T2DM patients with high total scores of BRIEF-A. Collectively, these data suggest that plasma nesfatin-1 might be involved in the comorbidity of T2DM and cognitive dysfunction, and the mechanism underlying this involvement is related to the imbalance expression of CRP, IL-6, sTREM1, and sTREM2. |
This study has two limitations. First, the findings of this study should be interpreted with caution until they have been replicated in larger patient groups as the sample size was small. Second, because of the cross-sectional design of the study, no causality can be determined.
Several clinical implications have also been highlighted. First, our study suggests that the level of nesfatin-1 in the peripheral blood may be related to cognitive impairment in patients with T2DM. Second, the level of nesfatin-1 in peripheral blood may be used as a diagnostic marker for screening T2DM patients with high total scores of BRIEF-A (scores > 50th percentile). Third, nesfatin-1 and its related inflammatory factors may play a role in the pathogenesis of impaired cognitive function in T2DM, which needs to be confirmed by further studies. Additionally, considering that nesfatin-1 is an anorexigenic peptide involved in the regulation of homeostatic feeding68 and HbA1c levels, glucose metabolism indices, and inflammation markers could be affected by dietary interventions,69–71 dietary intervention may be a possible strategy to improve the cognitive function of T2DM patients as it affects the indicators mentioned above.
Conclusion
In conclusion, this study is the first to reveal that plasma nesfatin-1 might be involved in the comorbidity of T2DM and cognitive dysfunction, which is related to the imbalance in the expression of CRP, IL-6, sTREM1, and sTREM2.
Funding
This work was supported by the National Natural Science Foundation of China (grant number 81870403).
Disclosure
The authors declare no conflicts of interest.
References
1. Williams R, Karuranga S, Malanda B, et al. Global and regional estimates and projections of diabetes-related health expenditure: results from the international diabetes federation diabetes atlas, 9th edition. Diabetes Res Clin Pract. 2020;162:108072. doi:10.1016/j.diabres.2020.108072
2. Srikanth V, Sinclair A, Hill-Briggs F, Moran C, Biessels G. Type 2 diabetes and cognitive dysfunction-towards effective management of both comorbidities. Lancet Diabetes Endocrinol. 2020;8(6):535–545. doi:10.1016/S2213-8587(20)30118-2
3. Feil D, Rajan M, Soroka O, Tseng C, Miller D, Pogach L. Risk of hypoglycemia in older veterans with dementia and cognitive impairment: implications for practice and policy. J Am Geriatr Soc. 2011;59(12):2263–2272. doi:10.1111/j.1532-5415.2011.03726.x
4. Dunning T, Sinclair A, Colagiuri S. New IDF guideline for managing type 2 diabetes in older people. Diabetes Res Clin Pract. 2014;103(3):538–540. doi:10.1016/j.diabres.2014.03.005
5. Sinclair A, Abdelhafiz A. Cognitive dysfunction in older adults with type 2 diabetes: links, risks, and clinical implications. Clin Geriatr Med. 2020;36(3):407–417. doi:10.1016/j.cger.2020.04.002
6. Li Z, Gao L, Tang H, et al. Peripheral effects of nesfatin-1 on glucose homeostasis. PLoS One. 2013;8(8):e71513. doi:10.1371/journal.pone.0071513
7. Blanco A, Velasco C, Bertucci J, Soengas J, Unniappan S. Nesfatin-1 regulates feeding, glucosensing and lipid metabolism in rainbow trout. Front Endocrinol. 2018;9:484. doi:10.3389/fendo.2018.00484
8. Goebel-Stengel M, Stengel A. Role of brain NUCB2/nesfatin-1 in the stress-induced modulation of gastrointestinal functions. Curr Neuropharmacol. 2016;14(8):882–891. doi:10.2174/1570159x14666160601153202
9. Angelone T, Rocca C, Pasqua T. Nesfatin-1 in cardiovascular orchestration: from bench to bedside. Pharmacol Res. 2020;156:104766. doi:10.1016/j.phrs.2020.104766
10. Aydin S, Dag E, Ozkan Y, et al. Time-dependent changes in the serum levels of prolactin, nesfatin-1 and ghrelin as a marker of epileptic attacks young male patients. Peptides. 2011;32(6):1276–1280. doi:10.1016/j.peptides.2011.04.021
11. Wei Y, Li J, Wang H, Wang G. NUCB2/nesfatin-1: expression and functions in the regulation of emotion and stress. Prog Neuropsychopharmacol Biol Psychiatry. 2018;81:221–227. doi:10.1016/j.pnpbp.2017.09.024
12. Vas S, Ádori C, Könczöl K, et al. Nesfatin-1/NUCB2 as a potential new element of sleep regulation in rats. PLoS One. 2013;8(4):e59809. doi:10.1371/journal.pone.0059809
13. Weibert E, Hofmann T, Stengel A. Role of nesfatin-1 in anxiety, depression and the response to stress. Psychoneuroendocrinology. 2019;100:58–66. doi:10.1016/j.psyneuen.2018.09.037
14. Xu Y, Ge J, Liang J, et al. Nesfatin-1 and cortisol: potential novel diagnostic biomarkers in moderate and severe depressive disorder. Psychol Res Behav Manag. 2018;11:495–502. doi:10.2147/PRBM.S183126
15. Xu Y, Ge J, Qin G, et al. Acute, but not chronic, stress increased the plasma concentration and hypothalamic mRNA expression of NUCB2/nesfatin-1 in rats. Neuropeptides. 2015;54:47–53. doi:10.1016/j.npep.2015.08.003
16. Chen Z, Xu Y, Wu R, et al. Impaired learning and memory in rats induced by a high-fat diet: involvement with the imbalance of nesfatin-1 abundance and copine 6 expression. J Neuroendocrinol. 2017;29(4). doi:10.1111/jne.12462
17. Ge J, Xu Y, Qin G, et al. Depression-like behavior induced by nesfatin-1 in rats: involvement of increased immune activation and imbalance of synaptic vesicle proteins. Front Neurosci. 2015;9:429. doi:10.3389/fnins.2015.00429
18. Liu F, Yang Q, Gao N, Liu F, Chen S. Decreased plasma nesfatin-1 level is related to the thyroid dysfunction in patients with type 2 diabetes mellitus. J Diabetes Res. 2014;2014:128014. doi:10.1155/2014/128014
19. Zhang Y, Lu J, Zheng S, et al. Serum levels of nesfatin-1 are increased in gestational diabetes mellitus. Gynecol Endocrinol. 2017;33(8):621–624. doi:10.1080/09513590.2017.1306849
20. Zhai T, Li S, Fan X, Tian Z, Lu X, Dong J. Circulating nesfatin-1 levels and type 2 diabetes: a systematic review and meta-analysis. J Diabetes Res. 2017;2017:7687098. doi:10.1155/2017/7687098
21. Zhang Z, Li L, Yang M, Liu H, Boden G, Yang G. Increased plasma levels of nesfatin-1 in patients with newly diagnosed type 2 diabetes mellitus. Exp Clin Endocrinol Diabetes. 2012;120(2):91–95. doi:10.1055/s-0031-1286339
22. Whitmer R. Type 2 diabetes and risk of cognitive impairment and dementia. Curr Neurol Neurosci Rep. 2007;7(5):373–380. doi:10.1007/s11910-007-0058-7
23. Cai R, Huang R, Han J, et al. Lipoprotein-associated phospholipase a2 is associated with risk of mild cognitive impairment in Chinese patients with type 2 diabetes. Sci Rep. 2017;7(1):12311. doi:10.1038/s41598-017-12515-z
24. Schram M, Euser S, de Craen A, et al. Systemic markers of inflammation and cognitive decline in old age. J Am Geriatr Soc. 2007;55(5):708–716. doi:10.1111/j.1532-5415.2007.01159.x
25. Athilingam P, Moynihan J, Chen L, D’Aoust R, Groer M, Kip K. Elevated levels of interleukin 6 and C-reactive protein associated with cognitive impairment in heart failure. Congest Heart Fail. 2013;19(2):92–98. doi:10.1111/chf.12007
26. Schuitemaker A, Dik M, Veerhuis R, et al. Inflammatory markers in AD and MCI patients with different biomarker profiles. Neurobiol Aging. 2009;30(11):1885–1889. doi:10.1016/j.neurobiolaging.2008.01.014
27. Zheng M, Chang B, Tian L, et al. Relationship between inflammatory markers and mild cognitive impairment in Chinese patients with type 2 diabetes: a case-control study. BMC Endocr Disord. 2019;19(1):73. doi:10.1186/s12902-019-0402-3
28. Marioni R, Strachan M, Reynolds R, et al. Association between raised inflammatory markers and cognitive decline in elderly people with type 2 diabetes: the edinburgh type 2 diabetes study. Diabetes. 2010;59(3):710–713. doi:10.2337/db09-1163
29. Xia Q, Liang J, Cao Y, Shan F, Liu Y, Xu Y. Increased plasma nesfatin-1 levels may be associated with corticosterone, IL-6, and CRP levels in patients with major depressive disorder. Clin Chim Acta. 2018;480:107–111. doi:10.1016/j.cca.2018.02.004
30. Sun H, Feng J, Tang L. Function of TREM1 and TREM2 in liver-related diseases. Cells. 2020;9(12):2626. doi:10.3390/cells9122626
31. Ulland T, Colonna M. TREM2 - a key player in microglial biology and Alzheimer disease. Nat Rev Neurol. 2018;14(11):667–675. doi:10.1038/s41582-018-0072-1
32. Replogle J, Chan G, White C, et al. A TREM1 variant alters the accumulation of Alzheimer-related amyloid pathology. Ann Neurol. 2015;77(3):469–477. doi:10.1002/ana.24337
33. Hu N, Tan M, Yu J, et al. Increased expression of TREM2 in peripheral blood of Alzheimer’s disease patients. J Alzheimers Dis. 2014;38(3):497–501. doi:10.3233/JAD-130854
34. Jiang T, Yu J, Zhu X, et al. Triggering receptor expressed on myeloid cells 2 knockdown exacerbates aging-related neuroinflammation and cognitive deficiency in senescence-accelerated mouse prone 8 mice. Neurobiol Aging. 2014;35(6):1243–1251. doi:10.1016/j.neurobiolaging.2013.11.026
35. Fang K, Li H, Chen X, et al. Quercetin alleviates LPS-induced depression-like behavior in rats regulating BDNF-related imbalance of copine 6 and TREM1/2 in the hippocampus and PFC. Front Pharmacol. 2019;10:1544. doi:10.3389/fphar.2019.01544
36. Xu Y, Chen F. Antioxidant, anti-inflammatory and anti-apoptotic activities of nesfatin-1: a review. J Inflamm Res. 2020;13:607–617. doi:10.2147/JIR.S273446
37. Leong A, Wheeler E. Genetics of HbA1c: a case study in clinical translation. Curr Opin Genet Dev. 2018;50:79–85. doi:10.1016/j.gde.2018.02.008
38. American Diabetes Association. Diagnosis and classification of diabetes mellitus. Diabetes Care. 2014;37(Supplement_1):S81–S90. doi:10.2337/dc14-S081.
39. Licata S, Shinday N, Huizenga M, et al. Alterations in brain-derived neurotrophic factor in the mouse hippocampus following acute but not repeated benzodiazepine treatment. PLoS One. 2013;8(12):e84806. doi:10.1371/journal.pone.0084806
40. Garber A. In response to authors’ response to Karl Z. Nadolsky, Do, Re: Consensus statement by the American association of clinical endocrinologists anD American college of endocrinology on the comprehensive type 2 diabetes management algorithm - 2018 executive summary. Endocr Pract. 2018;24(5):499. doi:10.4158/EP-2018-0108
41. Owens D, Landgraf W, Frier B, et al. Commencing insulin glargine 100 U/mL therapy in individuals with type 2 diabetes: determinants of achievement of HbA1c goal less than 7.0. Diabetes Obes Metab. 2019;21(2):321–329. doi:10.1111/dom.13607
42. Kim K, Choi J, Bae J, et al. Time to reach target glycosylated hemoglobin is associated with long-term durable glycemic control and risk of diabetic complications in patients with newly diagnosed type 2 diabetes mellitus: a 6-year observational study. Diabetes Metab J. 2020;45(3):368–378. doi:10.4093/dmj.2020.0046
43. Shelbaya S, Amer H, Seddik S, et al. Study of the role of interleukin-6 and highly sensitive C-reactive protein in diabetic nephropathy in type 1 diabetic patients. Eur Rev Med Pharmacol Sci. 2012;16(2):176–182.
44. Malenica M, Šilar M, Dujić T, et al. Importance of inflammatory markers and IL-6 for diagnosis and follow up of patients with type 2 diabetes mellitus. Med Glas. 2017;14(2):169–175. doi:10.17392/920-17
45. He Q, Dong M, Pan Q, Wang X, Guo L. Correlation between changes in inflammatory cytokines and the combination with hypertension in patients with type 2 diabetes mellitus. Minerva Endocrinol. 2019;44(3):252–258. doi:10.23736/S0391-1977.18.02822-5
46. Zhao L, Han C, Zheng Z, Xiu S, Chan P. Risk of mini-mental state examination (MMSE) decline in the elderly with type 2 diabetes: a Chinese community-based cohort study. BMC Endocr Disord. 2020;20(1):129. doi:10.1186/s12902-020-00606-4
47. Chen X, Xu Y, Wu R, et al. Resveratrol reduces glucolipid metabolic dysfunction and learning and memory impairment in a NAFLD rat model: involvement in regulating the imbalance of nesfatin-1 abundance and copine 6 expression. Front Endocrinol. 2019;10:434. doi:10.3389/fendo.2019.00434
48. Tekin T, Çiçek B, Konyalıgil N, et al. Increased hip circumference in individuals with metabolic syndrome affects serum nesfatin-1 levels. Postgrad Med J. 2020;96(1140):600–605. doi:10.1136/postgradmedj-2019-136887
49. Rabin L, Roth R, Isquith P, et al. Self- and informant reports of executive function on the BRIEF-A in MCI and older adults with cognitive complaints. Arch Clin Neuropsychol. 2006;21(7):721–732. doi:10.1016/j.acn.2006.08.004
50. De Bruyckere K, Bushe C, Bartel C, Berggren L, Kan C, Dittmann R. Relationships between functional outcomes and symptomatic improvement in atomoxetine-treated adult patients with attention-deficit/hyperactivity disorder: post hoc analysis of an integrated database. CNS Drugs. 2016;30(6):541–558. doi:10.1007/s40263-016-0346-3
51. Hanssen K, Beiske A, Landrø N, Hessen E. Predictors of executive complaints and executive deficits in multiple sclerosis. Acta Neurol Scand. 2014;129(4):234–242. doi:10.1111/ane.12177
52. Găman M, Epîngeac M, Diaconu C, Găman A. Evaluation of oxidative stress levels in obesity and diabetes by the free oxygen radical test and free oxygen radical defence assays and correlations with anthropometric and laboratory parameters. World J Diabetes. 2020;11(5):193–201. doi:10.4239/wjd.v11.i5.193
53. Găman M, Dobrică E, Cozma M, et al. Crosstalk of magnesium and serum lipids in dyslipidemia and associated disorders: a systematic review. Nutrients. 2021;13(5):1411. doi:10.3390/nu13051411
54. Găman M, Cozma M, Dobrică E, Bacalbașa N, Bratu O, Diaconu C. Dyslipidemia: a trigger for coronary heart disease in romanian patients with diabetes. Metabolites. 2020;10(5):195. doi:10.3390/metabo10050195
55. Akash M, Rehman K, Liaqat A, Numan M, Mahmood Q, Kamal S. Biochemical investigation of gender-specific association between insulin resistance and inflammatory biomarkers in types 2 diabetic patients. Biomed Pharmacother. 2018;106:285–291. doi:10.1016/j.biopha.2018.06.044
56. Mooijaart S, Sattar N, Trompet S, et al. Circulating interleukin-6 concentration and cognitive decline in old age: the PROSPER study. J Intern Med. 2013;274(1):77–85. doi:10.1111/joim.12052
57. Yang X, Chen Y, Zhang W, et al. Association between inflammatory biomarkers and cognitive dysfunction analyzed by MRI in diabetes patients. Diabetes Metab Syndr Obes. 2020;13:4059–4065. doi:10.2147/DMSO.S271160
58. Gorska-Ciebiada M, Ciebiada M. Association of hsCRP and vitamin D levels with mild cognitive impairment in elderly type 2 diabetic patients. Exp Gerontol. 2020;135:110926. doi:10.1016/j.exger.2020.110926
59. Tian S, Huang R, Han J, et al. Increased plasma Interleukin-1β level is associated with memory deficits in type 2 diabetic patients with mild cognitive impairment. Psychoneuroendocrinology. 2018;96:148–154. doi:10.1016/j.psyneuen.2018.06.014
60. Liang Y, Song P, Zhu Y, et al. TREM-1-targeting LP17 attenuates cerebral ischemia-induced neuronal injury by inhibiting oxidative stress and pyroptosis. Biochem Biophys Res Commun. 2020;529(3):554–561. doi:10.1016/j.bbrc.2020.05.056
61. Zhang J, Liu Y, Zheng Y, et al. TREM-2-p38 MAPK signaling regulates neuroinflammation during chronic cerebral hypoperfusion combined with diabetes mellitus. J Neuroinflammation. 2020;17(1):2. doi:10.1186/s12974-019-1688-9
62. Casati M, Ferri E, Gussago C, et al. Increased expression of TREM2 in peripheral cells from mild cognitive impairment patients who progress into Alzheimer’s disease. Eur J Neurol. 2018;25(6):805–810. doi:10.1111/ene.13583
63. Sao T, Yoshino Y, Yamazaki K, et al. TREM1 mRNA expression in leukocytes and cognitive function in Japanese patients with alzheimer’s disease. J Alzheimers Dis. 2018;64(4):1275–1284. doi:10.3233/JAD-180418
64. Goebel-Stengel M, Wang L, Stengel A, Taché Y. Localization of nesfatin-1 neurons in the mouse brain and functional implication. Brain Res. 2011;1396:20–34. doi:10.1016/j.brainres.2011.04.031
65. Price T, Samson W, Niehoff M, Banks W. Permeability of the blood-brain barrier to a novel satiety molecule nesfatin-1. Peptides. 2007;28(12):2372–2381. doi:10.1016/j.peptides.2007.10.008
66. Pan W, Hsuchou H, Kastin A. Nesfatin-1 crosses the blood-brain barrier without saturation. Peptides. 2007;28(11):2223–2228. doi:10.1016/j.peptides.2007.09.005
67. Ge J, Xu Y, Qin G, Pan X, Cheng J, Chen F. Nesfatin-1, a potent anorexic agent, decreases exploration and induces anxiety-like behavior in rats without altering learning or memory. Brain Res. 2015;1629:171–181. doi:10.1016/j.brainres.2015.10.027
68. Gatta C, De Felice E, D’Angelo L, et al. The case study of nesfatin-1 in the pancreas ofTursiops truncatus. Front Physiol. 2018;9:1845. doi:10.3389/fphys.2018.01845
69. Ramadas A, Chan C, Oldenburg B, Hussein Z, Quek K. Randomised-controlled trial of a web-based dietary intervention for patients with type 2 diabetes: changes in health cognitions and glycemic control. BMC Public Health. 2018;18(1):716. doi:10.1186/s12889-018-5640-1
70. Sohouli M, Fatahi S, Lari A, et al. The effect of paleolithic diet on glucose metabolism and lipid profile among patients with metabolic disorders: a systematic review and meta-analysis of randomized controlled trials. Crit Rev Food Sci Nutr. 2021:1–12. doi:10.1080/10408398.2021.1876625.
71. Sohouli M, Fatahi S, Sharifi-Zahabi E, et al. The impact of low advanced glycation end products diet on metabolic risk factors: a systematic review and meta-analysis of randomized controlled trials. Adv Nutr. 2021;12(3):766–776. doi:10.1093/advances/nmaa150
 © 2021 The Author(s). This work is published and licensed by Dove Medical Press Limited. The full terms of this license are available at https://www.dovepress.com/terms.php and incorporate the Creative Commons Attribution - Non Commercial (unported, v3.0) License.
By accessing the work you hereby accept the Terms. Non-commercial uses of the work are permitted without any further permission from Dove Medical Press Limited, provided the work is properly attributed. For permission for commercial use of this work, please see paragraphs 4.2 and 5 of our Terms.
© 2021 The Author(s). This work is published and licensed by Dove Medical Press Limited. The full terms of this license are available at https://www.dovepress.com/terms.php and incorporate the Creative Commons Attribution - Non Commercial (unported, v3.0) License.
By accessing the work you hereby accept the Terms. Non-commercial uses of the work are permitted without any further permission from Dove Medical Press Limited, provided the work is properly attributed. For permission for commercial use of this work, please see paragraphs 4.2 and 5 of our Terms.