")
Back to Journals » Journal of Inflammation Research » Volume 14
Plasma Metabolomic Profiles in Recovered COVID-19 Patients without Previous Underlying Diseases 3 Months After Discharge
Authors Zhang S, Luo P, Xu J, Yang L, Ma P, Tan X, Chen Q, Zhou M, Song S, Xia H, Wang S, Ma Y, Yang F , Liu Y, Li Y, Ma G, Wang Z, Duan Y, Jin Y
Received 25 June 2021
Accepted for publication 24 August 2021
Published 7 September 2021 Volume 2021:14 Pages 4485—4501
DOI https://doi.org/10.2147/JIR.S325853
Checked for plagiarism Yes
Review by Single anonymous peer review
Peer reviewer comments 2
Editor who approved publication: Professor Ning Quan
Shujing Zhang,1,2,* Ping Luo,3,* Juanjuan Xu,1,* Lian Yang,4,* Pei Ma,1,* Xueyun Tan,1,* Qing Chen,5,* Mei Zhou,1 Siwei Song,1 Hui Xia,1 Sufei Wang,1 Yanling Ma,1 Fan Yang,4 Yu Liu,5 Yumei Li,1 Guanzhou Ma,1 Zhihui Wang,6 Yanran Duan,7 Yang Jin1
1Department of Respiratory and Critical Care Medicine, NHC Key Laboratory of Pulmonary Diseases, Union Hospital, Tongji Medical College, Huazhong University of Science and Technology, Wuhan, Hubei, 430022, People’s Republic of China; 2Department of Pediatrics, Union Hospital, Tongji Medical College, Huazhong University of Science and Technology, Wuhan, Hubei, 430022, People’s Republic of China; 3Department of Translational Medicine Center, Union Hospital, Tongji Medical College, Huazhong University of Science and Technology, Wuhan, Hubei, 430022, People’s Republic of China; 4Department of Radiology, Union Hospital, Tongji Medical College, Huazhong University of Science and Technology, Wuhan, Hubei, 430022, People’s Republic of China; 5Health Checkup Department, Union Hospital, Tongji Medical College, Huazhong University of Science and Technology, Wuhan, Hubei, 430022, People’s Republic of China; 6Department of Scientific Research, Union Hospital, Tongji Medical College, Huazhong University of Science and Technology, Wuhan, Hubei, 430022, People’s Republic of China; 7School of Public Health, Tongji Medical College, Huazhong University of Science and Technology, Wuhan, 430030, Hubei, People’s Republic of China
*These authors contributed equally to this work
Correspondence: Yang Jin
Department of Respiratory and Critical Care Medicine, NHC Key Laboratory of Pulmonary Diseases, Union Hospital, Tongji Medical College, Huazhong University of Science and Technology, 1277 Jiefang Avenue, Wuhan, Hubei, 430022, People’s Republic of China
Email [email protected]
Background: It remains unclear whether discharged COVID-19 patients have fully recovered from severe complications, including the differences in the post-infection metabolomic profiles of patients with different disease severities.
Methods: COVID-19-recovered patients, who had no previous underlying diseases and were discharged from Wuhan Union Hospital for 3 months, and matched healthy controls (HCs) were recruited in this prospective cohort study. We examined the blood biochemical indicators, cytokines, lung computed tomography scans, including 39 HCs, 18 recovered asymptomatic (RAs), 34 recovered moderate (RMs), and 44 recovered severe/ critical patients (RCs). A liquid chromatography-mass spectrometry-based metabolomics approach was employed to profile the global metabolites of fasting plasma of these participants.
Results: Clinical data and metabolomic profiles suggested that RAs recovered well, but some clinical indicators and plasma metabolites in RMs and RCs were still abnormal as compared with HCs, such as decreased taurine, succinic acid, hippuric acid, some indoles, and lipid species. The disturbed metabolic pathway mainly involved the tricarboxylic cycle, purine, and glycerophospholipid metabolism. Moreover, metabolite alterations differ between RMs and RCs when compared with HCs. Correlation analysis revealed that many differential metabolites were closely associated with inflammation and the renal, pulmonary, heart, hepatic, and coagulation system functions.
Conclusion: We uncovered metabolite clusters pathologically relevant to the recovery state in discharged COVID-19 patients which may provide new insights into the pathogenesis of potential organ damage in recovered patients.
Keywords: COVID-19, recovery, metabolomics
Introduction
The coronavirus disease (COVID-19), caused by the infection of severe acute respiratory syndrome coronavirus 2 (SARS-CoV-2), has recorded 205.3 million total confirmed cases and claimed 4.3 million lives as of 14 August 2021.1 Recent studies have shown that some recovered patients still have symptoms or develop new symptoms, such as shortness of breath, general fatigue, pulmonary fibrosis,2 cardiac injury,3,4 olfactory impairment,5 and abnormal laboratory indicators in the early recovery stage. Nevertheless, our understanding of the residual and future impact of SARS-CoV-2 infections on recovered patients is still unclear.
Metabolic changes in plasma have been previously reported for different viral infections, such as SARS,6 H1N1,7 respiratory syncytial virus,8 Ebola virus9 and dengue.10 Recent studies have revealed that metabolic dysregulation in COVID-19 patients and metabolites may help stratify patients in terms of disease severity during hospitalisation.11–17 Moreover, it has been reported that after discharge, only one-third of the metabolites were recovered,14 and some metabolites continued to be abnormal in recovered COVID-19 patients.18,19 In addition, we recently found that discharged patients with pulmonary sequelae also had disordered plasma metabolite profiles.20 Therefore, understanding the metabolomic changes of discharged COVID-19 patients who lack a previous underlying disease after several months of recovery may help us find clues to the physiological and pathophysiological processes during recovery and better manage these patients.
In this study, we prospectively recruited COVID-19 patients who had been discharged from Wuhan Union Hospital for 3 months and divided them into four groups based on their previous disease severity. We only recruited COVID-19 patients without any other underlying disease for eliminating the metabolic interference of other underlying diseases, especially diabetes and hyperthyroidism, to directly observing the residual effects of SARS-CoV-2 on these patients, and meanwhile avoiding the unbalanced matching of basal disease among patients in each group. We quantitatively determined the plasma metabolome differences of 135 subjects, including 39 healthy controls (HCs), 18 recovered asymptomatic patients (RAs), 34 recovered moderate patients (RMs), and 44 recovered severe/critical patients (RCs). Meanwhile, blood biochemical markers and chest computed tomography (CT) scans were performed to assess their clinical recovery.
Methods
Study Participants and Sample Collection
This prospective study recruited 78 COVID-19 adult patients without underlying diseases before admission (that is, these patients did not have any other disease prior to getting COVID-19, such as diabetes, hypertension, hyperthyroidism and cancer), including 34 RMs and 44 RCs who had been discharged from Wuhan Union Hospital for 3 months. Overall, matched 18 RAs and 39 HCs were enrolled from the health check-up department of the Union Hospital during the same period. HCs were adults who tested negative for IgG and IgM of SARS-CoV-2 and had no underlying diseases, while the RAs were adults positive for IgG but negative for IgM of SARS-CoV-2, without symptoms and underlying diseases. All participants were negative for SARS-CoV-2 nucleic acid, as confirmed by real-time polymerase chain reaction at the time of inclusion. There were no statistically differences in baseline characteristics, such as age, sex, and body mass index between the HC and different recovered groups (RA, RM, and RC groups) (see study flow chart in Figure 1). Patients were diagnosed and stratified at admission per the New Coronavirus Pneumonia Prevention and Control Program (7th edition) released by the National Health Commission of China. In detail, moderate cases had fever or respiratory symptoms with characteristic imaging findings of pneumonia. Severely ill patients were diagnosed if one of the following was present: (1) RR ≥ 30/min at rest; (2) oxygen saturation below 93% at rest; (3) PaO2/FiO2 ≤ 300 mmHg; and (4) over 50% deterioration of imaging findings over a period of 24–48 hours. Critical cases were diagnosed if any of the following criteria were met: (1) respiratory failure and the need for mechanical ventilation, (2) development of shock, and (3) failure of other vital organs and the need for intensive care.
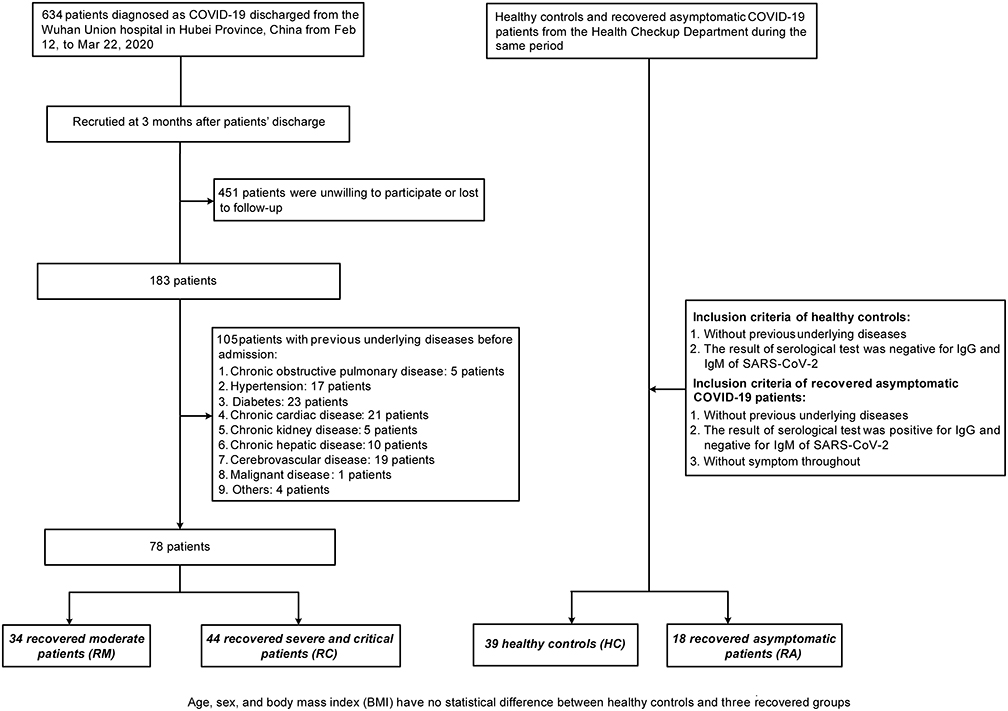 |
Figure 1 Study flowchart of participant recruitment. A schematic overview of the inclusion and exclusion criteria and the number of excluded subjects, and the number of patients finally included. Briefly, a total of 634 COVID-19 patients were included. 451 patients were removed from the study for either refusal to participate or in loss to the follow-up. Of the remaining 183 patients, 105 patients with underlying diseases before admission were excluded. The remaining 78 patients were stratified and assigned into a RM group and a RC group based on the severity of illness at admission. Meanwhile, we included 39 HCs and 18 RAs against criteria, serving as the control group. No statistically significant differences in age, sex, and body mass index (BMI) were found between HC and different recovered groups. |
All participants underwent blood tests, including complete blood count, coagulation profile, renal and liver function, creatine kinase, and chest CT. Estimated glomerular filtration rate (eGFR) was calculated based on the serum creatinine level per the CDK-EPI equation.21 Peripheral blood was collected for subsequent metabolomic and cytokine determination. This study was conducted in accordance with the Declaration of Helsinki and registered on the Clinical Trials website (NCT04283396). The institutional ethics committee of Wuhan Union Hospital (No. 0036) reviewed and approved the study protocol. Informed consent was obtained from all the enrolled patients.
Chest CT and Artificial Intelligence (AI)-Based Quantification of CT Images
Chest CT was performed in these subjects using a 126-slice CT scanner (Ingenuity Core 128, Philips). Ground-glass opacity (GGO), fibrous stripes, thickening of the adjacent pleura, bronchovesicular bundle distortion, and small pleural effusion,22,23 were collected and estimated by two experienced imaging specialists. In addition, an artificial intelligence (AI)-based quantitative evaluation system (YITU Healthcare Technology, China)24 was used to calculate the volume of pneumonia lesions by analysing the CT values. The details are listed in Supplementary Methods.
Plasma IL-6 and TNF-α
Plasma concentrations of IL-6 (ab178013, Abcam, UK) and TNF-α (ab181421, Abcam, UK) were measured by enzyme-linked immunosorbent assay per the manufacturer’s guidelines.
Plasma Collection and Metabolite Extraction
All HCs and recovered patients were instructed to fast for 12 hours and not take any drugs or dietary supplements for 48 h before blood collection. The details are listed in Supplementary Methods.
Untargeted LC-MS-Based Metabolomic Analysis
Metabolites were detected using ultra-high-performance liquid chromatography (UltiMate 3000, Thermo Scientific, USA) in series on a Q Exactive high-resolution mass spectrometry (HRM) system (Thermo Scientific, USA). An ACQUITY UPLC HSS T3 column (1.8 μm, 100 mm×2.1 mm) (Waters, USA) was used for chromatographic separation. Data were acquired by scanning the positive and negative ions separately. Samples (2 µL) were injected into the LC-MS system for detection of each ion mode. The column temperature was maintained at 35° C and the flow rate was set at 0.35 mL/min. The mobile phase in the positive ion mode was made of an aqueous solution containing 0.1% formic acid (mobile phase A) and 100% methanol containing 0.1% formic acid (mobile phase B). The mobile phase in the negative ion mode was made of an aqueous solution containing 10 mM ammonium formate (mobile phase A) and 95% methanol containing 10 mM ammonium formate (mobile phase B). The chromatographic gradient was 0 min at 10% B, 1 min at 10% B, 13 min at 98% B, 18 min at 98% B, 18.5 min at 10% B, and 20 min at 10% B for both ion modes. Metabolic data were obtained by both Q Exactive full scan and MS/MS data using the data-dependent acquisition method. The collision energy for positive ions and negative ions was set at 3.8 kV and 3.2 kV, respectively. Raw data were converted into a common (ABF) format using the Analysis Base File Converter.
Quantification and Statistical Analysis
Peak alignment of the acquired raw data was performed using the MSDIAL software package (http://prime.psc.riken.jp/compms/msdial/main.html). After removing missing values by 80% rule,25 the signal drifts of the remaining matched peak ions were calibrated using global linear regression based signal correction (Gorec) to minimise the effect of data instability.26,27 Metabolites were identified by the online research of HMDB (https://hmdb.ca/) and MSBank (http://www.massbank.jp/) and mzCloud (Thermo Scientific, USA) of MS1 and MS2, or on the basis of our previous studies.28,29 Partial least square-discriminant analysis (PLS-DA) was performed using SIMCA-P software (version 11.0; Umetrics) and Mann–Whitney U-test with Benjamini-Hochberg-based false discovery rate (FDR) correction were used to identify differential metabolites between RAs, RMs, RCs, and HCs. Variable importance in the projection (VIP) was calculated based on the PLS-DA and used to rank the importance of differential metabolites. Principal component analysis (PCA) was also conducted using MetaboAnalyst 5.0 to evaluate the distribution of participants and the most relevant variables. Metabolites with a two-tailed P < 0.05, FDR < 0.2, and VIP >1 were deemed statistically significant. Spearman correlation analysis among the clinical indicators and differential metabolites was carried out using SPSS software (version 18.0.0) and displayed as a correlation matrix using R software (version 3.6.3). Metabolite pathway analysis was conducted using the online software MetaboAnalyst (https://www.metaboanalyst.ca/MetaboAnalyst/).
Results
Clinical Features and Inflammation Levels of Recovered COVID-19 Patients without Previous Underlying Diseases
A total of 135 participants without underlying diseases were prospectively enrolled, including 34 RMs and 44 RCs who had been discharged for 3 months, 18 RAs, and 39 HCs (Figure 1). As shown in Table 1, all recovered patients tested positive for IgG and/or IgM. In RMs or RCs, factors indicative of poor prognosis, such as lymphopenia, eosinopenia, elevated lactate dehydrogenase (LDH) level, aspartate aminotransferase (AST), alanine aminotransferase (ALT) and glucose level, returned to normal. However, laboratory indicators related to liver function (alkaline phosphatase [ALP]) and renal function (creatinine and uric acid [UA]) remained aberrant in RMs or RCs as compared with HCs or the levels at admission.
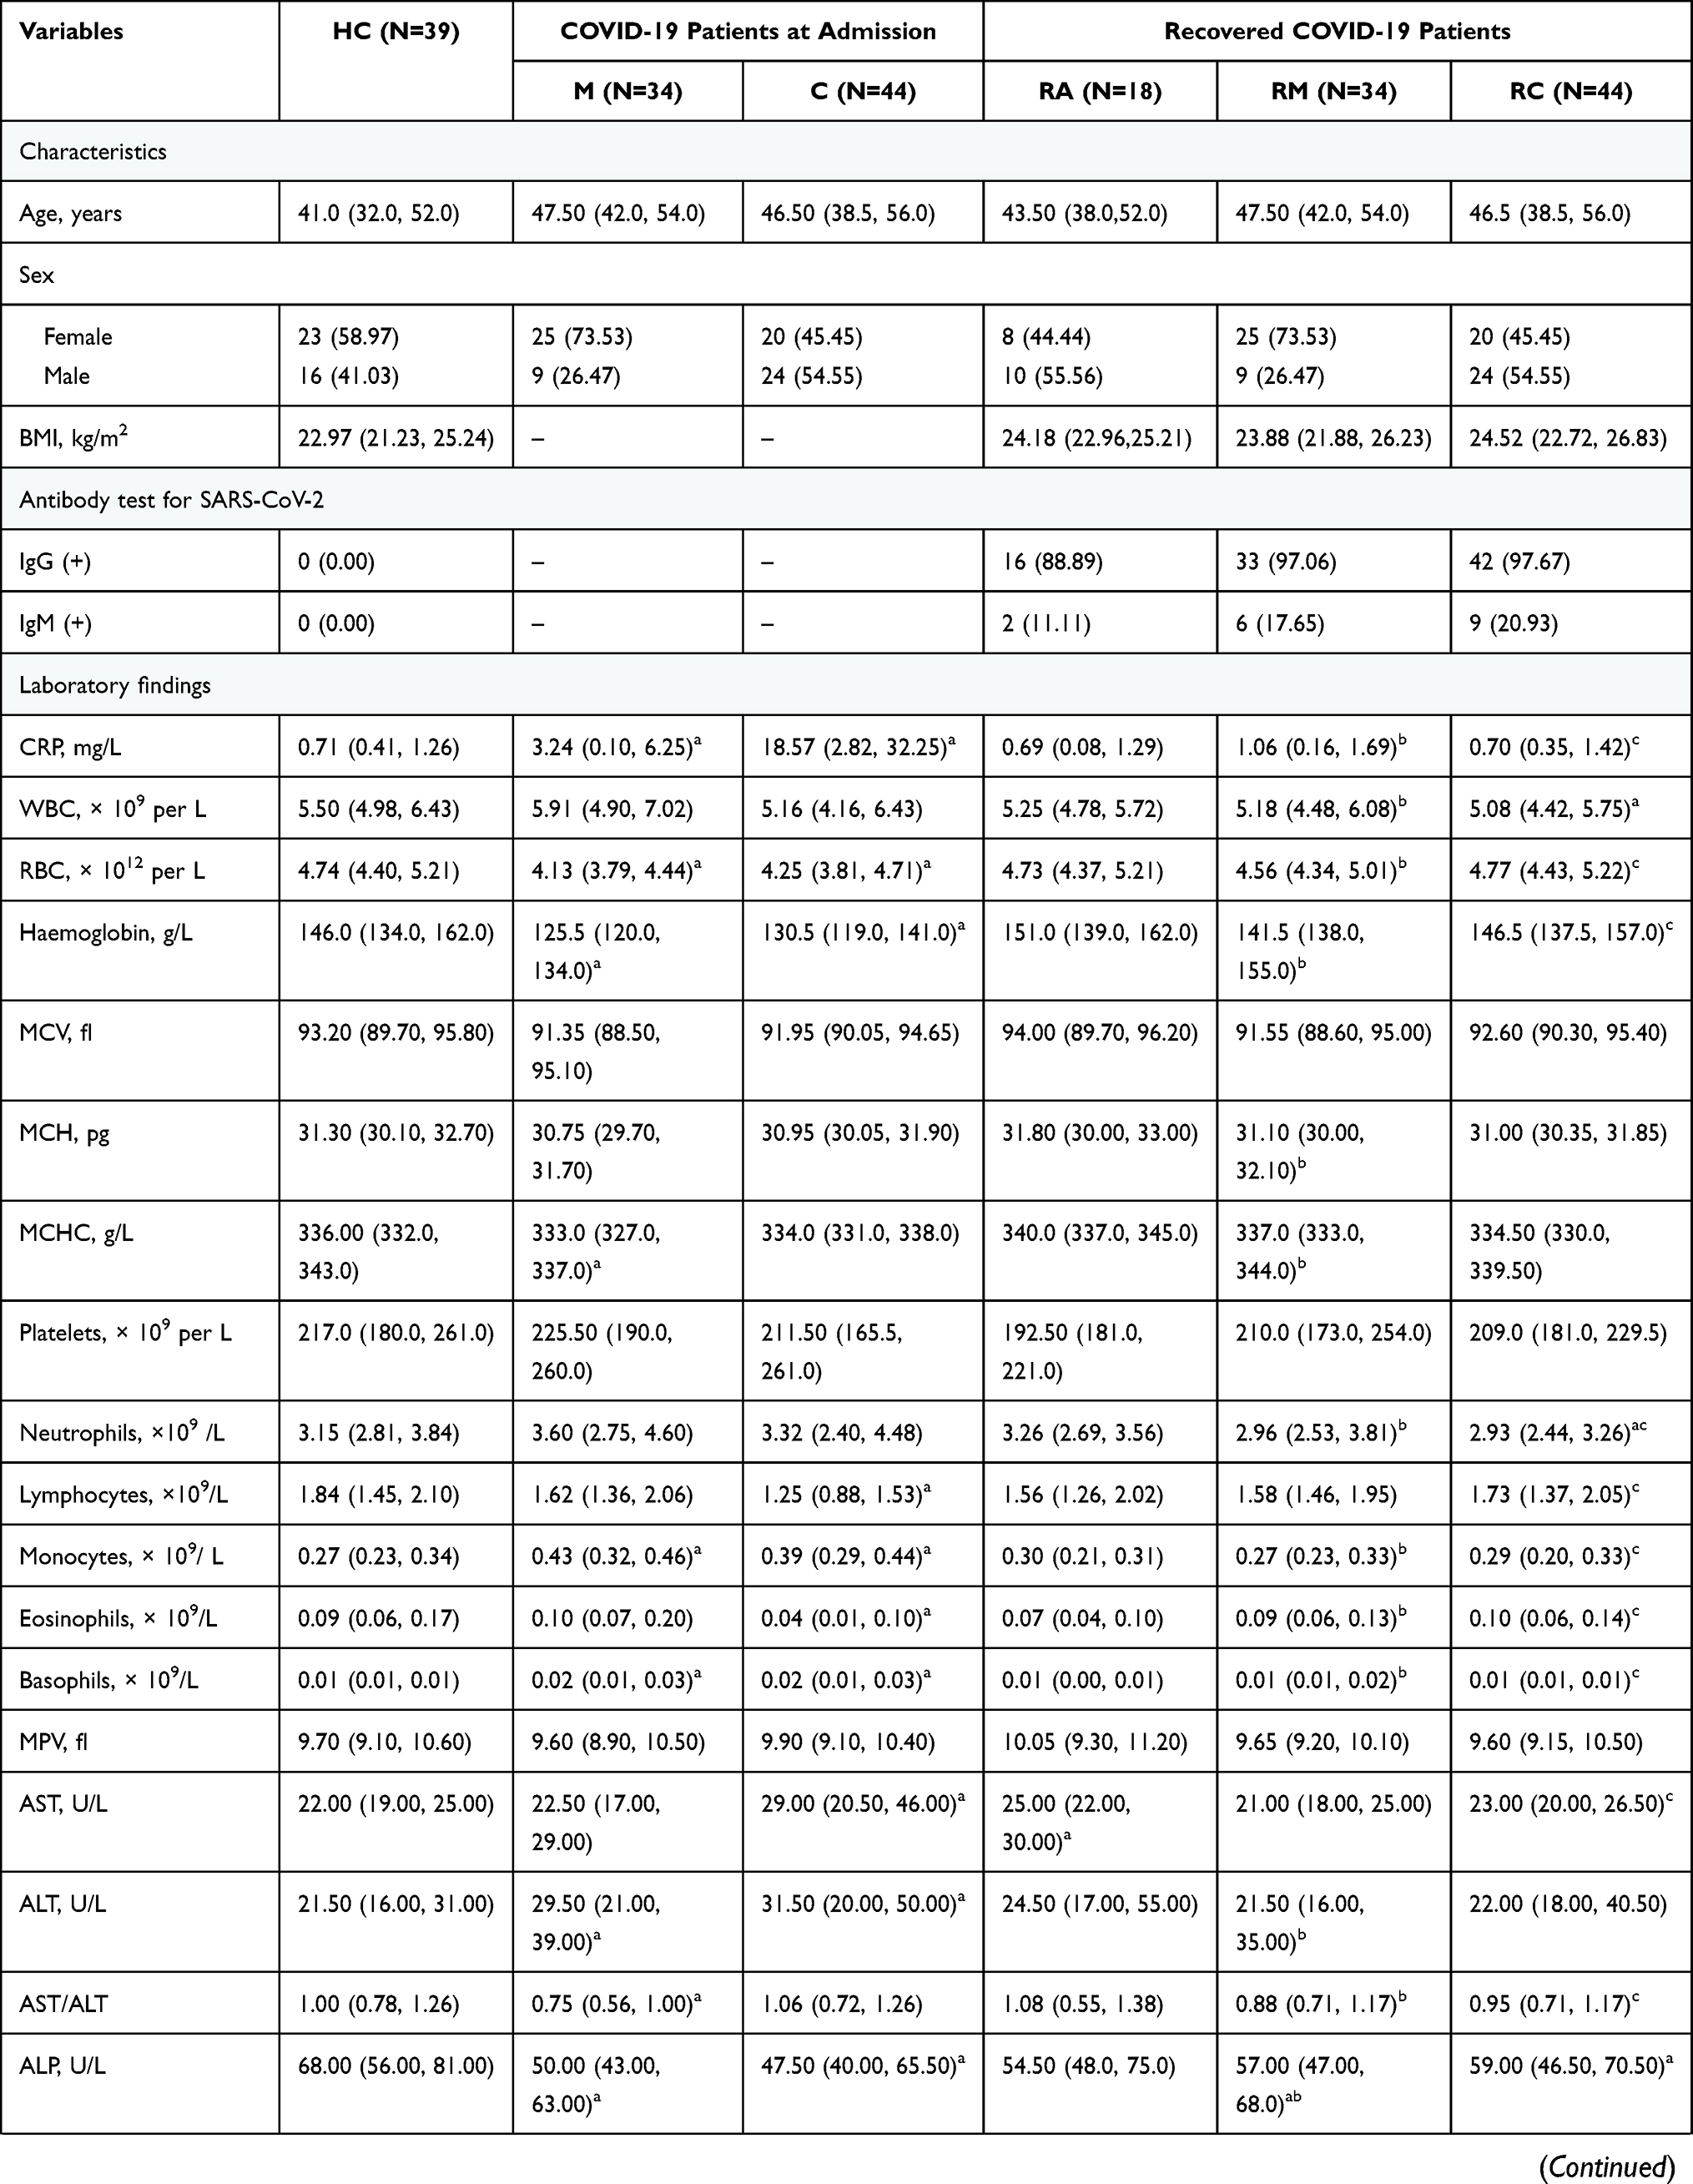 | 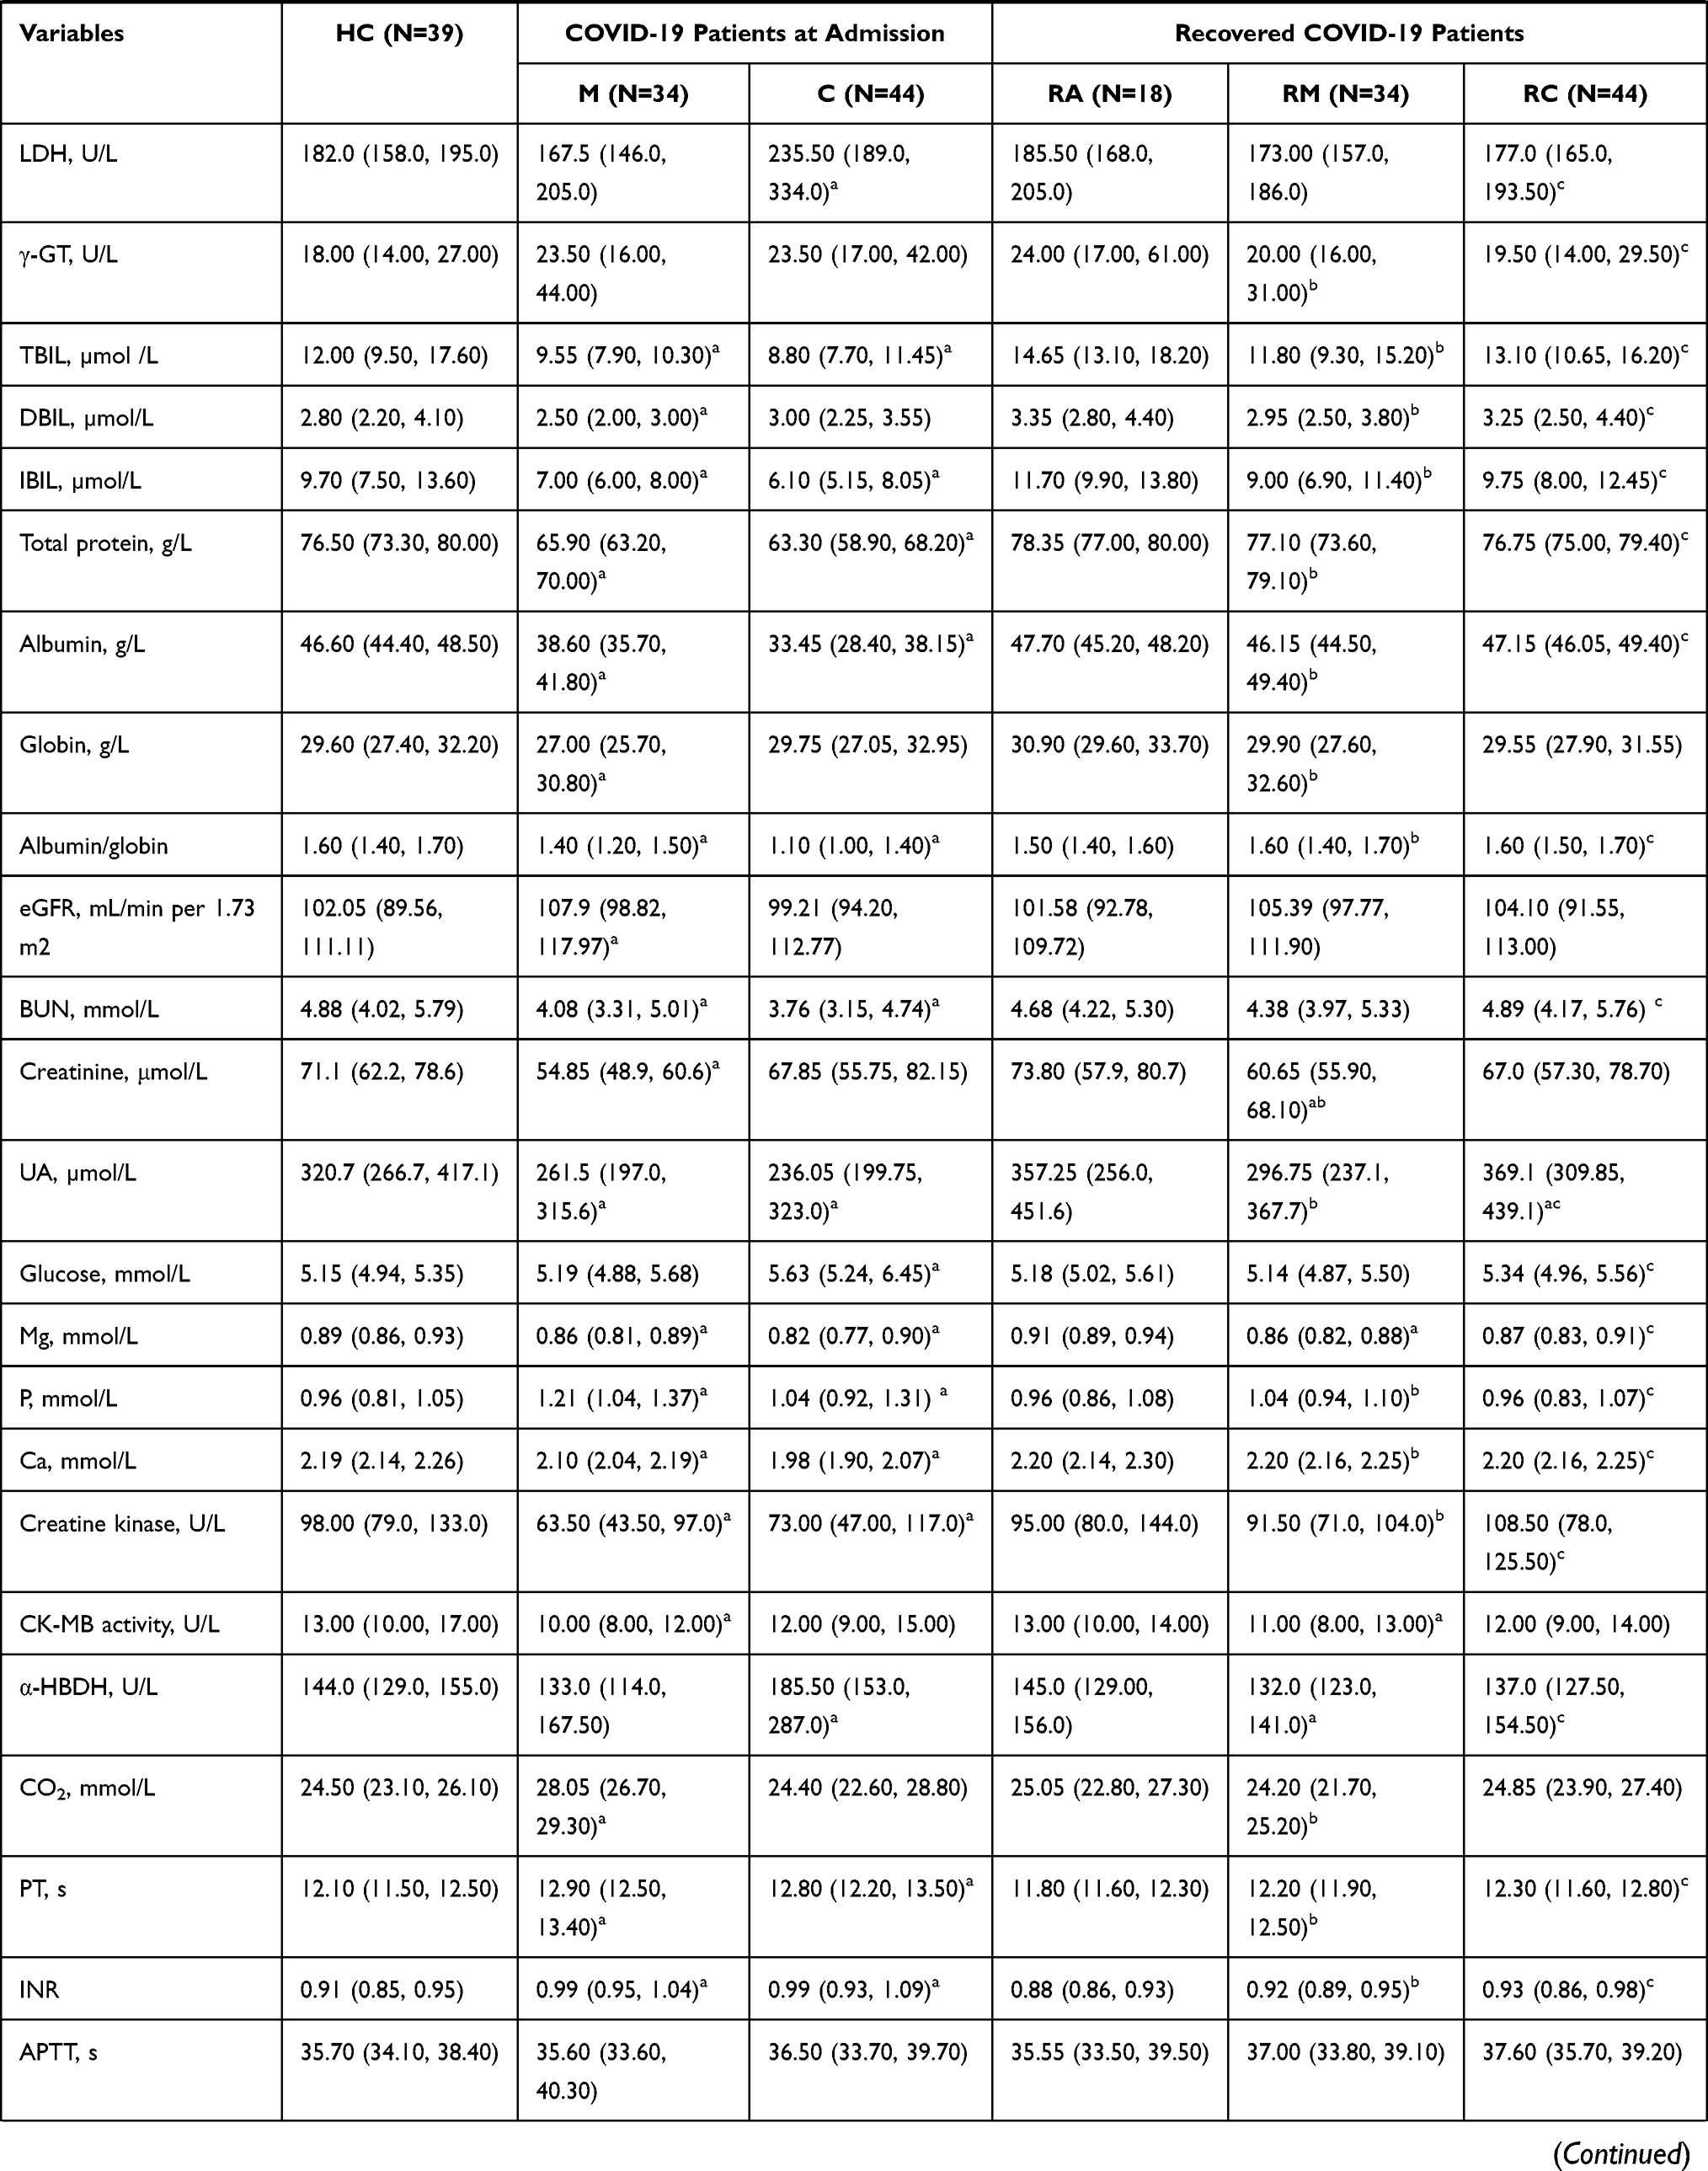 | 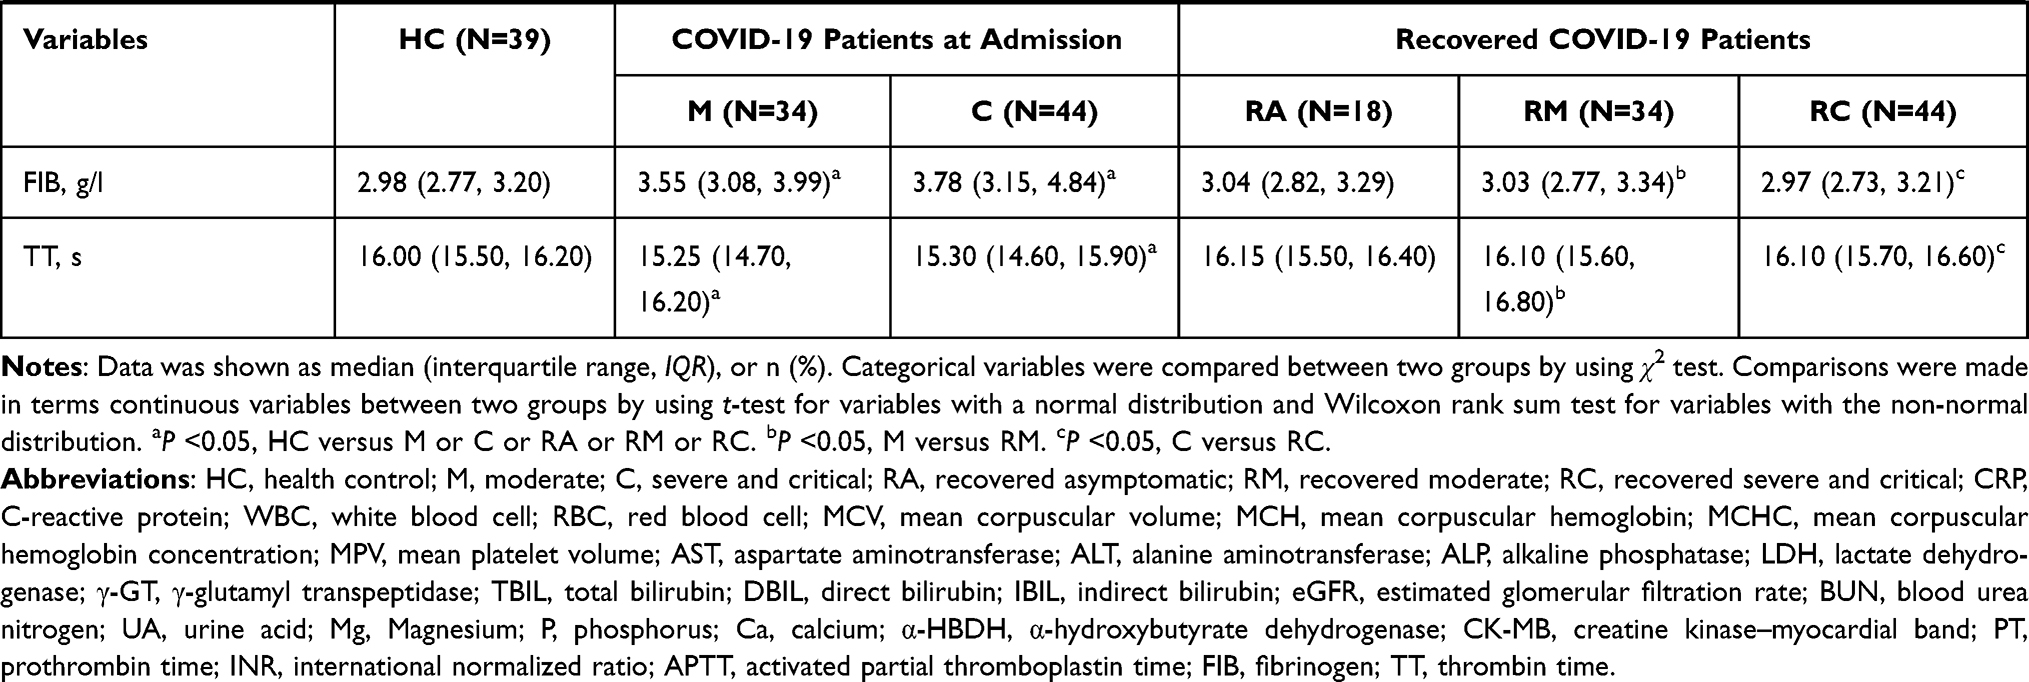 |
Table 1 Clinical and Laboratory Findings of Healthy Controls and COVID-19 Patients |
During this follow-up, a total of 26 HCs and 90 recovered patients (18 RAs, 33 RMs, and 39 RCs) underwent chest CT scans. Representative CT images of the different groups are shown in Figure 2A. Nineteen (57.58%) of the 33 RMs and 26 (66.67%) of the 39 RCs had residual lung lesions. However, there was no significant difference in chest CT findings between the RA and HC groups (Table 2). GGO, the most common radiological abnormality at admission, was still frequent in RMs (51.52%, P <0.05) and RCs (48.72%, P <0.05). Other radiological features, including fibrous stripes, thickening of the adjacent pleura, and bronchovesicular bundle distortion, were also more apparent in RCs than in HCs. AI-derived CT features quantifying pneumonia lesions were studied to assess the rehabilitation of the lungs (Figure 2B, Table 2). There was no obvious difference in pneumonia lesions (percentages of GGO volume [PGV], percentages of consolidation volume [PCV], and percentages of bilateral lung volume [PLV]) between HCs and RAs (Table 2, P >0.05). However, PGV, PCV, and PLV in the whole lung or left/right lobe in RCs were significantly different from those in HCs (P <0.05). In RMs, except for PCV of the left lobe (P =0.11), other pneumonia lesions were also significantly different from those in HCs (P <0.05).
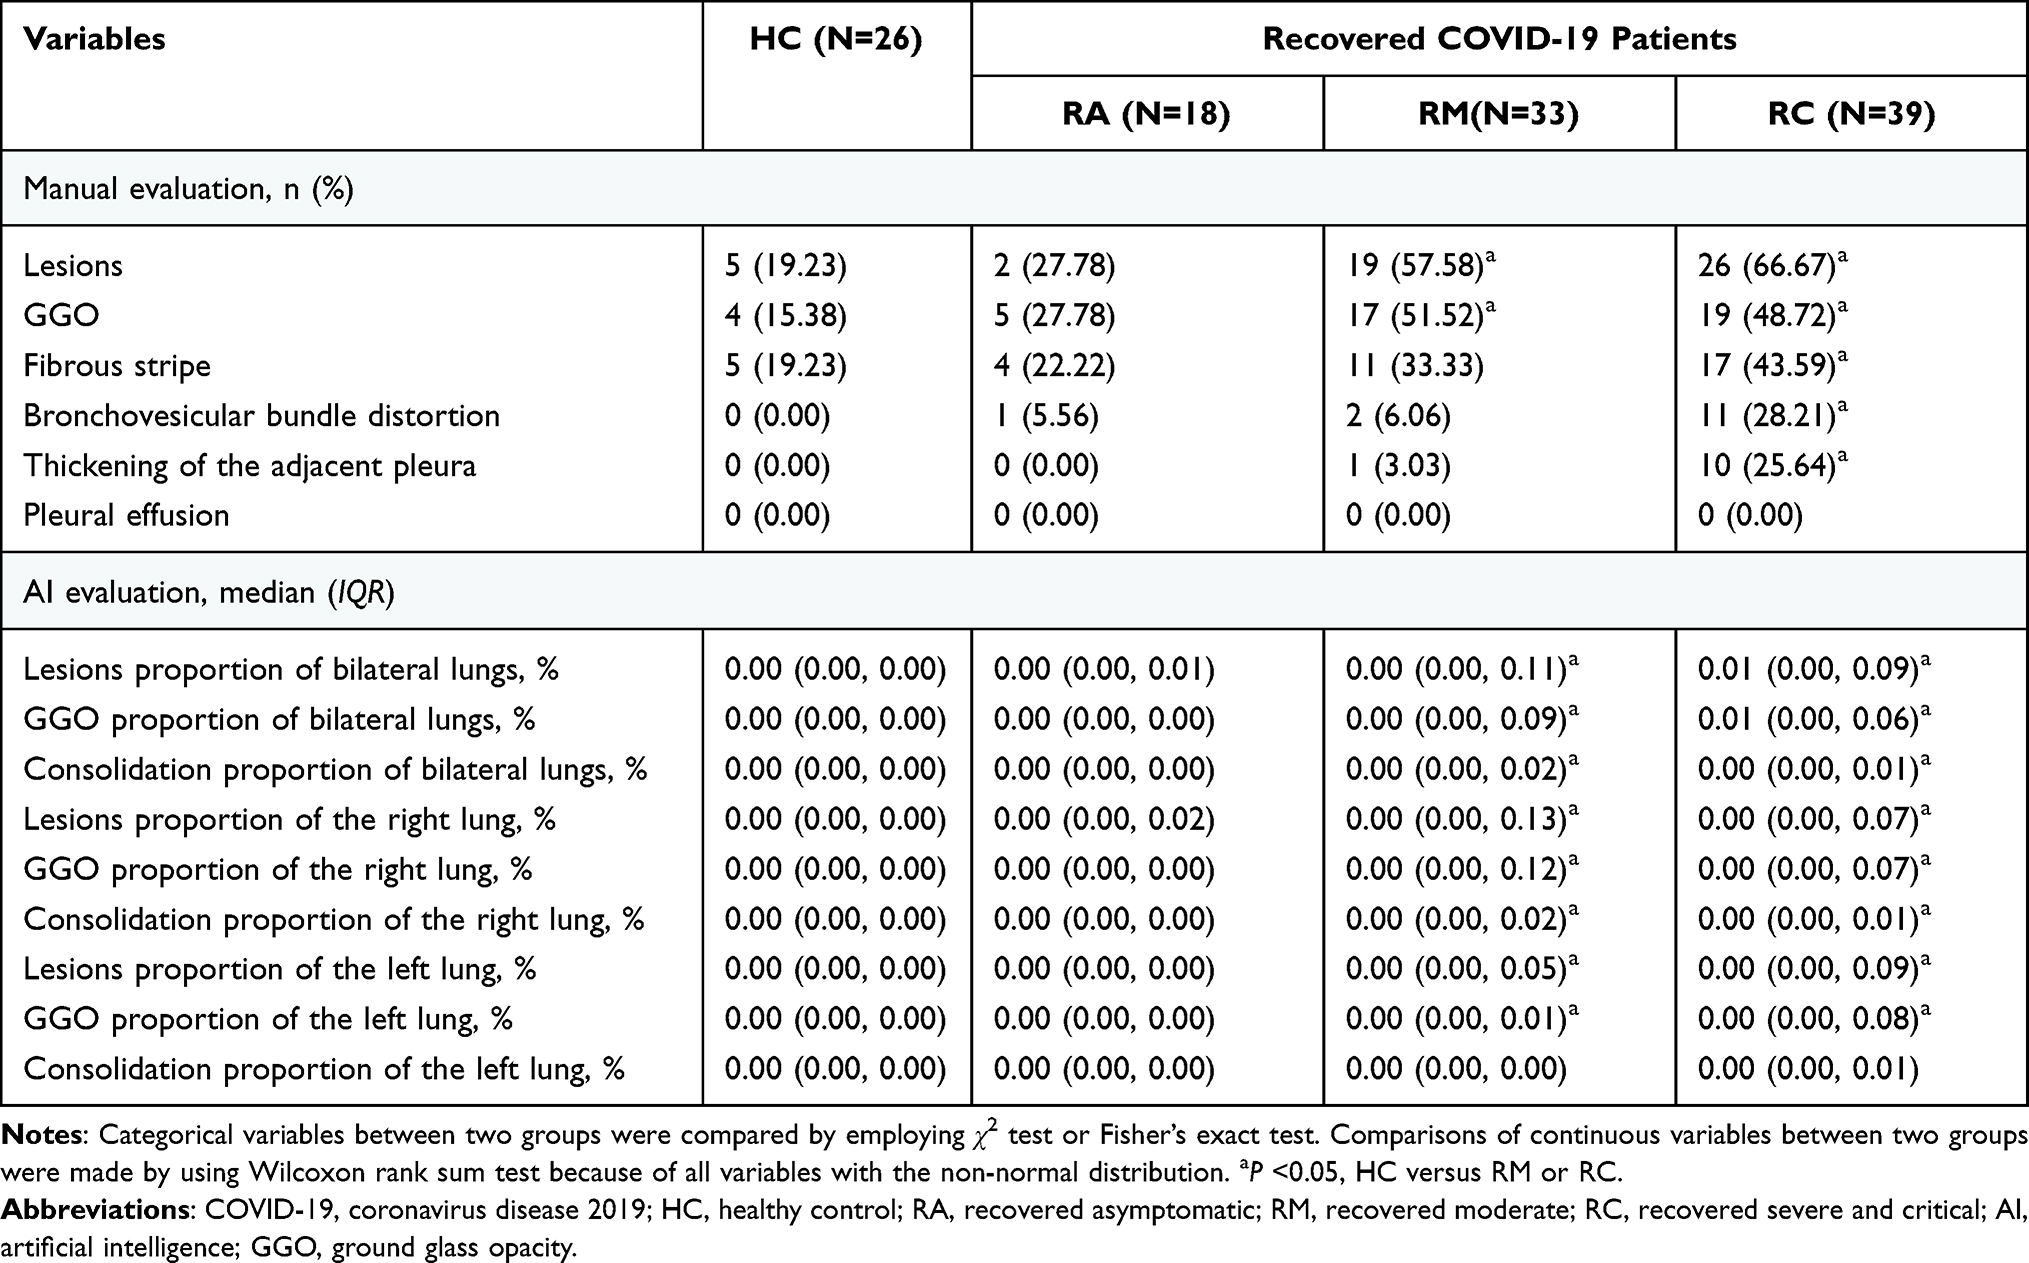 |
Table 2 Chest CT Findings Based on Manual Evaluation and Artificial Intelligence (AI) Analysis of Chest CT in Healthy Controls and Recovered COVID-19 Patients |
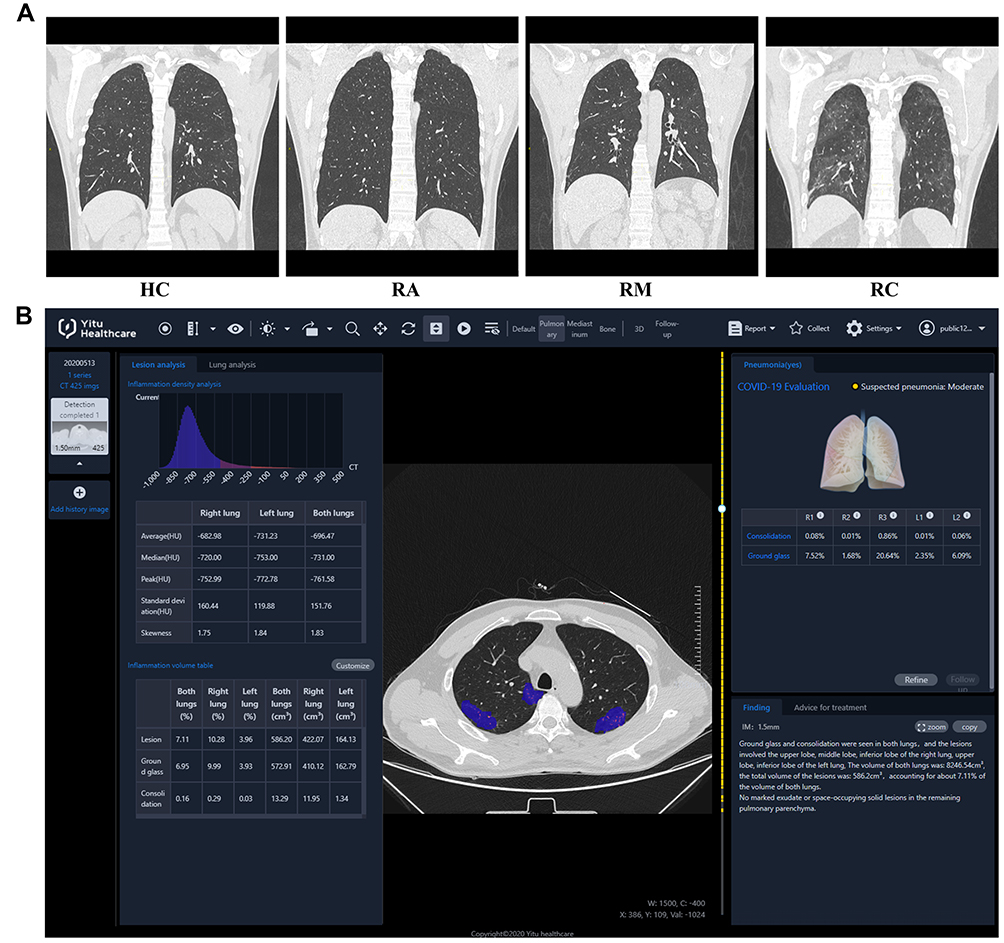 |
Figure 2 CT images and quantitative analysis with artificial intelligence (AI) system. Vertical scans of four representative patients were illustrated: (A) A 52-year-old male from HCs; A 54-year-old male from Ras; A 52-year-old male from RMs; A 53-year-old male from RCs. (B) COVID-19 pneumonia lesions from a patient in RCs detected by the AI system are displayed with blue pseudo color. |
In addition, compared with HCs, the plasma TNF-α levels of RMs and RCs were still significantly higher, while IL-6 levels in RMs and RCs recovered to levels comparable to those in HCs (Figure 3).
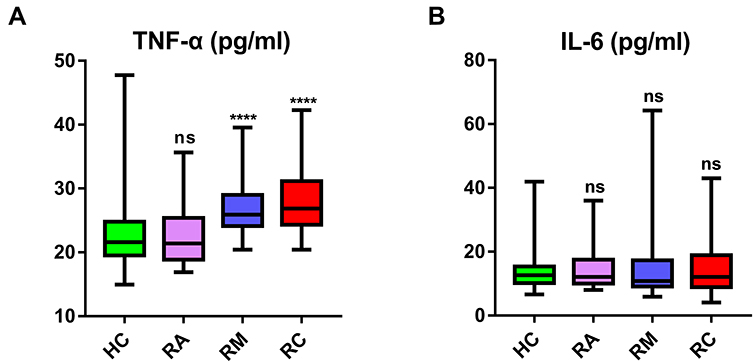 |
Figure 3 Plasma TNF-α and IL-6 concentrations of recovered COVID-19 patients and HCs. Plasma TNF-α (A) and IL-6 (B) were measured in healthy controls (HCs, n=39), recovered asymptomatic patients (RAs, n=18), recovered moderate patients (RMs, n=34), and recovered severe/critical patients (RCs, n=44) by ELISA. Data were expressed as boxplots with median and interquartile range. Significance of comparisons between RAs, RMs, or RCs vs HCs was determined by the Wilcoxon rank sum test and indicated as: ns (not significant), ****P < 0.0001. Abbreviation: ns, not significant. |
Recovered COVID-19 Patients Presented Plasma Metabolite Profiles That Were Different from HCs
A total of 332 metabolites, including amino acids, bile acids, organic acids, acylcarnitines (ACNs), steroids, amides, and some lipid species, were identified in the 135 subjects using the untargeted LC-MS method. In the PLS-DA score plot, the metabolites from plasma samples of RMs and RCs clustered well away from HCs samples, while those from RAs were inseparable from HCs (Supplementary Figure 1A, Figure 4A and B), and the PCA plots showed the same trend (Supplementary Figure 1B–G), which indicates that the metabolic levels of RAs recovered to levels comparable to those in HCs, while RMs and RCs did not. Finally, there were 27 and 59 differential metabolites in RMs and RCs, respectively, compared with HCs (P < 0.05, FDR< 0.2, and VIP>1, Figure 4C–F, Table S1).
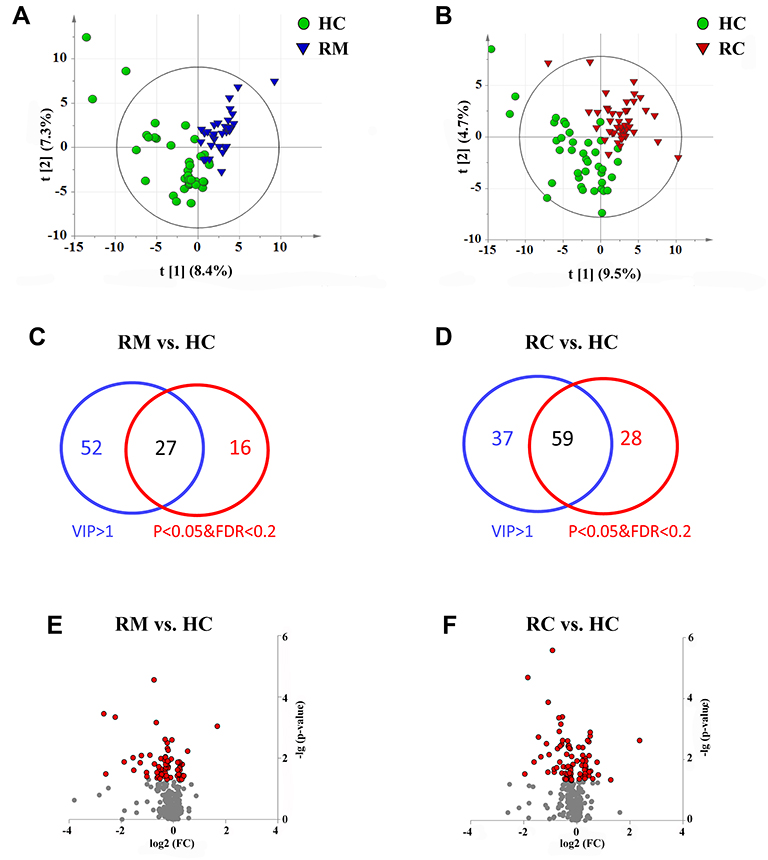 |
Figure 4 Profiling of metabolites from plasma samples of RMs and RCs as compared with HCs 3 months post discharge. Score plots of PLS-DA based on the 332 metabolites detected in the (A) RMs vs HCs and (B) RCs vs HCs. Venn diagram showing the number of differential metabolites in (C) RMs vs HCs and (D) RCs vs HCs. (E and F) Volcano plots of altered metabolites in RM, and RC patients as compared with HCs, the x-axis is the value of log2(FC), FC (fold change) represents the average level of metabolites in RMs or RCs relative to the average level in HCs, and the y-axis is -log (P value). The red dots represent the metabolites with two tailed P -value < 0.05. |
Among these differential metabolites, 14 metabolites showed comparable changes in RMs and RCs, including decreased levels of taurine, succinic acid, hippuric acid, cyclic AMP, inosine, hypoxanthine, and increased aconitate, abscisic acid, inosine-5-monophosphate (IMP), and deoxycytidine, among others (Figure 5A). However, most metabolite changes were unique to each group.
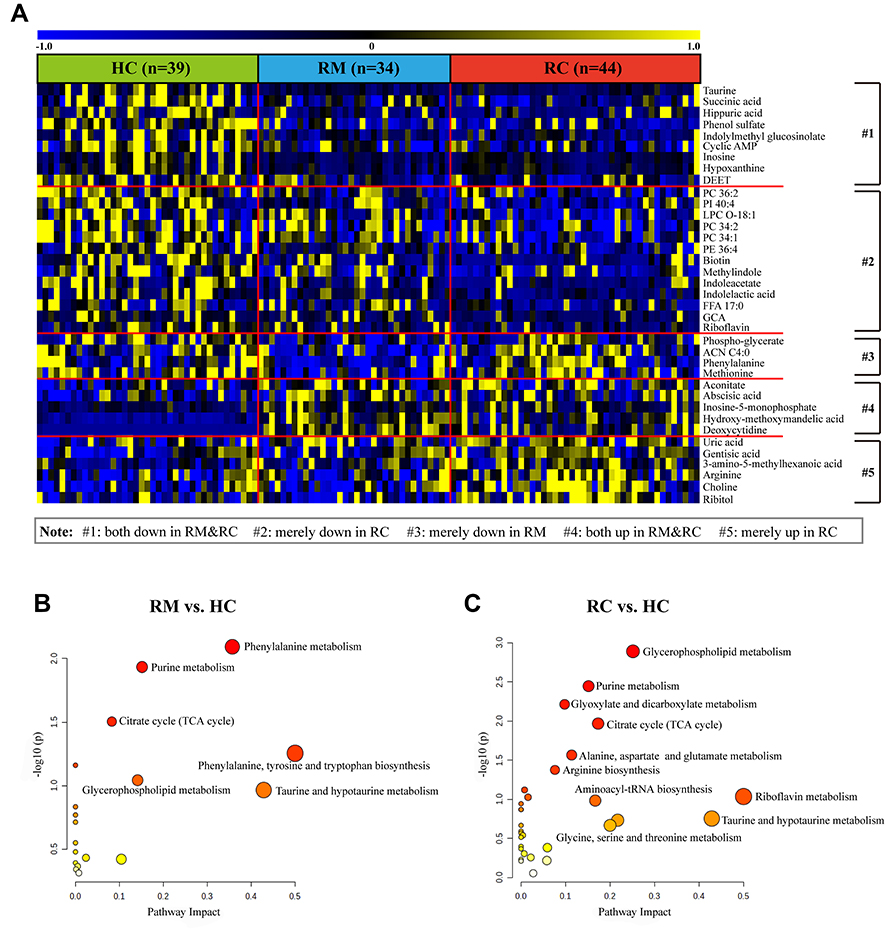 |
Figure 5 Significantly changed metabolites in RMs and RCs compared to HCs 3 months after discharge from hospital. (A) Heat map of changed metabolites in RMs and RCs as compared to HCs. Only differential metabolites with P <0.01, FDR <0.2, and VIP >1 are displayed, and the shades of the color indicate the relative level of metabolites (blue and yellow are indicative of relatively lower and higher level, respectively, and black shows the mean level). The disturbed metabolic pathways showed various metabolism changes when comparing (B) RMs to HCs, and (C) RCs to HCs. The value of P and pathway impact is calculated from the pathway enrichment and topology analysis, respectively. The node color is based on its p value and the node radius is determined based on their pathway impact values. |
To further understand these metabolomic changes, pathway enrichment analysis was performed to explore the biological implications of these differential metabolites. The metabolic disorders mainly involved glycerophospholipid metabolism, purine metabolism, tricarboxylic (TCA) cycle, and phenylalanine metabolism in the RMs and RCs (Figure 5B and C).
Potential Correlation Between the Differential Metabolites and Inflammation in Recovered COVID-19 Patients
To understand the mechanism of the metabolite changes in recovered COVID-19 patients, the relationship between these differential metabolites and inflammation and clinical markers was investigated by examining the correlation among HCs, RMs, and RCs. Only correlations with P < 0.05 and correlation coefficients (r) > 0.3 or <-0.3 were displayed in correlation matrix (Figure 6, Table S2). It was worth noting that many of these relationships differed between HCs and recovered COVID-19 patients (Figure 6A–F).
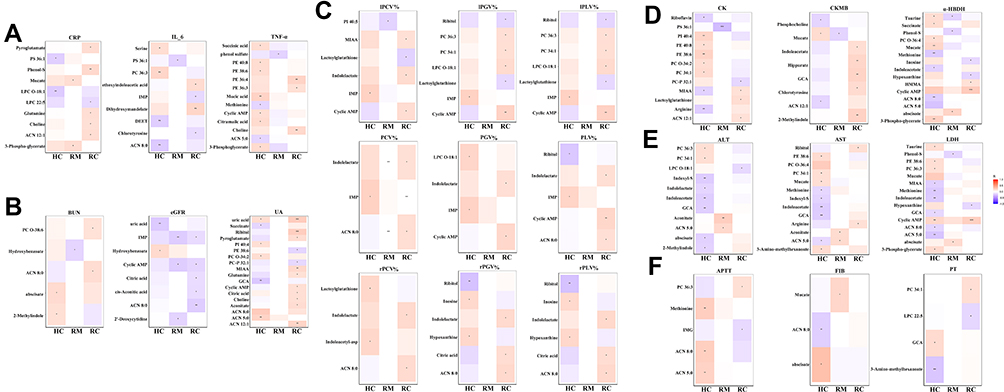 |
Figure 6 Potential correlations between clinical indexes and differential metabolites. Correlation matrix is based on Spearman interactions analysis of the levels of clinical indexes and differential metabolites found in recovered moderate (RM), severe and critical (RC) patients as compared to healthy controls (HC). The color-intensity indicates correlation strength. The red and blue colors signify positive and negative correlations, respectively. The greater the color-intensity, the stronger the correlation. *P <0.05; **P <0.01; ***P <0.001. Figures A-F present the significant potential correlations between differential metabolites and clinical indicators related to inflammation (A), the functions of kidney (B), lung (C), heart (D), liver (E), and coagulation system (F) respectively. |
Inflammatory markers, such as TNF-α, CRP, and IL-6, were closely associated with lipid species of some PE, PC, or organic acids such as succinate, citramalic acid, or ACN, or amino acids, such as serine and methionine in the HCs, but such associations were not found in the recovered COVID-19 patients. Nonetheless, methoxyindoleacetic acid (MIAA), mucate, choline, glutamine, and pyroglutamate were positively associated with CRP, TNF-α, and IL-6 in the recovered patients (Figure 6A).
Potential Correlation Between the Differential Metabolites and Clinical Organ-Function Markers in Recovered COVID-19 Patients
As shown in Figure 6B, the level of kidney function variously showed unique relationships with differential metabolites in the recovered COVID-19 patients. For example, the levels of glutamine, pyroglutamate, ACNs of ACN 8:0, ACN 12:1, organic acids of citric acid, and aconitate were positively correlated with the levels of UA and urea nitrogen (BUN). In addition, IMP, cyclic AMP, ACN 8:0, 2-deoxycytidine, citric acid, and aconitate were negatively correlated with eGFR.
Many unique associations were found between residual lung lesions and differential metabolites in recovered COVID-19 patients but were not observed in HCs. For example, in the RCs, citric acid, cyclic AMP, indolelactate, MIAA, ACN 8:0, and some lipid species (PC, lysophosphatidylcholine [LPC]) were positively correlated with CT findings, while lactoylglutathione and ribitol were negatively correlated with the residual lung lesions in RCs (Figure 6C).
In terms of heart function, many differential metabolites had a strong relationship with the levels of α-HBDH and CK in the HCs, whereas such correlations disappeared in recovered COVID-19 patients. For example, PE, PC, and phosphatidylinositol (PI) were remarkably positively correlated with the level of CK in the HCs, while methionine, arginine, ACN 5:0, ACN 8:0, 3-phospho-glycerate, and succinate were significantly associated with the level of α-HBDH in the HCs. However, the levels of chlorotyrosine, GCA, hippurate, indoleacetic acid (IAA), and 2-methylindole had a unique relationship with the level of CK-MB in the RCs (Figure 6D).
The liver function indicators of ALT, AST, and LDH showed complex relationships with multiple differential metabolites, especially in HCs (Figure 6E). For example, the lipid species (PE, PC), indole and its derivatives (indoxyl sulfate [indoxyl-s], indolelactate, IAA, MIAA, and 2-methylindole), bile acids (GCA), and amino acids (methionine, taurine) were remarkably related to the levels of ALT, AST, or LDH in the HCs, while no such associations were found in RMs and RCs. However, cyclic AMP, arginine, ribitol, and aconitate were positively correlated with ALT, AST, or LDH levels in RCs and RMs. Importantly, in recovered patients, especially in RCs, cyclic AMP had significant positive correlations with four clinical organ-function markers (kidney, lung, heart, and liver) at the same time (Figure 6B–E).
Potential correlations between coagulation function and differential metabolites in the HCs and recovered patients are shown in Figure 6F. Metabolites, such as 3-amino-methyl hexanoate, abscisate, GCA, ACN 8:0, ACN 5:0, and methionine were found to be significantly related with PT, APTT, or FIB only in HCs, while indolylmethyl glucosinolate (IMG), three lipid species had significant potential correlations only in RMs or RCs, but not in HCs.
Metabolites, as the downstream products of genes and proteins, are implicated in a wide array of biological processes and play key roles in the homeostasis of biological systems.30 PCs, ACNs, bile acids, and amino acids are important biomolecules that are involved in the regulation of energy metabolism, inflammation, cell proliferation, invasion, and apoptosis, and disordered metabolism has been reported in many diseases.28,31,32 Consistently, these metabolites had close relationships with clinical markers of organ function, coagulation, and inflammation in the HCs, indicating that they play pivotal roles during these physiological processes. However, these relationships were not observed in the recovered COVID-19 patients, suggesting that the status of these recovered COVID-19 patients may not be restored to the level of the HCs, even though their clinical indicators were in the normal range.
Disordered Metabolic Pathways in Recovered COVID-19 Patients without Previous Underlying Diseases 3 Months After Discharge
As shown in Figure 7, the differential metabolites between HCs and recovered patients (RMs and RCs) were mainly related to the pathways of glycerophospholipid and fatty acid metabolism, purine metabolism, TCA cycle, bile acid metabolism, phenylalanine, tyrosine, and tryptophan metabolism. Notably, the UA level was lower in the RCs at admission, whereas it was higher in the RCs 3 months post-discharge than in HCs (Table 1). UA, a purine derivative, is the final oxidation product of purine metabolism. Interestingly, we found that many metabolites, such as inosine, hypoxanthine, guanine, and cyclic AMP, in the purine metabolism were decreased in the recovered COVID-19 patients (Figure 7). Correlation analysis revealed that the increased level of UA was obviously correlated with the levels of citric acid, aconitate, amino acids of pyroglutamate, glutamine, ACN 12:1, MIAA, and cyclic AMP (Figure 6B). This suggests that a potentially metabolic-related new injury may be present in recovered patients.
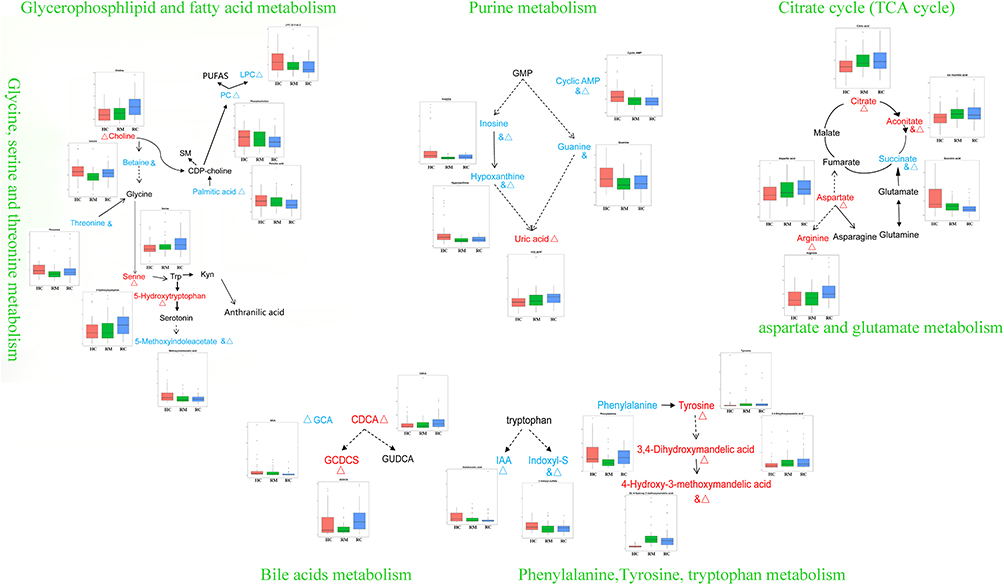 |
Figure 7 Main disordered metabolic pathways in RMs and RCs when compared with HCs 3 months after discharge. &, Δ the metabolite was obviously altered in the RMs and RCs when compared with HCs (RM vs HC with P <0.05 and FDR <0.2: &; RC vs HC with P <0.05 and FDR <0.2: Δ), respectively. The color of red and blue for metabolites illustrated that the metabolite was increased or decreased in RMs and/or RCs when compared with HCs, respectively. Abbreviations: PUFAS, polyunsaturated fatty acids; LPC, lysophosphatidylcholine; PC, phosphatidylcholine; SM, sphingomyelin; GMP, guanosine 5’-monophosphate; Cyclic AMP, cyclic adenosine monophosphate; GCA, glycocholic acid; CDCA, chenodeoxycholic acid; GCDCS, glycochenodeoxycholate-3-sulfate; GUDCA, glycoursodeoxycholic acid; IAA, indoleacetic acid; Indoxyl-S, 3-indoxyl sulfate. |
Discussion
Changes in biochemical and inflammatory indicators and chest CT abnormalities were frequently found in COVID-19 patients with moderate or severe illness during the acute phase, but not usually in asymptomatic patients.32 In our study, clinical examinations and inflammatory cytokines (IL-6 and TNF-α) suggested that RAs recovered well, but RMs and RCs still had abnormalities in clinical markers and CT findings 3 months after discharge as compared with HCs. In particular, TNF-α levels were still abnormally elevated in RMs and RCs. These clinical results indicated that there was a significant difference in the recovery state of RAs, RMs, and RCs when compared with HCs.
Plasma metabolite profiles in RAs, RMs, RCs, and HCs showed that the plasma metabolome in RAs was similar to that in HCs, indicating that RAs may have no difference with HCs in body metabolism. However, in the RMs and RCs, the metabolic disorders mainly implicated amino acids, indoles and its derivatives, bile acids, organic acids, and lipids of PC and PE, among others (Figure 5, Table S1). Previous studies revealed that COVID-19 patients during the infection period had metabolic abnormalities in TCA cycle, purine and lipid metabolism.11–14,19 In our study, we found that these pathways remained disturbed in the recovered COVID-19 patients 3 months after discharge when compared with HCs, especially in the RCs, which suggests that metabolic abnormalities in COVID-19 patients failed to fully return to normal levels even 3 months after discharge from the hospital.
Our results provided evidence to support the recent findings that abnormal tryptophan metabolism in COVID-19 patients.15,17,18 Importantly, bacterial breakdown products of tryptophan, such as indole, indoleacetamide, and methyl-3-indole-acetate have been reported to be significantly reduced in critically ill patients.16 In our study, the metabolic disorders in convalescent phase of severe/critical COVID-19 patients also involved microbial metabolism, such as decreased indole derivatives of IAA, indolelactate, abnormal bile acids of GCA, Glycochenodeoxycholate-3-sulfate (GCDCS), chenodeoxycholic acid (CDCA) (Figures 5A and 7). Intestinal microbiota in patients with active SARS-CoV-2 gastrointestinal infection is characterized by the enrichment of opportunistic pathogens, loss of salutary bacteria, and increased functional capacity for related metabolite metabolism.33,34 Consistently, our study suggested that the SARS-CoV-2 may upset the balance of intestinal flora metabolism, and further aggravate abnormal metabolism in the recovered COVID-19 patients. Indole and indole derivatives are produced from tryptophan by bacteria in the colonic lumen. Microbiota-derived indoles and metabolites are involved in mucosal integrity and protection from inflammation. IAA, a tryptophan catabolite, is known to affect intestinal permeability and host immunity.35 Reduced tryptophan-related indole derivatives are indicative of the loss of gut microbiota homeostasis. Primary bile acids are mainly produced in the liver and further metabolized by the gut microbiota,36,37 and its metabolism by bacteria plays an important role in the maintenance of the intestinal barrier.38 The disordered metabolism of bile acids in recovered COVID-19 patients might suggest that the intestinal barrier has not been fully repaired. In summary, the abnormal intestinal flora metabolism prompted us to pay more attention to the nutritional status of COVID-19 patients and restore the metabolic balance of gut microbiota in order to promote the recovery of the patients.
The lungs are one of the most attacked organs during SARS-CoV-2 infection, and many COVID-19 patients present with pulmonary lesions on CT. In our study, we found that the CT findings of RMs and RCs were still different from those of HCs, such as greater PLV, PGV, and PCV. Our analysis revealed that the levels of many altered metabolites were uniquely associated with the levels of PLV, PGV, and PCV. For example, in the RCs, these metabolites included indolelactate, cyclic AMP, ACN 8:0, citric acid, lactoylglutathione, and ribitol (Figure 6C). Cell wall ribitol polymers from gram positive organisms can mediate inflammation and cause dysfunction of pulmonary endothelial cells.39 In our study, ribitol levels were found to be increased in RCs, which indicated that lung inflammation may still exist in these recovered COVID-19 patients. Citric acid can induce substantial airway constriction and increase airway responsiveness.40 The upregulated citric acid in both RMs and RCs indicated that the patients’ airways were still very sensitive. Cyclic AMP is an important signalling molecule, but is decreased in both RMs and RCs. Cyclic AMP has been reported to protect against airway inflammation and relieve pulmonary oedema,41,42 which suggests that airway inflammation in recovered patients may be in an unbalanced state. The disorders of lung-function-related metabolites demonstrated that SARS-CoV-2 infection exerted a long-term effect on the lungs. Although the recovered COVID-19 patients may present no symptoms subjectively, it is imperative for them to monitor their lung function regularly and identify any abnormalities in time.
We also found that the levels of some clinical indices related to liver (ALP) and renal function (creatinine and UA) in the recovered COVID-19 patients were still different from those in the HCs or their levels at admission. Surprisingly, the levels of many differential metabolites, including lipid species of PE, PC, indoles, bile acids, and amino acids, had a strong relationship with the levels of ALP, AST, LDH, and α-HBDH in the HCs, whereas no such associations were observed in the recovered COVID-19 patients (Figure 6D and E). PCs, bile acids, and amino acids are important biomolecules that play vital roles in cell proliferation, invasion, apoptosis, and inflammation, and their abnormal metabolism has been reported to be related to many diseases.28,31,43 Liver is one of the major organs that metabolize amino acids, PCs and bile acids. Consistently, our data illustrated that these metabolites were closely related to the functions of the liver and heart which may help maintain biological homeostasis in the HCs, but these significant correlations were not found in recovered patients. Dysregulation of these metabolites has been reported in many liver- and heart-related diseases.28,44 The elevation of bile acid derivatives, such as CDCA and GCDCS, in the plasma of recovered patients, compared with HCs, may indicate impaired hepatic detoxification function and injury of biliary ducts.45 Analysis of metabolomic data revealed that serum lipid levels were reduced in COVID-19 patients during.13,19 In our study, various lipids were still downregulated in the recovered patients. Thus, these findings suggest that metabolic homeostasis of the liver may not be fully restored in patients with recovered COVID-19.
Kidney injury is a common complication of COVID-1946 and leads to the accumulation of metabolites that are toxic to other systems. Our study showed that many altered metabolites showed unique associations with the indicators of renal function in the recovered COVID-19 patients, such as the significant relationships between the level of citric acid and aconitate, and the level of clinical markers of UA and eGFR (Figure 6B). Citric acid and aconitate can directly enter the TCA cycle for energy production in the mitochondria. Previous studies have reported that the metabolism of the TCA cycle in COVID-19 patients is disrupted.11,12,17 The disrupted TCA cycle has also been observed in chronic and diabetic kidney diseases, which may be caused by mitochondrial dysfunction.47,48 In this study, the abnormally elevated levels of citric acid and aconitate in recovered COVID-19 patients suggested the existence of occult kidney injury caused by mitochondrial dysfunction. Furthermore, both clinical tests and metabolomic analyses showed that UA levels were higher in RCs than in HCs. However, we found that in recovered COVID-19 patients, many metabolites in purine metabolism (such as inosine, hypoxanthine, guanine, and cyclic AMP) were reduced (Figure 7). Therefore, we speculate that xanthine oxidase (an enzyme that produces UA) may be highly expressed, or renal excretion is impaired in RC patients. UA is a uremic toxin identified by the European Uremic Toxin Working Group;49 thus, in the future, the discharged COVID-19 patients should be tested for renal function markers on a regular basis.
Other organs may also be affected in patients who recovered from COVID-19. Taurine is an essential sulphur-containing semi-essential amino acid which plays a crucial physiological role.50 In cardiovascular diseases, taurine can not only lower blood pressure and improve vascular function in prehypertensive status,51 but also reduce the potential of atherogenesis in animal models.52,53 Cardiomyocyte atrophy and cardiac dysfunction were reportedly caused by taurine depletion.54 Moreover, taurine depletion can lead to pancreatic β-cell malfunction, which may reduce plasma insulin levels.55 In our study, taurine was reduced in the recovered COVID-19 patients, which has also been validated in our another cohort study (another five representative metabolites [arginine, indoleacetic acid, uric acid, pyroglutamic acid and PE 40:8] also have been validated)20 (Supplementary Figure 2). The relationship between taurine and α-HBDH was reversed from a positive correlation in the HCs to a negative one in the RMs (Figure 6D), indicating that the cardiovascular function might be affected by the abnormally reduced taurine in recovered COVID-19 patients.
COVID-19 is characterised by the excessive production of pro-inflammatory cytokines associated with adverse clinical outcomes.56 TNF-α, which was reported to be abnormally elevated in COVID-19 patients, was still significantly higher in RMs and RCs in our study (Figure 3). Moreover, we found that both CRP and TNF-α were positively correlated with choline in RCs, and the latter was also elevated. Choline is an essential nutrient that is required for many important physiological functions, including methyl group metabolism, structural integrity, and cell signalling.57,58 Elevated concentration of plasma choline has been reported to be associated with cardiometabolic risk factors and history of cardiovascular disease in elderly subjects.59 Additionally, Metabolic alterations in choline are related to a higher risk of type 2 diabetes due to impaired insulin sensitivity.60 Therefore, elevated TNF-α and choline levels and their significant correlations in RCs prompted us to hypothesise that the residual impacts of SARS-CoV-2 infection may persist in recovered patients, especially in severely ill patients.
Although our study attempts to fully understand the changes in the laboratory, chest CT findings, and plasma metabolome of COVID-19 patients who have been discharged from the hospital for 3 months and have no previous underlying diseases, some limitations need to be addressed. First, although potential correlation between differential metabolites and clinical parameters were founded, the involved mechanism remains unclear. Future experiment involving mechanism will be needed. Second, metabolite profiles were analysed in the plasma, but not in the organs or tissues of recovered COVID-19 patients. Thus, it is not possible to determine the exact metabolic changes in each organ. Further studies in vivo will be needed to confirm their interpretation of organ specific long-term effects. Third, we did not perform metabolome analysis in these patients during hospitalisation to elucidate plasma metabolites associated with the recovery phase; further investigation from a longitudinal cohort is needed. Fourth, our results were based on a single cohort of discharged COVID-19 patients in China, and future studies in different racial, ethnic, and geographical cohorts will be indispensable for extending our current understanding of metabolic dysregulation in recovered COVID-19 patients.
Conclusion
In summary, our work highlighted that the plasma metabolome, inflammation, and clinical indicators of recovered COVID-19 patients with moderate and severe or critical illness 3 months after discharge are still distinct from HCs, but not in RAs. Pathway analysis revealed that these alterations in RMs and RCs mainly involved the metabolic pathways of the TCA cycle, purines, indoles, phospholipids, taurine, and phenylalanine metabolism. Importantly, we uncovered metabolite clusters that were pathologically relevant to organ recovery in COVID-19 patients that warrant further mechanistic pursuits and follow-up.
Data Sharing Statement
The datasets analyzed during the current study available from the corresponding author on reasonable request.
Acknowledgment
The authors are grateful to all the patients, individuals and investigators who participated in this study. The authors also would like to thank Wuhan Anachro Technologies Inc. for their supports in metabolomics, and Wuhan YITU Company for their kind help in artificial intelligence interpretation of CT images.
Author Contributions
All authors contributed to the acquisition of data, data analysis and interpretation, drafting and revising the article, have agreed on the journal to which the article will be submitted, gave final approval of the version to be published, and agree to be accountable for all aspects of the work.
Funding
This work was supported by the National Natural Science Foundation of China [82041018, 81802113]; Major Projects of the National Science and Technology [2019ZX09301001]; Ministry of Science and Technology of the People’s Republic of China [2020YFC0844300]; the Natural Science Foundation of Hubei Province, China [2020CFB809] and the Fundamental Research Funds for the Central Universities, HUST [2020kfyXGYJ011]. The research sponsors were not involved in research design, data collection, analysis, or interpretation. They did not participate in the writing of the manuscript, nor did they participate in the decision to submit the manuscript.
Disclosure
The authors declare there is no conflict of interest or financial relationships to disclose.
References
1. WHO. Coronavirus disease (COVID-19) dashboard; 2021. Available from: https://covid19.who.int.
2. Fang Y, Zhou J, Ding X, Ling G, Yu S. Pulmonary fibrosis in critical ill patients recovered from COVID-19 pneumonia: preliminary experience. Am J Emerg Med. 2020;38(10):2134–2138. doi:10.1016/j.ajem.2020.05.120
3. Puntmann VO, Carerj ML, Wieters I, et al. Outcomes of cardiovascular magnetic resonance imaging in patients recently recovered from Coronavirus Disease 2019 (COVID-19). JAMA Cardiol. 2020;5(11):1265–1273. doi:10.1001/jamacardio.2020.3557
4. Huang L, Zhao P, Tang D, et al. Cardiac involvement in patients recovered from COVID-2019 identified using magnetic resonance imaging. JACC Cardiovasc Imaging. 2020;13(11):2330–2339. doi:10.1016/j.jcmg.2020.05.004
5. Li J, Long X, Zhu C, et al. Olfactory dysfunction in recovered Coronavirus Disease 2019 (COVID-19) patients. Mov Disord. 2020;35(7):1100–1101. doi:10.1002/mds.28172
6. Wu Q, Zhou L, Sun X, et al. Altered lipid metabolism in recovered SARS patients twelve years after infection. Sci Rep. 2017;7(1):9110. doi:10.1038/s41598-017-09536-z
7. Banoei MM, Vogel HJ, Weljie AM, et al. Plasma metabolomics for the diagnosis and prognosis of H1N1 influenza pneumonia. Critical Care. 2017;21(1):97. doi:10.1186/s13054-017-1672-7
8. Fujiogi M, Camargo CA
9. Eisfeld AJ, Halfmann PJ, Wendler JP, et al. Multi-platform ‘omics analysis of human Ebola virus disease pathogenesis. Cell Host Microbe. 2017;22(6):817–829.e818. doi:10.1016/j.chom.2017.10.011
10. Cui L, Pang J, Lee YH, et al. Serum metabolome changes in adult patients with severe dengue in the critical and recovery phases of dengue infection. PLoS Negl Trop Dis. 2018;12(1):e0006217. doi:10.1371/journal.pntd.0006217
11. Song JW, Lam SM, Fan X, et al. Omics-driven systems interrogation of metabolic dysregulation in COVID-19 pathogenesis. Cell Metab. 2020;32(2):188–202.e185. doi:10.1016/j.cmet.2020.06.016
12. Wu D, Shu T, Yang X, et al. Plasma metabolomic and lipidomic alterations associated with COVID-19. Nat Sci Rev. 2020;7:7. doi:10.1093/nsr/nwaa086
13. Shen B, Yi X, Sun Y, et al. Proteomic and metabolomic characterization of COVID-19 patient sera. Cell. 2020;182(1):59–72.e15. doi:10.1016/j.cell.2020.05.032
14. Shi D, Yan R, Lv L, et al. The serum metabolome of COVID-19 patients is distinctive and predictive. Metabolism. 2021;118:154739. doi:10.1016/j.metabol.2021.154739
15. Marín-Corral J, Rodríguez-Morató J, Gomez-Gomez A, et al. Metabolic signatures associated with severity in hospitalized COVID-19 patients. Int J Mol Sci. 2021;22(9):4794. doi:10.3390/ijms22094794
16. Danlos FX, Grajeda-Iglesias C, Durand S, et al. Metabolomic analyses of COVID-19 patients unravel stage-dependent and prognostic biomarkers. Cell Death Dis. 2021;12(3):258. doi:10.1038/s41419-021-03540-y
17. Barberis E, Timo S, Amede E, et al. Large-scale plasma analysis revealed new mechanisms and molecules associated with the host response to SARS-CoV-2. Int J Mol Sci. 2020;21(22):8623. doi:10.3390/ijms21228623
18. Wu J, Zhao M, Li C, Zhang Y, Wang DW. The SARS-CoV-2 induced targeted amino acid profiling in patients at hospitalized and convalescent stage. Biosci Rep. 2021;41(3):BSR20204201. doi:10.1042/BSR20204201
19. Acosta-Ampudia Y, Monsalve DM, Rojas M, et al. COVID-19 convalescent plasma composition and immunological effects in severe patients. J Autoimmun. 2021;118:102598. doi:10.1016/j.jaut.2021.102598
20. Xu J, Zhou M, Luo P, et al. Plasma metabolomic profiling of patients recovered from COVID-19 with pulmonary sequelae 3 months after discharge. Clin Infect Dis. 2021:ciab147. doi:10.1093/cid/ciab147
21. Levey AS, Stevens LA, Schmid CH, et al. A new equation to estimate glomerular filtration rate. Ann Intern Med. 2009;150(9):604–612. doi:10.7326/0003-4819-150-9-200905050-00006
22. Hansell DM, Bankier AA, MacMahon H, McLoud TC, Müller NL, Remy J. Fleischner society: glossary of terms for thoracic imaging. Radiology. 2008;246(3):697–722. doi:10.1148/radiol.2462070712
23. Shi H, Han X, Jiang N, et al. Radiological findings from 81 patients with COVID-19 pneumonia in Wuhan, China: a descriptive study. Lancet Infect Dis. 2020;20(4):425–434. doi:10.1016/S1473-3099(20)30086-4
24. Liu F, Zhang Q, Huang C, et al. CT quantification of pneumonia lesions in early days predicts progression to severe illness in a cohort of COVID-19 patients. Theranostics. 2020;10(12):5613–5622. doi:10.7150/thno.45985
25. Smilde AK, van der Werf MJ, Bijlsma S, van der Werff-van der Vat BJC, Jellema RH. Fusion of mass spectrometry-based metabolomics data. Anal Chem. 2005;77(20):6729–6736. doi:10.1021/ac051080y
26. Kamleh MA, Ebbels TM, Spagou K, Masson P, Want EJ. Optimizing the use of quality control samples for signal drift correction in large-scale urine metabolic profiling studies. Anal Chem. 2012;84(6):2670–2677. doi:10.1021/ac202733q
27. Luo P, Yin P, Zhang W, et al. Optimization of large-scale pseudotargeted metabolomics method based on liquid chromatography-mass spectrometry. J Chromatogr A. 2016;1437:127–136. doi:10.1016/j.chroma.2016.01.078
28. Luo P, Yin P, Hua R, et al. A large-scale, multicenter serum metabolite biomarker identification study for the early detection of hepatocellular carcinoma. Hepatology. 2018;67(2):662–675. doi:10.1002/hep.29561
29. Luo P, Mao K, Xu J, et al. Metabolic characteristics of large and small extracellular vesicles from pleural effusion reveal biomarker candidates for the diagnosis of tuberculosis and malignancy. J Extracell Vesicles. 2020;9(1):1790158. doi:10.1080/20013078.2020.1790158
30. Ayres JS. A metabolic handbook for the COVID-19 pandemic. Nat Metab. 2020;2(7):572–585. doi:10.1038/s42255-020-0237-2
31. Maddocks OD, Berkers CR, Mason SM, et al. Serine starvation induces stress and p53-dependent metabolic remodelling in cancer cells. Nature. 2013;493(7433):542–546. doi:10.1038/nature11743
32. Long QX, Tang XJ, Shi QL, et al. Clinical and immunological assessment of asymptomatic SARS-CoV-2 infections. Nat Med. 2020;26(8):1200–1204. doi:10.1038/s41591-020-0965-6
33. Gu S, Chen Y, Wu Z, et al. Alterations of the gut microbiota in patients with coronavirus disease 2019 or H1N1 influenza. Clin Infect Dis. 2020;71(10):2669–2678. doi:10.1093/cid/ciaa709
34. Zuo T, Liu Q, Zhang F, et al. Depicting SARS-CoV-2 faecal viral activity in association with gut microbiota composition in patients with COVID-19. Gut. 2021;70(2):276–284.
35. Agus A, Planchais J, Sokol H. Gut microbiota regulation of tryptophan metabolism in health and disease. Cell Host Microbe. 2018;23(6):716–724. doi:10.1016/j.chom.2018.05.003
36. Ridlon JM, Harris SC, Bhowmik S, Kang DJ, Hylemon PB. Consequences of bile salt biotransformations by intestinal bacteria. Gut Microbes. 2016;7(1):22–39. doi:10.1080/19490976.2015.1127483
37. Wahlström A, Sayin SI, Marschall HU, Bäckhed F. Intestinal crosstalk between bile acids and microbiota and its impact on host metabolism. Cell Metab. 2016;24(1):41–50. doi:10.1016/j.cmet.2016.05.005
38. Thomas C, Pellicciari R, Pruzanski M, Auwerx J, Schoonjans K. Targeting bile-acid signalling for metabolic diseases. Nat Rev Drug Discov. 2008;7(8):678–693. doi:10.1038/nrd2619
39. Pai AB, Patel H, Prokopienko AJ, et al. Lipoteichoic acid from Staphylococcus aureus induces lung endothelial cell barrier dysfunction: role of reactive oxygen and nitrogen species. PLoS One. 2012;7(11):e49209. doi:10.1371/journal.pone.0049209
40. Lai YL, Chiou WY, Lu FJ, Chiang LY. Roles of oxygen radicals and elastase in citric acid-induced airway constriction of guinea-pigs. Br J Pharmacol. 1999;126(3):778–784. doi:10.1038/sj.bjp.0702352
41. Chen YF, Huang G, Wang YM, et al. Exchange protein directly activated by cAMP (Epac) protects against airway inflammation and airway remodeling in asthmatic mice. Respir Res. 2019;20(1):285. doi:10.1186/s12931-019-1260-2
42. Wang M, Guo X, Zhao H, Lv J, Wang H, An Y. Adenosine A(2B) receptor activation stimulates alveolar fluid clearance through alveolar epithelial sodium channel via cAMP pathway in endotoxin-induced lung injury. Am J Physiol Lung Cell Mol Physiol. 2020;318(4):L787–Ll800. doi:10.1152/ajplung.00195.2019
43. Xicoy H, Wieringa B, Martens GJM. The role of lipids in parkinson’s disease. Cells. 2019;8(1):27. doi:10.3390/cells8010027
44. Cheng ML, Wang CH, Shiao MS, et al. Metabolic disturbances identified in plasma are associated with outcomes in patients with heart failure: diagnostic and prognostic value of metabolomics. J Am Coll Cardiol. 2015;65(15):1509–1520. doi:10.1016/j.jacc.2015.02.018
45. Rowland A, Miners JO, Mackenzie PI. The UDP-glucuronosyltransferases: their role in drug metabolism and detoxification. Int J Biochem Cell Biol. 2013;45(6):1121–1132. doi:10.1016/j.biocel.2013.02.019
46. Gabarre P, Dumas G, Dupont T, Darmon M, Azoulay E, Zafrani L. Acute kidney injury in critically ill patients with COVID-19. Intensive Care Med. 2020;46(7):1339–1348. doi:10.1007/s00134-020-06153-9
47. Hallan S, Afkarian M, Zelnick LR, et al. Metabolomics and gene expression analysis reveal down-regulation of the Citric Acid (TCA) cycle in non-diabetic CKD patients. EBioMedicine. 2017;26:68–77. doi:10.1016/j.ebiom.2017.10.027
48. Tan SM, Ziemann M, Thallas-Bonke V, et al. Complement C5a induces renal injury in diabetic kidney disease by disrupting mitochondrial metabolic agility. Diabetes. 2020;69(1):83–98. doi:10.2337/db19-0043
49. Duranton F, Cohen G, De Smet R, et al. Normal and pathologic concentrations of uremic toxins. J Am Soc Nephrol. 2012;23(7):1258–1270. doi:10.1681/ASN.2011121175
50. Jakaria M, Azam S, Haque ME, et al. Taurine and its analogs in neurological disorders: focus on therapeutic potential and molecular mechanisms. Redox Biol. 2019;24:101223. doi:10.1016/j.redox.2019.101223
51. Sun Q, Wang B, Li Y, et al. Taurine supplementation lowers blood pressure and improves vascular function in prehypertension: randomized, Double-Blind, Placebo-Controlled Study. Hypertension. 2016;67(3):541–549. doi:10.1161/HYPERTENSIONAHA.115.06624
52. Murakami S, Sakurai T, Toda Y, Morito A, Sakono M, Fukuda N. Prevention of neointima formation by taurine ingestion after carotid balloon injury. Vascul Pharmacol. 2010;53(3–4):177–184. doi:10.1016/j.vph.2010.07.003
53. Zulli A, Lau E, Wijaya BP, et al. High dietary taurine reduces apoptosis and atherosclerosis in the left main coronary artery: association with reduced CCAAT/enhancer binding protein homologous protein and total plasma homocysteine but not lipidemia. Hypertension. 2009;53(6):1017–1022. doi:10.1161/HYPERTENSIONAHA.109.129924
54. Ito T, Kimura Y, Uozumi Y, et al. Taurine depletion caused by knocking out the taurine transporter gene leads to cardiomyopathy with cardiac atrophy. J Mol Cell Cardiol. 2008;44(5):927–937. doi:10.1016/j.yjmcc.2008.03.001
55. L’Amoreaux WJ, Cuttitta C, Santora A, Blaize JF, Tachjadi J, El Idrissi A. Taurine regulates insulin release from pancreatic beta cell lines. J Biomed Sci. 2010;17 Suppl 1(Suppl1):S11. doi:10.1186/1423-0127-17-S1-S11
56. Lucas C, Wong P, Klein J, et al. Longitudinal analyses reveal immunological misfiring in severe COVID-19. Nature. 2020;584(7821):463–469. doi:10.1038/s41586-020-2588-y
57. Zeisel SH. Choline: an essential nutrient for humans. Nutrition. 2000;16(7–8):669–671. doi:10.1016/S0899-9007(00)00349-X
58. Zeisel SH, Blusztajn JK. Choline and human nutrition. Annu Rev Nutr. 1994;14:269–296. doi:10.1146/annurev.nu.14.070194.001413
59. Roe AJ, Zhang S, Bhadelia RA, et al. Choline and its metabolites are differently associated with cardiometabolic risk factors, history of cardiovascular disease, and MRI-documented cerebrovascular disease in older adults. Am J Clin Nutr. 2017;105(6):1283–1290.
60. Floegel A, Stefan N, Yu Z, et al. Identification of serum metabolites associated with risk of type 2 diabetes using a targeted metabolomic approach. Diabetes. 2013;62(2):639–648. doi:10.2337/db12-0495
 © 2021 The Author(s). This work is published and licensed by Dove Medical Press Limited. The full terms of this license are available at https://www.dovepress.com/terms.php and incorporate the Creative Commons Attribution - Non Commercial (unported, v3.0) License.
By accessing the work you hereby accept the Terms. Non-commercial uses of the work are permitted without any further permission from Dove Medical Press Limited, provided the work is properly attributed. For permission for commercial use of this work, please see paragraphs 4.2 and 5 of our Terms.
© 2021 The Author(s). This work is published and licensed by Dove Medical Press Limited. The full terms of this license are available at https://www.dovepress.com/terms.php and incorporate the Creative Commons Attribution - Non Commercial (unported, v3.0) License.
By accessing the work you hereby accept the Terms. Non-commercial uses of the work are permitted without any further permission from Dove Medical Press Limited, provided the work is properly attributed. For permission for commercial use of this work, please see paragraphs 4.2 and 5 of our Terms.