")
Back to Journals » International Journal of General Medicine » Volume 14
Plasma Levels of Homocysteine is Associated with Liver Fibrosis in Health Check-Up Population
Authors Lv D , Wang Z, Ji S, Wang X, Hou H
Received 22 July 2021
Accepted for publication 24 August 2021
Published 3 September 2021 Volume 2021:14 Pages 5175—5181
DOI https://doi.org/10.2147/IJGM.S329863
Checked for plagiarism Yes
Review by Single anonymous peer review
Peer reviewer comments 2
Editor who approved publication: Dr Scott Fraser
Dan Lv,1 Zepu Wang,2 Shuai Ji,1 Xiaoxi Wang,1 Huiqing Hou1
1Physical Examination Center, Hebei General Hospital, Shijiazhuang City, Hebei Province, People’s Republic of China; 2Department of Hepatobiliary Surgery, Hebei General Hospital, Shijiazhuang City, Hebei Province, People’s Republic of China
Correspondence: Dan Lv
Physical Examination Center, Hebei General Hospital, Shijiazhuang City, Hebei Province, People’s Republic of China
Email [email protected]
Object: Studies have shown a link between homocysteine (Hcy) and heart diseases, kidney diseases, cerebrovascular diseases, liver diseases, and other pathological conditions. However, the relationship between Hcy and liver fibrosis (LF) is unclear. Here, we studied the link between plasma Hcy concentration and LF.
Methods: We determined and recorded the plasma Hcy concentration, general biochemical parameters, and liver stiffness measurement (LSM) in 1582 subjects, followed by statistical data analyses.
Results: During different stages of LF, we found a considerable difference (p < 0.001 unless specified) in body mass index (BMI), sex, age, Hcy, the levels of alanine transaminase (ALT), gamma-glutamyl transpeptidase (GGT; P = 0.012), triglycerides (TG; P = 0.006), low-density lipoprotein cholesterol (LDL-C), fasting blood glucose (FBS), and platelet count (PLT). There was a strong association between the plasma Hcy concentration and the serum biomarkers of LF (P < 0.001) and the values of LSM (P < 0.001).
Conclusion: The plasma Hcy concentration was substantially different among different stages of LF. The higher the plasma Hcy concentration, the more evident was the degree of LF.
Keywords: liver fibrosis, homocysteine, FibroScan
Introduction
Homocysteine (Hcy), a metabolic by-product of methionine, is an essential amino acid derived from dietary protein.1 High levels of Hcy or hyperhomocysteinemia (HHcy) increases the risk of heart and vascular diseases,2 as well as other pathological conditions, such as encephalopathy, kidney disease, and liver disease.3,4 Previous studies have shown that Hcy results in increased collagen synthesis and deposition in animal hearts, kidneys, and carotid arteries.5–7 Additionally, in vitro studies revealed that Hcy induced liver fibrosis (LF) by stimulating tissue inhibitor of metalloproteinase-1 (TIMP-1) and procollagen I expression in Ito cells.8 Therefore, we hypothesized that Hcy levels and LF development were correlated.
LF is a pathological process that facilitates the advancement of chronic liver diseases into liver cirrhosis. The degree of LF is a major predictor of outcome and prognosis in chronic liver diseases. The large-scale clinical applicability of liver biopsy for LF analysis has been limited by its invasive nature, sampling errors, potentially life-threatening complications, and observer variability. LF is commonly diagnosed using transient elastography (TE, FibroScan®), a noninvasive procedure to record liver stiffness measurement (LSM). It is a simple, safe, fast, easy to operate, repeatable, and tolerable method of diagnosis.9,10
Here, we studied the association between Hcy and LF in people undergoing health check-ups by analyzing the plasma Hcy concentration and LSM.
Methods
Subjects
This study was initiated in October 2019 and was sanctioned by the ethics committee of the Hebei General Hospital and followed the guidelines of the principles of the Declaration of Helsinki 1975. All subjects have been informed and signed informed consent. Subjects who underwent LSM using FibroScan at the Hebei General hospital between August 2017 to July 2019 were selected. The inclusion criteria of this retrospective study involved (1) age ≥ 18 y; (2) complete medical history, including age, BMI, gender, no history of liver disease, no history of drinking, complete biochemical indicators. The exclusion criteria involved (1) pregnancy; (2) autoimmune hepatitis, viral hepatitis, primary biliary cirrhosis, sclerosis cholangitis or other chronic liver diseases; (3) chronic kidney disease, severe cardiovascular disease, hematological disease; (4) hepatic encephalopathy, ascites, portal hypertension, spontaneous bacterial peritonitis, or hepatocellular carcinoma; (5) alcohol consumption >70 g/week and >140 g/week for women and men, respectively; (6) consumption of drugs affecting liver function currently or within the last 6 months. All operators were blinded to the personal information of the study objects.
Laboratory Data
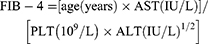
All blood specimens were harvested from the antecubital vein after 8–12 hours of fasting in the morning, and the laboratory tests were performed within 2 hours of collection. We used an automatic biochemical analyzer to determine Hcy, aspartate aminotransferase (AST), alanine transaminase (ALT), triglyceride (TG), gamma-glutamyl transpeptidase (GGT), low-density lipoprotein cholesterol (LDL-C), total cholesterol (TC), total bilirubin (TBil), high-density lipoprotein cholesterol (HDL-C), and fasting blood glucose (FBS). The platelet count (PLT) was detected using the automatic blood analyzer. The fibrosis index based on four factors (FIB-4) and the Aspartate aminotransferase-to-platelet ratio index (APRI) were determined using the following formula:11,12

Liver Stiffness Measurement (LSM)
LSM was conducted by experienced technicians (> 500 tests) utilizing FibroScan following the manufacturer’s guidelines. The detection area included the region enclosed by the horizontal line of the xiphoid process, the lower edge of the ribs, and the right axillary line. The subject was placed in the supine state with the right arm stretched outward, and the LSM was recorded on the right lobe of the liver through the ICS. LSM was done first with the M probe (standard probe), and if unsuccessful, such as in the case of obesity, the XL probe was used. Reliable measurements involved 10 successful acquisitions with the interquartile range-to-median ratio of < 30% for the 10 acquisitions. The measurements were denoted in kPa, and each LSM was the median of 10 approved recordings.13 Based on previous studies, the LSM values were divided into five groups: F0 (LSM < 6.1 kPa), F1 (6.1 kPa ≤ LSM < 8.2 kPa), F2 (8.2 kPa ≤ LSM < 9.7 kPa), F3 (9.7 kPa ≤ LSM < 13.6 kPa), and F4 (LSM ≥ 13.6 kPa).14–16
Statistical Analysis
SPSS 21.0 (IBM SPSS Statistics 21) was used for data analyses and shown as the mean ± standard deviation. Multi-group comparison was done using ANOVA, and the further comparison between two groups was done using the SNK test. The counting data were represented as the rate (%) and tested using the χ2 test. The Spearman correlation test was performed for correlation analysis. The best-fitting model was identified using multiple linear regression analysis to assess LF. A P-value of less than 0.05 denoted the statistically significant difference.
Results
Basic Characteristics and Laboratory Data of the Study Population
This study included 1582 subjects (male: 1247 and female: 335). Table 1 presents and compares the basic demographic features and laboratory data of all five groups (F0-F4). We observed a substantial difference (P < 0.001 unless specified) between gender, age, BMI, and the values of Hcy, ALT, GGT (P = 0.012), TG (P = 0.006), LDL-C, FBS, and PLT among these five groups. Further comparison between two groups showed there is significant difference in Hcy between any other two groups except F3 and F4.
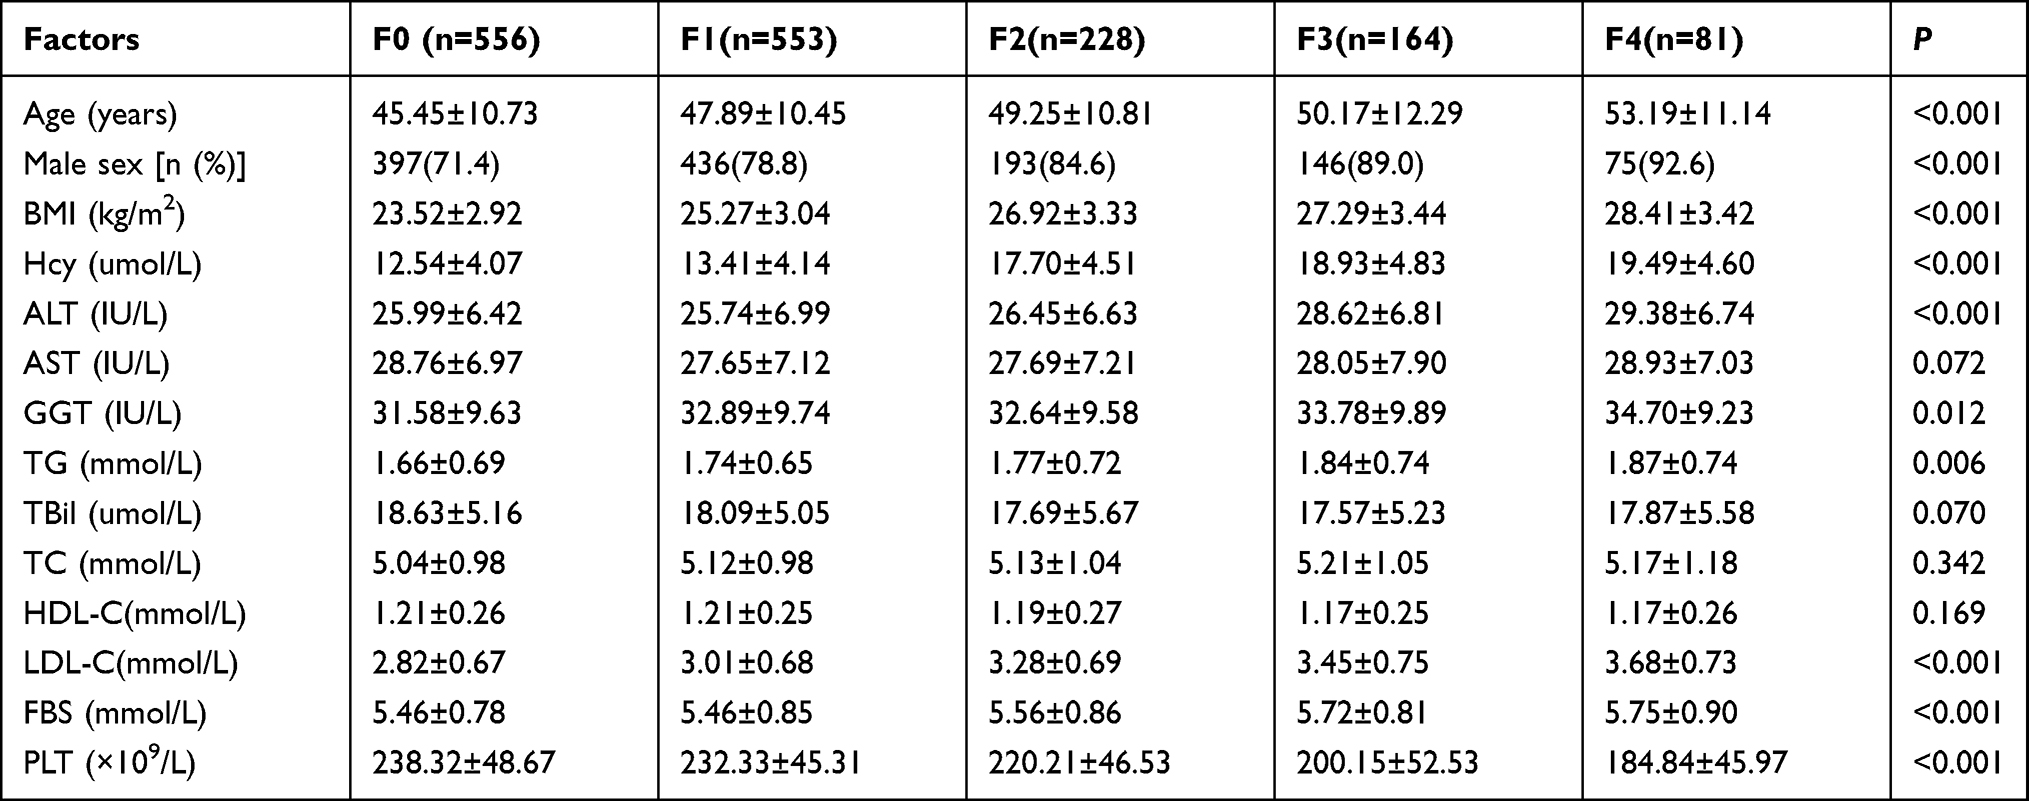 |
Table 1 Basic Characteristics and Laboratory Data of the Study Population |
Spearman Correlation Analysis Between the LSM Values and the Clinical Parameters
We performed a correlation analysis between the LSM values and gender, age, BMI, and laboratory data. Table 2 shows a strong correlation (P < 0.001 unless specified) between the LSM values and gender (r = 0.162), age (r = 0.309), BMI (r = 0.548), Hcy (r = 0.552), ALT (r = 0.110), LDL-C (r = 0.418), and PLT (r = −0.258). There was a positive correlation between the male proportion, age, BMI, Hcy, ALT, LDL-C and the LSM values, and a negative correlation between PLT and the LSM values.
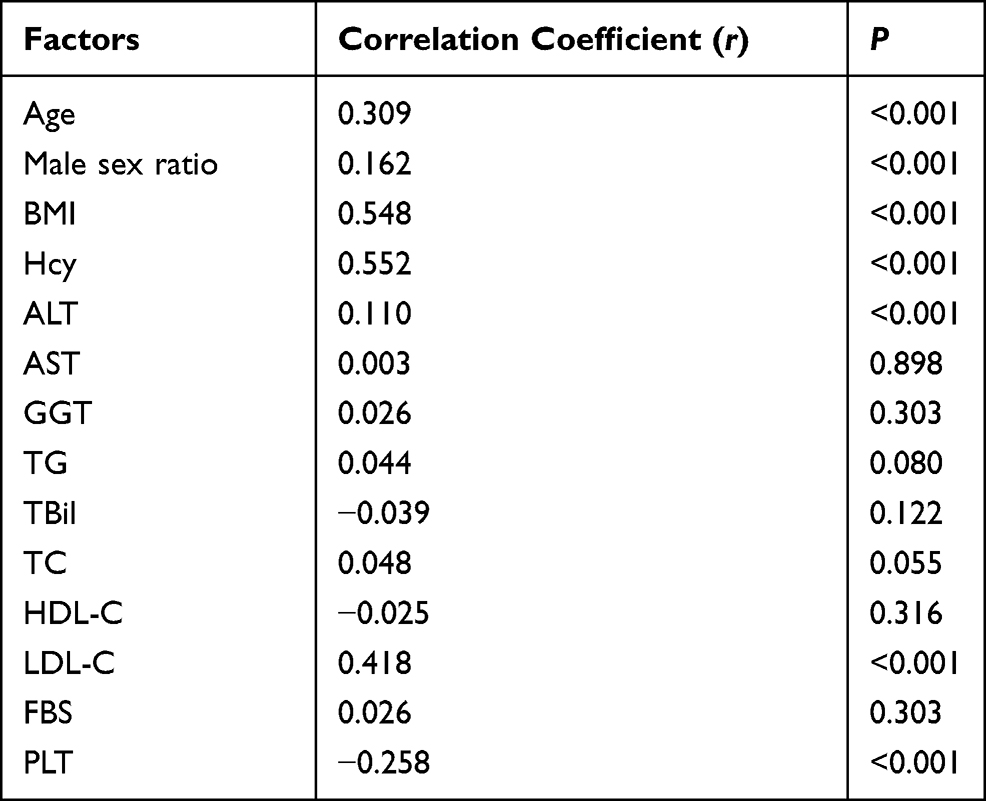 |
Table 2 Spearman Correlation Analysis Between the LSM Values and Clinical Parameters |
Spearman Correlation Analysis Between the Plasma Hcy Concentration and Serum Biomarkers of LF
The serum biomarkers used to evaluate the degree of LF include, FIB-4, APRI, and AST/ALT.17,18 Table 3 shows that there was a positive correlation (P < 0.001 unless specified) amongst the plasma Hcy concentration and AST/ALT (r = 0.219), APRI (r = 0.351), and FIB-4 (r = 0.479).
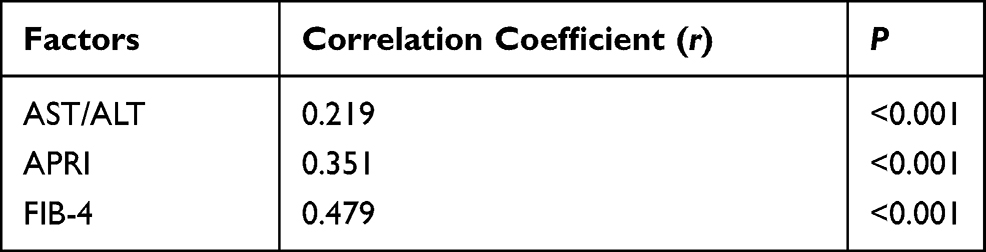 |
Table 3 Spearman Correlation Analysis Between Plasma Hcy Concentration and Serum Biomarkers of Liver Fibrosis |
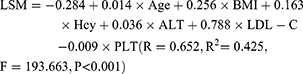
Multiple Linear Regression (MLR) Analysis
We constructed an MLR model using the LSM values as the dependent variable and BMI, age, Hcy, ALT, LDL-C, and PLT as independent variables. The established multiple linear regression equation (Table 4) was:
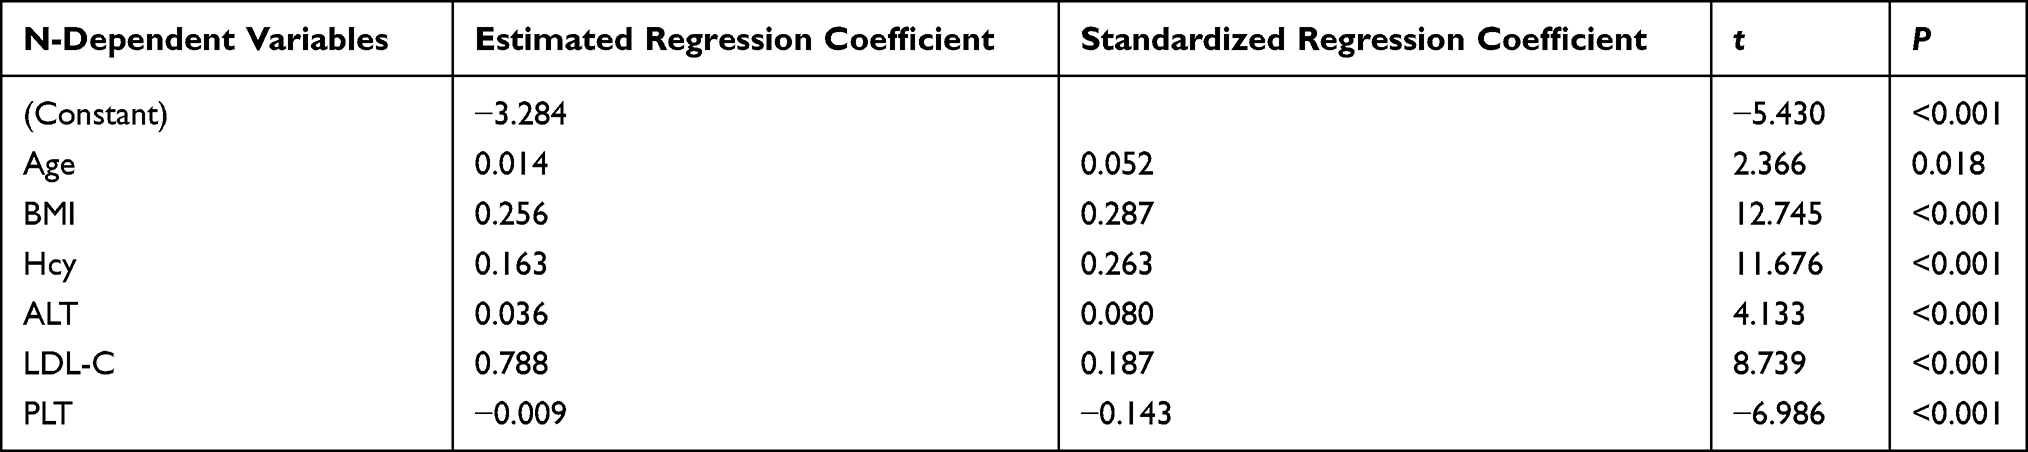 |
Table 4 Multiple Linear Regression Analysis Between LSM and Age, BMI, Hcy, ALT, LDL-C, and PLT |
Discussion
Under normal conditions in the human body, the plasma Hcy concentration in adults is maintained at approximately 5–15 μmol/L through a strict homeostasis between its synthesis and decomposition. Several clinical and epidemiological studies have confirmed that HHcy (Hcy ≥ 15 µmol/L) is linked with an increased occurrence of heart diseases, vascular diseases, peripheral vascular diseases, neurological degenerative diseases, diabetes, and pregnancy hypertension syndrome.19–21 Several studies have found that HHcy is associated with the occurrence of fibrosis in different tissues of rats, such as myocardial fibrosis, intestinal fibrosis, and seminal vesicle fibrosis.22–24 However, it is still unclear whether there is a similar association between HHcy and liver or LF. We conducted this cross-sectional study to understand this correlation and found that Hcy was strongly correlated with the LSM values, as well as with the recognized serum biomarkers (AST/ALT, APRI, FIB-4), used to evaluate the degree of LF. The higher the level of plasma Hcy concentration, the more severe the degree of LF. Our results agreed with previous studies. A previous study25 found that the mean plasma Hcy concentration was elevated in liver cirrhosis patients than in the control group. A recent study26 found an association between HHcy and the severity of liver cirrhosis, and HHcy was related to a lower survival rate in patients post-liver transplantation. Additionally, animal experiments revealed that HHcy promoted LF in mice by activating the aromatic hydrocarbon receptor/CD36 pathway.27 Hcy was also found to upregulate collagen deposition and collagen I expression in rat liver specimens.1 Studies at the cellular level also found that HHcy promoted fibrosis of hepatic stellate cells by upregulating the expression of TIMP-1 and type I procollagen.28 Thus, both basic and epidemiological studies showed that there was a definite correlation between HHcy and LF.
LF facilitates the advancement of various chronic liver diseases into liver cirrhosis. The degree of LF is a major predictor of outcome and prognosis in chronic liver diseases. The diagnosis of the disease, its progression, and treatment are dependent on the precise evaluation of LF. Liver biopsy is the standard technique for LF analysis; however, it is an invasive, expensive, and painful procedure that can result in mild to severe complications. Thus recently, more attention has been paid to the development of noninvasive techniques to diagnose LF, such as serum biomarkers and ultrasound elastography. Many studies have confirmed the accuracy and reliability of AST/ALT, APRI, and FIB-4 as serum biomarkers of LF, which were also used as serum biomarkers of LF in this study.29–33 We observed different degrees of correlation between plasma Hcy concentration and these serum biomarkers, and the correlation degree was FIB-4, APRI, and AST/ALT in this order. Currently, the elastography techniques used in LSM mainly include TE, strain elastography (SE), and acoustic radiation force impulse (ARFI).34 FibroScan is an ultrasound-based vibration-controlled TE machine, which estimates liver stiffness by passing a 50 Hz narrow band shear wave and tracking its spread inside the liver. The transfer speed of shear waves in the liver is directly proportional to the hardness of the liver tissue: the stiffer the liver tissue, the higher the shear wave speed and the greater the LSM value. Several studies35–38 have confirmed the efficiency and repeatability of FibroScan in the diagnosis of LF and cirrhosis. Boursier et al39 compared nine noninvasive methods for assessing LF in a cross-sectional study and found that FibroScan and FibroMeter were the most accurate among these methods. Thus, in this study, Fibroscan was used to measure liver stiffness. In a recent large-scale prospective study by Eddowes et al,16 based on the highest Youden index that maximizes sensitivity and specificity of LSM, 8.2 kPa, 9.7 kPa, and 13.6 kPa were chosen as the critical values of F ≥ F2, F ≥ F3, and F = F4, respectively. Additionally, Boursier et al39 selected 6.1 kPa as the critical value to distinguish between F0 and F1. In our study, the fibrosis stages were grouped into F0 (LSM < 6.1 kPa), F1 (6.1 kPa ≤ LSM < 8.2 kPa), F2 (8.2 kPa ≤ LSM < 9.7 kPa), F3 (9.7 kPa ≤ LSM < 13.6 kPa), F4 (LSM ≥ 13.6 kPa) based on our results. The FibroScan is configured with two types of probes, M probe and XL probe. M probe (standard probe) is the first choice for measurement; however, it can be unsuccessful or unreliable in subjects who are obese or have thick subcutaneous fat. The XL probe, which was developed later, is dedicated to patients who are obese and can significantly improve the success rate of detection.40 Thus, the combined use of M and XL probes in this study improved both the success rate as well as the reliability of FibroScan. Additionally, the results of FibroScan are influenced by several factors, such as ascites, liver inflammation, liver congestion, eating habits, cholestasis, etc.41,42 Therefore, such subjects were excluded from this study.
Thus, we found that there was a considerable difference in the plasma Hcy concentration at different stages of LF. Also, there was a strong link between the plasma Hcy concentration and LF: the higher the level of plasma Hcy concentration, the more evident the degree of LF. This study had the following advantages: First, although the relationship between Hcy and cardiovascular and cerebrovascular diseases has been well studied, there were limited studies on the relationship between Hcy and fibrosis, especially human LF. This study explored the influence of Hcy on human LF from a new perspective. Second, the current studies researching the link between LF and cirrhosis are focused on people with chronic liver diseases, such as hepatitis, and very few studies have been conducted in healthy people. The regular health check-up crowd was included in this study, which is of vital significance to the early detection and prevention of LF to avoid the development of severe LF and cirrhosis resulting in irreversible clinical consequences. Additionally, the methods used to evaluate LF in this study were all noninvasive, safe, convenient to operate, and easy to be accepted, especially suitable for large studies. Some of the limitations of this study are as follows: First, since it was a cross-sectional study, it could not explore a causal relationship. Thus, further studies are needed to determine a causal link between Hcy and LF. Second, this study was mainly conducted in a regular health check-up population. The relationship between Hcy and LF in various stages of the liver disease needs to be further studied. Finally, the specific mechanism of the effect of Hcy on LF is still unclear and needs to be further explored.
Funding
This research did not receive any specific grant from funding agencies in the public, commercial, or not-for-profit sectors.
Disclosure
The authors declare no competing interests.
References
1. Tung H-C, Hsu S-J, Tsai M-H, et al. Homocysteine deteriorates intrahepatic derangement and portal-systemic collaterals in cirrhotic rats. Clin Sci. 2016;131:69–86. doi:10.1042/cs20160470
2. Jud P, Hafner F, Verheyen N, et al. Age-dependent effects of homocysteine and dimethylarginines on cardiovascular mortality in claudicant patients with lower extremity arterial disease. Heart Vessels. 2018;33:1453–1462. doi:10.1007/s00380-018-1210-9
3. Bukharaeva E, Shakirzyanova A, Khuzakhmetova V, Sitdikova G, Giniatullin R. Homocysteine aggravates ROS-induced depression of transmitter release from motor nerve terminals: potential mechanism of peripheral impairment in motor neuron diseases associated with hyperhomocysteinemia. Front Cell Neurosci. 2015;9:391. doi:10.3389/fncel.2015.00391
4. Xie D, Yuan Y, Guo J, et al. Hyperhomocysteinemia predicts renal function decline: a prospective study in hypertensive adults. Sci Rep. 2015;5(1):16268. doi:10.1038/srep16268
5. Joseph J, Kennedy RH, Devi S, Wang J, Joseph L, Hauer-Jensen M. Protective role of mast cells in homocysteine-induced cardiac remodeling. Am J Physiol Heart Circ Physiol. 2005;288(5):H2541–H2545. doi:10.1152/ajpheart.00806.2004
6. Cao L, Lou X, Zou Z, et al. Folic acid attenuates hyperhomocysteinemia-induced glomerular damage in rats. Microvasc Res. 2013;89:146–152. doi:10.1016/j.mvr.2013.07.002
7. Tan H, Shi C, Jiang X, et al. Hyperhomocysteinemia promotes vascular remodeling and fibrosis in carotid vein graph in mice. Front Biosci. 2014;19:958. doi:10.2741/4260
8. García-Tevijano ER, Berasain C, Rodríguez JA, et al. Hyperhomocysteinemia in liver cirrhosis. Hypertension. 2001;38:1217–1221. doi:10.1161/hy1101.099499
9. Deffieux T, Gennisson J-L, Bousquet L, et al. Investigating liver stiffness and viscosity for fibrosis, steatosis and activity staging using shear wave elastography. J Hepatol. 2015;62(2):317–324. doi:10.1016/j.jhep.2014.09.020
10. Yoon KT, Lim SM, Park JY, et al. Liver stiffness measurement using Acoustic Radiation Force Impulse (ARFI) elastography and effect of necroinflammation. Dig Dis Sci. 2012;57(6):1682–1691. doi:10.1007/s10620-012-2044-4
11. Sini M, Sorbello O, Civolani A, Liggi M, Demelia L. Non-invasive assessment of hepatic fibrosis in a series of patients with Wilson’s disease. Dig Liver Dis. 2012;44(6):487–491. doi:10.1016/j.dld.2011.12.010
12. Lee J, Kim MY, Kang SH, et al. The gamma-glutamyl transferase to platelet ratio and the FIB-4 score are noninvasive markers to determine the severity of liver fibrosis in chronic hepatitis B infection. Br J Biomed Sci. 2018;75(3):128–132. doi:10.1080/09674845.2018.1459147
13. Boursier J, Zarski J-P, de Ledinghen V, et al. Determination of reliability criteria for liver stiffness evaluation by transient elastography. Hepatology. 2013;57(3):1182–1191. doi:10.1002/hep.25993
14. Roulot D, Roudot-Thoraval F, Nkontchou G, et al. Concomitant screening for liver fibrosis and steatosis in French type 2 diabetic patients using fibroscan. Liver Int. 2017;37(12):1897–1906. doi:10.1111/liv.13481
15. Cassinotto C, Boursier J, de Lédinghen V, et al. Liver stiffness in nonalcoholic fatty liver disease: a comparison of supersonic shear imaging, FibroScan, and ARFI with liver biopsy. Hepatology. 2016;63(6):1817–1827. doi:10.1002/hep.28394
16. Eddowes PJ, Sasso M, Allison M, et al. Accuracy of FibroScan controlled attenuation parameter and liver stiffness measurement in assessing steatosis and fibrosis in patients with nonalcoholic fatty liver disease. Gastroenterology. 2019;156(6):1717–1730. doi:10.1053/j.gastro.2019.01.042
17. Wang R-Q, Zhang Q-S, Zhao S-X, et al. Gamma-glutamyl transpeptidase to platelet ratio index is a good noninvasive biomarker for predicting liver fibrosis in Chinese chronic hepatitis B patients. J Int Med Res. 2016;44(6):1302–1313. doi:10.1177/0300060516664638
18. Cengiz M, Ozenirler S. Comparative diagnostic accuracy of red cell distribution width-to-platelet ratio versus noninvasive fibrosis scores for the diagnosis of liver fibrosis in biopsy-proven nonalcoholic fatty liver disease. Eur J Gastroenterol Hepatol. 2015;27(11):1293–1299. doi:10.1097/meg.0000000000000445
19. Chrysant SG, Chrysant GS. The current status of homocysteine as a risk factor for cardiovascular disease: a mini review. Expert Rev Cardiovasc Ther. 2018;16(8):559–565. doi:10.1080/14779072.2018.1497974
20. Sharma M, Tiwari M, Tiwari RK. Hyperhomocysteinemia: impact on neurodegenerative diseases. Basic Clin Pharmacol Toxicol. 2015;117:287–296. doi:10.1111/bcpt.12424
21. Audelin MC, Genest J. Homocysteine and cardiovascular disease in diabetes mellitus. Atherosclerosis. 2001;159:497–511. doi:10.1016/s0021-9150(01)00531-7
22. Zhang J-S, Hou Y-L, Lu -W-W, et al. Intermedin(1–53) protects against myocardial fibrosis by inhibiting endoplasmic reticulum stress and inflammation induced by homocysteine in apolipoprotein E-deficient mice. J Atheroscler Thromb. 2016;23:1294–1306. doi:10.5551/jat.34082
23. Ding H, Gan H-Z, Fan W-J, Cao L-Y, Xu J-M, Mei Q. Homocysteine promotes intestinal fibrosis in rats with trinitrobenzene sulfonic acid-induced colitis. Dig Dis Sci. 2014;60:375–381. doi:10.1007/s10620-014-3379-9
24. Ghoul A, Moudilou E, Cherifi MEH, et al. The role of homocysteine in seminal vesicles remodeling in rat. Folia Histochem Cytobiol. 2017;55:62–73. doi:10.5603/fhc.a2017.0010
25. Culafic D, Markovic M, Obrenovic R, Mijac D. Plasma homocysteine levels in patients with liver cirrhosis. Vojnosanit Pregl. 2013;70(1):57–60. doi:10.2298/vsp110823032c
26. Bhanji RA, Ma M, Bain VG, Montano-Loza AJ. Hyperhomocysteinemia is associated with severity of cirrhosis and negative impact after liver transplantation. Liver Int. 2015;36:696–704. doi:10.1111/liv.12979
27. Yao L, Wang C, Zhang X, et al. Hyperhomocysteinemia activates the aryl hydrocarbon receptor/CD36 pathway to promote hepatic steatosis in mice. Hepatology. 2016;64(1):92–105. doi:10.1002/hep.28518
28. Zou C-G, Gao S-Y, Zhao Y-S, et al. Homocysteine enhances cell proliferation in hepatic myofibroblastic stellate cells. J Mol Med. 2009;87(1):75–84. doi:10.1007/s00109-008-0407-2
29. El Serafy MA, Kassem AM, Omar H, Mahfouz MS, El Said El Raziky M. APRI test and hyaluronic acid as non-invasive diagnostic tools for post HCV liver fibrosis: systematic review and meta-analysis. Arab J Gastroenterol. 2017;18(2):51–57. doi:10.1016/j.ajg.2017.05.005
30. Papadopoulos N, Vasileiadi S, Papavdi M, et al. Liver fibrosis staging with combination of APRI and FIB-4 scoring systems in chronic hepatitis C as an alternative to transient elastography. Ann Gastroenterol. 2019;32:498–503. doi:10.20524/aog.2019.0406
31. Imai H, Kamei H, Onishi Y, et al. Diagnostic usefulness of APRI and FIB-4 for the prediction of liver fibrosis after liver transplantation in patients infected with hepatitis C virus. Transplant Proc. 2018;50(5):1431–1436. doi:10.1016/j.transproceed.2018.03.005
32. Ding D, Li H, Liu P, et al. FibroScan, aspartate aminotransferase and alanine aminotransferase ratio (AAR), aspartate aminotransferase to platelet ratio index (APRI), fibrosis index based on the 4 factor (FIB-4), and their combinations in the assessment of liver fibrosis in patients with hepatitis B. Int J Clin Exp Med. 2015;8:20876.
33. Siddiqui MS, Yamada G, Vuppalanchi R, et al. Diagnostic accuracy of noninvasive fibrosis models to detect change in fibrosis stage. Clin Gastroenterol Hepatol. 2019;17(9):1877–1885. e1875. doi:10.1016/j.cgh.2018.12.031
34. Săftoiu A, Gilja OH, Sidhu PS, et al. The EFSUMB guidelines and recommendations for the clinical practice of elastography in non-hepatic applications: update 2018. Ultraschall Med. 2019;40(04):425–453. doi:10.1055/a-0838-9937
35. Nierhoff J, Chávez Ortiz AA, Herrmann E, Zeuzem S, Friedrich-Rust M. The efficiency of acoustic radiation force impulse imaging for the staging of liver fibrosis: a meta-analysis. Eur Radiol. 2013;23(11):3040–3053. doi:10.1007/s00330-013-2927-6
36. Bota S, Herkner H, Sporea I, et al. Meta-analysis: ARFI elastography versus transient elastography for the evaluation of liver fibrosis. Liver Int. 2013;33(8):1138–1147. doi:10.1111/liv.12240
37. Ferraioli G, Tinelli C, Dal Bello B, Zicchetti M, Filice G, Filice C. Accuracy of real-time shear wave elastography for assessing liver fibrosis in chronic hepatitis C: a pilot study. Hepatology. 2012;56(6):2125–2133. doi:10.1002/hep.25936
38. Cassinotto C, Lapuyade B, Mouries A, et al. Non-invasive assessment of liver fibrosis with impulse elastography: comparison of supersonic shear imaging with ARFI and FibroScan®. J Hepatol. 2014;61(3):550–557. doi:10.1016/j.jhep.2014.04.044
39. Boursier J, Vergniol J, Guillet A, et al. Diagnostic accuracy and prognostic significance of blood fibrosis tests and liver stiffness measurement by FibroScan in non-alcoholic fatty liver disease. J Hepatol. 2016;65(3):570–578. doi:10.1016/j.jhep.2016.04.023
40. de Lédinghen V, Wong VW-S, Vergniol J, et al. Diagnosis of liver fibrosis and cirrhosis using liver stiffness measurement: comparison between M and XL probe of FibroScan. J Hepatol. 2012;56:833–839. doi:10.1016/j.jhep.2011.10.017
41. Verveer C, Zondervan PE, Ten Kate FJW, Hansen BE, Janssen HLA, de Knegt RJ. Evaluation of transient elastography for fibrosis assessment compared with large biopsies in chronic hepatitis B and C. Liver Int. 2011;32:622–628. doi:10.1111/j.1478-3231.2011.02663.x
42. Zeng X, Xu C, He D, et al. Influence of hepatic inflammation on FibroScan findings in diagnosing fibrosis in patients with chronic hepatitis B. Ultrasound Med Biol. 2015;41:1538–1544. doi:10.1016/j.ultrasmedbio.2015.01.011
 © 2021 The Author(s). This work is published and licensed by Dove Medical Press Limited. The full terms of this license are available at https://www.dovepress.com/terms.php and incorporate the Creative Commons Attribution - Non Commercial (unported, v3.0) License.
By accessing the work you hereby accept the Terms. Non-commercial uses of the work are permitted without any further permission from Dove Medical Press Limited, provided the work is properly attributed. For permission for commercial use of this work, please see paragraphs 4.2 and 5 of our Terms.
© 2021 The Author(s). This work is published and licensed by Dove Medical Press Limited. The full terms of this license are available at https://www.dovepress.com/terms.php and incorporate the Creative Commons Attribution - Non Commercial (unported, v3.0) License.
By accessing the work you hereby accept the Terms. Non-commercial uses of the work are permitted without any further permission from Dove Medical Press Limited, provided the work is properly attributed. For permission for commercial use of this work, please see paragraphs 4.2 and 5 of our Terms.