")
Back to Journals » Veterinary Medicine: Research and Reports » Volume 6
Plasma concentrations of fenbendazole (FBZ) and oxfendazole in alpacas (Lama pacos) after single intravenous and oral dosing of FBZ
Authors Lakritz J , Linden D, Anderson D , Specht T
Received 9 November 2014
Accepted for publication 15 December 2014
Published 19 February 2015 Volume 2015:6 Pages 71—81
DOI https://doi.org/10.2147/VMRR.S77255
Checked for plagiarism Yes
Review by Single anonymous peer review
Peer reviewer comments 4
Editor who approved publication: Professor Takashi Agui
Jeffrey Lakritz,1 Daniel Linden,2 David E Anderson,3 Terri A Specht4
1Department of Veterinary Clinical Sciences, College of Veterinary Medicine, The Ohio State University, Columbus, OH, USA; 2Department of Agriculture and Engineering Technologies, College of Food, Agriculture and Environmental Sciences, The Ohio State University, Wooster, OH, USA; 3Department of Large Animal Clinical Sciences, College of Veterinary Medicine, University of Tennessee, Knoxville, TN, USA; 4Four Star Veterinary Service, Chickasaw, OH, USA
Abstract: The objective of this study was to determine plasma pharmacokinetics and bioavailability of fenbendazole (FBZ) and oxfendazole (OFZ) after intravenous (iv) and oral administrations of FBZ (5 mg/kg) to alpacas. Plasma concentrations of FBZ and OFZ after administration of FBZ iv and orally (5 mg/kg) were determined by high-performance liquid chromatography with ultraviolet detection. Total clearance (CL) of FBZ was 16.5±4 mL/kg/min (range: 4–31 mL/kg/min), and steady-state volume of distribution (Vdss) was 3.3±1 L/kg (range: 1.7–7.4 L/kg). The terminal phase half-life of FBZ after iv administration was 5.9±3.8 hours (range: 0.8–20 hours). After oral administration, the FBZ terminal phase half-life was 23±5 hours (range: 9–37 hours) and the systemic bioavailability of FBZ was 16%±6% (range: 1%–41%). Peak FBZ concentrations after oral administration were 0.13±0.05 µg/mL (range: 0.05–0.28 µg/mL) at 10 hours (range: 8–12 hours). Peak plasma OFZ concentrations after oral dosing with FBZ (5 mg/kg) were 0.14±0.05 µg/mL (0.05–0.3 µg/mL) at 24±7 hours (range: 12–48 hours). FBZ clearance is lower in comparison to that of other species. Systemic availability of FBZ after oral administration is low after oral dosing. Metabolites of FBZ produced by alpacas are similar to those observed in other species.
Keywords: bioavailability, benzimidazoles, camelid, pharmacokinetics
Introduction
South American camelids are considered minor species by the US Food and Drug Administration’s Center for Veterinary Medicine.1 As such, there are few medications approved for use in these species. In spite of the paucity of drugs tested and approved for use in camelids, many medications are nonetheless used in alpacas with doses extrapolated from other species. Interspecies extrapolation is problematic because appropriate dosing in one species may result in toxicity, treatment failure, or both in another.1,2 Limited knowledge of South American camelid drug disposition and metabolism remains a concern when recommending benzimidazole anthelmintics for parasitism.3 Furthermore, the common use of benzimidazoles in alpacas is currently associated with significant anthelmintic resistance.4
Gastrointestinal parasitism is a common problem in camelids. South American camelids are susceptible to gastrointestinal parasitism and develop clinical signs such as anorexia, weight loss, anemia, and hypoproteinemia similar to small ruminants and cattle. Parasites commonly encountered include Trichostrongyle spp (Haemonchus spp, Ostertagia spp, and Trichostrongylus spp), Nematodirus spp, Capillaria spp, and Trichuris spp.5
Of the gastrointestinal parasites, Nematodirus spp and Trichuris spp demonstrate limited susceptibility to avermectin-type anthelmintics.5 Trichuris spp also display limited susceptibility to benzimidazoles, with the exception of oxibendazole and oxfendazole.5 As such, it is common to recommend appropriate benzimidazole anthelmintics for use in anthelmintic programs to prevent parasitism with benzimidazole-susceptible Trichostrongylid, Trichuris spp, and aberrant migration of the meningeal worm, Parelaphostrongylus tenuis. Veterinarians working with South American camelids commonly recommend the use of anthelmintics on a monthly, or bimonthly, basis for the treatment of aberrant migration of the meningeal worm (Parelaphostrongylus tenuis) in animals cohabitating with white tail deer (Odocoileus virginianus). The use of a benzimidazole anthelmintic has been recommended in rotational systems due to the incidence of nematodes demonstrating limited susceptibility to the avermectin anthelmintics (Nematodirus spp, Trichuris spp.).
A previous study demonstrated absorption of FBZ after oral administration of >5 mg/kg to <10 mg/kg FBZ paste (Safe-Guard® paste, 10%; Intervet International, Millsboro, DE, USA) in llamas.6 Their studies demonstrate that plasma concentrations achieved in llamas after oral dosing with the paste dewormer were suitable for treatment of Nematodirus spp., Strongyloides spp., and Trichuris spp. and were comparable to those observed in other species studied.7 However, there are no reports describing the plasma concentrations of FBZ metabolites, of which OFZ is important due to its anthelmintic activity and higher potency against inhibited Trichostrongyle stages, lungworms, and Trichuris spp parasites.5
The purpose of this study was three fold: 1) to describe the plasma disposition of fenbendazole (FBZ) after intravenous (iv) (5 mg/kg) and oral (5 mg/kg) dosing in alpacas; 2) to determine sequential metabolism of FBZ in alpacas by quantitation of plasma concentrations of the FBZ-related compound oxfendazole (OFZ) and to identify OFZ–sulfone after oral dosing; 3) to determine fractional absorption of FBZ. The doses chosen for this study were those studied in llamas and approved for cattle (5 mg/kg).6
Materials and methods
Alpacas
Five healthy alpacas of mixed age (ages 6.7±2.2 years) and sex (male =2; female =3), weighing 67.2±10.3 kg were used in this study. Animals were part of a small research herd maintained at The Ohio State University Veterinary Medical Center. Before initiation of the study, the animals were housed in pens in accordance with and approved by the Institutional Laboratory Animal Use and Care protocol. Animals were healthy based upon physical examination, complete blood counts, and serum biochemical panel. The animals had not received any drugs for a minimum of 4 weeks before initiation of the study.
For iv dosing, a small area of their neck was clipped and prepared for aseptic placement of two iv catheters, one in each jugular vein. A sterile 5.25-inch Teflon-coated catheter was placed into each jugular vein, one for iv dosing and one for periodic blood sampling. The catheters were covered with sterile 10 cm × 10 cm gauze pads and wrapped with elastic bandage material. The catheters were flushed before and immediately after blood sample removal with heparinized saline to prevent clotting throughout the study periods.
For oral dosing, one jugular catheter was placed aseptically in the right jugular vein for periodic sampling of blood. The catheters were managed and the samples obtained as described above for iv dosing.
Animal dosing
For the iv study, five animals (two male and three female) were randomly assigned to be dosed by iv administration of FBZ in propylene glycol/dimethyl sulfoxide (DMSO) (6% FBZ solution in a 80:20 propylene glycol/DMSO mixture; 5 mg/kg body weight). For the oral dosing study, FBZ was administered at 5 mg FBZ/kg body weight per os as a 10% FBZ suspension (n=5; Safe-Guard®, Suspension, 10% FBZ; Intervet International, Millsboro, DE, USA). Those animals receiving iv administration first were followed 2 weeks later by oral dosing, whereas, those receiving oral administration first were followed 2 weeks later by iv dosing.
Animal sampling
Before dosing, heparinized blood was obtained from all animals to serve as negative control plasma (time =0). After iv dosing, heparinized blood samples were taken at 3 minutes, 6 minutes, 12 minutes, 18 minutes, 30 minutes, and 45 minutes; and at 1 hour, 1.5 hours, 2 hours, 2.5 hours, 3 hours, 3.5 hours, 4 hours, 5 hours, 6 hours, 8 hours, 10 hours, 12 hours, 24 hours, 48 hours, and 96 hours postdosing from the contralateral catheter. After oral dosing of 10% oral suspension (5 mg FBZ/kg body weight), heparinized blood samples were taken at 0.5 hour, 1 hour, 2 hours, 4 hours, 8 hours, 12 hours, 24 hours, 48 hours, and 96 hours postdosing. Plasma samples were maintained cold on ice until centrifugation at 1,000× g for 10 minutes at 4°C. Plasma was removed and stored in duplicate 1.5 mL cryovials at −20°C until analysis.
Drug analysis
A full description is presented in Supplementary materials.
Plasma concentration versus time data from each animal given FBZ iv (5 mg/kg; n=5) were subjected to compartmental analysis (Pharsight Corporation, Phoenix WinNonlin professional, version 6.3; St Louis, MO, USA). The number of exponential terms required to describe the serum concentration versus time data for each animal was determined by evaluation of concentration versus time curves, applying Akaike’s information criterion and examination of residuals.8
A full description of data analysis is presented in Supplementary materials.
Results
Chromatography
The high-performance liquid chromatography (HPLC) method used in this study was suitable for the determination of FBZ and OFZ in alpaca plasma, with a limit of quantitation (LOQ) for FBZ of 50 ng/mL. The modifications we made to the mobile phase, in combination with the analytical column, resulted in symmetrical peaks with adequate peak height, resolution, and retention time (RT) of both FBZ and OFZ for evaluation of FBZ and related compounds in alpacas.9 This method was of sufficient analytical selectivity and sensitivity to quantitate plasma concentrations of FBZ and OFZ in alpacas dosed with iv and oral forms of this anthelmintic. This was determined by complete resolution of FBZ (RT =13.5 minutes) and related compounds OFZ (RT =5.75 minutes) and FBZ-sulfone (RT =7.6 minutes) and no interference with other compounds eluting from plasma. Standard curves were linear over the range of concentrations analyzed (0.05 μg/mL–8.0 μg/mL), with correlation coefficients for FBZ of 0.998 (range: 0.990–0.999) and OFZ of 0.998 (range: 0.993–0.999). The limit of detection (LOD) (0.025 μg/mL) and LOQ (0.05 μg/mL) for FBZ, LOD (0.0125 μg/mL) and LOQ (0.025 μg/mL) for OFZ, and the magnitude of drug recovery (81% for FBZ; 74% for OFZ) were suitable for this analysis. The between- and within-day accuracy values were <15% (range: 1.4%–14.5%) at the three concentrations tested, and the between- and within-day precision values were <15% (range: 3%–11.9%) over the range of concentrations tested.
Plasma concentration versus time
Mean plasma FBZ and OFZ concentrations after iv administration of FBZ (5 mg/kg body weight) to alpacas are depicted graphically in Figure 1. The concentration–time data for individual animal iv drug dosing were best described using a biexponential equation corresponding to a two-compartment, open pharmacokinetic model. Pharmacokinetic parameters for FBZ derived from two-compartment analysis of alpaca plasma concentration–time data are presented as median (range) in Table 1. Plasma concentration versus time data for FBZ by oral administration (5 mg/kg FBZ) are presented graphically in Figure 2. The results of the noncompartmental statistical moment analysis of plasma concentration versus time data after oral dosing of FBZ are summarized in Table 2. In addition, selected pharmacokinetic parameters for OFZ are also provided (Table 2).
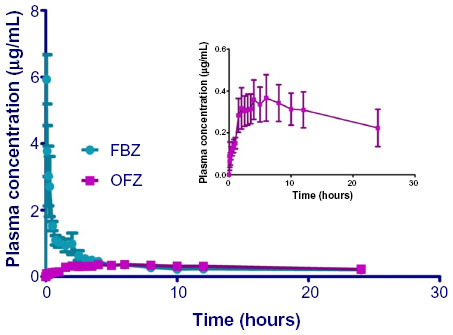 | Figure 1 Plasma concentrations of FBZ and OFZ in alpacas after iv administration of FBZ in a DMSO/propylene glycol vehicle. |
 ) after iv administration of FBZ in DMSO/propylene glycol (50 mg/mL) to five alpacas. Inset: Plasma concentration versus time curve of OFZ after iv administration of FBZ on an enlarged scale to demonstrate the appearance of OFZ.
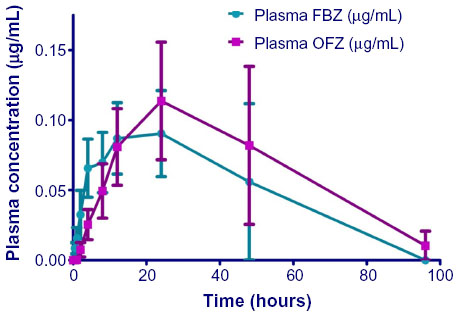 | Figure 2 Plasma concentrations of FBZ and OFZ in alpacas after oral administration of FBZ suspension. |
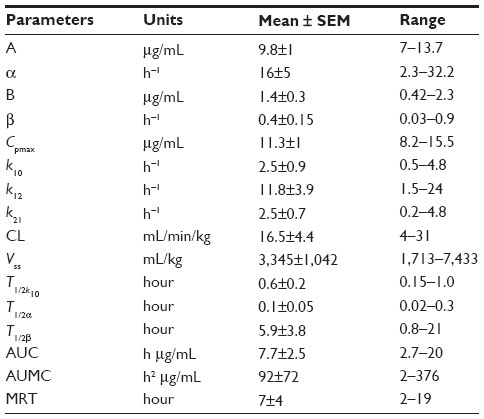 | Table 1 Pharmacokinetic analysis of fenbendazole after iv dosing in a DMSO/propylene glycol vehicle |
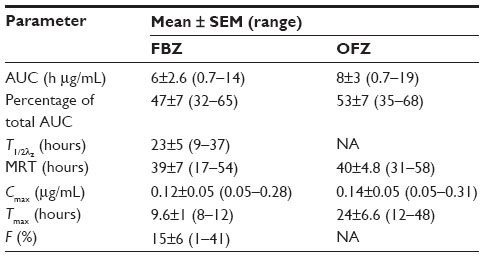 | Table 2 Statistical moment analysis of FBZ and OFZ in alpacas after oral administration of FBZ suspension (5 mg/kg) |
Injection of FBZ dissolved in propylene glycol/DMSO resulted in mild hemolysis, which was apparent for approximately 30 minutes after iv injection of FBZ in three of five animals (mild hemoglobinemia). Estimated maximum plasma concentrations calculated by the model for FBZ were 11.3±1 μg/mL (range: 8–15.5 μg/mL). The concentration of FBZ in plasma decreased rapidly for the initial 1.5 hours postadministration of the iv drug. Plasma concentrations exceeded the LOQ for 24 hours postdosing. The area under the concentration–time curve for FBZ (AUCFBZ) after iv administration was 7.7±2.5 μg ×h/mL (range: 2.7–20 h × μg/mL), area under the first moment curve was 92±72 h2 × μg/mL (range: 2–376 h2 × μg/mL), and mean residence time (MRT) was 7±4 hours (range: 2–19 hours). The elimination half-life of FBZ from plasma after iv administration was 5.9±3.8 hours (range: 0.8–21 hours). The median plasma clearance of FBZ normalized to body weight was 16.5±4.4 mL/min/kg (range: 4–31 mL/min/kg). The steady-state volume of distribution (Vdss) was 3.3±1.0 L/kg (range: 1.7–7.4 L/kg).
Mean plasma concentrations of OFZ after iv dosing of FBZ were greater than the LOQ by 6 minutes postinjection. Mean maximum plasma concentration (Cmax) observed for OFZ after iv dosing with FBZ was 0.39±0.1 μg/mL (range: 0.2–0.79 μg/mL) at 5 hours (range: 4–10 hours) postdosing. Plasma OFZ concentrations were quantifiable up to 48 hours after iv dosing. The AUC for OFZ after iv administration of FBZ (13.6±4 h μg/mL; range: 6.3–17.5 h μg/mL) was similar to that observed for FBZ. The MRT determined for OFZ was 30±5 hours (range: 17–52 hours).
Combining the AUC for FBZ and OFZ after iv administration, the percentage of total drug AUC, after iv administration for FBZ (AUCFBZ) comprised 46%±11.5% (range: 33%–64%) and AUCOFZ comprised 54%±11.5% (range: 33%–64%). After oral dosing of alpacas with FBZ, the AUCFBZ and AUCOFZ were 6±2.3 h μg/mL (range: 0.7–14 h μg/mL) and 7.8±3 h μg/mL (range: 0.65–19 h μg/mL) respectively. The percentage of the total AUC for FBZ +OFZ as AUCFBZ was 49%±5% (39%–71%) and AUCOFZ was 50%±5% (range: 29%–61%). The terminal phase half-life (T1/2) of FBZ after oral administration was 23±5 hours (range: 9–37 hours) whereas the MRT was 39±7 hours (range: 17–54 hours). Maximum plasma concentrations of FBZ and OFZ after oral dosing with FBZ were 0.13±0.05 μg/mL (range: 0.05–0.28 μg/mL) and 0.14±0.05 μg/mL (range: 0.05–0.31 μg/mL), respectively. Systemic availability of FBZ after oral administration of FBZ was 36% (range: 11%–148%). However, when corrected for prolonged half-life after oral administration, the total systemic availability was 15%±6% (1%–41%).
Identification of unknown metabolite in alpaca plasma after iv and oral administrations of FBZ was performed to assist in the identification of an unknown peak that appeared later in the concentration versus time course in alpacas. On the basis of the RTs, and comparisons among the molecular masses of FBZ (RT =13.5 minutes; molecular weight: 299.4 g/mole), OFZ (RT =5.75 minutes; molecular weight: 315.35 g/mole), and the unknown compound (RT =7.6 minutes; molecular weight: 331.35 g/mole) prepared by isolation of individual HPLC fractions, the minor metabolite is compatible with FBZ sulfone.
Discussion
Some alpacas demonstrated hemolysis after iv administration of FBZ (5 mg/kg) when solubilized in a DMSO/propylene glycol vehicle. Although there were no clinically evident effects of this hemolysis and the occurrence of hemolysis was evident only for 30 minutes after administration, we believe this was due to administration of the drug rapidly in a DMSO/propylene glycol vehicle. There may have been other causes leading to hemolysis because other studies evaluating iv dosing of benzimidazoles did not report adverse reactions.10,11 Peak plasma concentrations of FBZ after iv administration were 6.2±0.74 μg/mL (range: 3.5–7.2 μg/mL). FBZ remained above the LOQ in plasma for 24 hours in all five alpacas (Clast: 0.23±0.07 μg/mL; range: 0.15–0.53 μg/mL). In contrast, after iv administration to swine, FBZ was only detected to 6 hours postadministration, although they were limited to 1 mg/kg doses due to intolerance associated with iv formulation.10
The FBZ AUC was best described by a two-compartment open model. Primary pharmacokinetic parameters (CL, Vd) after iv administration of FBZ to alpacas demonstrated moderate rates of CL and a wide Vd. Plasma CL reflects contribution of the drug’s metabolism and elimination processes and is directly dependent on the volume of distribution of a drug within an animal.12 The plasma CL of FBZ in alpacas is lower than that reported for swine, but greater than that reported for cattle, goats, and rabbits.10,13 The steady-state Vd of FBZ after iv administration to alpacas is comparable to the values reported for cattle, goats, and swine.10,13 Similar to the distribution in other species, FBZ is widely distributed in alpacas after iv administration.
Plasma concentrations of FBZ-sulfoxide (OFZ) after iv administration, in two of the five animals, were greater than the LOQ at 3 minutes and the compound was observed in all five animals by 6 minutes. In swine, plasma concentrations of OFZ were detected at the first sampling time point (2 minutes) after iv administration of FBZ (5 mg/kg). Maximum plasma OFZ concentrations (0.3±0.1 μg/mL; range: 0.2–0.79 μg/mL) were observed 6 hours postdosing. Peak OFZ concentration in alpacas occurred later than in swine after iv administration of FBZ, but at approximately the same time after iv administration of FBZ to goats and cattle.10,14,15 After iv administration of FBZ, metabolism of FBZ to sulfoxide metabolites occurs rapidly in most species. The rapid appearance of OFZ after iv administration of FBZ, followed later by the appearance of FBZ-sulfone, is reflective of the conversion of the parent drug (FBZ) into the oxidation products (OFZ, then FBZ sulfone), as demonstrated in swine and sheep.10,16
A single iv dose of FBZ in propylene glycol/DMSO was associated with a plasma terminal phase half life (T1/2) of 5.9±3.8 hours (range: 0.8–21 hours) and MRT of 7±4 hours (range: 2–19 hours). The terminal phase half-life (T1/2) of FBZ after iv administration to alpacas is similar to that in goats and rabbits, shorter than that in cattle and catfish, but greater than that observed for swine, chickens, and turkeys.13 Rapid reduction of plasma concentration of FBZ after iv administration reflects both the rate of elimination from the body and dependence upon the distribution of drug to tissues based upon drug physicochemical properties.
After oral administration of FBZ to alpacas (5 mg/kg), plasma concentrations of FBZ were >LOQ in four of five alpacas by 0.5 hours and in all alpacas by 2 hours. The maximum concentration of FBZ in alpacas was similar to that reported in sheep (10 mg/kg suspension) and cattle (4.5 mg/kg suspension) but greater than that observed in swine (5 mg/kg suspension) and horses (10 mg/kg granules). Of interest, peak plasma FBZ concentrations after oral dosing of alpacas (5 mg/kg) were lower than those observed in llamas (6–9 mg/kg paste). As substantial variation in absorption of benzimidazoles has been reported depending upon retention within the gastric compartments, differences in peak plasma concentrations probably reflect, in part, the formulation administered to a particular species.17 It is likely that monogastric species retain FBZ for shorter periods of time than ruminants, leading to reduced drug absorption. Suspension formulations reportedly traverse gastric compartments more rapidly than paste or pelletized formulations, leading to lower Cmax values.17 Likewise, ruminants may have prolonged absorption of drugs due to the large pregastric compartment. The camelid gastric compartment has glandular regions that may improve absorption and the differences between alpacas and llamas may simply reflect the dose administered and the drug formulation.
OFZ was detectable after oral administration of FBZ to alpacas by 4 hours postdosing and Cmax for OFZ was 0.16 μg/mL at 24 hours. This pattern is similar to that reported in other species.10,13–15 While both FBZ and OFZ have antiparasitic activity, FBZ has greater affinity for parasite tubulin.18 Metabolism of the thiol benzimidazole (FBZ) to sulfoxide metabolites (OFZ) occurs rapidly in most species. The rapid appearance of OFZ after iv administration is well described in the literature and reflects the sulfoxidation of FBZ within the animal.10,18 However, the metabolic conversion of FBZ to OFZ is reversible and has been documented in studies comparing systemic administration of FBZ and OFZ.18 Further, reductive metabolism of OFZ back to FBZ occurs within the rumen of sheep and cattle, suggesting interconversion of FBZ to OFZ and back, prolonging the anthelmintic activity of FBZ.16
The AUC for FBZ after iv administration to alpacas was greater than that observed in swine after iv dosing, whereas the AUCFBZ in channel catfish was nearly double that observed in alpacas.11 The AUC reflects the drug exposure provided by a given dose. As has been suggested, the variability in published studies (including differences in dosing), drug analysis methods, and metabolic fate of FBZ play important roles in the exposure to pharmacologically active species. Therefore, direct comparisons across species may not be appropriate due to differences in metabolic fate.18
The fractional absorption of FBZ after oral administration in alpacas was higher than that reported for other species studied.10,13 The higher bioavailability after oral administration was concerning because two of the animals demonstrated bioavailability >100%.13,18 Because bioavailability >100% has no practical meaning, we evaluated the fractional absorption (F) corrected for the prolonged half-lives of FBZ after extravascular administration in comparison to that after iv dosing. In these animals, half-life correction resulted in fractional absorption F being very similar to that reported in other studies (~15%–20%). This suggests that bioavailability is absorption limited in alpacas.
In swine, the percentage of the total (FBZ + OFZ) AUC comprising FBZ is low (~8%), whereas AUCOFZ is ~66% and AUCFBZ-sulfone is 25% after iv administration of FBZ.10 Similar is the AUCFBZ observed in sheep after oral administration of FBZ (7.8%) or OFZ (7.0%).16 In contrast, after FBZ administration to alpacas, the AUCFBZ comprises approximately 41%, while the AUCOFZ is approximately 59%. This appears similar to that observed in cattle and goats wherein plasma concentrations of FBZ are higher and persist longer after FBZ dosing and have been shown to involve OFZ reduction to FBZ within the gastric compartment.14,15 While our study demonstrates a greater proportion of parent drug in plasma, the actual percentages are likely lower, based upon quantitation of all metabolites. In spite of our inability to obtain a suitable reference standard containing purified FBZ sulfone, we were able to identify this metabolite in samples obtained after administration of FBZ to alpacas. The observations suggest that alpacas metabolize FBZ similar to that observed in other species.10,18
As suggested in the previous paragraph, quantitation of FBZ sulfone as well as iv administration of OFZ are two major limitations of this study. This information would prove useful in understanding the disposition and metabolism of benzimidazoles in camelids. On the basis of morphologic and physiologic differences of the camelid gastrointestinal tract, our results suggest substantial contributions of FBZ from camelid fermentation compartments. The camelid first gastric compartment possesses substantial absorptive epithelium, reduced water content, and greater retention of feed in comparison to true ruminants.19 Absorption of drug by alpacas is probably dependent on the low solubility of FBZ and tendency for OFZ to be reduced to FBZ in the gastric compartment. Further, prolonged residence in the first gastric compartment, due to delayed emptying and nocturnal rumination, may play a role in the disposition of FBZ after administration to alpacas.
Conclusion
Differences in disposition and metabolism of FBZ in alpacas in comparison to the same processes in swine, sheep, and llamas were observed in this study. While the percentages of parent drug and metabolites differ between our study and those of others,10,18 the formation of sulfoxide and sulfone metabolites appears similar to that reported previously. The rates of metabolite formation and the interconversion of metabolites back to parent drug reflect differences in metabolism and gastrointestinal tract physiology of this species. Further evaluation of these phenomena in camelids would be useful clinically.
Acknowledgments
Funding for this study was provided by the Morris Animal Foundation, with cosponsorship support of the Llama Association of North America. The authors acknowledge the support of the Department of Veterinary Clinical Sciences and the Camelid Health Program, The Ohio State University. Partial funding for Open Access was provided by The Ohio State University Open Access Fund.
Author contributions
All authors (JL, DL, DEA, and TAS) contributed to the design of this study, which included selection of the animals, instrumenting the animals, administration of drug, and collection of the samples. Two authors (JL and TAS) prepared the samples and analytical equipment for the analysis of drug concentrations, including method validation and analysis of the raw data. All authors (JL, DL, DEA, and TAS) contributed to the final version of the manuscript by reviewing the draft versions, including the final version presented here.
Disclosure
The authors report no conflicts of interest in this work.
References
Smith BB. An overview of selected diseases and drug needs in the llama and alpaca industries. Vet Hum Toxicol. 1998;40(Suppl 1):29–34. | |
Navarre CB, Ravis WR, Nagilla R, Simpkins A, Duran SH, Pugh DG. Pharmacokinetics of phenylbutazone in llamas following single intravenous and oral doses. J Vet Pharmacol Ther. 2001;24:227–231. | |
Gruntman A, Nolen-Watson R, Parry N, Wilborn R, Maxwell H. Presumptive albendazole toxicosis in 12 alpacas. J Vet Intern Med. 2009;23(4):945–949. | |
Gillespie AM, Williamson LH, Terrill TH, Kaplan RM. Efficacy of anthelmintics on South American camelid (llama and alpaca) farms in Georgia. Vet Parasitol. 2010;172(1–2):168–171. | |
Reinemeyer CR, Courtney CH. Chemotherapy of parasitic diseases. In: Adams HR, editor. Veterinary Pharmacology and Therapeutics. 8th ed. Ames, IA: Iowa State University Press; 2001:947–955. | |
Beier E 3rd, Lehenbauer TW, Sangiah S. Clinical efficacy of fenbendazole against gastrointestinal parasites in llamas. Small Rumin Res. 2000;36:17–23. | |
Beier E 3rd, Lehenbauer TW, Sangiah S. Oral pharmacokinetics of fenbendazole in llamas, South American Camelids. Small Rumin Res. 2000;37:209–214. | |
Yamaoka K, Nakagawa T, Uno T. Application of Akaike’s information criterion (AIC) in the evaluation of linear pharmacokinetic equations. J Pharmacokinet Biopharm. 1978;6:165–175. | |
Gomes AR, Nagaraju V. High performance liquid chromatographic separation and determination of process related impurities of mebendazole, fenbendazole and albendazole in bulk drug. J Pharm Biomed Anal. 2001;26:919–927. | |
Petersen MB, Friis C. Pharmacokinetics of fenbendazole following intravenous and oral administration to pigs. Am J Vet Res. 2000;61: 573–576. | |
Kitzman JV, Holley JH, Huber WG, et al. Pharmacokinetics and metabolism of fenbendazole in channel catfish. Vet Res Commun. 1990;14:217–226. | |
Toutain PL, Bousquet-Melou A. Plasma clearance. J Vet Pharm Therap. 2004;27:415–425. | |
Davis LE, Davis CA, Koritz GD, Sevill RF. Comparative studies of fenbendazole in food-producing species. Vet Human Toxicol. 1988;20:9–11. | |
Short CR, Barker SA, Hsieh LC, et al. Disposition of fenbendazole in the goat. Am J Vet Res. 1987;48:811–815. | |
Short CR, Barker SA, Hsieh LC, et al. Disposition of fenbendazole in cattle. Am J Vet Res. 1987;48:958–961. | |
Lanusse CE, Prichard RK. Clinical pharmacokinetics and metabolism of benzimidazole anthelmintics in ruminants. Drug Metab Rev. 1993;25:235–279. | |
Knox MR, Steel JW. The effects of diet and species on the pharmacokinetics of fenbendazole in cattle. Vet Res Commun. 1997;21:37–43. | |
Lanusse CE, Gascon LH, Prichard RK. Comparative plasma disposition kinetics of albendazole, fenbendazole and oxfendazole and their metabolites in sheep. J Vet Pharmacol Therap. 1995;18:196–203. | |
Dulphy JP, Dardillat C, Jailler M, Bailet JM. Comparative study of forestomach digestion in llamas and sheep. Reprod Nutr Dev. 1997;37: 709–725. |
Supplementary materials
Apparatus
The LC apparatus consisted of an HPLC pump (Thermo Fisher Scientific, Dionex Bannockburn, IL, USA; 582 solvent delivery module), biocompatible autosampler (Thermo Fisher Scientific; 542 refrigerated), ultraviolet (UV) detector (Thermo Fisher Scientific; 580 dual channel, variable wavelength, UV/visible), thermal control column heater (Thermo Fisher Scientific). The UV detector was set to monitor 292 nm. The column was a C18, 250×4.6 mm, 5 μm particle size, reverse-phase column (Grace Technologies, Deerfield, IL, USA).
Chromatographic conditions
The mobile phase consisted of 0.01 M phosphoric acid (pH 4.0) and acetonitrile (60%:40%, v/v).1 The vacuum degassed and filtered (0.22 μm pore size filter) mobile phase was delivered at 1.0 mL/min. Column temperature was maintained at 35°C. Data were automatically collected and peaks identified and quantified using Coularray for Windows software (Version 2.0; Thermo Fisher Scientific).
Preparation of fenbendazole and oxfendazole stock solutions
Standards consisted of fenbendazole (FBZ; Sigma Chemical Co, St Louis, MO, USA; F5396) and oxfendazole (OFZ; Research Diagnostics Inc, Flanders, NJ, USA; 1483301). LC-grade acetonitrile, methyl-tert-butyl ether (m-tBE), and phosphoric acid were obtained from Thermo Fisher Scientific (St Louis, MO, USA). All other reagents were of HPLC grade. Ten milligrams of each drug was weighed quantitatively into individual 25 mL volumetric flasks. The drugs were then dissolved in 5 mL DMSO (100%) and further diluted by addition of acetonitrile to 25 mL. These two solutions (0.4 mg/mL; Standard A) were further diluted by placing 1.0 mL of each standard A in a 25 mL volumetric flask and diluting to 25 mL with acetonitrile (0.016 mg/mL FBZ and OFZ; Standard B). Appropriate volumes of A, B were added to 1.0 mL of blank alpaca plasma for preparation of a plasma FBZ/OFZ standard curve covering the range of 0.025 μg/mL to 8.0 μg/mL.
Standard and sample preparation
Plasma from healthy alpacas (not study animals) that were not treated with FBZ or OFZ was used to prepare spiked plasma for development of standard curves. Plasma samples without added drug were prepared to serve as blank controls. A 200 μL volume of 0.1 N ammonium hydroxide was added to control and spiked plasma to increase pH.1 The samples were vortexed, and 5 mL of m-tBE was added to each tube, capped, and revortexed for 1 minute. Ether-containing samples were centrifuged at 1,000× g for 10 minutes at 4°C to separate the aqueous layer from ether layers. The m-tBE-containing drug was removed, dried under nitrogen at 40°C and reconstituted with 1 mL mobile phase. The samples were vortexed for 30 seconds, and 500 μL was added to autosampler vials and capped. The samples were placed into autosampler tray and 50 μL injected onto chromatograph. Peak area of FBZ and OFZ in standards were determined and used for regression analysis to determine detector response per microgram of analyte. Samples from animals treated with the intravenous formulation and the 10% oral suspension were thawed, 1 mL aliquots placed into individual tubes, and 200 μL of 0.1 N ammonium hydroxide was added and vortexed. Drug was extracted with m-tBE as described within this standard and sample preparation section. All standards and samples were injected in triplicate. Individual standard curves were prepared daily for animal sample analysis. Peak areas were determined for OFZ and FBZ, and the peak areas were used to determine concentration of drug (compared to standard curve) and each concentration for replicate analysis was averaged. Samples that were below the limit of quantitation (LOQ) on first analysis were reextracted, concentrated five-fold, and reanalyzed by HPLC.
Method validation
Standard curves prepared on each day of analysis were compared by determining the intercept, slope, r, and r2 using linear regression on six different days. Analyte recovery percentage was estimated on 1 mL of plasma samples spiked at three different concentrations (2 μg/mL, 0.3 μg/mL, and 0.05 μg/mL; six samples per concentration; on three separate days), alkalinized with 0.1 N NH4OH, and extracted with m-tBE, dried under nitrogen, reconstituted in mobile phase, and injected onto the chromatograph. Peak areas (extracted) were compared to peak areas of identical samples prepared by direct dilution of standards at the same concentrations in mobile phase and subsequent HPLC analysis.

The ratio was used as a measure of analyte recovery for the extraction method. Determination of the LOQ was performed by triplicate injections of standard curves (n=4 on four different days) over the range of concentrations tested (0.025 μg/mL–8.0 μg/mL) and determining the concentration at which the relative standard deviation from the nominal concentration approximated 20%.2 The corresponding concentration was taken as the LOQ. The limit of detection (LOD) was determined as the lowest plasma concentration with a signal-to-noise ratio ≥3:1.2
Method accuracy was assessed by preparing replicates (n=6) of three fortification levels (2.0 μg/mL, 0.3 μg/mL, and 0.05 μg/mL of FBZ or OFZ) in 1 mL blank plasma on three separate days. These samples were alkalinized, extracted, and dried as described for standards and samples. The accuracy of the method on a given day was determined by comparing the difference in concentration found to the nominal concentration added and expressing the result as relative standard deviation (%).3

The “between-day” method accuracy at three fortification levels was determined in a similar fashion, except that the difference between the mean of all concentrations on all days (n=3 days) was determined and used to calculate difference between nominal concentrations of FBZ or OFZ added.3
Method precision between and within days was determined using analysis of variance (one-way design) and the expected between-day and within-day mean squares were determined using the following formulae:3
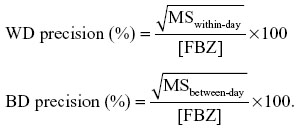
Here, WD represents “within-day,” “BD” indicates “between-day,” “MS” represents mean square from the analysis of variance table, and [FBZ] is the mean fenbendazole concentration.
Linearity of standard curves, method accuracy, precision, extraction efficiency, LOQ, and LOD were determined for OFZ in an identical manner.
HPLC–mass spectrometry identification of unknown compound based on metabolite mass
Plasma samples from animals dosed with single doses of FBZ were used to identify an unknown peak, which was present at 24 hours, 48 hours, and 96 hours postdosing. Extracted samples were repeatedly injected (99 μL), and fractions containing the FBZ, OFZ, and unknown metabolite were collected. Each fraction was pooled and reextracted from the mobile phase using m-tBE after addition of 0.1 N ammonium hydroxide. The ether layer was evaporated to dryness and the analyte was resuspended in 200 μL acetonitrile. Reevaluation of fractions by injections of FBZ, OFZ, and unknown peak on the HPLC demonstrated single peaks, with identical retention time corresponding to that sample’s identity. The concentrated fractions were submitted to the Ohio State University Campus Chemical Instrument Center mass spectrometry core for confirmation of molecular mass of this fraction.
Briefly, a Micromass LC-Tof™ II mass spectrometer equipped with an orthogonal electrospray source (Z-spray) was operated in positive ion mode (Micromass, LC-Tof; Waters Corporation, Milford, MA, USA). Sodium iodide was used for mass calibration over a calibration range of m/z 100–2,000. Optimal electrospray ionization (ESI) conditions were capillary voltage 3,000 V, source temperature 110°C, and a cone voltage of 55 V. The ESI gas was nitrogen. All ions transmitted into the pusher region of the time-of-flight analyzer were scanned over m/z 280–600, with a 1-second integration time. Data were acquired in continuum mode during the LC run.
HPLC analysis
The LC/auotsampler system consisted of a Waters Alliance 2690 Separations Module (Waters, Milford, MA, USA). The column used was C18, 250×4.6 mm, 5 μm particle size, reverse-phase column. The mobile phase was altered to 10 mM ammonium acetate, pH 4.0 (35%), and 65% acetonitrile; flow rate was maintained at 1 mL/min and was split postcolumn using a microsplitter valve (Upchurch Scientific, Oak Harbor, WA, USA) to ~20 μL/min for introduction to the ESI source.
Pharmacokinetic analysis
Zero-time plasma drug concentration intercepts of the biphasic iv disposition curve (A, B) were determined by extrapolation of the plasma fenbendazole concentrations to t=0 for the distribution phase (A) and terminal exponential phase (B). The hybrid rate constants of the biphasic iv disposition curve (α and β) were determined by calculation of the slopes of the distribution and elimination phases, respectively. The first-order elimination rate constant for disappearance of the drug k10 from the central compartment was determined using the formula

where α and β are the hybrid rate constants for the biphasic distribution curve and k21 is the rate constant for change from the peripheral compartment to central compartment. k12 and k21 are first-order transfer rate constants for drug distribution between the central and peripheral compartments, respectively. These transfer rate constants were calculated from the intercepts of the concentration versus time curve, with the y axis at time =0 for the distribution phase (A) and elimination phase (B), and the hybrid rate constants for the biphasic distribution curve (α, β) were determined using the following relationships:

The total plasma FBZ clearance was estimated as if it were all from the central compartment using the following relationship:
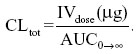
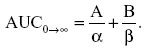
Here IVdose is in micrograms and AUCo→∞ is the area under the concentration versus time curve and calculated from the zero-time concentrations from the distribution and elimination phases of the plasma concentration–time curves (A, B) and the hybrid rate constants for the biphasic distribution curves (α, β) using the following relationship:
The apparent volume of the central (V1) and peripheral (V2) compartments and volume of distribution at steady state (Vss) were estimated from the equation
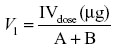
where A + B is the zero-time plasma drug concentrations of the disposition phase (A) and elimination phase (B).
Vdss was calculated by using the equation
Distribution half-life (hours) was calculated using the formula

where ln2 =0.693 and α is the slope of the initial log-linear segment of the concentration–time curve. Elimination half-life was calculated as follows:

where ln2 =0.693 and β is the slope of the terminal log-linear segment of the concentration–time curve.
The area under the first moment of the concentration versus time curve (AUMC) from time of dosing to infinity was calculated using the following formula:
The mean residence time (MRT) was determined from the ratio of AUMC to AUC, as follows:

Oral administration data were analyzed by statistical moment analysis (noncompartmental analysis or NCA; Phoenix WinNonlin Professional (version 6.3); Pharsight Corporation, St Louis MO, USA). Data from the 5 mg/kg dosing (10% oral suspension; n=5) were individually analyzed and compared descriptively. Data were modeled using model NCA 200 with extravascular input. The parent drug (FBZ) was subjected to noncompartmental statistical moment analysis to determine terminal elimination rate constant (λz, terminal-phase half life (T1/2λz), maximum plasma concentration (Cmax), time to maximum plasma concentration (Tmax), AUC (extrapolated to infinity), AUMC (extrapolated to infinity), and MRT (extrapolated to infinity). The first-order rate constant associated with the terminal log-linear portion of the concentration versus time curve λz (h−1) was calculated from individual concentration versus time data using the following formula (minimum of final three data points):
Half-life of elimination (hours) was calculated using standard formulae as follows:

Cmax and Tmax were taken directly from the concentration versus time data for each animal and time at which maximum concentration was found. AUC was calculated using the following formula:
Here, n is the number of summed trapezoids formed by n +1 trapezoids, C reflects corresponding plasma concentrations; (n, n +1), tn +1, and δt represent the change in time between these plasma concentrations. AUMC extrapolated to infinity is

MRT extrapolated to infinity was calculated using the following formula:

Systemic availability of FBZ was determined using the following relationship:
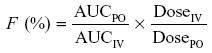
where PO stands for oral administration and IV indicates the intravenous mode of administration.
References
Landuyt J, Debackere M, Delbeke F, McKellar Q. A high performance liquid chromatographic method for the determination of febantel and its major metabolites in lamb plasma. Biomed. Chromatogr. 1993;7:78–81. | |
Ermer J. Validation in pharmaceutical analysis. Part I an integrated approach. J Pharm Biomed Anal. 2001;24:755–767. | |
Wernimont GT. Intralaboratory development of an analytical process. In: Spendley W, editor. Use of Statistics to Develop and Evaluate Analytical Methods. Gaithersburg, MD: AOAC International; 1985:11–30. |
 © 2015 The Author(s). This work is published and licensed by Dove Medical Press Limited. The full terms of this license are available at https://www.dovepress.com/terms.php and incorporate the Creative Commons Attribution - Non Commercial (unported, v3.0) License.
By accessing the work you hereby accept the Terms. Non-commercial uses of the work are permitted without any further permission from Dove Medical Press Limited, provided the work is properly attributed. For permission for commercial use of this work, please see paragraphs 4.2 and 5 of our Terms.
© 2015 The Author(s). This work is published and licensed by Dove Medical Press Limited. The full terms of this license are available at https://www.dovepress.com/terms.php and incorporate the Creative Commons Attribution - Non Commercial (unported, v3.0) License.
By accessing the work you hereby accept the Terms. Non-commercial uses of the work are permitted without any further permission from Dove Medical Press Limited, provided the work is properly attributed. For permission for commercial use of this work, please see paragraphs 4.2 and 5 of our Terms.