")
Back to Journals » Cancer Management and Research » Volume 12
Plasma cfDNA as a Potential Biomarker to Evaluate the Efficacy of Chemotherapy in Gastric Cancer
Authors Zhong Y, Fan Q, Zhou Z, Wang Y, He K , Lu J
Received 22 December 2019
Accepted for publication 21 April 2020
Published 5 May 2020 Volume 2020:12 Pages 3099—3106
DOI https://doi.org/10.2147/CMAR.S243320
Checked for plagiarism Yes
Review by Single anonymous peer review
Peer reviewer comments 4
Editor who approved publication: Dr Antonella D'Anneo
Yuejiao Zhong,1,* Qingyu Fan,2,* Zhaofei Zhou,1 Yajing Wang,1 Kang He,1 Jianwei Lu1
1Jiangsu Cancer Hospital and Jiangsu Institute of Cancer Research and the Affiliated Cancer Hospital of Nanjing Medical University, Nanjing, People’s Republic of China; 2Xuzhou Medical University Graduate School, Xuzhou, People’s Republic of China
*These authors contributed equally to this work
Correspondence: Jianwei Lu Email [email protected]
Objective: To investigate the clinical value of plasma cell-free DNA (cfDNA) as a potential biomarker for advanced gastric cancer (GC).
Patients and Methods: One hundred and six cases of advanced gastric cancer patients receiving chemotherapy were selected as study objects. Another 40 healthy volunteers were included as control groups. Plasma cfDNA concentration was detected by (SuperbDNATM) hybridization. Changes in cfDNA concentration during chemotherapy in patients with gastric cancer whose efficacy was assessed as partial response (PR), stable disease (SD) and disease progression (PD) were analyzed respectively. The relationship between the level of cfDNA and the efficacy of chemotherapy and clinical characteristics was also explored. In addition, cfDNA and other tumor markers were subjected to specificity and sensitivity analyses using ROC.
Results: cfDNA concentration in advanced GC patients was significantly higher than that in healthy controls (P< 0.05). The concentration of plasma cfDNA in patients with PD showed an increasing trend over time. The concentration of plasma cfDNA in patients with therapeutic effect of PR decreased over time. In patients with therapeutic effect of SD, the plasma DNA concentration showed a stable trend over time. There was no significant correlation between cfDNA concentration and factors including gender, age, pathological type, CA724, CA125,CA199, AFP and CEA. ROC results showed that the area under the curve of cfDNA was larger than other tumor markers.
Conclusion: Plasma cfDNA concentration was significantly increased in patients with gastric cancer, and its diagnostic efficacy was superior to that of traditional tumor markers. It can be used as a tumor biomarker to monitor the efficacy of chemotherapy for gastric cancer.
Keywords: advanced gastric cancer, cfDNA, tumor marker
Introduction
Gastric cancer (GC) (5.7%) is the fifth most common malignant tumor worldwide and the third leading cause of cancer-related deaths, after lung cancer (11.6%), breast cancer (11.6%), colorectal cancer (10.2%), and prostate cancer (7.1%). More than 1 million new patients are diagnosed with GC every year.1,2 Some GC patients receive surgery and adjuvant chemotherapy immediately, while some patients are already in the advanced stage at the time of diagnosis and have lost the opportunity for surgery and have to undergo palliative chemotherapy. For patients whose disease progress is hard to be improved, it is urgent and meaningful to find a method that can quickly and effectively predict the patient’s condition and efficacy. Conventional examination methods such as CT, MRI, and electronic endoscopy can only reflect the tumor status of a patient at a certain timing, and do little to predict the effect of the patient.3,4 Therefore, the role of GC-related hematological indicators will become increasingly important. For a long time, the detection of serum physiological indicators or parameters has been an important auxiliary means for clinical cancer diagnosis.5 Currently, the clinically popular gastrointestinal tumor markers CEA, CA19-9 and CA 72–4 have low diagnostic efficacy.6,7 Therefore, we urgently need to find simpler, more easily accepted and high diagnostic value examination methods to improve the early detection rate of GC, help clinicians to judge changes in patients’ condition, and improve the survival rate of GC patients.
cfDNA is an extracellular DNA fragment that exists in plasma or serum. Relevant reports have now confirmed that cfDNA is circulated and implanted in the distant part of the body through peripheral blood circulation, and is one of the important ways for patients to develop micrometastases.8 As a new tumor biomarker, peripheral blood cfDNA may have higher sensitivity and specificity.9 Many studies have found that cfDNA levels in cancer patients are significantly higher than those in normal people.10,11 Among them, the plasma cfDNA level of GC patients is significantly higher than that of normal people, suggesting that plasma cfDNA can be used as a predictor of GC patients.12 In this study, (SuperbDNATM) hybridization technology was used to quantitatively monitor the plasma cfDNA concentration. At the same time, multiple tumor markers in serum of GC patients were measured, and their correlation with GC diagnosis and clinicopathological characteristics were analyzed and compared. In addition, cfDNA and other tumor markers’ diagnostic efficacy was investigated by establishing ROC curve.
Patients and Methods
Specimens Collection
A total of 106 patients with advanced GC who underwent chemotherapy in Jiangsu Cancer Hospital from June 2018 to February 2019 were selected as the research subjects. The clinical baseline data are shown in Table 1. Inclusion criteria includes (1) the patient’s diagnosis confirmed by pathological histology; (2) the case data completely recorded; (3) the KPS score greater than 60. Exclusion criteria includes (1) patients suffering from other malignant tumors; (2) patients suffering from heart, liver, kidney and other basic diseases; (3) patients with acute and chronic infectious diseases; (4) patients with mental illness who could not cooperate with normal medical activities. During the same period, another 40 healthy adults served as the control group, including 15 males and 25 females. All trial participants signed the informed consent agreement before participating in the study. The clinical trial was approved by the clinical research ethics committee of the Jiangsu Cancer Hospital and was conducted in accordance with the Declaration of Helsinki.
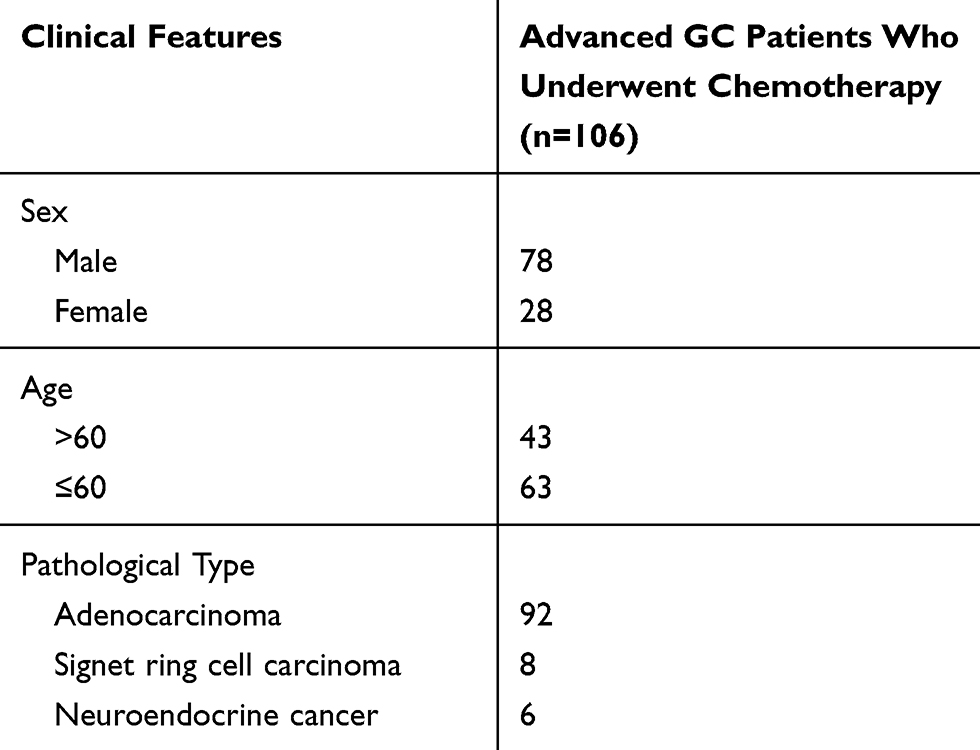 |
Table 1 Clinical Baseline Data of GC Patients |
Plasma Separation and cfDNA Detection
All patients received GC chemotherapy were chosen to collect peripheral blood samples before each cycle of chemotherapy. Venous blood was collected in an EDTA blood tube and centrifuged at 3000 rpm for 10 minutes. 600 μL of plasma was either used directly for cfDNA detection or stored frozen at −80 ° C. The cfDNA concentration was measured from 50 μL of plasma using the QuantiDNA Direct cfDNA Test (DiaCarta) according to the manufacturer’s instructions.
Detection of Tumor Markers
Serum was obtained by centrifuging fasting venous blood using a fully automatic electrochemical luminometer E601 and a kit (Roche, Switzerland). The reference range of each detection index is as follows: CA199 <39 U/mL, CA125 <35 U/mL, CEA <3.5 ng/mL, AFP <7 ng/mL, CA724 <6.9U/L.
Chemotherapy
The chemotherapy is as following, with at least 6 cycles of chemotherapy.
- Apatinib + tigio: according to the body surface area of the patient, the oral tigio dose is 80mg to 120mg/day twice a day for two weeks and stopping for one week as a course of treatment; the apatinib oral dose is 425mg-850mg/day until the patient’s tolerated dose or the tumor progression.
- Oxaliplatin + capecitabine: Intravenous infusion of oxaliplatin is at 130mg/
 for 2 hours at day 1. Capecitabine is orally administered at a dose of 1000 mg/
 twice a day for 3 weeks as a course of treatment.
Efficacy Evaluation
The patients were evaluated for efficacy after 2 cycles of chemotherapy. The evaluation criteria were: partial response (PR): the diameter of the patient’s lesion was reduced by >30% compared with that before treatment, and the maintenance time was greater than 4 weeks. Stable disease (SD): The patient’s lesion has a diameter of less than 30% or no increase compared with that before treatment. Disease progression (PD): The patient has a new lesion or a larger diameter than that before treatment.
Statistical Analysis
The cfDNA quantitative results were recorded as mean ± standard deviation (x ± sd). Kruskal–Wallis rank sum test was used to compare the groups. The measurement data were compared by t test, and the analysis of changes in plasma cfDNA concentration during chemotherapy in patients with GC was analyzed by one-way analysis of variance. SPSS 21.0 software was used for statistical analysis. P <0.05 was considered statistically significant.
Results
Comparison of cfDNA Concentration in Peripheral Blood of Healthy Individuals and GC Patients
The results of detecting the cfDNA concentration are shown in Figure 1. The plasma cfDNA concentration in patients with advanced GC before chemotherapy was 29.52 ± 21.64 ng/mL. The normal human plasma cfDNA concentration was 12.28 ± 7.72 ng/mL. The cfDNA concentration of GC patients was significantly higher than that of healthy controls (P <0.05).
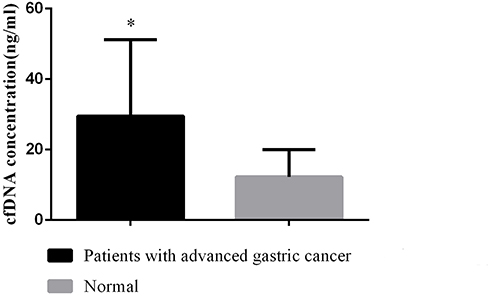 |
Figure 1 Comparison of plasma cfDNA concentrations in normal and advanced GC chemotherapy patients. Note: *Indicates P <0.05, compared with the normal group. |
Study on the Changes of Plasma cfDNA Concentration During GC Chemotherapy
A one-way variance analysis was used to analyze the changes of plasma cfDNA concentration during chemotherapy in GC patients. It was found that: (1) The cfDNA concentrations measured in patients with advanced GC chemotherapy whose efficacy was evaluated as PD at 30d, 60d, and 90d were 21.95 ± 13.56 ng/mL, 24.78 ± 12.90 ng/mL and 41.17 ± 20.56 ng/mL, respectively. The mean value is shown in Figure 2A. The results of univariate analysis of variance showed F = 11.278, and P = 0.000. So, the overall average of the cfDNA concentration at 3 different time points was not considered as equal; the linear correspondence of the trend was F = 19.343 and P = 0.000, indicating that the plasma cfDNA concentration of patients showed an increasing linear change trend over time. (2) The cfDNA concentrations measured at 30d, 60d, and 90d of patients with advanced GC chemotherapy whose efficacy was evaluated as PR were 24.59 ± 8.20 ng/mL, 21.88 ± 8.16 ng/mL and 15.97 ± 9.02 ng/mL, respectively (Figure 2B). One-way analysis of variance showed F = 2.708, and P = 0.085. It can be considered that there is no significant difference in the overall average of cfDNA concentration at three different time points. The linear correspondence of the trend test showed F = 5.177, and P = 0.031, indicating that the plasma cfDNA concentration of patients decreased linearly with time. (3) The cfDNA concentrations measured in patients with advanced GC chemotherapy whose efficacy was evaluated as SD at 30d, 60d, and 90d were 22.52 ± 13.99 ng/mL, 22.33 ± 11.56 ng/mL and 21.44 ± 11.22 ng/mL, respectively (Figure 2C). One-way analysis of variance showed F = 0.123, and P = 0.884. It can be considered that there is no significant difference in the overall average change of cfDNA concentration at three different time points. The linear correspondence of the trend test showed F = 0.215 and P = 0.643, indicating that the plasma cfDNA concentration of patients showed no significant difference with time and presented stable trend.
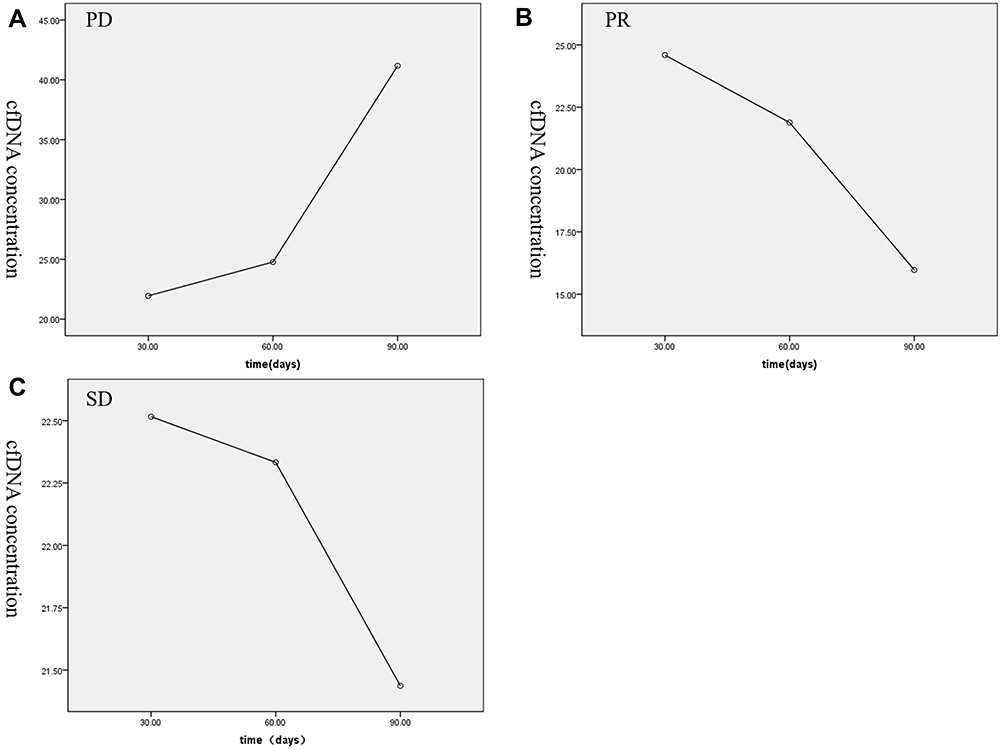 |
Figure 2 Mean cfDNA concentration of GC patients with different curative effects at 30d, 60d, and 90d. (A) Mean cfDNA concentration of the patients with advanced GC chemotherapy evaluated for PD at 30d, 60d, and 90d; (B) mean cfDNA concentrations of the patients with advanced GC chemotherapy evaluated as PR at 30d, 60d, and 90d; (C) mean cfDNA concentrations of the patients with advanced GC chemotherapy evaluated as SD at 30d, 60d, and 90d. |
Concentrations of Tumor Markers CA199, CA125, CEA, AFP, and CA724 in Serum
Patients with advanced GC chemotherapy showed CA199 concentration of 30.35 ± 25.10 µ/mL, CA125 concentration of 32.16 ± 23.83 µ/mL, CEA concentration of 6.86 ± 4.30 ng/mL, AFP concentration of 7.71 ± 4.59 ng/mL, and CA724 concentration of 10.17 ± 13.07 µ/L (Figure 3).
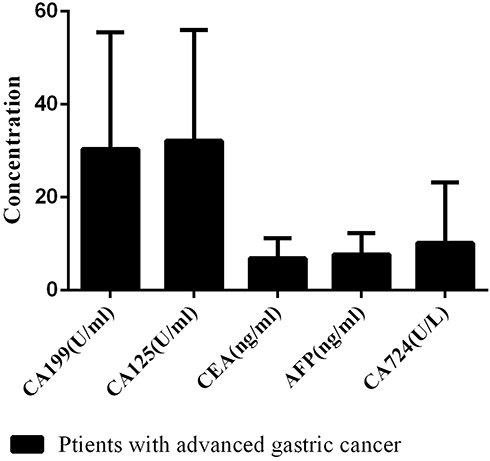 |
Figure 3 Serum CA199, CA125, CEA, AFP, and CA724 concentrations in patients with advanced GC chemotherapy. |
Relationship Between cfDNA Concentration and Clinical Characteristics in Patients Receiving GC Chemotherapy
The cfDNA concentration in patients with advanced GC chemotherapy was detected and its correlation with clinical characteristics was analyzed. Related analysis results are shown in Table 2. The cfDNA concentration of patients with advanced GC chemotherapy was not significantly related to the expression of CA724, CA125, CA19-9, AFP and CEA in gender, age, and pathological type (P >0.05).
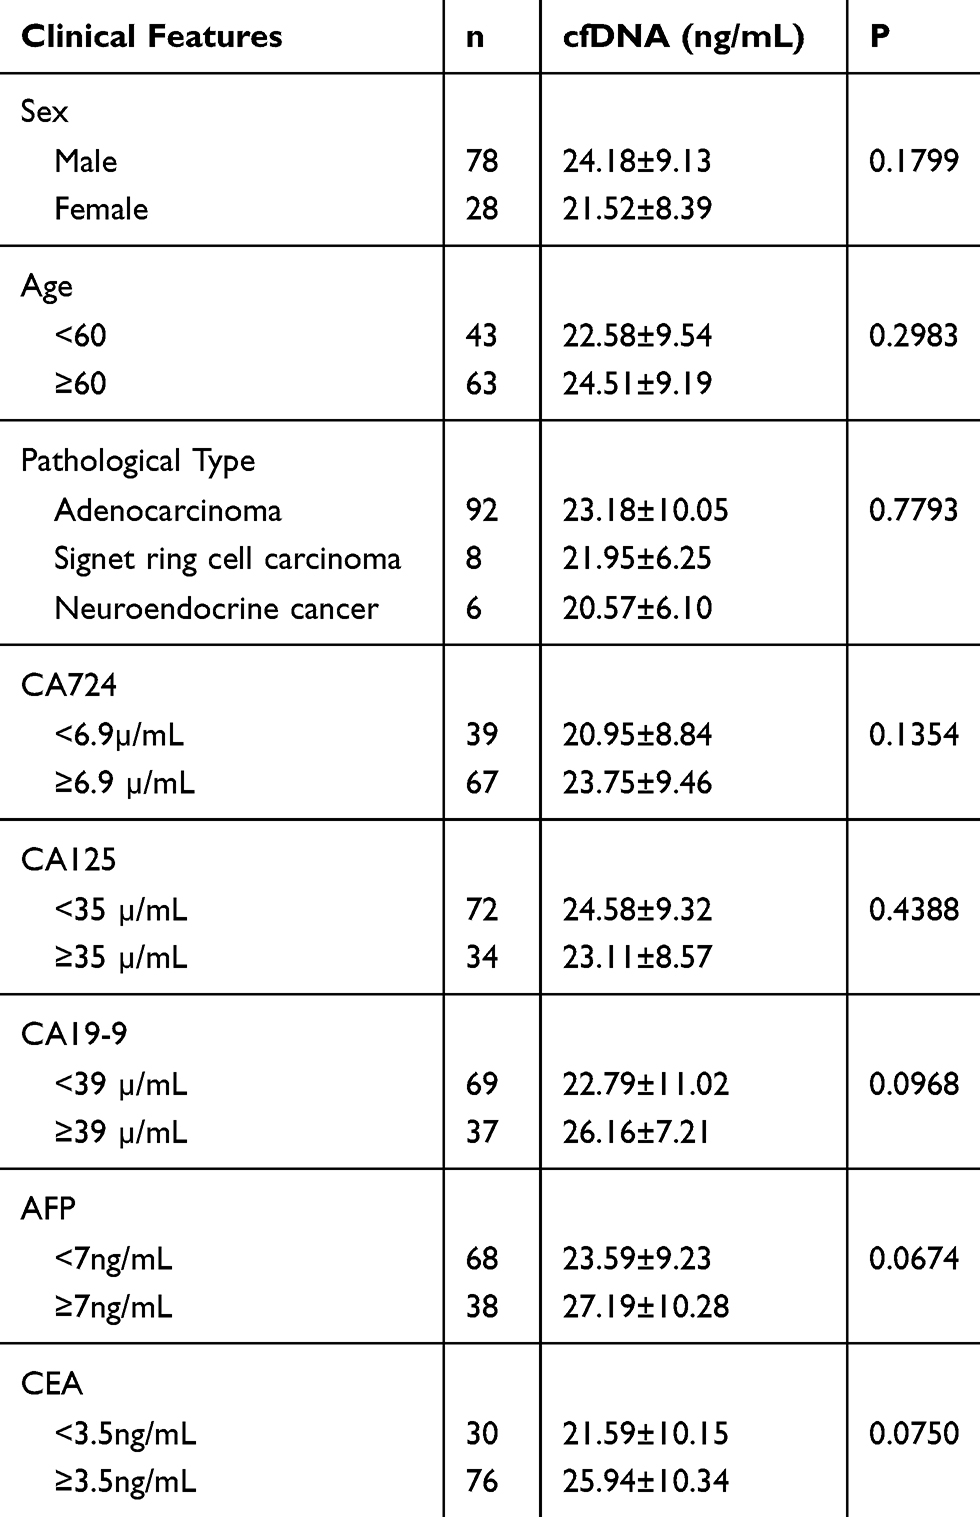 |
Table 2 Correlation Between Plasma cfDNA Concentration and Clinical Characteristics Before Chemotherapy in Patients with Advanced GC (n = 106) |
Establishing ROC Curves of cfDNA and Traditional Markers
According to the plasma cfDNA concentration and the tumor biomarkers content in patients with advanced gastric cancer, their specificity and sensitivity in gastric cancer diagnosis were calculated, and then the corresponding ROC curves were drawn. The results are shown in Figure 4. The AUC of cfDNA is larger than that of CA199, CA125, CEA, AFP and CA724. The best cut-off value of cfDNA was 15.36ng/mL. At this time, the sensitivity and specificity to evaluate the efficacy of GC chemotherapy were 93.7% and 45.2%, respectively.
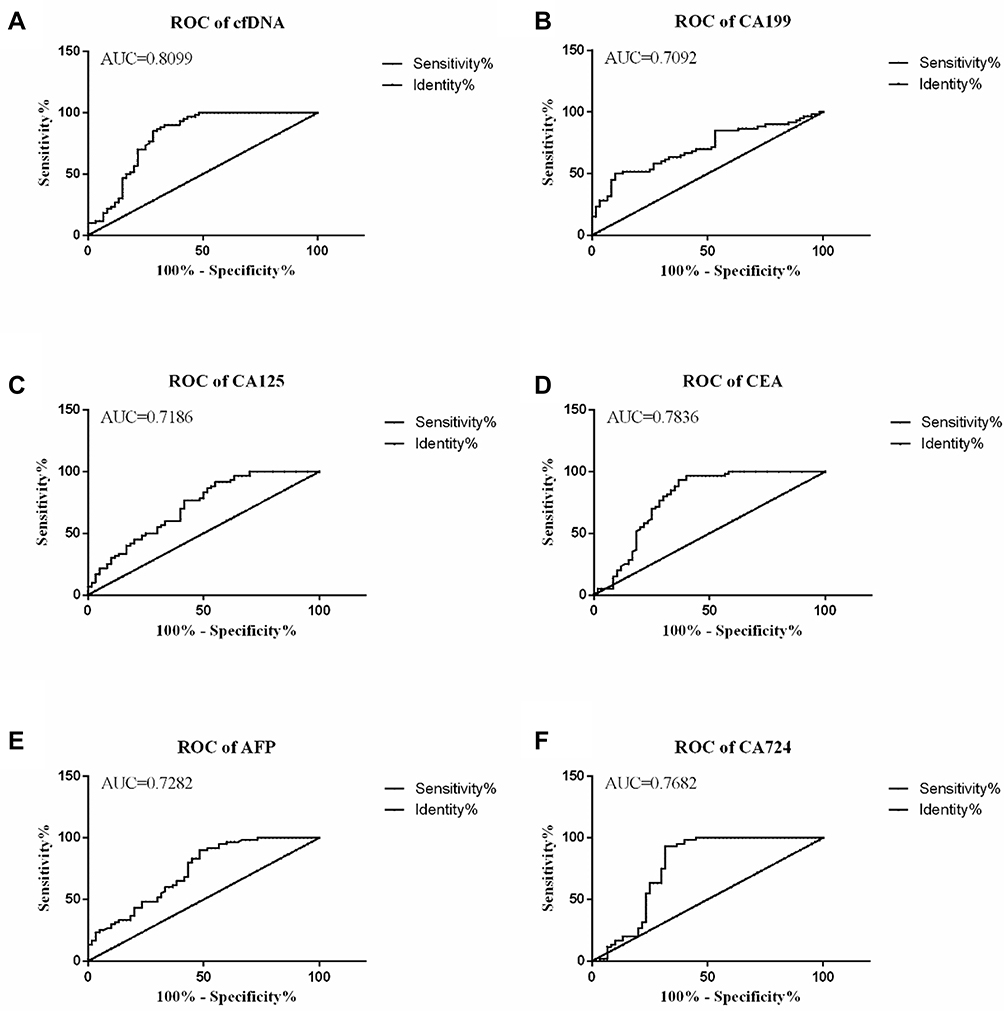 |
Figure 4 ROC curve of cfDNA and traditional tumor markers. (A) ROC curve of cfDNA; (B) ROC curve of CA199; (C) ROC curve of CA125; (D) ROC curve of CA125; (D) ROC curve of CEA; (E) AFP ROC curve; and (F) ROC curve of CA724. |
Discussion
At present, the diagnosis of GC mainly depends on imaging examinations such as electronic endoscopy and X-ray barium meal. Gastroscopy can directly observe the situation in the cavity, and fine needle aspiration biopsy can be performed at the same time as the examination, but the damage to the patient is large and the cost is high, which is not suitable as a tumor screening method. X-ray barium meal examination can dynamically observe the morphology and peristalsis of the stomach, with less pain, but it cannot take a biopsy for histological examination, and it is difficult to make a clear diagnosis of GC. The clinical serum biological indicators (CA19-9, CA125, CA72-4, CEA, etc) which are commonly used in clinical practice today are helpful to the diagnosis and detection of GC, and the specificity is not high.13 Therefore, finding serum biological indicators that are more meaningful for GC diagnosis and disease detection has become a research hotspot in recent years. In this era, the application of cfDNA in the clinical treatment of malignant tumors has attracted an increasing attention.14
In the plasma of healthy people, cfDNA mainly comes from apoptotic cells, and in addition to apoptotic cells, the cfDNA in cancer patients’ plasma also comes from DNA actively released by tumor cells and by tumor cell necrosis and lysis.15 The half-life of cfDNA in the blood is very short, only about 16 min,16 so cfDNA can be used for dynamic monitoring. The related report of gallbladder cancer in 2016 pointed out that the plasma cfDNA level of patients with gallbladder cancer was significantly increased, and the difference level could be used as a diagnostic marker to distinguish gallbladder cancer from cholecystitis.17 Normando et al12 found that compared with normal people, the cfDNA concentration of patients with advanced GC was significantly increased. It was speculated that the cfDNA in patients was derived from tumors. Further survival analysis showed that patients with lower cfDNA had longer Disease-free survival. In addition, in recent years, many reports have confirmed the important role of cfDNA in the diagnosis and prognosis of renal cancer, colorectal cancer, neuroblastoma, and pancreatic cancer.18–21 Based on the above research results, cfDNA may be a specific, non-invasive and cost-effective new biomarker, which has great potential value for clinical cancer detection.
This study performed a quantitative study on the plasma cfDNA concentration changes in patients with advanced GC chemotherapy during chemotherapy. The results showed that the plasma cfDNA concentration of patients with advanced GC was significantly different from that of healthy people. Therefore, we can speculate that the loss of inhibited division, proliferation, and strong metabolism of cancer cells has caused a large amount of DNA in apoptotic or necrotic cancer cells to be released into the blood,22 resulting in a significantly higher plasma cfDNA concentration in GC patients than that in healthy people. Long-term follow-up of patients with advanced GC chemotherapy can be followed to observe the subsequent changes in cfDNA concentration. In future studies, we can correlate the cfDNA concentration level of GC patients with the size and metastasis of cancer lesions to further explore the relationship between plasma cfDNA concentration and tumor burden treatment, which will help us to analyze the number of tumor cells, tumor size and total amount of cancer lesions in GC patients.
Lan et al measured preoperative and postoperative cfDNA levels in 18 GC patients who did not receive adjuvant chemotherapy, and found that patients had higher cfDNA levels at 6 months after operation and recurrence, and tumor recurrence after gastric cancer CfDNA levels continued to increase in patients,23 suggesting that increased cfDNA levels might indicate a worsening of the disease. In this study, we analyzed the changes in plasma cfDNA concentration during the treatment of patients with advanced GC chemotherapy and found that the plasma cfDNA concentration showed an increasing trend over time in patients with a curative effect evaluation of PD. The plasma cfDNA concentration of patients with curative effect evaluation showed a decreasing trend over time, but there was no significant difference in the change trend. Based on the source and release characteristics of cfDNA, it was speculated that PR patients released cfDNA due to the rapid reduction of tumor tissue during chemotherapy. The content also increased temporarily and the overall tumor burden of PR patients gradually decreased over time. Further research could extend the experimental period and observe the trend of plasma cfDNA concentration changes in PR patients for a long time. The plasma cfDNA concentration of patients with SD as the curative effect had no significant difference in the trend over time, indicating that the plasma cfDNA concentration showed a stable trend when the cancer patients were stable and the tumor load was either significantly increased or decreased. The above research results show that there is a close relationship between the plasma cfDNA concentration and the occurrence and development of tumors. Monitoring cfDNA concentration changes can help clinicians predict the chemotherapy effect of patients and show their potential as GC tumor markers.
After a systematic analysis of the clinicopathological characteristics of patients with advanced GC chemotherapy, we found that plasma cfDNA has no significant correlation with gender, age, pathological type and expression of CA724,CA12-5, CA-19-9, AFP and CEA. In future research, the combined detection of cfDNA and current tumor biomarkers can be used as a method to monitor GC patients, and by long-term observation, to explore the relationship between the level of cfDNA concentration and changes and the long-term survival rate of GC patients.
The ROC curve can comprehensively and accurately assess the sensitivity and specificity of tumor markers. Miao et al11 studied the clinical value of plasma cfDNA in breast cancer patients. The results of establishing the ROC curve of cfDNA showed that the sensitivity of cfDNA concentration and integrity was high. Both sex and specificity are higher than those of traditional tumor biomarkers, indicating that cfDNA can be used as a biomarker for breast cancer. Lan et al monitored postoperative cfDNA levels in patients with gastrointestinal cancer and found that they are more sensitive than carcinoembryonic antigen levels in predicting recurrence.23 CA125, CA19-9, CA724, AFP, CEA are traditional tumor markers commonly used in GC monitoring in clinical practice. In this study, we also established a ROC curve of cfDNA concentration and traditional tumor markers to compare the diagnostic efficacy of each indicator. The results showed that the AUC value of cfDNA is higher than other traditional tumor markers, and its sensitivity at the cut-off value is as high as 93.7%, indicating that the diagnostic accuracy of cfDNA is superior to CA125, CA19-9, CA724, AFP and CEA, and has the potential of tumor markers. Subsequent trials can examine the sensitivity and specificity of cfDNA combined with traditional tumor marker detection for advanced GC monitoring, in order to find the best detection method for clinically effective evaluation of chemotherapy in patients with advanced GC.
In summary, the monitoring of plasma cfDNA concentration can provide important clues for clinicians to judge the changes of patients with advanced GC chemotherapy, provide a theoretical basis for the correlation between cfDNA and tumor burden, and provide new evidence for the diagnosis and evaluation of GC. This idea is expected to become a non-invasive molecular diagnostic method for screening high-risk GC populations.
Disclosure
The authors report no conflicts of interest in this work.
References
1. Chen W, Zheng R, Baade PD, et al. Cancer statistics in China, 2015. CA Cancer J Clin. 2016;66(2):115–132. doi:10.3322/caac.21338
2. Bay F, Ferlay J, Soejomataram I, et al. Global cancer statistics 2018: GLOBCAN estimates of incidence and mortality worldwide for 36 cancers in 185 countries. CA Cancer J Clin. 2018;68(6):394–424. doi:10.3322/caac.21492
3. Lee JW, Son MW, Chung IK, et al. Significance of CT attenuation and F-18 fluorodeoxyglucose uptake of visceral adipose tissue for predicting survival in gastric cancer patients after curative surgical resection. Gastric Cancer. 2019. doi:10.3390/cancers11081135
4. Tang L, Wang XJ, Baba H, et al. Gastric cancer and image-derived quantitative parameters: part 2-a critical review of DCE-MRI and 18F-FDG PET/CT findings. Eur Radiol. 2019;30(2).
5. Zhang Y, Zhu C, Lu X. Advances in serum biomarkers for early diagnosis of gastric cancer. Zhejiang Da Xue Xue Bao Yi Xue Ban. 2019;48(3):326–333.
6. Chen C, Chen Q, Zhao Q, et al. Value of combined detection of serum CEA, CA72-4, CA19-9, CA15-3 and CA12-5 in the diagnosis of gastric cancer. Ann Clin Lab Sci. 2017;47(3):260–263.
7. Feng F, Tian Y, Xu G, et al. Diagnostic and prognostic value of CEA, CA19-9, AFP and CA125 for early gastric cancer. BMC Cancer. 2017;17(1):737. doi:10.1186/s12885-017-3738-y
8. Volckmar AL, Sültmann H, Riediger A, et al. A field guide for cancer diagnostics using cell-free DNA: from principles to practice and clinical applications. Genes Chromosomes Cancer. 2018;57(3):123–139. doi:10.1002/gcc.22517
9. Valpione S, Gremel G, Mundra P, et al. Plasma total cell-free DNA (cfDNA) is a surrogate biomarker for tumour burden and a prognostic biomarker for survival in metastatic melanoma patients. Eur J Cancer. 2018;88:1–9. doi:10.1016/j.ejca.2017.10.029
10. Yu Z, Qin S, Wang H. Alter circulating cell-free DNA variables in plasma of ovarian cancer patients. J Obstet Gynaecol Res. 2019;45:2237–2242. doi:10.1111/jog.14102
11. Miao Y, Fan Y, Zhang L, et al. Clinical value of plasma cfDNA concentration and integrity in breast cancer patients. Cell Mol Biol (Noisy-Le-Grand). 2019;65(6):64–72. doi:10.14715/cmb/2019.65.6.11
12. Normando SRC, Delgado PO, Rodrigues AKSB, et al. Circulating free plasma tumor DNA in patients with advanced gastric cancer receiving systemic chemotherapy. BMC Clin Pathol. 2018;18:12. doi:10.1186/s12907-018-0079-y
13. Yu J, Zheng W. An alternative method for screening gastric cancer based on serum levels of CEA, CA19-9, and CA72-4. J Gastrointest Cancer. 2018;49(1):57–62. doi:10.1007/s12029-016-9912-7
14. Qian C, Ju S, Qi J, et al. Alu-based cell-free DNA: a novel biomarker for screening of gastric cancer. Oncotarget. 2016;8(33):54037–54045. doi:10.18632/oncotarget.11079
15. Stewart CM, Tsui DWY. Circulating cell-free DNA for non-invasive cancer management. Cancer Genet. 2018;229:169–179. doi:10.1016/j.cancergen.2018.02.005
16. Stewart CM, Kothari PD, Mouliere F, et al. The value of cell-free DNA for molecular pathology. J Pathol. 2018;244(5):616–627. doi:10.1002/path.5048
17. Swati K, Shikha T, Nuzhat H, et al. Quantification of circulating free DNA as a diagnostic marker in gall bladder cancer. Pathol Oncol Res. 2017;23:91–97. doi:10.1007/s12253-016-0087-0
18. Inessa S, Liudmyla T, Kateryna O, et al. Concentration and methylation of cell-free DNA from blood plasma as diagnostic markers of renal cancer. Dis Markers. 2016;2016:3693096.
19. Bedin C, Enzo MV, Del Bianco P, et al. Diagnostic and prognostic role of cell-free DNA testing for colorectal cancer patients. Int J Cancer. 2017;140:1888–1898.
20. Su Y, Wang L, Wang X, et al. Dynamic alterations of plasma cell free DNA in response to chemotherapy in children with neuroblastoma. Cancer Med. 2019. doi:10.1002/cam4.2045
21. Lapin M, Oltedal S, Tjensvoll K, et al. Fragment size and level of cell-free DNA provide prognostic information in patients with advanced pancreatic cancer. J Transl Med. 2018;16(1):300. doi:10.1186/s12967-018-1677-2
22. Goebel G, Zitt M, Zitt M, et al. Circulating nucleic acids in plasma or serum as prognostic and predictive markers in patients with solid neoplasias. Dis Markers. 2005;21(3):105–120. doi:10.1155/2005/218759
23. Lan YT, Chen MH, Fang WL, et al. Clinical relevance of cell-free DNA in gastrointestinal tract malignancy. Oncotarget. 2017;8(2):3009–3017. doi:10.18632/oncotarget.13821
 © 2020 The Author(s). This work is published and licensed by Dove Medical Press Limited. The full terms of this license are available at https://www.dovepress.com/terms.php and incorporate the Creative Commons Attribution - Non Commercial (unported, v3.0) License.
By accessing the work you hereby accept the Terms. Non-commercial uses of the work are permitted without any further permission from Dove Medical Press Limited, provided the work is properly attributed. For permission for commercial use of this work, please see paragraphs 4.2 and 5 of our Terms.
© 2020 The Author(s). This work is published and licensed by Dove Medical Press Limited. The full terms of this license are available at https://www.dovepress.com/terms.php and incorporate the Creative Commons Attribution - Non Commercial (unported, v3.0) License.
By accessing the work you hereby accept the Terms. Non-commercial uses of the work are permitted without any further permission from Dove Medical Press Limited, provided the work is properly attributed. For permission for commercial use of this work, please see paragraphs 4.2 and 5 of our Terms.