")
Back to Journals » International Journal of Nanomedicine » Volume 10 » Issue 1
Photo activation of HPPH encapsulated in “Pocket” liposomes triggers multiple drug release and tumor cell killing in mouse breast cancer xenografts
Authors Sine J, Urban C, Thayer D, Charron H, Valim N, Tata D, Schiff R, Blumenthal R, Joshi A, Puri A
Received 2 August 2014
Accepted for publication 11 October 2014
Published 19 December 2014 Volume 2015:10(1) Pages 125—145
DOI https://doi.org/10.2147/IJN.S72143
Checked for plagiarism Yes
Review by Single anonymous peer review
Peer reviewer comments 2
Editor who approved publication: Dr Thomas Webster
Jessica Sine,1,* Cordula Urban,2,* Derek Thayer,1 Heather Charron,2 Niksa Valim,2 Darrell B Tata,3 Rachel Schiff,4 Robert Blumenthal,1 Amit Joshi,2 Anu Puri1
1Membrane Structure and Function Section, Basic Research Laboratory, Center for Cancer Research, National Cancer Institute – Frederick, Frederick, MD, USA; 2Department of Radiology, Baylor College of Medicine, Houston, TX, USA; 3US Food and Drug Administration, CDRH/OSEL/Division of Physics, White Oak Campus, MD, USA; 4Lester and Sue Smith Breast Center, Baylor College of Medicine, Houston, TX, USA
*These authors contributed equally to this work
Abstract: We recently reported laser-triggered release of photosensitive compounds from liposomes containing dipalmitoylphosphatidylcholine (DPPC) and 1,2 bis(tricosa-10,12-diynoyl)-sn-glycero-3-phosphocholine (DC8,9PC). We hypothesized that the permeation of photoactivated compounds occurs through domains of enhanced fluidity in the liposome membrane and have thus called them “Pocket” liposomes. In this study we have encapsulated the red light activatable anticancer photodynamic therapy drug 2-(1-Hexyloxyethyl)-2-devinyl pyropheophorbide-a (HPPH) (Ex/Em410/670 nm) together with calcein (Ex/Em490/517 nm) as a marker for drug release in Pocket liposomes. A mole ratio of 7.6:1 lipid:HPPH was found to be optimal, with >80% of HPPH being included in the liposomes. Exposure of liposomes with a cw-diode 660 nm laser (90 mW, 0–5 minutes) resulted in calcein release only when HPPH was included in the liposomes. Further analysis of the quenching ratios of liposome-entrapped calcein in the laser treated samples indicated that the laser-triggered release occurred via the graded mechanism. In vitro studies with MDA-MB-231-LM2 breast cancer cell line showed significant cell killing upon treatment of cell-liposome suspensions with the laser. To assess in vivo efficacy, we implanted MDA-MB-231-LM2 cells containing the luciferase gene along the mammary fat pads on the ribcage of mice. For biodistribution experiments, trace amounts of a near infrared lipid probe DiR (Ex/Em745/840 nm) were included in the liposomes. Liposomes were injected intravenously and laser treatments (90 mW, 0.9 cm diameter, for an exposure duration ranging from 5–8 minutes) were done 4 hours postinjection (only one tumor per mouse was treated, keeping the second flank tumor as control). Calcein release occurred as indicated by an increase in calcein fluorescence from laser treated tumors only. The animals were observed for up to 15 days postinjection and tumor volume and luciferase expression was measured. A significant decrease in luciferase expression and reduction in tumor volume was observed only in laser treated animal groups injected with liposomes containing HPPH. Histopathological examination of tumor tissues indicated tumor necrosis resulting from laser treatment of the HPPH-encapsulated liposomes that were taken up into the tumor area.
Keywords: laser-triggered payload release, photo-agents, photopolymerizable phospholipids, tumor regression, phototriggering
Introduction
Site specific delivery of anticancer agents to tumors (with minimum damage to normal cells/tissue) is regarded as the holy grail of cancer therapy.1–4 Cancer nanotechnology platforms have shown promise5–7 and several lipid-based drug delivery systems (primarily liposomes) are currently in the clinics and/or in clinical trials.2,8,9 An important requirement for effective drug delivery, however, is the precise spatial and temporal release of therapeutic agents from the delivery vehicles at the target site. The developments of on-demand drug release (triggering) approaches are based either on making use of the biology of tumor cells, which result from abnormal proliferation (internal trigger), or on the unique physical properties of the fabricated delivery vehicles (external trigger). Examples of internal triggers include low pH in the tumor microenvironment and overexpression of enzymes, receptors and other tumor-associated antigens. In the liposome field of research, triggering molecules include liposome components that are sensitive to light, temperature or pH changes, and to degradation by over-expressed enzymes (eg, phospholipases).2,10
Electromagnetic radiation-sensitive liposomes present a promising platform that relies on engineered phospholipid molecules which respond to light irradiation.11,12 The principles of phototriggering include photopolymerization of lipids,13 photosensitization by membrane-anchored hydrophobic probes,14–16 or photoisomerization of photoreactive lipids.17 To date, none of the lipid formulations developed have been successfully demonstrated for in vivo phototriggering applications. Lack of adequate photon energy produced by the light source(s) or the inability of light to penetrate into biological tissues appear to be the most common roadblocks that have hampered the success of phototriggerable liposomal platforms in vivo.11 Thus, further research on liposome formulations that are sensitive to tissue-penetrating wavelengths are warranted for future clinical success of phototriggerable liposomes. It should be pointed out that several liposome formulations, which do not contain photosensitive lipids, are available for enhanced delivery of photodynamic therapy (PDT) drugs. One example is Visudyne a PDT drug containing liposome formulation used to treat macular degeneration using a 694 nm laser treatment.18–21 Although, these formulations were primarily developed with the aim to deliver the PDT drugs only, critical technical information attained from these systems has proven to be very useful toward the development of clinically viable phototriggerable liposomes (such as our Pocket liposomes described here).
One approach to achieve in vivo phototriggering entails inclusion of near infrared (NIR) wavelength-specific photoreactive molecules (primarily lipidic and/or hydrophobic in nature) utilized in conjunction with the photoactivatable lipid. Usage of carbocyanine dyes to “disrupt” liposomes was first reported by Miller et al in the early 1980s. This group utilized the cationic dye, 1,1′-didodecyl-3,3,3′,3′-tetramethylindocarbocyanine perchlorate (DiI), and demonstrated destabilization of DOPE:SorbPC (3:1) liposomal membranes when irradiated at 550 nm wavelength.22 Thompson et al developed liposomes based on photochemical triggering of plasmenylcholine by a red or near infrared (NIR) sensitizer, using hydrophobic molecules such as Zn-phthalocyanine, octabutoxyphthalocyanine, and bacterio-chlorophyll-a.23 These sensitizing agents are known to absorb between 630 and 820 nm presumably inducing membrane phase changes that lead to phototriggering of liposomes and release of contents. Although these wavelengths have the advantage of deeper tissue penetration for clinical therapeutics, no drug release experiments have been presented to date.11,24 Recent improvements in laser technology have yielded greater ability to control laser systems through the selections of wavelength, intensity, beam profile diameter, and the delivery of laser energy either in continuous wave or in pulsed modes.25 Such laser advancements provide a greater freedom of choice in the development of phototriggerable formulations for clinical applications.
Previously, we have reported on light-activatable liposome formulations using a photopolymerizable phospholipid, (1,2 bis(tricosa-10,12-diynoyl)-sn-glycero-3-phosphocholine [DC8,9PC]). These liposomes contained DPPC (1,2-dipalmitoyl-sn-glycero-3-phosphocholine) as the matrix lipid (bulk) and DSPE-PEG2000 to achieve stealth properties.27,28 The formulations containing DPPC:DC8,9PC:DSPE-PEG2000 at 86:10:04 or 76:20:04 mole ratios were found suitable for drug delivery applications.27 To monitor light-triggered release, the fluorescent molecule calcein was entrapped, and we loaded doxorubicin into the liposomes to monitor in vitro, therapeutic efficiency upon phototriggering.28 Our biophysical studies revealed that 254 nm ultraviolet [UV] treatment resulted in photopolymerization of DC8,9PC (photocrosslinking of chains of covalently linked lipid molecules within the bilayer),29,30 whereas visible-light-mediated release occurred via a mechanism unrelated to polymerization.31 Nevertheless, both 254 nm (UV) and 514 nm laser treatments resulted in liposome membrane destabilization accompanied by the release of contents27,32 and improved cytotoxicity by liposome-entrapped doxorubicin28 in the cell culture systems. Furthermore, our recent studies showed that the 514 nm triggered calcein release was dependent on the reactive oxygen species generated by the entrapped photoagent.31
In this communication, we have further developed our formulations for in vivo phototriggering and dual drug delivery therapy. The design rationale shown in Figure 1 includes a red absorbing photosensitizing agent (drug A) in the liposomes. Drug A is expected to promote phototriggering of liposomes in a wavelength specific manner while executing its therapeutic effect. We have chosen 2-[1-hexyloxyethyl]-2-devinyl pyropheophorbide-a (HPPH) as drug A because it possesses a large and sharp absorption peak at 665 nm (red region) utilized for its photodynamic effects. HPPH is a promising second generation PDT drug which is currently in Phase II clinical trials (brand name Photochlor) for several cancer types including esophageal, non-small lung, and head and neck cancer. Furthermore, HPPH has been shown to generate high yields of singlet oxygen.33–37 We hypothesized that HPPH (shown in red color, Figure 1) would preferentially partition into the boundary regions (“Pockets”) within the lipid bilayer containing DPPC (cyan) and pockets of DC8,9PC (brown, Figure 1). Photoactivation of HPPH (that modifies this molecule, indicated by orange) is hypothesized to cause destabilization of pockets (indicated by dark brown circles) resulting in defects in the liposome bilayer. To monitor the release of contents with laser treatment, we used calcein as a reporter drug (drug B, green, Figure 1) as its fluorescence substantially increases through unstacking upon dilution.38 Our observations confirmed that phototriggering of liposomes upon HPPH-specific laser treatments is selective to the liposomes which contained HPPH for both in vitro and in vivo studies. Thus the liposome design described in this study presents a novel light-triggerable liposome platform for dual drug delivery. Our animal studies that demonstrate a remarkable tumor regression (by histopathology and tumor volume measurements) may warrant future clinical applications of these Pocket liposomes.
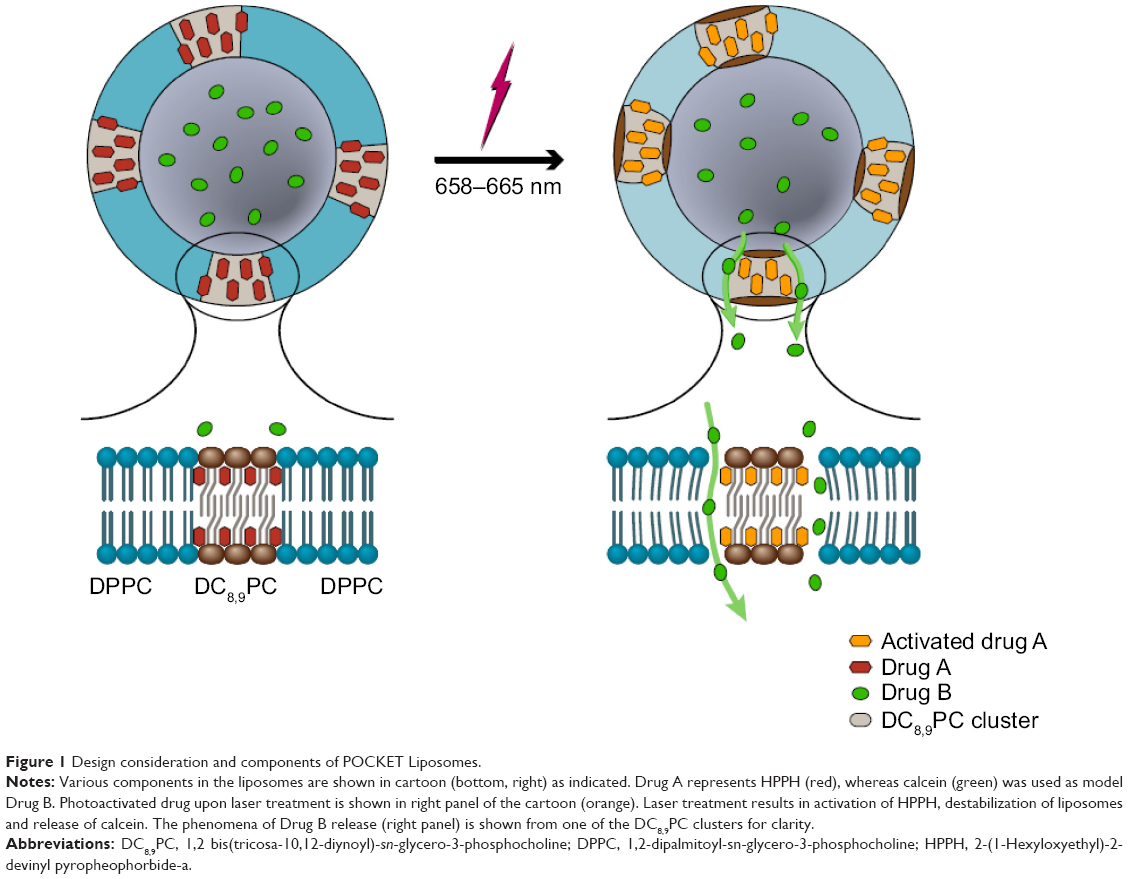 | Figure 1 Design consideration and components of POCKET Liposomes. |
Materials and methods
Materials
Phospholipids were purchased from Avanti Polar Lipids, Inc. (Alabaster, AL, USA). Calcein was purchased from Fluka; Sigma-Aldrich (St Louis, MO, USA). Sepharose CL-6B was purchased from GE Healthcare (Pittsburgh, PA, USA). DiR (1,1′-dioctadecyl-3,3,3′,3′-tetramethylindotricarbocyanine iodide (DiIC18(7)) was purchased from Life Technologies (Grand Island, NY, USA). All materials and buffers were of reagent grade. 2-[1-hexyloxyethyl]-2-devinyl pyropheophorbide-a (HPPH) was a kind gift from Dr Thomas Dougherty through a material transfer agreement between Roswell Park Cancer Institute and the National Cancer Institute.
Cell cultures
MDA-MB-231-LM2Luc+ cells, transfected with luciferase, were maintained in Dulbeccos’ Modified Eagle’s Medium (DMEM) (Sigma-Aldrich Co.), supplemented with 10% FBS (Gibco®, Thermo Fisher Scientific, Waltham, MA, USA) and 1% penicillin and streptomycin (Lonza®), and incubated in 5% CO2 at 37°C, as per instructions in the literature.39 MDA-MB-231 cells (without luciferase gene) were used for cytotoxicity experiments. Cells were routinely maintained by passaging when they become 80% confluent. Prior to injection into mice, the cells were collected with a sterile plastic scraper, counted and suspended to the desired cell numbers.
Optical measurements of various molecules
Calcein, Ex/Em490/517 nm; Absorbancemax =490 nm; HPPH, Ex/Em410/670 nm; Absorbancemax =665 nm; DiR, Ex/Em750/780 nm.
Liposomes
The following lipids were used at various ratios and/or combinations to prepare liposomes: 1,2-dipalmitoyl-sn-glycero-3-phosphocholine (DPPC), 1,2 bis(tricosa-10,12-diynoyl)-sn-glycero-3-phosphocholine (DC8,9PC), and 1,2-distearoyl-sn-Glycero-3-Phosphoethanolamine-N-[Methoxy(Polyethylene glycol)-2000] (ammonium salt) (DSPE-PEG2000). The various liposome formulations used in this study are shown in Table 1. Liposomes were prepared essentially as described.27 Lipids (in chloroform) were mixed in glass tubes with the solvent removed under nitrogen gas, and the lipid films were kept overnight in a desiccator to remove traces of chloroform. Typically, the liposomes were prepared from 20 mg total lipid per sample. Dried films were then resuspended using HEPES buffered saline (HBS) (pH=7.4) containing the desired molecules as follows: For calcein only liposomes, 1mL HBS containing 50 mM calcein was added to the lipid films (Formulations II and V). HPPH only liposomes (Formulation III) were prepared without calcein entrapment. For calcein-HPPH liposomes, 50 mM calcein and 2 mg HPPH (from a 100 mg/mL solution in dimethyl sulfoxide [DMSO]) were simultaneously added to the lipid film (Formulations I and IV). The lipid mixture was vortexed and heated at 50°C–52°C for 20 minutes (above phase-transition temperature for the lipids used). Freeze-thaw cycles were employed to ensure thorough dispersion of lipids throughout the mixture. Probe sonication was used to form the vesicles. The lipid dispersion was sonicated for 1 minute followed by 1 minute of rest; this cycle was repeated 5–10 times. The lipid dispersion was cooled at 4°C during the process to avoid lipid degradation. Un-entrapped molecules were separated from liposomes through size-exclusion gel chromatography using a Sepharose CL-6B column (40×1 cm, 40 mL bed volume). Liposome-rich fractions were pooled together and passed through a 0.45 μm filter. Encapsulation of calcein and HPPH in the liposomes was determined by fluorescence measurements before and after addition of Triton X-100 (TX-100, 1% final concentration) using a fluorescent micro plate reader (SpectraMax M2, Molecular Devices, Sunnyvale CA, USA). Total lipid in the samples was determined by inorganic phosphorus analysis.40 For animal studies, 0.5 mol% DiR was included in the lipid mixture (Formulations IV and V, Table 1).
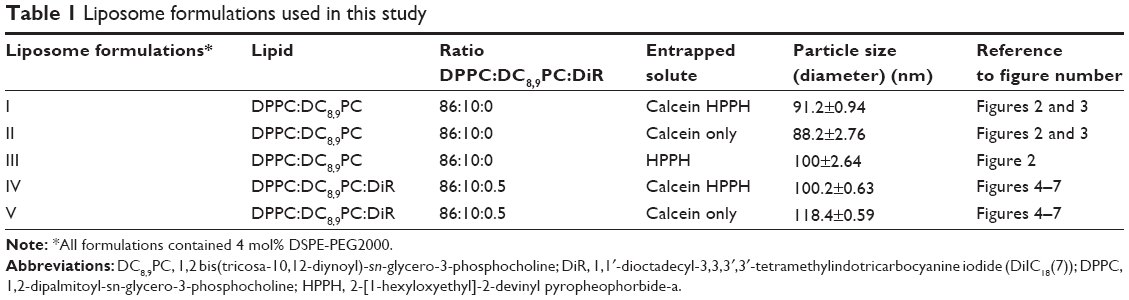 | Table 1 Liposome formulations used in this study |
Liposome size analysis
Size and population distribution of liposomes were determined by dynamic light scattering (DLS) measurements using a Malvern instrument (NANO ZS, Malvern Instruments, CA, USA). For a typical sizing experiment, 10 μL of liposome solution in 390 μL of HBS buffer was placed into a 1.5 mL microcuvette. Each run consisted of three measurements of 12–20 acquisitions per sample.
Electron microscopy
For negative staining, samples were absorbed onto freshly glow-discharged carbon-coated grids, rinsed with water, and stained with 2% uranyl acetate. Specimens were examined on a Hitachi H-7650 TEM (transmission electron microscopy) (Hitachi High Technologies America, Inc., Clarksburg, MD, USA) at 80 kV and images were recorded using an AMT CCD camera (Advanced Microscopy Techniques, Corp., Woburn, MA, USA).
For cryo-EM, 4 μL of sample was blotted onto freshly glow-discharged holey carbon grids (Quantifoil R2/2, SPI, West Chester, PA, USA) and vitrified in a Vitrobot plunge freezer (FEI, Hillsboro, OR, USA). Images were recorded with a T20 microscope (FEI) at 200 kV on an Eagle CCD camera (FEI).
Quantitation of liposomal HPPH and calcein
HPPH incorporation in the liposomes was determined by measuring absorbance at 665 nm using the 96-well plates. The samples (50 μL each) in triplicate were placed in a 96-well plate and an equal volume of methanol was added. Subsequently, an additional aliquot of 50 μL of 1% TX100 in HBS was added to the wells. The plates were gently mixed and absorbance was read using the microplate reader. We also recorded the absorption spectrum of liposomes that contained only calcein, HPPH, or both to confirm that there was no contribution of calcein at the absorption peak of HPPH (665 nm). A standard curve was generated using the free HPPH under identical experimental conditions. Similarly, a standard curve for calcein was generated by measuring absorbance of free calcein at 490 nm and the calcein content was determined accordingly.
Laser treatment of liposomes in vitro
Liposomes were placed in a microcentrifuge tube (0.15 mL) and irradiated horizontally with a 660 nm diode laser at room temperature. Typically, the concentration of liposomes used for laser treatment was 45–75 nmol lipid containing 7.5–10 nmol HPPH and 2.25–3.75 nmol calcein in a volume of 0.15 mL. Irradiation was done for 0–5 minutes with the 660 nm laser (Coherent Cube Part Number 1130061, Santa Clara, CA, USA) using the power output at 90 mW (125 mW/cm2, as measured by the Thorlabs PM200 Energy Meter with the S121C Photodiode Power Sensor). Calcein fluorescence was measured before and after the laser treatment as described above.
Determination of liposome-associated calcein and HPPH
Liposomes were diluted in HBS and treated with the laser (150 μL ×3) as described in the Laser treatment of liposomes in vitro section. The samples were pooled together (total volume 450 μL) and loaded onto microcentrifuge filters (Millipore, Amicon Ultra, UFC501096, 10,000 MWCO, 0.5 mL max volume) and centrifuged for 15–17 minutes at 9,300× g, using a fixed angle rotor at room temperature. The concentrated liposomes (40–60 μL volume) were diluted with 400 μL HBS and the centrifugation steps were repeated as before. This cycle was repeated once more to ensure ≥99% removal of free calcein from the liposomes. The concentrated liposomes were resuspended in HBS to a final (the original) volume of 450 μL and were analyzed for calcein, HPPH, and phospholipid content as described earlier. Calcein quenching ratios were also determined in these samples by measuring calcein fluorescence before and after addition of TX100 (Determination of liposome-associated calcein and HPPH section).
Cytotoxicity assays
To examine the effects of laser treatment we used the following two protocols: 1) the loss of luciferase expression upon laser treatment; and 2) the reduction of cell viability upon laser treatment.
Luciferase expression
MDA-MB-231LM2Luc+ cells plated on 96-well clusters were incubated with liposomes for 30 minutes at 37°C (in triplicate). Subsequently, liposome-cell mixtures were treated with 658 nm laser for 5 minutes (60 mW power over 5 mm diameter circular exposure, equiv. to ~0.3 W/cm2). Control samples included cells without liposomes (plus laser treatment), or cell-liposome mixtures not treated with the laser. Luciferase expression was monitored by imaging.
Cellular viability
MDA-MB-231 cells, harvested with enzyme-free buffer, were resuspended in DMEM at a density of 106 cells/mL using a round-bottom polypropylene tube and were incubated for 4–6 hours at 37°C in a CO2 incubator. For cytotoxicity assays, working dilutions of liposomes and free HPPH were prepared as follows: liposomes (Formulation I and II) were diluted in DMEM to ~2 nmol of lipid/μL. Free HPPH was diluted in DMSO to 0.15 mg/mL. Liposomes or free HPPH were mixed with the 0.2 mL cells (2×10⁵) at desired concentrations (see legend to Figure 5B for exact amounts added per sample) and the volume was brought to 0.3 mL by addition of DMEM. The samples were divided into two parts. One part was treated with the 660 nm laser (90 mW) for 5 minutes (as described in the Laser treatment of liposomes in vitro section) while the second part was kept as control (not treated with laser). At the end of incubations, DMEM was added to each sample to a final volume of 1 mL to achieve a final cell density of 105cells/mL. Cell suspensions were plated in 96-well clusters in triplicate (0.2 mL containing 2×10⁴ cells/well), and incubations were continued for 48 hours at 37°C and cell viability was determined using the Cell Titer Blue Assay Kit (Promega Corp., Madison, WI, USA).
Animal studies
Tumor growth
Mice used in the experiment were 4–5 week old female athymic nude mice from Harlan Sprague Dawley. All mice studies were conducted in accordance with Baylor College of Medicine’s institutional policies and approved animal use protocols. To induce tumor growth, 1×10⁷ cells in a total volume of 200 μL were injected subcutaneously in the fat pack of the ribcage on both sides (the positive and the negative group) or on one side (biodistribution group). The cell injection procedure described in Rimawiet al41 was used. Tumor growth was monitored every two days by measurement with a digital caliper and the tumor volume was calculated with the formula: tumor volume =½(length × width2).
Laser treatment of tumors in vivo
To examine phototriggering of liposomes in our animal studies, a 658 nm nominal wavelength laser diode was used. When the tumors reached a volume of 200–300 mm3, 200 μL of either Formulation IV (with calcein and HPPH) liposomes or Formulation V (with calcein only) liposomes were injected into the tail vein. Typical amounts of HPPH and lipid in 0.2 mL of liposomes corresponded to 30 μg HPPH and 0.6 mg of lipid, corresponding to 4×10¹² liposomes (for calculations, see Supplementary material). Four hours after injection, the mice were anesthetized with isoflurane and one tumor per mouse was treated for 5 minutes with a cw-diode laser (Thorlabs, TCLDM9) emitting 90 mW (spot size 0.9 cm Ø) at a wavelength of 658 nm. The second tumor was left untreated as a reference. The mice in the biodistribution group were left untreated.
Bioluminescence and fluorescence imaging
Anesthetized mice were imaged with a homebuilt system outfitted with an intensified cooled CCD camera (Princeton Instruments, PIMAX2) 9 minutes after an intraperitoneal injection of D-Luciferin (10 μL/g body weight of a 15 mg/mL solution, Biotium®). Fluorescence images for calcein and DiR dyes were taken with the same system but with different excitation and emission filters. Mice were imaged prior to and after the treatments. Bioluminescence images were also taken 4, 7, and 14 days after treatment. For biodistribution studies, the mice were imaged prior to injections, and at 30 minutes, 2 hours, 4 hours, 6 hours, 8 hours, 24 hours, 48 hours, and 72 hours after injections.
Tumor histopathology
Xenografts were fixed in 10% neutral buffered formalin, routinely processed, paraffin-embedded, and sectioned at 5 μm, and stained with hematoxylin and eosin (H&E). Stained sections were scanned into digital format via an AperoScanscope. All evaluations were performed by a board-certified veterinary pathologist.
Results
Properties of phototriggerable liposomes: encapsulation/incorporation of HPPH in liposomes
The basic design of liposomes and projected phototriggering effects are shown in Figure 1. We have previously reported the assembly and in vitro biophysical properties of phototriggerable DPPC:DC8,9PC formulations with encapsulated calcein (a water soluble fluorescent dye) or an anticancer agent, doxorubicin.27,28 These liposomes upon exposure to a 514 nm laser source released calcein as monitored by an increase in its fluorescence due to relief of self-quenching.28,31 Laser treatment also resulted in improved doxorubicin delivery as judged by an increase in cytotoxicity in the cell culture system.28 Biophysical studies revealed that inclusion of 10 or 20 mol% of DC8,9PC in DPPC liposomes was optimal for light-triggered destabilization of the liposomes.27 Therefore, we have used DPPC:DC8,9PC:DSPE-PEG2000 (86:10:04 mole ratio) formulations in this study (Table 1). HPPH and calcein loaded liposomes were designated as Formulation I. Calcein-loaded liposomes without inclusion of HPPH (Formulation II) were used as controls in our study (Table 1). For imaging of liposomes in animals, we used trace amounts of the near-IR lipid probe DiR, as fluorescence properties of DiR are distinct from HPPH (Table 1, Formulations IV and V). DPPC:DC8,9PC:DSPE-PEG2000 liposomes containing only HPPH (without calcein) were also prepared (Formulation III, Table 1) for comparison.
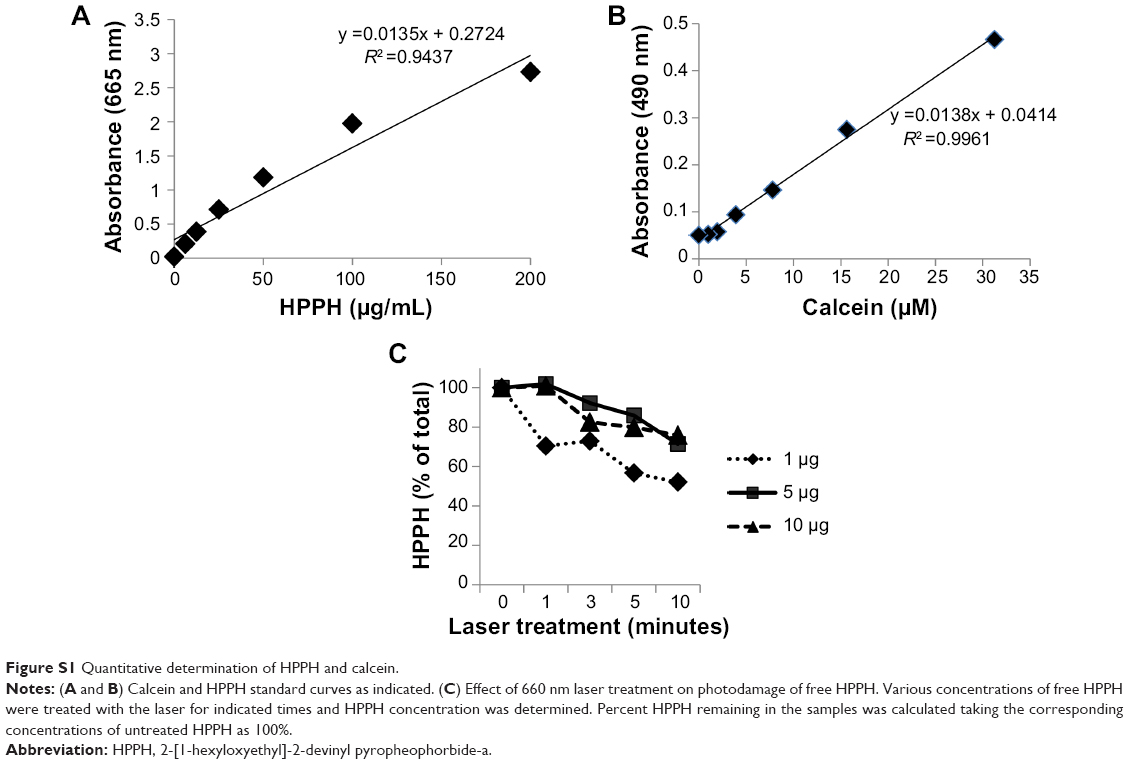
In our initial studies, we optimized the extent of HPPH incorporation into our liposomes. Various concentrations of HPPH were added to the known amount of total lipid mixture and liposomes were prepared with co-encapsulation of calcein. The extent of incorporation of HPPH was determined by measuring absorbance of liposomes at 665 nm as described in the methods section. A standard curve using the free HPPH shown was employed for quantitation of liposomal HPPH (Figure S1). Incorporation of HPPH in the liposomes was linear up to the mole ratio of 15:01 lipid:HPPH (data not shown). Increase in the concentration of HPPH to 7.6:1 (lipid:HPPH mole ratio) resulted in ~70%–80% inclusion of the drug in the liposomes. Although, it can be predicted that HPPH will preferentially partition into the lipid bilayer, further experiments are warranted to address the precise localization of HPPH in the liposomes. These formulations were tested for phototriggering upon 660 nm laser treatment (see below). UV-VIS spectral analysis indicated that the HPPH absorbance peak (665 nm) was only present in the liposomes that contained HPPH (Figure 2) as expected. Liposomes loaded only with calcein did not show absorption at 665 nm in the UV-VIS spectrum confirming that presence of calcein in the liposomes did not interfere with our HPPH quantitation at 665 nm in our assays (Figure 2A).
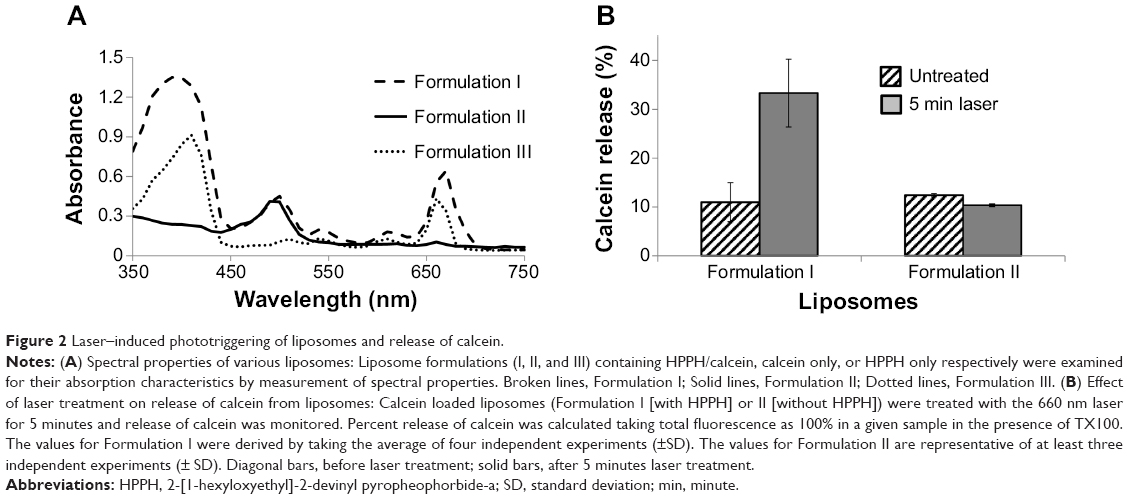 | Figure 2 Laser–induced phototriggering of liposomes and release of calcein. |
As discussed above, HPPH (designated as our first model drug) was incorporated in the liposomes with high efficiency. It is critical that inclusion of HPPH does not impair loading of a second drug in the aqueous core of the liposomes. Therefore, we compared relative loading of calcein in our liposomes for a known concentration of liposomal lipids. We report that for a known liposomal lipid concentration, Formulation I (containing DC8,9PC) showed 10×104 relative florescence units (RFU) for calcein, whereas liposomes prepared without DC8,9PC showed only ~1.1×10⁴ RFU (data not shown). Therefore DC8,9PC provides an advantage in terms of increasing the payload of calcein by ~10 fold. Since calcein loading in Formulation I (that also contained HPPH) was 9.8×10⁴ RFU, similar to that of Formulation II (containing DC8,9PC but no HPPH), we conclude that HPPH inclusion does not affect calcein loading into liposomes. The increase in entrapment of calcein by inclusion of DC8,9PC in DPPC liposomes is in agreement with our previous studies and will be an advantage (higher payloads) for future drug delivery applications.
Phototriggering potential of liposomes containing HPPH
In our initial phototriggering tests, we examined the release of calcein from liposomes that contained varying concentrations of HPPH as a consequence of laser treatment. Since liposomes containing a 7.5:1 lipid:HPPH mole ratio (Formulation I) resulted in significant calcein release above background levels upon 5 minutes laser treatment, these experimental conditions were used for further experiments.
To confirm the specific requirement of photoactivated HPPH for the observed phototriggering and calcein release from Formulation I, we tested Formulation II (without HPPH) under identical conditions. The data are presented in Figure 2B. Liposome Formulation II did not show any calcein release upon laser treatment above background levels (untreated, 12%, laser treated, 11%) whereas a substantial amount was released from Formulation I (untreated 11%, laser treated 33%, Figure 2B) confirming that HPPH was essential for phototriggering (Figure 2). When calcein and HPPH containing liposomes were prepared without the inclusion of DC8,9PC, we observed calcein release upon phototriggering, albeit at very low efficiency. Moreover, calcein loading in these liposomes was significantly less (≈10 fold) and there was spontaneous release of calcein (not shown) in these formulations. We surmise that local photothermal effects may have contributed to the calcein release from the liposomes (prepared without DC8,9PC) which is a thermosensitive liposome preparation (Tm 41°C). In contrast, Formulation I does not show thermosensitive behavior (examined up to 45°C, near the Tm of DC8,9PC, data not shown), therefore, laser-triggered release occurs via mechanisms unrelated to photothermal effects. Based on the evaluation of various liposome preparations, we conclude that formulations containing DPPC:DC8,9PC are suitable candidates for dual drug delivery applications. For animal imaging studies, we included a fluorescent lipid probe, DiR (0.5 mol%) in our liposomes (Formulation IV and V, Table 1). Inclusion of DiR had no effect on entrapment of either calcein and/or HPPH in the liposomes. Furthermore, laser-triggered calcein release from Formulation IV (+DiR, HPPH) was comparable to that of Formulation I (without DiR) (20%–30%) and phototriggering of Formulation V (+DiR, calcein only) did not result in calcein release above background levels (2%–5%). Taken together, we conclude that inclusion of trace amounts of DiR does not adversely affect phototriggering potential of the liposomes. Therefore, further studies were conducted using Formulation IV and V. We propose that preferential intercalation of HPPH into DC8,9PC pockets accelerates lipid destabilization and drug release upon phototriggering. However, detailed biophysical studies are needed to understand the molecular details of HPPH/DC8,9PC interactions in the lipid bilayer.
Effect of laser treatment on the integrity of liposomes
Our previous studies show phototriggering of DPPC:DC8,9PC formulations upon 254 nm (UV) or 514 nm laser treatment results in release of entrapped contents. Specifically, the UV-mediated effects occur via the photocrosslinking of the DC8,9PC monomers leading to polymerization and membrane disruption. On the other hand, 514 nm laser treatments did not show any evidence of DC8,9PC photocrosslinking despite liposome membrane destabilization leading to release of contents.27,28 In addition, UV-triggered mechanisms were found to be independent of reactive oxygen species (ROS), whereas laser-mediated effects on these liposomes involved ROS production.31 Consistent with these observations, we have demonstrated that presence of HPPH in the liposomes is essential for the observed 660 nm laser-triggered release (Figure 2).
To gain insights into the effects of the laser treatment on the biophysical properties of liposomes and encapsulated HPPH, we examined liposomes (Formulation IV) in the following regards: UV-VIS spectral analysis, hydrodynamic size distribution before and after laser treatments, fractionation pattern by size exclusion chromatography, and electron microscopy (EM). The results are presented in Figure 3A–C. The UV-VIS spectra of Formulation IV (Figure 3A, [a]) showed that the 5 minutes of laser treatment did not affect the locations of absorption peaks (dashed lines, untreated; solid lines, laser treated). However, we observed a small but consistent decrease in the peak values in laser treated samples (absorbance treated/untreated, 1.8/2.19 [410 nm]; 0.94/1.15, [490 nm]; 0.71/0.97 [660 nm]). We attribute this decrease to photodamage of calcein and HPPH upon photoactivation of HPPH by the laser treatment. The observed effect was specific to the presence of HPPH in liposomes, because Formulation V (without HPPH) did not show changes in the UV-VIS spectra (Figure 3A, [b], untreated dashed lines; laser treated solid lines). Interestingly, we did not observe any change in the size distribution of liposomes before and after laser treatment (Figure 3A, [c], Formulation IV [d], Formulation V) suggesting that the phototriggering of liposomes does not result in a total disruption of liposomes but most likely creates pores in the membranes (such as in the Pocket area, Figure 1) while maintaining the overall architecture of the liposomes. To further substantiate our interpretation, we fractionated untreated or laser treated calcein-HPPH liposomes (Formulation IV) on a Sepharose CL-6B column and HPPH, calcein and lipid content were measured in liposome-rich fractions (methods section). Data presented in Figure 3B shows the amount of HPPH present in each fraction. Free HPPH aggregates in aqueous medium and does not penetrate the column matrix. The results clearly show that untreated liposomes (dashed lines) and laser treated samples show similar elution profiles. A similar elution profile was also observed for calcein-containing liposomes (Formulation V, data not shown). A slight shift in the liposome peak fractions is attributed to variations in initial loading of the samples. These data are in agreement with the DLS analysis (size distribution) and further confirm that the laser treatment does result in disruption of the overall liposome structure.
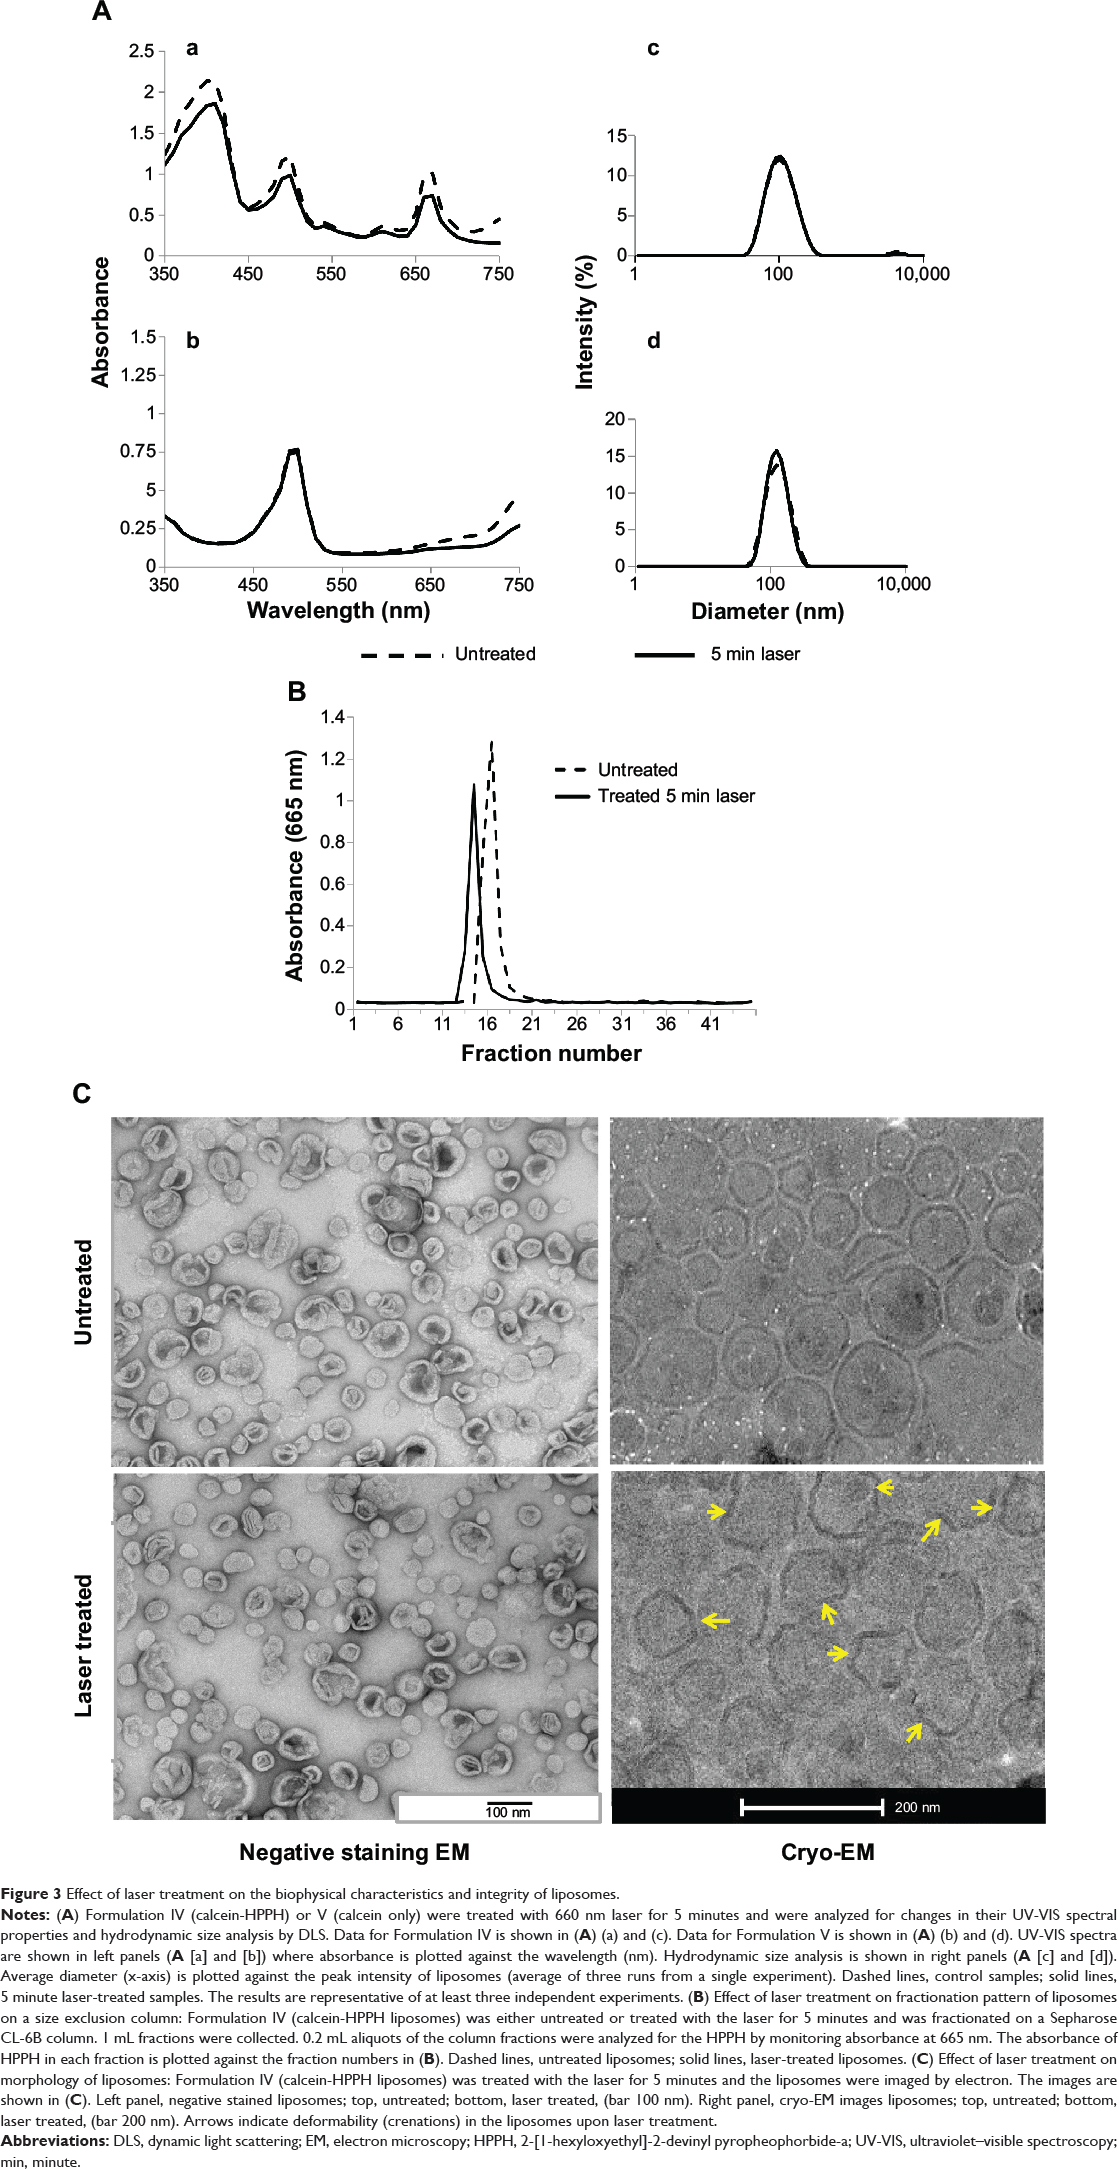 | Figure 3 Effect of laser treatment on the biophysical characteristics and integrity of liposomes. |
In our next experiments, we examined the effect of laser treatment morphology of liposomes by electron microscopy and the data are presented in Figure 3C. Liposomes (Formulation IV, containing ~75 nmol lipid) were treated with the 660 nm laser for 5 minutes and were analyzed by negative staining EM or cryo-EM. We did not see any significant differences in the overall morphology of the liposomes upon laser treatment by negative staining EM (Figure 3C, left panel). However, when samples were analyzed by cryo-EM, we saw a clear difference in liposome morphology/structure upon laser-treatment (Figure 3C, right panel). Crenations were evident in the liposomes (indicated by arrows Figure 3C) suggesting deformation of the lipid membranes. We predict that ROS production in HPPH containing liposomes most likely exerts pressure in the DC8,9PC pockets which are prone to destabilization.
Calcein release occurs via a graded mechanism upon phototriggering
Literature reports suggest that solute release from liposomes can occur primarily by two processes, namely graded or all-or-none mechanisms.42 The graded mechanism typically results from the pore formation in the liposome membrane whereas a total disruption of liposomes results in all-or-none process (see Figure 4D, cartoon). Determination of calcein quenching ratios has been widely utilized to gain insight into the liposome disruption mechanisms.42 To assess the mechanism(s) of solute release from calcein-HPPH liposomes upon phototriggering, we evaluated 1) amounts of liposome-encapsulated calcein and HPPH per μmol lipid; and 2) monitored changes in calcein quenching ratios in the liposomes before and after laser treatment. Liposomes (Formulation IV and V) were treated with the laser for 5 minutes, and free calcein was separated from the liposomes using a 10,000 MW cut-off filter. The liposomes were analyzed for calcein, HPPH and lipid contents, and calcein quenching ratios were determined (methods section). The data are presented in Figure 4A–C. Figure 4A shows liposome-associated calcein (nmol/μmol lipid) before and after laser treatment. Calcein content was significantly reduced from calcein-HPPH liposomes (30±2.9 nmol, Formulation IV), upon laser treatment in comparison to untreated samples (48±2.7 nmol). On the other hand, calcein content was 66±4.3 nmol (untreated) and 61±6.4 nmol (laser treated) for calcein only liposomes (Formulation V). These data clearly show that phototriggering of calcein-HPPH liposomes selectively results in loss of about 35% calcein from the liposomes, consistent with our calcein release data (see Figure 2). Similar effects were observed on the liposome-associated HPPH. Formulation IV showed at least 50% reduction in HPPH associated with liposomes upon laser treatment (Figure 4B, untreated 133±8.97 nmol; laser treated 63.64±8.19 nmol). We attribute this decrease in HPPH to photodamage upon the laser treatment. Formulation V, which does not contain any HPPH, showed only background values (similar to that for no liposomes samples) before and after laser treatment.
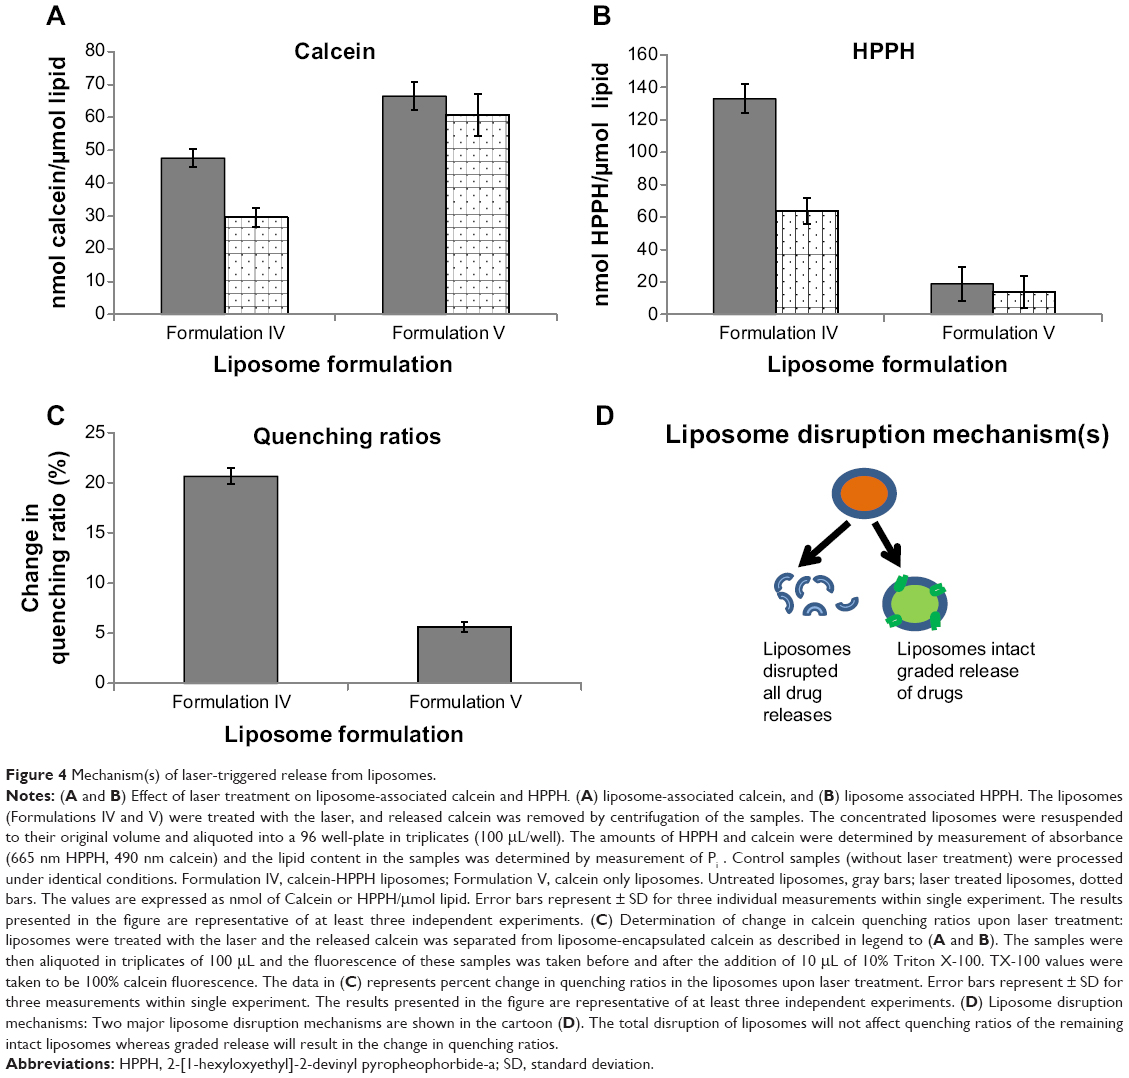 | Figure 4 Mechanism(s) of laser-triggered release from liposomes. |
Next, we determined the quenching ratios of liposome-associated calcein in the liposomes (Figure 4C). The data are presented as percent change in the quenching ratios upon laser treatment in comparison to the corresponding untreated samples. We observed noticeable change in the calcein quenching (20%) upon laser treatment of calcein-HPPH liposomes (Formulation IV), whereas laser treatment did not have a significant effect on the quenching ratios of calcein only liposomes (Formulation V). Taken together, we conclude that laser treatment of calcein-HPPH liposomes results in solute release primarily via a graded mechanism. This observation may have implications in the utilization of these formulations as sustained drug delivery platforms.
Cytotoxicity studies
To examine the effect of HPPH inclusion into liposomes, cytotoxicity studies were performed (methods section). Initial experiments were conducted to investigate loss of luciferase expression in MDA-MB-231LM2Luc+ cells upon laser-activation of liposomes. Formulation IV (calcein-HPPH) and Formulation V (calcein only) liposomes were incubated with the cells, treated with the laser, and cells were imaged for luciferase. Results are presented in Figure 5A. It is clear from the data that photoactivation of liposomes that contained HPPH resulted in complete loss of luciferase expression, whereas control liposomes (without HPPH) failed to exert this effect. Cells without addition of liposomes also did not show any significant loss of luciferase expression, confirming that the effect was due to the presence of HPPH in the liposomes.
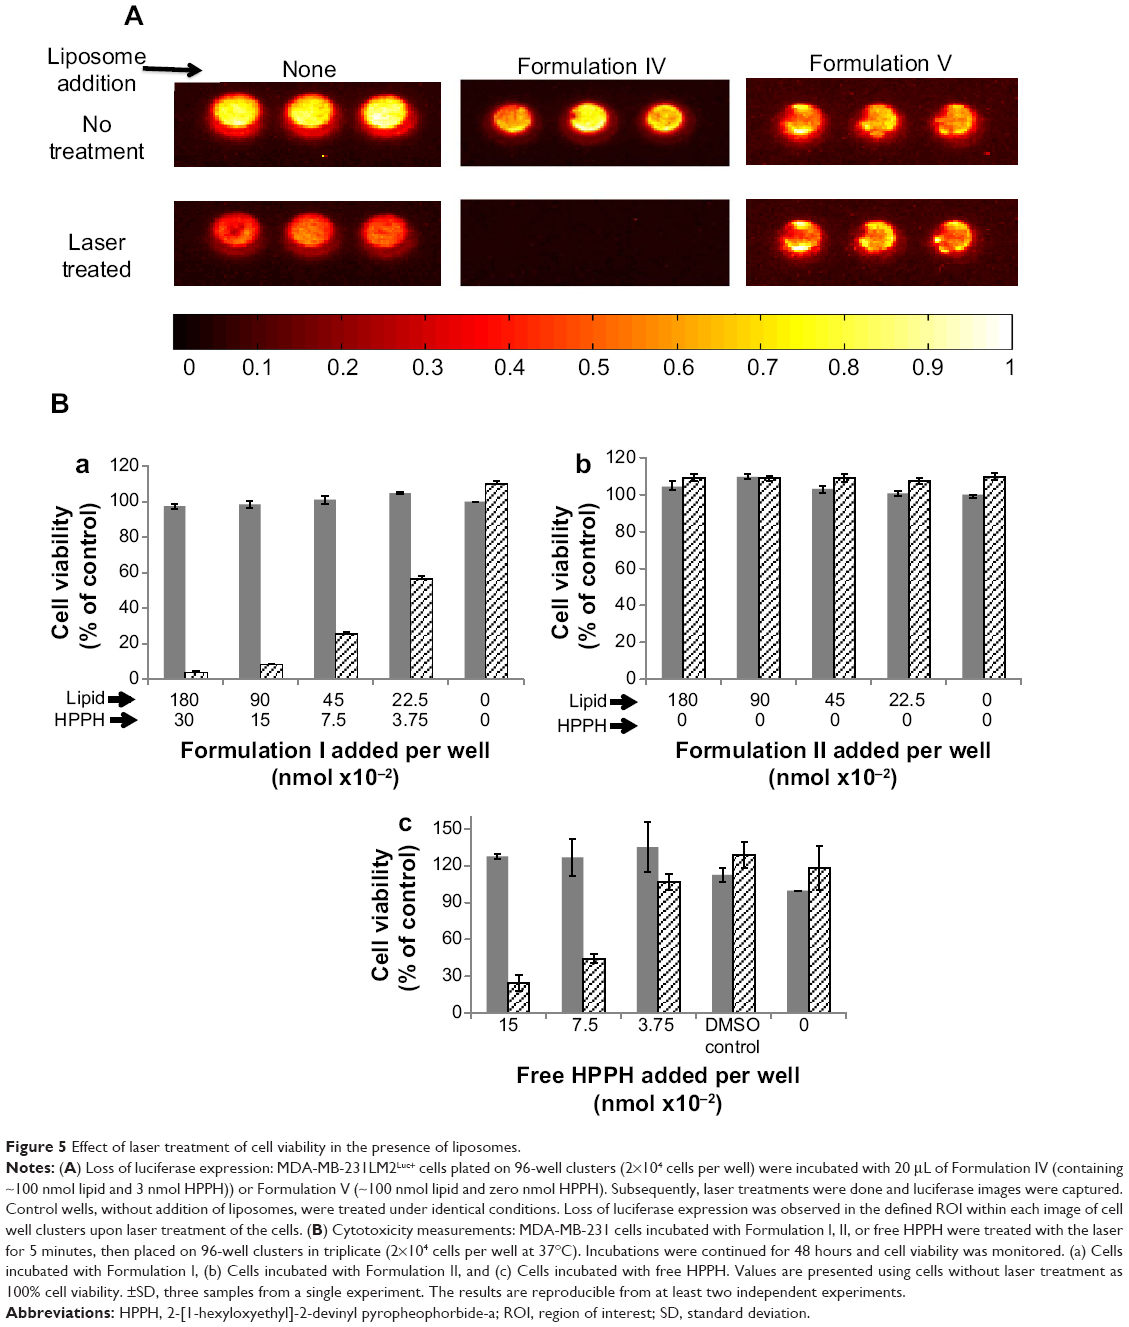 | Figure 5 Effect of laser treatment of cell viability in the presence of liposomes. |
To further validate laser-triggered cytotoxic effects by HPPH containing liposomes, we incubated MDA-MB231 cells with various concentrations of the Formulation I (containing HPPH), Formulation II (control liposomes without HPPH) or free HPPH. The samples were treated with the laser for 5 minutes and the effect of the treatments on cell viability was monitored following incubations for 48 hours at 37°C (methods section). Cell-liposome suspensions not treated with the laser were used as controls in our experiments (solid bars, Figure 5B). Results presented in Figure 5B clearly show that laser treatment of cells in the presence of Formulation I or free HPPH had significant effects on cell viability (dotted bars, Figure 5B, [a] and [c] respectively) at all concentrations tested, presumably due to the PDT. The decrease in cell viability occurred in a dose-dependent manner with ≥90% reduction in cell viability at a ratio of 0.15–0.3 nmol HPPH for 2×10⁴ cells. Furthermore, laser treatment of cells incubated with Formulation II (without HPPH) did not show a reduction in cell viability even at the highest concentration of liposomal lipid added (1.8 nmol for 2×10⁴ cells, Figure 5B, [b]). Based on results presented in Figure 5, we conclude that the cytotoxic effects are due to the photoactivation of liposome-encapsulated HPPH.
Animal studies
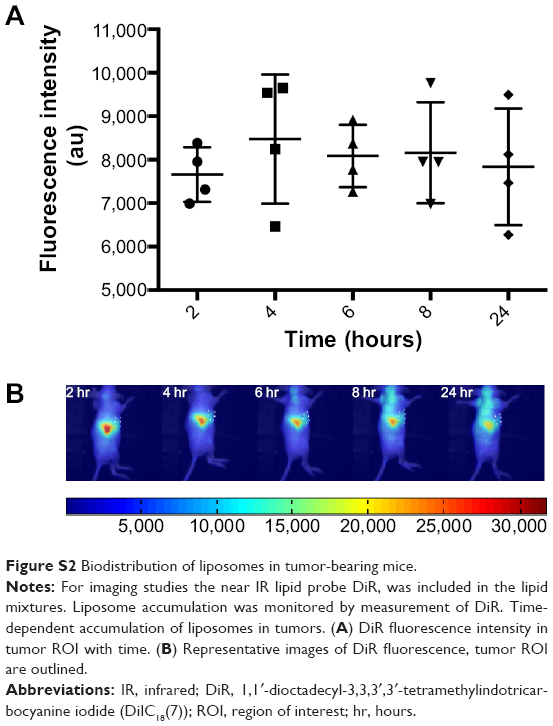
Results presented above clearly demonstrate that liposomes prepared from DPPC:DC8,9PC co-encapsulated with calcein and HPPH are promising candidates for dual drug delivery. Furthermore, presence of HPPH in the liposomes is essential for photoactivation and release of contents. Our next experiments were designed to evaluate phototriggering potential of these liposomes in an animal model. Animal studies were conducted using an orthotropic breast cancer model of triple negative breast cancer. Luciferase transfected MDA-MB-231-LM2 cells were chosen as a model of highly aggressive triple negative breast cancer. Triple negative breast tumors do not overexpress Estrogen/Progesterone or HER2 receptors, and thus the treatment options are limited to chemotherapy coupled with radiation and surgery. Relapsed disease is frequently fatal. Size dependent retention of nanoparticles in tumors provides an attractive avenue for safely delivering cytotoxic drugs to tumors, while light triggering can provide additional spatio-temporal control of therapy. To localize and monitor biodistribution of liposomes in mice, trace amounts of DiR, a mouse imaging lipid probe (0.5 mol%), were included in the liposomes. Liposomes containing calcein + HPPH and DiR were designated as Formulation IV, and control liposomes that contained DiR and calcein only ware referred as Formulation V (Table 1). Inclusion of DiR into liposomes had no effect on the phototriggering potential of liposomes. The time-dependent accumulation of liposomes following tail vein injections into mice was monitored based on DiR fluorescence and 4 hours was found to be optimal for liposome accumulations in the tumors, (Figure S2 [A and B]).
Calcein release from liposomes in animals upon phototriggering
To assess the photo-triggered release of calcein in tumor-bearing mice, the fluorescence intensities at calcein emission wavelengths were quantitated for the laser treated and non-treated tumors in each mouse in both the Formulation IV and the Formulation V treated group. In Figure 6A, the calcein fluorescence image in the tumor regions are displayed overlaid on the white light images for spatial registration. The calcein fluorescence images are normalized with the average pre-laser treatment intensity in the tumor region of interest (ROI), to enable the quantitation of any increase in fluorescence signal postlaser treatment. A clear increase in the calcein fluorescence for laser treated tumors in Formulation IV injected mice was observed, while no such increase was observed in tumors not treated with laser, or in mice injected with Formulation V. This illustrated the wavelength sensitive nature of release from liposomes. For further quantitation, the differential change in fluorescence intensity of the laser-treated to non-treated tumors, pre- and postlaser treatment, was compared (Figure 6B). For each mouse, average fluorescence intensity in tumor ROI was calculated for both the laser treated and untreated tumor. Ir represents the ratio of fluorescence intensity of treated to the untreated tumor. Differences in Ir were computed for each mouse and averaged data is depicted in Figure 6B. Approximately 25% higher enhancement in calcein fluorescence intensity was observed for the Formulation V treated mice. (P*=0.049).
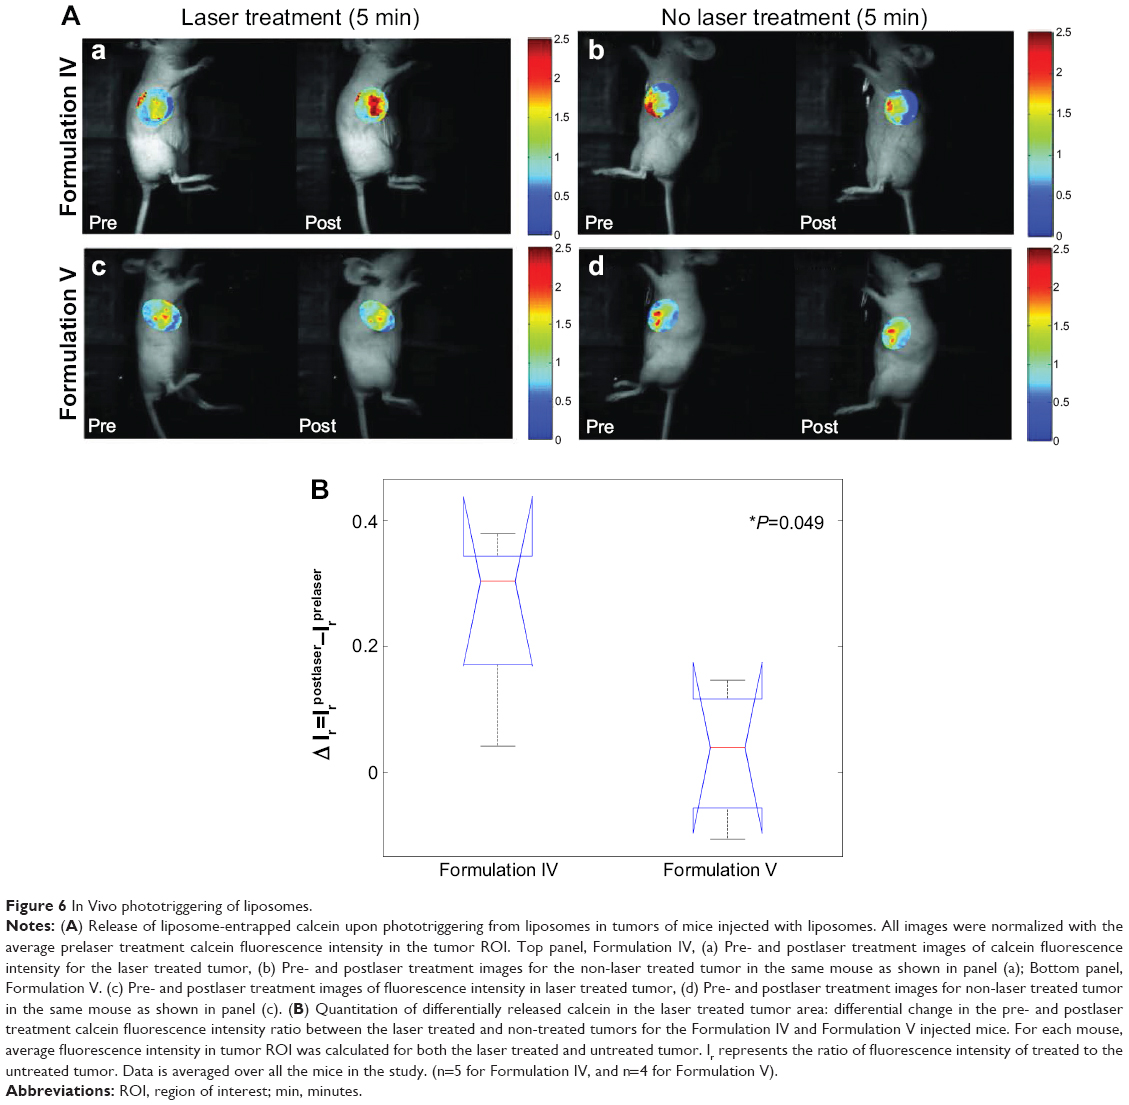 | Figure 6 In Vivo phototriggering of liposomes. |
Tumor regression upon phototriggering
Mice were observed for up to 15 days post laser treatment, and tumor growth was followed both by bioluminescence imaging and caliper-based measurements of tumor size on days 4, 8, and 15. As illustrated in Figure 7A and B, laser-treated tumors in Formulation IV injected mice exhibited continued reduction in tumor bioluminescence signal, and reduction in tumor volume (Figure 7A, top panel). This tumor viability reduction was not observed in non-laser-treated tumors in Formulation IV injected mice (Figure 7A, bottom panel). Figure 7A also shows a comparison of bioluminescence in a mouse with untreated and treated tumor (as indicated). It is clear that tumor regression only occurred when laser treatment was performed resulting in photoactivation of liposome-encapsulated HPPH. This tumor viability reduction was not observed in the Formulation V (calcein only) injected mice (Figure 7B) upon laser treatment. The data shown here is 8 days post laser treatment. There was no change in the bioluminescence in tumors with or without laser treatment in animals injected with Formulation V (Figure 7B). Furthermore a side-by-side comparison of laser treated or untreated tumors (15 days post treatment, Figure 7B, right panel) confirms our results that the tumor regression was not observed when calcein only liposomes were injected. These observations confirm that therapy was due to photoactivation of HPPH drug and not due to a photo-thermal effect, providing further evidence for wavelength specific light-triggered collapse of our phototriggerable formulations. These results are in agreement with our in vitro results presented above (Figures 2 and 4).
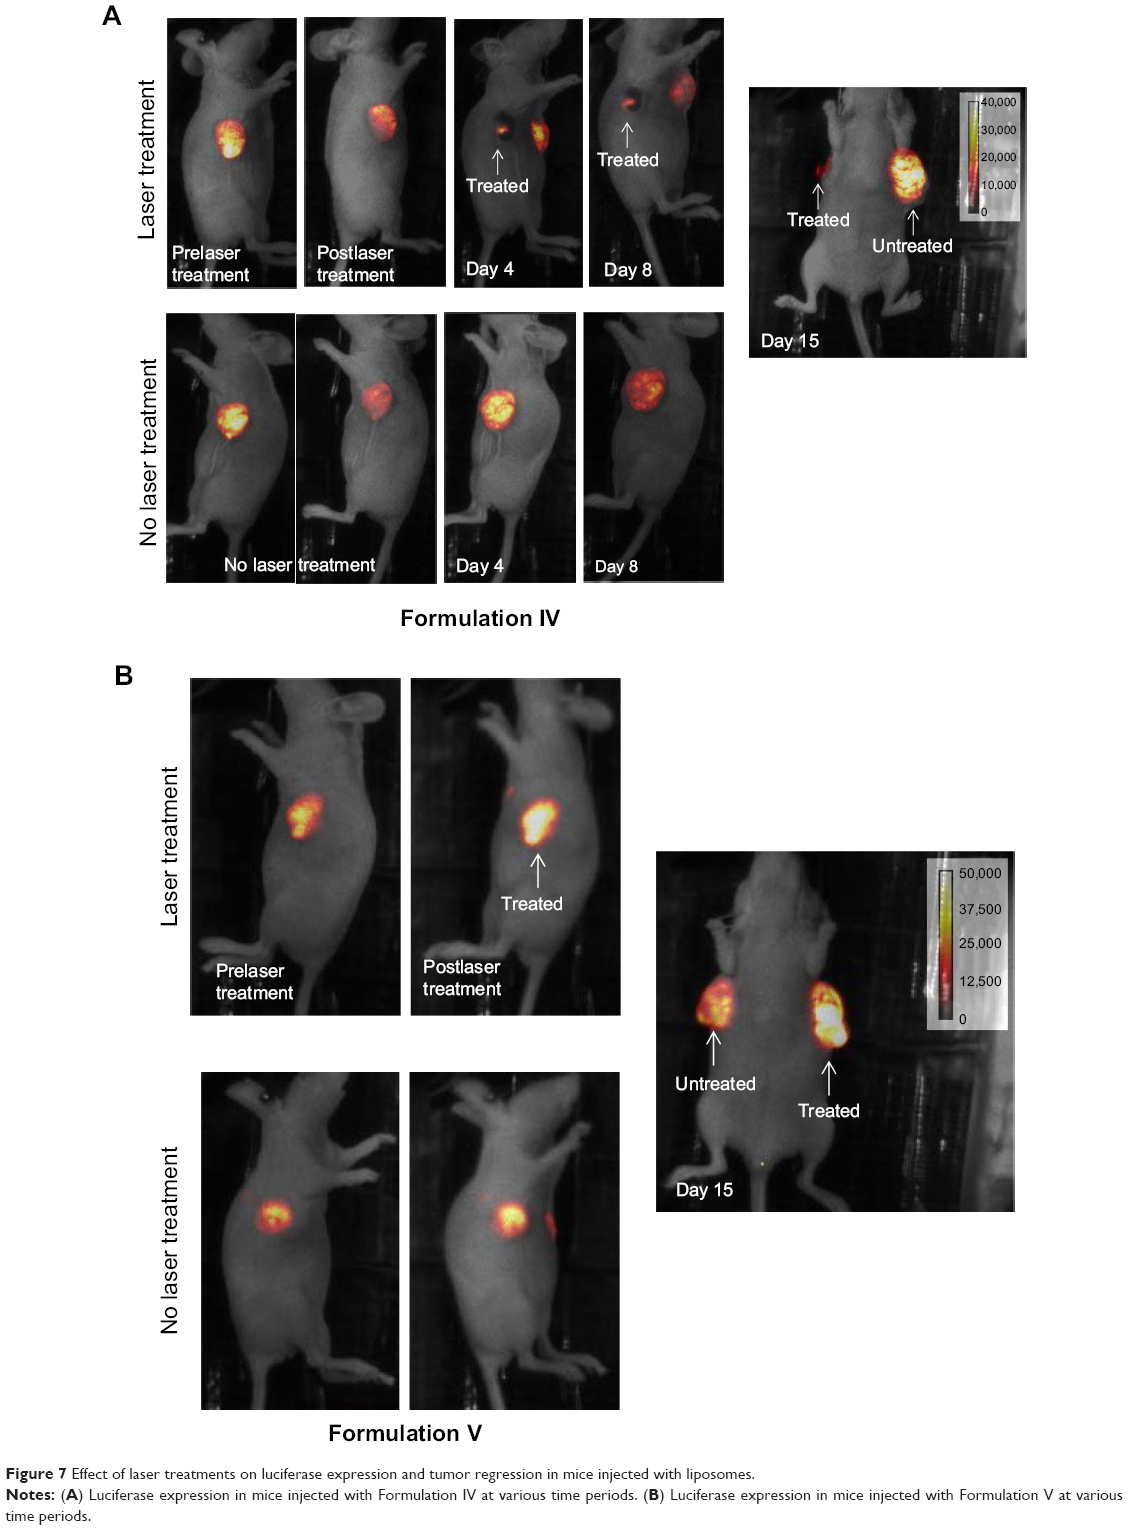 | Figure 7 Effect of laser treatments on luciferase expression and tumor regression in mice injected with liposomes. |
Quantitation of tumor volumes is shown in Figure 8A. It is clear from the data that tumor regression occurred only when Formulation IV (which contained HPPH) was injected and the animals were treated with the laser (squares). We did not observe tumor regression in animals injected with Formulation IV but were not subjected to laser treatment (circles). Calcein only liposomes (Formulation V) did not show any effect on tumor growth even after treatment with the laser (triangles). We also performed histopathology analysis of excised tumors and the images are presented in Figure 8B (left panel). The animals injected with Formulation IV and treated with the laser exhibited remarkable tumor regression (Data from two animals, numbered as 1 and 2 are shown). Formulation V, on the other hand did not show any effects on tumor growth with or without laser treatment of the animals (animal 3). A higher magnification image of tumors before and after laser treatment is also shown (animal 2, right panel) to provide an assessment of tumor characteristics. Initial observation of the images indicated that tumor necrosis was relatively more prevalent in laser treated tissues that contained Formulation IV (HPPH liposomes). However, further experiments are needed to determine the exact mechanism(s) of tumor regression.
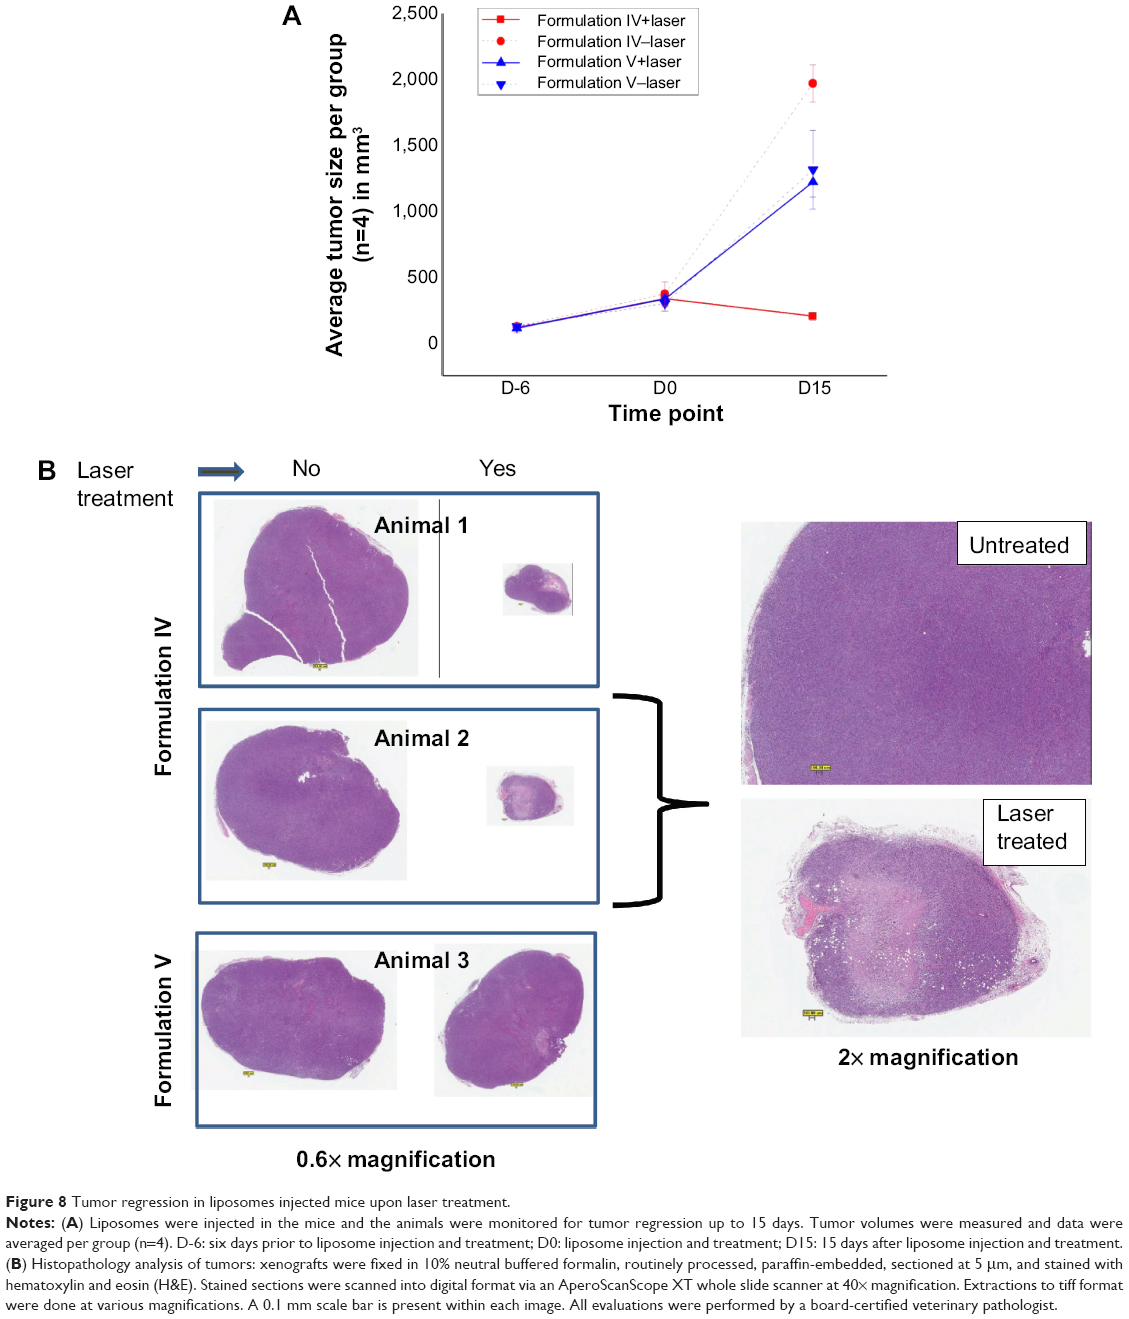 | Figure 8 Tumor regression in liposomes injected mice upon laser treatment. |
Taken together, we have presented a novel liposome system that promotes solute release upon phototriggering at 658–665 nm wavelengths. To our knowledge, we are the first to demonstrate the applicability of phototriggerable liposome formulations for onsite drug delivery in animal models. Moreover, the concept to utilize a PDT drug to disrupt liposomes and release a second drug of choice has not been reported earlier. Our studies are likely to impact the treatment of cancer patients in the future.
Discussion
The impact of precise spatial and temporal release of therapeutic agents from the nanoparticles at the target site has been realized for effective drug delivery in the field of nanomedicine. Light-triggered drug release mechanisms from nanoparticles present a promising opportunity to this end.11,12,43–44 It may be noted that photosensitive drugs encapsulated in the nanoparticles can be broadly classified into two categories. First, improvement of the solubility and bioavailability of the PDT drugs,45–47 and second, utilization PDT drugs for nanoparticle destabilization to achieve on demand release of entrapped cargo (such as a second drug). Uniquely designed photosensitive lipids that can be activated by appropriate light sources for on-demand drug delivery are well documented and have been studied for decades.11,12,21 However, most of the designer lipids reported to date are responsive to either UV or visible light for phototriggering and hence are limited in their in vivo applications. Therefore, the rationale to include NIR photosensitizers with the propensity to create defects in the nanoparticle membrane appears a promising alternate strategy. The choice of the PDT drug and its preferential packing properties in the lipid membrane are likely to determine the intended outcome upon phototriggering.
The first generation photosensitizer Photofrin was approved in the US by the FDA for esophageal and endobronchial cancers in 1996. Although this first generation photoagent is effective in the treatment of cancers it has two major drawbacks: 1) Photofrin could efficiently be activated around 630 nm, however, due to the relatively shallow light penetration depth at 630 nm it could only be effective for superficial tumors; and 2) Photofrin persisted in the skin tissues for a remarkably long period of time (1–3 months) and protective care needed to be exercised by the patients from sunlight and other bright light sources. These two drawbacks from the first generation photo-agents have motivated the development of second generation photosensitizers such as HPPH which could get excited at longer wavelength (~665 nm ) enabling their photodynamic action to occur for deeper seated tumors, at greater light penetration depths. Additionally, Phase I clinical trials have shown HPPH to have substantially reduced cutaneous photo-toxicity than its first generation counterpart and has been shown to rapidly decline within the first few days of HPPH administration.48
Based on these properties, we have utilized HPPH to promote liposome membrane destabilization. The inclusion of HPPH in the liposomes exerted dual effects: a PDT effect for tumor regression and release of a second molecule (such as calcein used here) which can be utilized for direct visualization of light triggered release, as well as for dual drug therapy with a suitable drug candidate of choice. To our knowledge, in vivo phototriggering of liposomes with red light has not been reported to date. In the current study we used a green fluorescent dye calcein as a surrogate drug, which underreports the light triggered release from liposomes due to reduced penetration of green light in tissue. Future experiments with NIR dye encapsulation in liposomes, with or without other drugs, will enable visualization of drug release in tissue depths of multiple centimeters. This report presents a novel liposome system with projected applications for cancer treatment.
Acknowledgments
We thank Roberta Smith and Dr Diana Haines (Pathology/Histotechnology Laboratory, Leidos Biomedical Research, Inc., Frederick National Laboratory for Cancer Research) for their help with tumor images. We thank Dr Ulrich Baxa (Leidos Biomedical Research, Inc., Frederick National Laboratory for Cancer Research) for electron microscopy analysis of the liposomes. Mr Patrick Hall and Mr Joseph Bergman are duly acknowledged for their assistance in assembly of liposome formulations. This research was supported by the Intramural Research Program of the NIH, National Cancer Institute, Center for Cancer Research. We thank Dr Thomas Dougherty, Roswell Park Memorial Institute, for the kind gift of HPPH. We gratefully acknowledge the funding support provided by the National Institute of Health for grants NIH-ROI 5R01 CA151962 (A Joshi). This work was also supported in part by Dan L Duncan Cancer Center Grant15 P30CA125123 and SPORE Grant No P50 CA58183 from the National Cancer Institute, Breast Cancer Research Foundation (R Schiff). We also thank Dr Shawn Zhang from Lester and Sue Smith Breast Center for providing the MDA-MB-231-LM2 cells.
Disclosure
The authors report no conflicts of interest in this work.
References
Torchilin VP. Liposomes as delivery agents for medical imaging. Mol Med Today. 1996;2:242–249. | ||||||
Torchilin VP. Recent advances with liposomes as pharmaceutical carriers. Nat Rev Drug Discov. 2005;4:145–160. | ||||||
Park JW, Benz CC, Martin FJ. Future directions of liposome and immunoliposome-based cancer therapeutics. Semin Oncol. 2004;31:196–205. | ||||||
Allen TM, Cullis PR. Liposomal drug delivery systems: from concept to clinical applications. Adv Drug Deliv Rev. 2013;65:36–48. | ||||||
Blanco E, Hsiao A, Mann AP, Landry MG, Meric-Bernstam F, Ferrari M. Nanomedicine in cancer therapy: innovative trends and prospects. Cancer Sci. 2011;102:1247–1252. | ||||||
Zhang L, Gu FX, Chan JM, Wang AZ, Langer RS, Farokhzad OC. Nanoparticles in medicine: therapeutic applications and developments. Clin Pharmacol Ther. 2008;83:761–769. | ||||||
Wang AZ, Langer R, Farokhzad OC. Nanoparticle delivery of cancer drugs. Annu Rev Med. 2012;63:185–198. | ||||||
Lehner R, Wang X, Wolf M, Hunziker P. Designing switchable nanosystems for medical application. J Control Release. 2012;161:307–316. | ||||||
Puri A, Loomis K, Smith B, et al. Lipid-based nanoparticles as pharmaceutical drug carriers: from concepts to clinic. Crit Rev Ther Drug Carrier Syst. 2009;26:523–580. | ||||||
Andresen TL, Jensen SS, Jorgensen K. Advanced strategies in liposomal cancer therapy: problems and prospects of active and tumor specific drug release. Prog Lipid Res. 2005;44:68–97. | ||||||
Shum P, Kim JM, Thompson DH. Phototriggering of liposomal drug delivery systems. Adv Drug Deliv Rev. 2001;53:273–284. | ||||||
Yavlovich A, Smith B, Gupta K, Blumenthal R, Puri A. Light-sensitive lipid-based nanoparticles for drug delivery: design principles and future considerations for biological applications. Mol Membr Biol. 2010;27:364–381. | ||||||
Regen SL, Singh A, Oehme G, Singh M. Polymerized phosphatidyl choline vesicles. Stabilized and controllable time-release carriers. Biochem Biophys Res Commun. 1981;101:131–136. | ||||||
Bisby RH, Mead C, Morgan CG. Wavelength-programmed solute release from photosensitive liposomes. Biochem Biophys Res Commun. 2000;276:169–173. | ||||||
Chandra B, Subramaniam R, Mallik S, Srivastava DK. Formulation of photocleavable liposomes and the mechanism of their content release. Org Biomol Chem. 2006;4:1730–1740. | ||||||
Lavi A, Weitman H, Holmes RT, Smith KM, Ehrenberg B. The depth of porphyrin in a membrane and the membrane’s physical properties affect the photosensitizing efficiency. Biophys J. 2002;82:2101–2110. | ||||||
Morgan CG, Bisby RH, Johnson SA, Mitchell AC. Fast solute release from photosensitive liposomes: an alternative to ‘caged’ reagents for use in biological systems. FEBS Lett. 1995;375:113–116. | ||||||
Jin CJ, Zhang Y, Tian Z, et al. [Clinical study of photodynamic therapy with visudyne for polypoidal choroidal vasculopathy]. Zhonghua Yan Ke Za Zhi. 2007;43:642–645. Chinese. | ||||||
Bressler NM, Bressler SB. Photodynamic therapy with verteporfin (Visudyne): impact on ophthalmology and visual sciences. Invest Ophthalmol Vis Sci. 2000;41:624–628. | ||||||
Debefve E, Pegaz B, van den BH, Wagnieres G, Lange N, Ballini JP. Video monitoring of neovessel occlusion induced by photodynamic therapy with verteporfin (Visudyne), in the CAM model. Angiogenesis. 2008;11:235–243. | ||||||
Puri A. Phototriggerable liposomes: current research and future perspectives. Pharmaceutics. 2013;6:1–25. | ||||||
Miller CR, Clapp PJ, O’Brien DF. Visible light-induced destabilization of endocytosed liposomes. FEBS Lett. 2000;467:52–56. | ||||||
Thompson DH, Gerasimov, OV, Wheeler JJ, Rui Y, Anderson VC. Triggerable plasmalogen liposomes:improvement of system efficiency. Biochim Biophys Acta. 1998;1279:25–34. | ||||||
Gerasimov OV, Boomer JA, Qualls MM, Thompson DH. Cytosolic drug delivery using pH- and light-sensitive liposomes. Adv Drug Deliv Rev. 1999;38:317–338. | ||||||
Weissleder R, Ntziachristos V. Shedding light onto live molecular targets. Nat Med. 2003;9:123–128. | ||||||
Gabizon AA. Stealth liposomes and tumor targeting: one step further in the quest for the magic bullet. Clin Cancer Res. 2001;7:223–225. | ||||||
Yavlovich A, Singh A, Tarasov S, Capala J, Blumenthal R, Puri A. Design of liposomes containing photopolymerizable phospholipids for triggered release of contents. J Therm Anal Calorim. 2009;98:97–104. | ||||||
Yavlovich A, Singh A, Blumenthal R, Puri A. A novel class of photo-triggerable liposomes containing DPPC:DC(8,9)PC as vehicles for delivery of doxorubcin to cells. Biochim Biophys Acta. 2011;1808:117–126. | ||||||
Rhodes DG, Blechner SL, Yager P, Schoen PE. Structure of polymerizable lipid bilayers. I – 1,2-bis(10,12-tricosadiynoyl)-sn-glycero-3-phosphocholine, a tubule-forming phosphatidylcholine. Chem Phys Lipids. 1988;49:39–47. | ||||||
Singh A, Markowitz MA, Tsao LI, Deschamps J. Enzyme immobilization on polymerizable phospholipid assemblies. Diagn Biosens Polym. 1994;556:252–263. | ||||||
Yavlovich A, Viard M, Gupta K, et al. Low-visibility light-intensity laser-triggered release of entrapped calcein from 1,2-bis(tricosa-10,12-diynoyl)-sn-glycero-3-phosphocholine liposomes is mediated through a type I photoactivation pathway. Int J Nanomedicine. 2013;8:2575–2587. | ||||||
Puri A, Jang H, Yavlovich A, Masood MA, et al. Material properties of matrix lipids determine the conformation and intermolecular reactivity of diacetylenic phosphatidylcholine in the lipid bilayer. Langmuir. 2011;27:15120–15128. | ||||||
Bellnier DA, Greco WR, Loewen GM, et al. Population pharmacokinetics of the photodynamic therapy agent 2-[1-hexyloxyethyl]-2-devinyl pyropheophorbide-a in cancer patients. Cancer Res. 2003;63:1806–1813. | ||||||
Giuliano EA, MacDonald I, McCaw DL, et al. Photodynamic therapy for the treatment of periocular squamous cell carcinoma in horses: a pilot study. Vet Ophthalmol. 2008;11(suppl 1):27–34. | ||||||
Lobel J, MacDonald IJ, Ciesielski MJ, et al. 2-[1-hexyloxyethyl]-2-devinyl pyropheophorbide-a (HPPH) in a nude Rat glioma model: implications for photodynamic therapy. Lasers Surg Med. 2001;29:397–405. | ||||||
Nava HR, Allamaneni SS, Dougherty TJ, et al. Photodynamic therapy (PDT) using HPPH for the treatment of precancerous lesions associated with Barrett’s esophagus. Lasers Surg Med. 2011;43:705–712. | ||||||
Pandey RK, Zheng G, Lee DA, Dougherty TJ, Smith KM. Comparative in vivo sensitizing efficacy of porphyrin and chlorin dimers joined with ester, ether, carbon-carbon or amide bonds. J Mol Recognit. 1996;9:118–122. | ||||||
Weinstein JN, Yoshikami S, Henkart P, Blumenthal R, Hagins WA. Liposome-cell interaction: transfer and intracellular release of a trapped fluorescent marker. Science. 1977;195:489–492. | ||||||
Minn AJ, Gupta GP, Siegel PM, et al. Genes that mediate breast cancer metastasis to lung. Nature. 2005;436:518–524. | ||||||
Ames BN, Dubin DT. The role of polyamines in the neutralization of bacteriophage deoxyribonucleic acid. J Biol Chem. 1960;235:769–775. | ||||||
Rimawi MF, Wiechmann LS, Wang YC, et al. Reduced dose and intermittent treatment with lapatinib and trastuzumab for potent blockade of the HER pathway in HER2/neu-overexpressing breast tumor xenografts. Clin Cancer Res. 2011;17:1351–1361. | ||||||
Gupta K, Jang H, Harlen K, et al. Mechanism of membrane permeation induced by synthetic beta-hairpin peptides. Biophys J. 2013;105:2093–2103. | ||||||
Fomina N, Sankaranarayanan J, Almutairi A. Photochemical mechanisms of light-triggered release from nanocarriers. Adv Drug Deliv Rev. 2012;64:1005–1020. | ||||||
Leung SJ, Romanowski M. Light-activated content release from liposomes. Theranostics. 2012;2:1020–1036. | ||||||
Muehlmann LA, Joanitti GA, Silva JR, Longo JP, Azevedo RB. Liposomal photosensitizers: potential platforms for anticancer photodynamic therapy. Braz J Med Biol Res. 2011;44:729–737. | ||||||
Paszko E, Ehrhardt C, Senge MO, Kelleher DP, Reynolds JV. Nanodrug applications in photodynamic therapy. Photodiagnosis Photodyn Ther. 2011;8:14–29. | ||||||
Skupin-Mrugalska P, Piskorz J, Goslinski T, Mielcarek J, Konopka K, Duzgunes N. Current status of liposomal porphyrinoid photosensitizers. Drug Discov Today. 2013;18:776–784. | ||||||
Bellnier DA, Greco WR, Nava H, Loewen GM, Oseroff AR, Dougherty TJ. Mild skin photosensitivity in cancer patients following injection of Photochlor (2-[1-hexyloxyethyl]-2-devinyl pyropheophorbide-a; HPPH) for photodynamic therapy. Cancer Chemother Pharmacol. 2006;57:40–45. Supplementary materials Determination of calcein and HPPH in the liposomes Calibration curves for calcein and HPPH (2-[1-hexyloxyethyl]-2-devinyl pyropheophorbide-a) were generated using various concentrations of the molecules and by measuring absorbance (calcein, 490 nm; HPPH, 665 nm). The curves are shown in Figure S1 (HPPH, [A], calcein, [B]). Lipid concentrations were determined using the inorganic phosphorus measurements. Quantitation of number of calcein and HPPH molecules associated with the liposomes The amount of calcein, HPPH and lipid content in the liposomes was determined (Supplementary materials: Determination of calcein and HPPH in the liposomes). A molar ratio of various lipids used to formulate liposomes corresponded to an average lipid molecular weight of 834.4. Based on our analyses, a typical preparation of Formulation I or V contained 46 nmol calcein and 147 nmol HPPH/μmol lipid. Similarly, calcein only liposomes (Formulation II or VI) contained 37.1 nmol calcein/μmol lipid. These numbers were derived as follows: in a given volume of the samples, HPPH absorbance in liposome samples was analyzed and compared to an HPPH standard curve to obtain a value of 0.82 nmol/μL of liposome sample. From a phosphate assay, the phosphate concentration was 5.57 nmol/μL. From these values, the liposomes have a concentration of ([0.82/5.57]×1,000) 147 nmol HPPH/μmol lipid. Based on 105 lipids per liposome, the final value of liposome concentration is 1.47 μmol HPPH/μmol liposome particles. To further calculate the number of liposomes in a given preparation, the following parameters were used: the average hydrodynamic diameter of the liposomes was 100 nm (radius =50 nm). Based on these values, the number of liposomes and the encapsulated volume in a given sample were calculated: using the 4/3(πr3) formula, giving 5.26×10⁻¹⁶ mL. The number of lipid molecules was estimated as 117,956 per liposome with the head group area of PC as 0.49 nm2. The number of liposomes was determined using the lipid concentration of 5.57×10⁻⁶ mol/mL, and thus the number of liposomes equaled 5.57×10⁻⁶/117,956 which is 4.72×10⁻¹¹ mol/mL. The number of liposome particles in 1 mL volume was determined by multiplying the liposome concentration with Avogadro’s number, equaling 2.84×10¹³ particles/mL. Multiplying this by the volume of each liposome, (5.26×10⁻¹⁶ mL), gives 1.49×10⁻² mL, the total volume encapsulated by liposomes per mL of sample. Biodistribution of liposomes The purpose of biodistribution studies was to determine the optimal time point for in vivo photo-triggering after systemic delivery of liposomes. The DiR fluorescence signal was treated as a surrogate for liposome accumulation in tumors, and DiR fluorescence images at 2, 4, 6, 8, and 24 hours post tail vein injection of liposomes were analyzed and the fluorescence intensity counts in tumor region of interest (ROI) were quantified. (Figure S2). Maximum tumor fluorescence intensity was observed at 4 hours, however, statistically significant difference in tumor fluorescence intensities at the imaged time-points beyond 4 hours was not observed, which indicated long circulation time of liposomes. Four to 6 hours was determined to be a suitable time interval postinjection for phototriggering. Apart from tumors, high fluorescence signal from the liver was observed, which was expected due to the ~100 nm size of these liposomes.
|
 © 2014 The Author(s). This work is published and licensed by Dove Medical Press Limited. The full terms of this license are available at