")
Back to Journals » Diabetes, Metabolic Syndrome and Obesity » Volume 13
Phocea, Pseudoflavonifractor and Lactobacillus intestinalis: Three Potential Biomarkers of Gut Microbiota That Affect Progression and Complications of Obesity-Induced Type 2 Diabetes Mellitus
Authors Wang Y , Ouyang M , Gao X, Wang S , Fu C, Zeng J , He X
Received 2 December 2019
Accepted for publication 29 February 2020
Published 19 March 2020 Volume 2020:13 Pages 835—850
DOI https://doi.org/10.2147/DMSO.S240728
Checked for plagiarism Yes
Review by Single anonymous peer review
Peer reviewer comments 3
Editor who approved publication: Dr Konstantinos Tziomalos
Yuxin Wang,1,* Meishuo Ouyang,2,* Xibao Gao,1 Shuai Wang,3 Chunyang Fu,1 Jiayi Zeng,1 Xiaodong He1,4
1Department of Physical and Chemical Inspection, School of Public Health, Shandong University, Jinan, Shandong 250012, People’s Republic of China; 2Department of Public Health, Graduate School of Medicine, Osaka University, Suita, Osaka 565-0871, Japan; 3Institute of Toxicology, School of Public Health, Shandong University, Jinan, Shandong 250012, People’s Republic of China; 4Shandong Provincial Key Laboratory of Infection and Immunity, School of Basic Medical Sciences, Shandong University, Jinan, Shandong 250012, People’s Republic of China
*These authors contributed equally to this work
Correspondence: Xiaodong He
Department of Physical and Chemical Inspection, School of Public Health, Shandong University, 44 West Wenhua Road, Jinan, Shandong 250012, People’s Republic of China
Tel/Fax +86 531 88382554
Email [email protected]
Purpose: The purpose of this study was to explore the difference and association between intestinal microbiota and plasma metabolomics between type 2 diabetes mellitus (T2DM) and normal group and to identify potential microbiota biomarkers that contribute the most to the difference in metabolites.
Methods: Six male ZDF model (fa/fa) rats were fed by a Purina #5008 Lab Diet (crude protein 23.5%, crude fat 6.5%) for 3 weeks and their age-matched 6 ZDF control (fa/+) rats were fed by normal rodent diet. Their stool and blood samples were collected at 12 weeks. To analyze the microbial populations in these samples, we used a 16S rRNA gene sequencing approach. Liquid chromatography–mass spectrometry (LC-MS) followed by multivariate statistical analysis was applied to the plasma metabolites profiling. Correlation analysis of them was calculated by Pearson statistical method.
Results: Twelve potential biomarkers of intestinal microbial flora and 357 differential metabolites were found in ZDF fa/fa rats, among which there are three flora that contributed the most to the perturbation of metabolites, including genus Phocea, Pseudoflavonifractor and species Lactobacillus intestinalis.
Conclusion: Our study demonstrates the alterations of the abundance and diversity of the intestinal microbiota and the perturbation of metabolites in ZDF rats (fa/fa). We found three potential biomarkers of intestinal microbiota that may lead to perturbation in plasma metabolites. This may prompt new pathogenesis of obesity-related T2DM, but we also need to study further about the causal relationship between intestinal microbe and T2DM, so as to find the target of T2DM treatment or preventive measures.
Keywords: type 2 diabetes mellitus, Zucker diabetic fatty rats, 16S rRNA sequencing, intestinal microbiota, plasma metabolomics
Introduction
Type 2 diabetes mellitus (T2DM) is the most common metabolic disease around the world, which results in ineffective use of insulin and has accounted for 90% of diabetes.1 The International Diabetes Federation reported that there would be 693 million people over the world with diabetes by 2045.2 The progression of diabetes can lead to serious complications such as vascular disease and even death.3
With the worldwide prevalence of obesity, it is becoming more common to these obesity-associated diseases of insulin resistance (IR).4 Except for many well-known contributing factors of T2DM such as obesity, sedentary lifestyle, and aging, now the dysfunction of the gut microbiota is gaining more and more attention for its association with energy harvest.5,6 Turnbaugh et al found the obesity can raise phylum-level changes in gut microbiota, which reflected in lower bacterial diversity, gene expression changes and influences of metabolic in twins.7 Studies so far have already proved that the difference between T2DM patients and the normal group of gut microbiota plays a vital role in IR and metabolic syndrome-developing progress.8,9 And this may be due to the contribution of gut microbiota to the metabolites and glucose metabolism by regulating the composition of bile-acid pools and glucose metabolism modulation signaling.10 As is well-known, bile-acid plays an important role in regulating the metabolism of lipids, which serve as major structural components of biological membranes and participate in energy storage and signal transduction.11 Lipid subclasses such as phospholipids, sphingomyelins, and triglycerides, have all been related to IR and T2DM in humans.12,13 Since lipidomics related mass spectrometry-based techniques can conduct the qualitative and quantitative analysis of the lipidome profiling from cells or biological fluids, tissues and the whole organism, it naturally becomes practical tools to unravel pathological mechanisms and identify biomarkers for metabolic diseases.14 We use the extracting method of nonpolar substances, which can count in most lipids and a few other metabolites of plasma samples. Since compared with serum, metabolomics studies based on mass spectrometry using plasma samples can perform complete metabolic profiles and accurately detect metabolic dysregulations.15
At present, though many studies have been done in the IR field concerning about metabolism mechanism with T2DM or profiling the function of gut microbiota,16 concurrently combining gut microbial profile and plasma metabolomics is supposed to be more intuitive to demonstrate about the connection between gut microbial and the host’s metabolic changes.
Zucker diabetic fatty (ZDF) rat is an animal model characterized by leptin receptor deficiency that induces hyperphagia leading to inchoate fat.17 Naturally occurring glucose tolerance makes ZDF rats an ideal experimental subject to simulate the progress of human T2DM.18 ZDF model (fa/fa) group was induced to develop diabetes by a high-energy diet, and ZDF control (fa/+) group had no diabetes symptoms, but both groups were obese. In the present study, we used gene sequencing technology, combined with the ultra-performance liquid chromatography–mass spectrometry technology, to explore differences of the intestinal microbial metagenomics and plasma metabolites between groups. We found 12 potential biomarkers of gut microbiota and some of them were highly correlated with diverse perturbed metabolites, mostly lipids.
A detailed understanding of the pathophysiology of T2DM is a prerequisite for the development of preventive strategies. In particular, the identification of early metabolic alterations is promising in the study of etiological pathways and may further help to identify high-risk individuals. By further detecting the intestinal microbial condition of T2DM, and its impact on metabolites in blood, we have the chance to use gut microbiota as a new breakthrough in the treatment of diabetes and metabolic syndrome.
Materials and Methods
Animal
Six 8-week-old male ZDF model (fa/fa) rats fed by Purina #5008 Lab Diet (crude protein 23.5%, crude fat 6.5%) for 3 weeks and 6 age-matched ZDF control (fa/+) rats fed by normal rodent diet (Beijing Keao Xieli Feed Co., Ltd.) were purchased from Charles River Laboratories (Beijing, China). All the animals were housed at standard room temperature, with a 12-h light/12-h dark cycle with free access to food and water. Then, both groups received standard 1 week’s adaptive feeding with a basic rodent diet. The animal protocols were approved by the Institutional Animal Care and Use Committee of Shandong University.
Random Blood Glucose Test
We used Random blood glucose (RBG) to examine diabetes in the fa/fa group. Glucose levels in tail blood samples were measured from weeks 8 to 9 using a glucometer (Sinocare Inc, China). Body weight and the result of RBG showed that we have successfully built the model of ZDF rats (Supplement Figure 1).19,20
Sample Collection
Collection of both the feces and blood samples was taken at 12 weeks.21 The feces were stored in the sterile tube and then immediately snap-frozen at −80°C for microbial community analysis.22 And the blood taken from the abdominal aorta was collected under inhalation anesthesia with isoflurane then stored in the tube containing EDTAK2. The plasma separated from collecting blood after centrifuging at 3000rpm for 20 mins and then frozen at −80°C.22–25 Rats were killed by inhalational isoflurane for 60 seconds.
16S rRNA Sequencing and Analysis of Fecal Microbiota
Using the Sodium dodecyl Sulfate method, total genome DNA from samples was extracted. 16S rRNA genes of distinct regions were amplified, using specific primer 515F (5ʹ-GTGYCAGCMGCCGCGGTAA-3ʹ) and 806R (5ʹ-GGACTACHVGGGTWTCTAAT-3ʹ) with barcode. All PCR reactions were carried out in 30 µL reactions with 15 µL of Phusion® High-Fidelity PCR Master Mix (New England Biolabs); 0.2 µM of forward and reverse primers, and 10 ng template DNA. Mix the same volume of 1×loading buffer (contained SYB green) with PCR products and operate electrophoresis on 2% agarose gel for detection. PCR products were mixed in equidensity ratios. Then, mixture PCR products were purified with Gene JETTM Gel Extraction Kit (Thermo Scientific). Sequencing libraries were generated using Ion Plus Fragment Library Kit 48 rxns (Thermo Scientific) following the manufacturer’s recommendations. The library quality was based on the Qubit@ 2.0 Fluorometer (Thermo Scientific) and finally sequenced on an Ion S5TM XL platform, ultimately generated 400 bp/600 bp single-end reads.
According to Cutadapt, we performed Quality filtering.26 Then, we used UCHIME algorithm to compare reads with the reference database (Silva),27 and Clean Reads was finally obtained. Sequence analysis was performed by Uparse software (Uparse v7.0.1001).28 We defined the sequences with ≥97% similarity as the same operational taxonomic units (OTUs). We screened the representative sequence for each OTU based on Mothur algorithm (Silva Database). OTUs abundance information was normalized using a standard of sequence number corresponding to the sample with the least sequences on which subsequent analysis of alpha and beta diversity was all performed. Alpha diversity and beta diversity are calculated with QIIME (Version 1. 7. 0) and displayed with R software (Version 2.15.3). The difference of beta diversity index was achieved by using parametric test and non-parametric test between two groups, including T-test and Wilcox test. Principal component analysis (PCA) was applied to reduce the dimension of the original variables using R software. Metastat analysis performed permutation test among groups at various classification levels to obtain the p-value and then corrected the p value by Benjamini and Hochberg False Discovery Rate to obtain the q-value. The filter value of Linear discriminant analysis Effect Size (LEfSe) was set to 4 by default.
Plasma Metabolomics
Metabolites were prepared for LC-MS extracted with two rounds of 3000 rpm, 4°C centrifugation by methanol and dichloromethane. Chromatographic analysis was implemented with Waters ACQUITY ultra-performance liquid chromatography (UPLC) I-Class system. After separation by UPLC, mass spectrometry was performed by using a Xevo G2-S Q-TOF (Gentech™) with an electrospray ionization (ESI) source (Waters, Manchester, UK). In positive ion-mode, MS parameters were as follows: 2.5 kV capillary voltage; 24 V cone voltage; 100°C source temperature; 400°C desolvation temperature; 800 L/h desolvation gas flowing and 50L/h cone gas flowing. In negative ion-mode, MS parameters were as follows: 2.5 kV capillary; voltage; 25 V cone voltage; 100°C source temperature; 500°C desolvation temperature; 800 L/h desolvation gas flowing and 50 L/h cone gas flowing. We inputted the raw data into the Progenesis QI (Waters) for peak alignment, peak list containing the retention time, m/z, and peak area of each sample. Lipidmaps (http://www.lipidmaps.org), HMDB (http://www.hmdb.ca), NIST (https://chemdata.nist.gov) and an in-house lipid database were used for metabolite identification. The mass error used was 5 ppm. We completed the statistical with R software (Version 2.15.3). The threshold was set as VIP (Variable Importance in the Projection) >1.0, FC (Fold Change) >2.0 or FC<0.5, with p-value<0.05, so as to screen out the difference metabolites that met the setting conditions.
Correlation Analysis of Fecal Microbiota and Plasma Metabolites
P-value and rho of the correlation coefficients between the different metabolites and significant gut flora were calculated by Pearson statistical method (P-value was taken to 6 decimal places). P-value <0.05 (*) and |rho| ≥0.8 was considered to be statistically significant.
Results
OUTs Clustering and Diversity Analysis
A total of 925,442 clean reads with a mean length of 253 nt were obtained from all ZDF rats by Ion S5TMXL sequencing analysis after removing chimera. OUTs (Operational Taxonomic Units) were clustered based on clean data with 97% identity. Finally, 801 OTUs were found out and annotated from Class level to Species level. Figure 1A1 and A2 showed the composition of gut microbiota (top 10) at different levels based on relative proportions by each group. Alpha Diversity was used to analyze the richness and diversity within the community. The individual rarefaction curve tended to approach the saturation plateau (Figure 1B), implying high sampling coverage (beyond 99%) was accomplished in all samples. For beta diversity, Principal Component Analysis (PCA) showed that the OTUs composition within fa/fa group and fa/+ group was similar, respectively (Figure 1C).
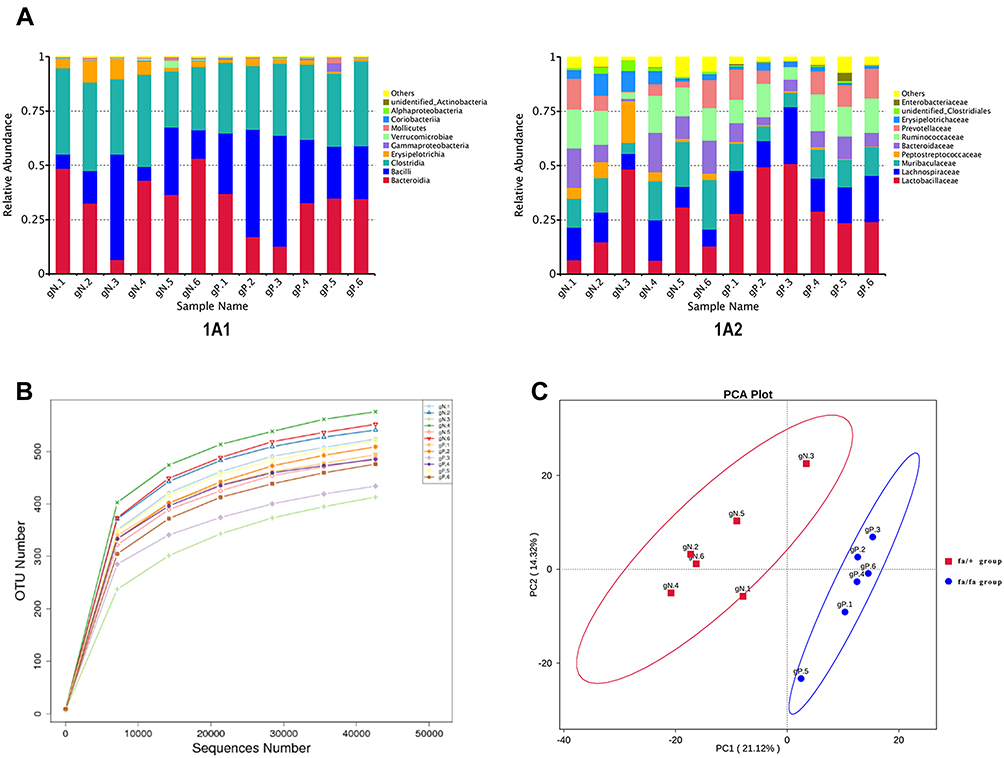 |
Figure 1 (A) Relative Abundance. Relative gut microbiota abundance at class (A1) and family (A2) level in fa/fa group and fa/+ group. Sample Name gN.1 to gN.6 belonged to fa/+ group, gP.1 to gP.6 belonged to fa/fa group. (B) Rarefaction curve of each sample with 97% identity. (C) PCA Plot. The abscissa represents the first principal component (PC1). The ordinate represents the second principal component (PC2). The percentage represents the contribution value of PC1 or PC2 to the sample difference. |
Taxonomic Composition of Gut Microbiota
The dominant phyla in both the fa/+ group and fa/fa group are Firmicutes (58.8% and 69.9%, respectively, mean) and Bacteroides (39.1% and 28.2%, respectively, mean) (Supplementary Table 1). Candidate bacteria belonging to the class Clostridia (25.8–42.5%), Bacilli (6.3–51.0%), and Erysipelotrichia (1.0–10.1%) were detected as major bacteria from within the phylum Firmicutes (Figure 1A1). Candidate bacteria belonging to the family Muribaculaceae (5.1–22.8%), Bacteroidaceae (1.0–18.3%), and Prevotellaceae (0.2–14.2%) were detected as major bacteria from within the phylum Bacteroidetes (Figure 1A2). At phylum level, the average percentage of Firmicutes and Proteobacteria was lower in fa/+ group (58.8%,0.27%) compared to fa/fa group (69.9% and 1.07%) while Bacteroidetes, Verrucomicrobia and Actinobacteria ratios were higher in the fa/+ group (39.1%, 0.95%, 0.146%, compared with 28.2%, 0.12%, 0.0996%)(Supplementary Table 1).
Intestinal Flora Biomarker of the fa/fa Group and fa/+ Group
Metastat analysis suggests that three genera of Phocea, Pseudoflavonifractor, and Flavonifractor from within the family Ruminococcaceae have significant differences between groups (Figure 2). LEfSe (LDA Effect Size) analysis showed statistically different biomarkers, including class Erysipelotrichia, order Erysipelotrichales, family Erysipelotrichaceae, Lactobacillaceae, Peptostreptococcaceae, genus Blautia, Turicibacter and species Lactobacillus intestinalis, Romboutsia (Figure 3A). Biomarkers only belonging to the fa/+ group include Peptostreptococcaceae, Romboutsia, Turicibacter (Supplementary Figure 2A). And Lactobacillus intestinalis and Blautia are only present in fa/fa group (Supplementary Figure 2B). Cladogram (Figure 3B) suggested that characteristic biomarkers from each group are homologous, respectively.
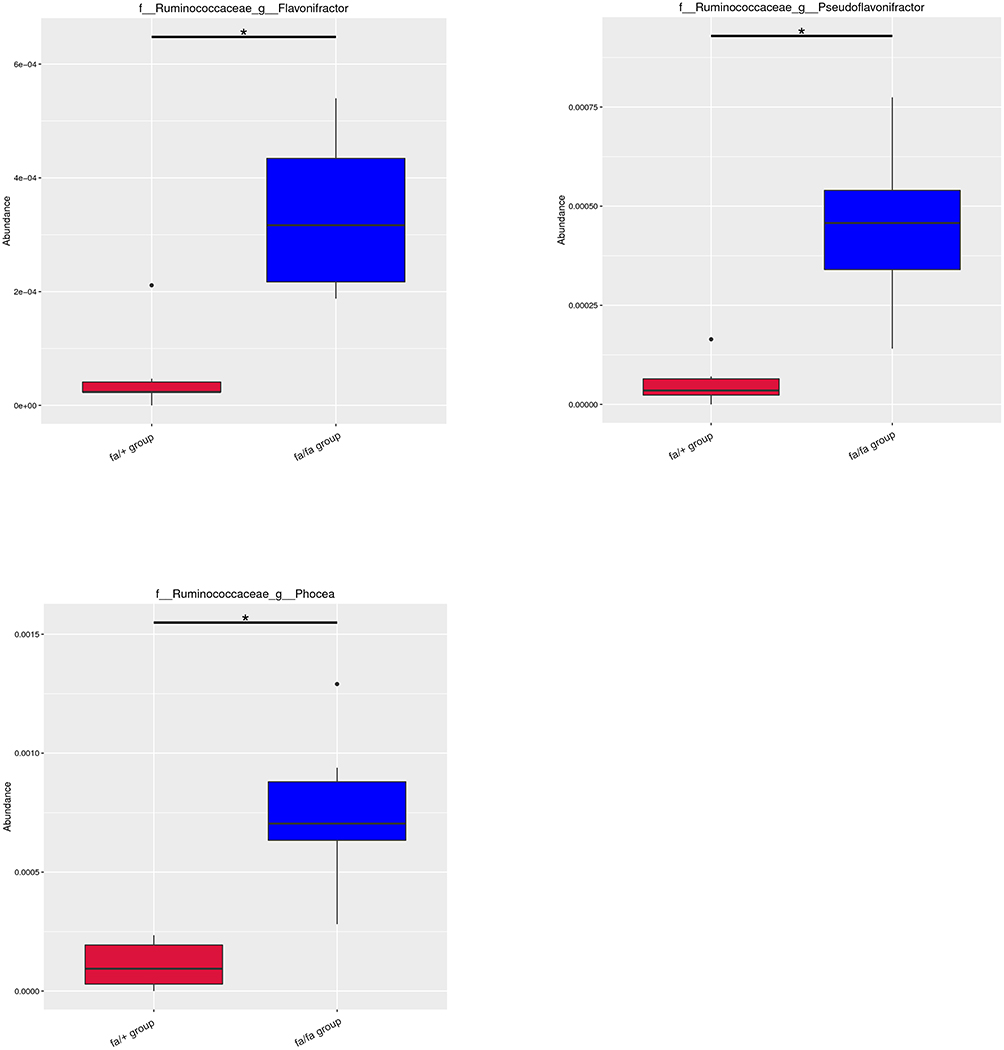 |
Figure 2 Metastat analysis uses the hypothesis test of species abundance data between groups to obtain the p-value, which was then corrected to obtain the q-value, then filtered species had significant differences according to it. *q < 0.05. Abbreviations: f, family; g, genus; s, species. |
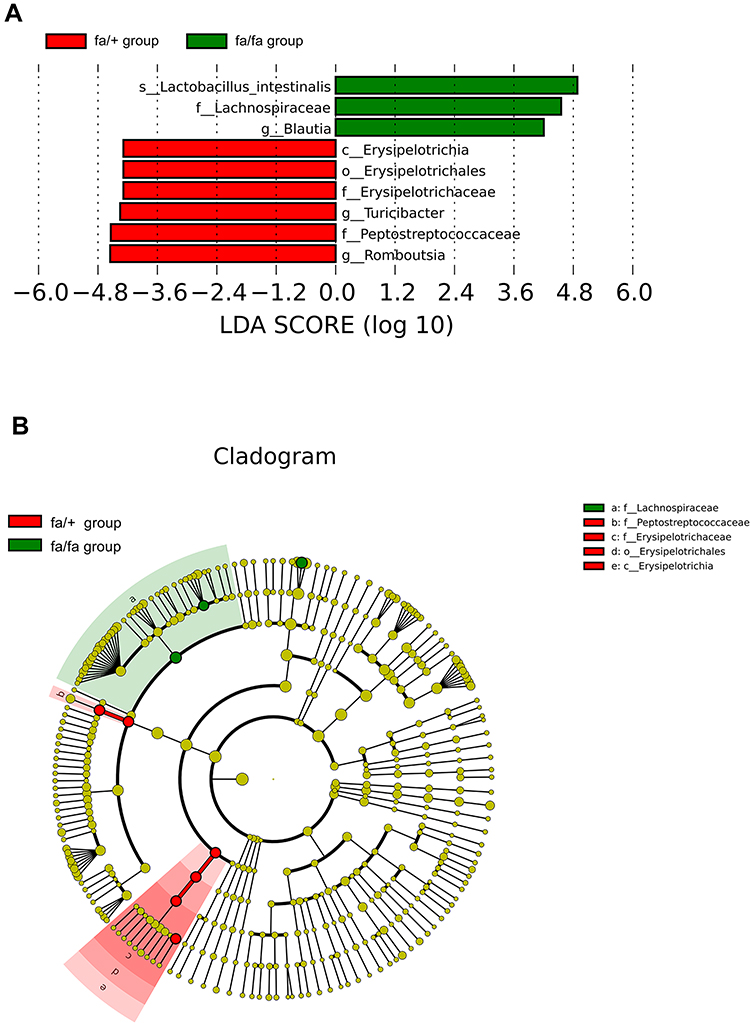 |
Figure 3 LEfSe (LDA Effect Size) can discover and interpret high-dimensional biomarkers, and emphasize statistical significance and biological correlation between groups. (A) Distribution histogram of LDA values shows the species only with LDA Score larger than 4, the length of which represents the impact size of different species (LDA Score). (B) Cladogram represents the taxonomic levels from phylum to species. The diameter of each small circle is proportional to the relative abundance. Abbreviations: c, class; o, order; f, family; g, genus; s, species. |
Plasma Metabolites Profiling of ZDF Rats
The detection methods were used to extract substances with less polarity or non-polarity. Except for a small number of other metabolites, most of the substances identified were lipids. According to the results of plasma metabolites analysis, fa/+ and fa/fa groups could be differentiated readily using Principal Component Analysis (PCA), the first two components of which (i.e., PC1 and PC2) were finest separated, as performed by positive or negative EPI spectra in Figure 4A. Figure 4B illustrates that T2DM unbalanced the lipidic profiles of the gut microbiome, with 292 increased and 65 decreased metabolites. The structures of these metabolites were diverse, including lipids mostly, bile acids, fatty acids, amino acid derivatives and so on. Among these metabolites, as illustrated in Figure 5, the variation of several specific phosphatidylcholine (PC) and phosphatidylethanolamine (PE) is consistent with previous reports.29,30 Deoxycholic acid (DCA), which is a secondary bile acid, downturned in T2DM.
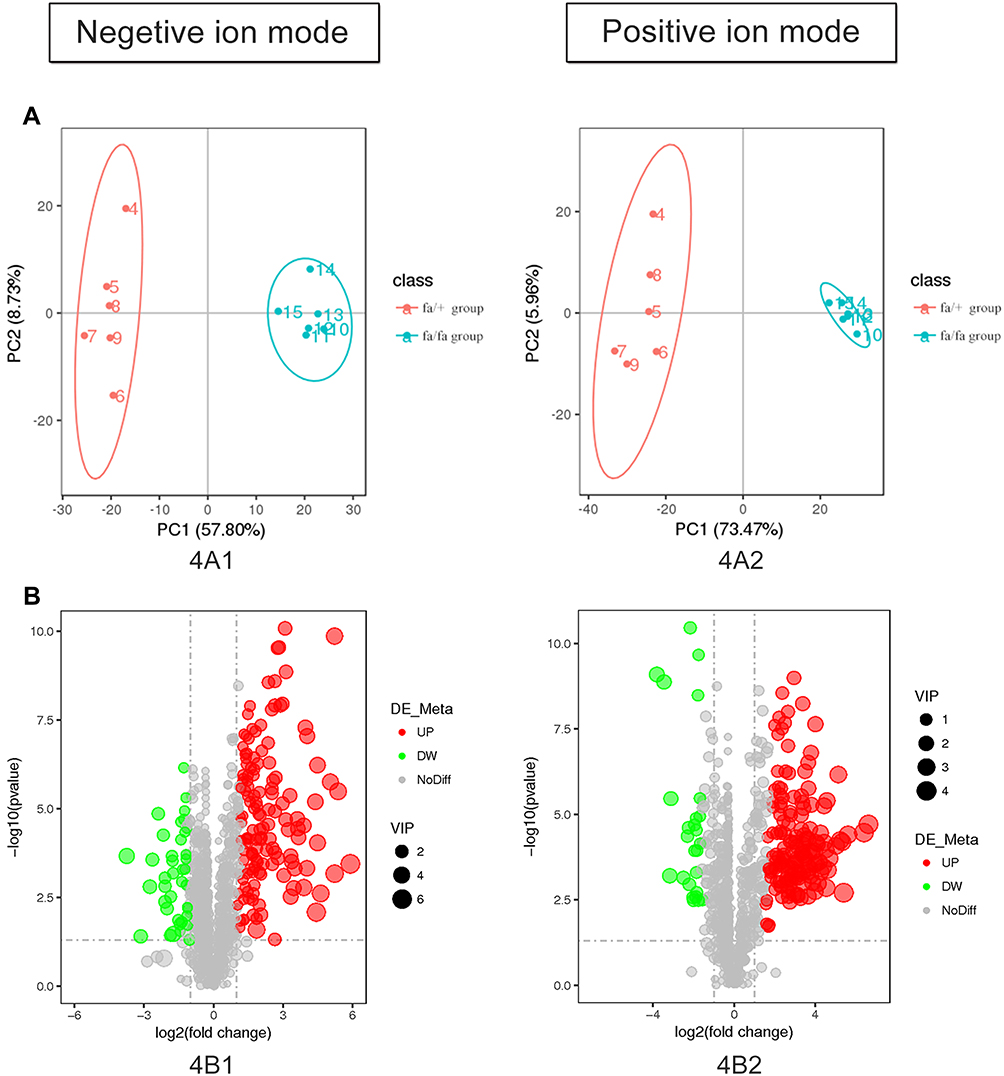 |
Figure 4 (A) Controls were separated from model rats in metabolite profiles by PCA. (B) The plasma metabolic profile of model group changed with 357 molecular features being significantly changed compared with control group (p < 0.05). |
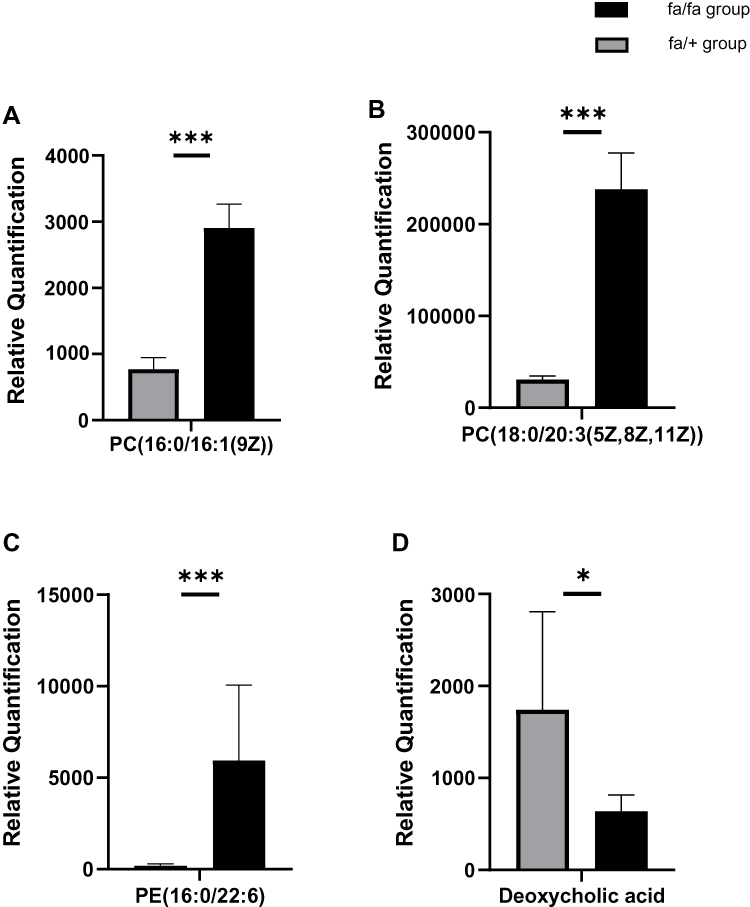 |
Figure 5 Relative Quantification of (A) PC(16:0/16:1(9Z)) (B) PC(18:0/20:3(5Z,8Z,11Z)) (C) PE(16:0/22:6(4Z,7Z,10Z,13Z,16Z,19Z) deoxycholic acid (D) that differed significantly between fa/fa group and fa/+ group. *p<0.05; ***p<0.001. Abbreviations: PC, phosphatidylcholine; PE, phosphatidylethanolamine. |
Correlation Between Gut Microbiome and Plasma Metabolites
Clear correlations could be identified between the biomarkers of gut microbiota and metabolism unbalance in plasma by the correlation matrix generated by counting the Pearson’s correlation coefficient (Figure 6). The microflora that affects most metabolites was genus Phocea, Pseudoflavonifractor and species Lactobacillus intestinalis, especially Phocea (Table 1). But there are still some metabolites that have a correlation with other flora. For example, DCA, which decreased 1.1-fold in fa/fa group, positively correlates with class Erysipelotrichia, including order Erysipelotrichales, family Erysipelotrichaceae, and genus Turicibacte, family peptostreptococcaceae and genus Romboutsia. In summary, T2DM induces a significant taxonomic perturbation in the intestinal flora, which substantially alters the metabolomic profile in blood.
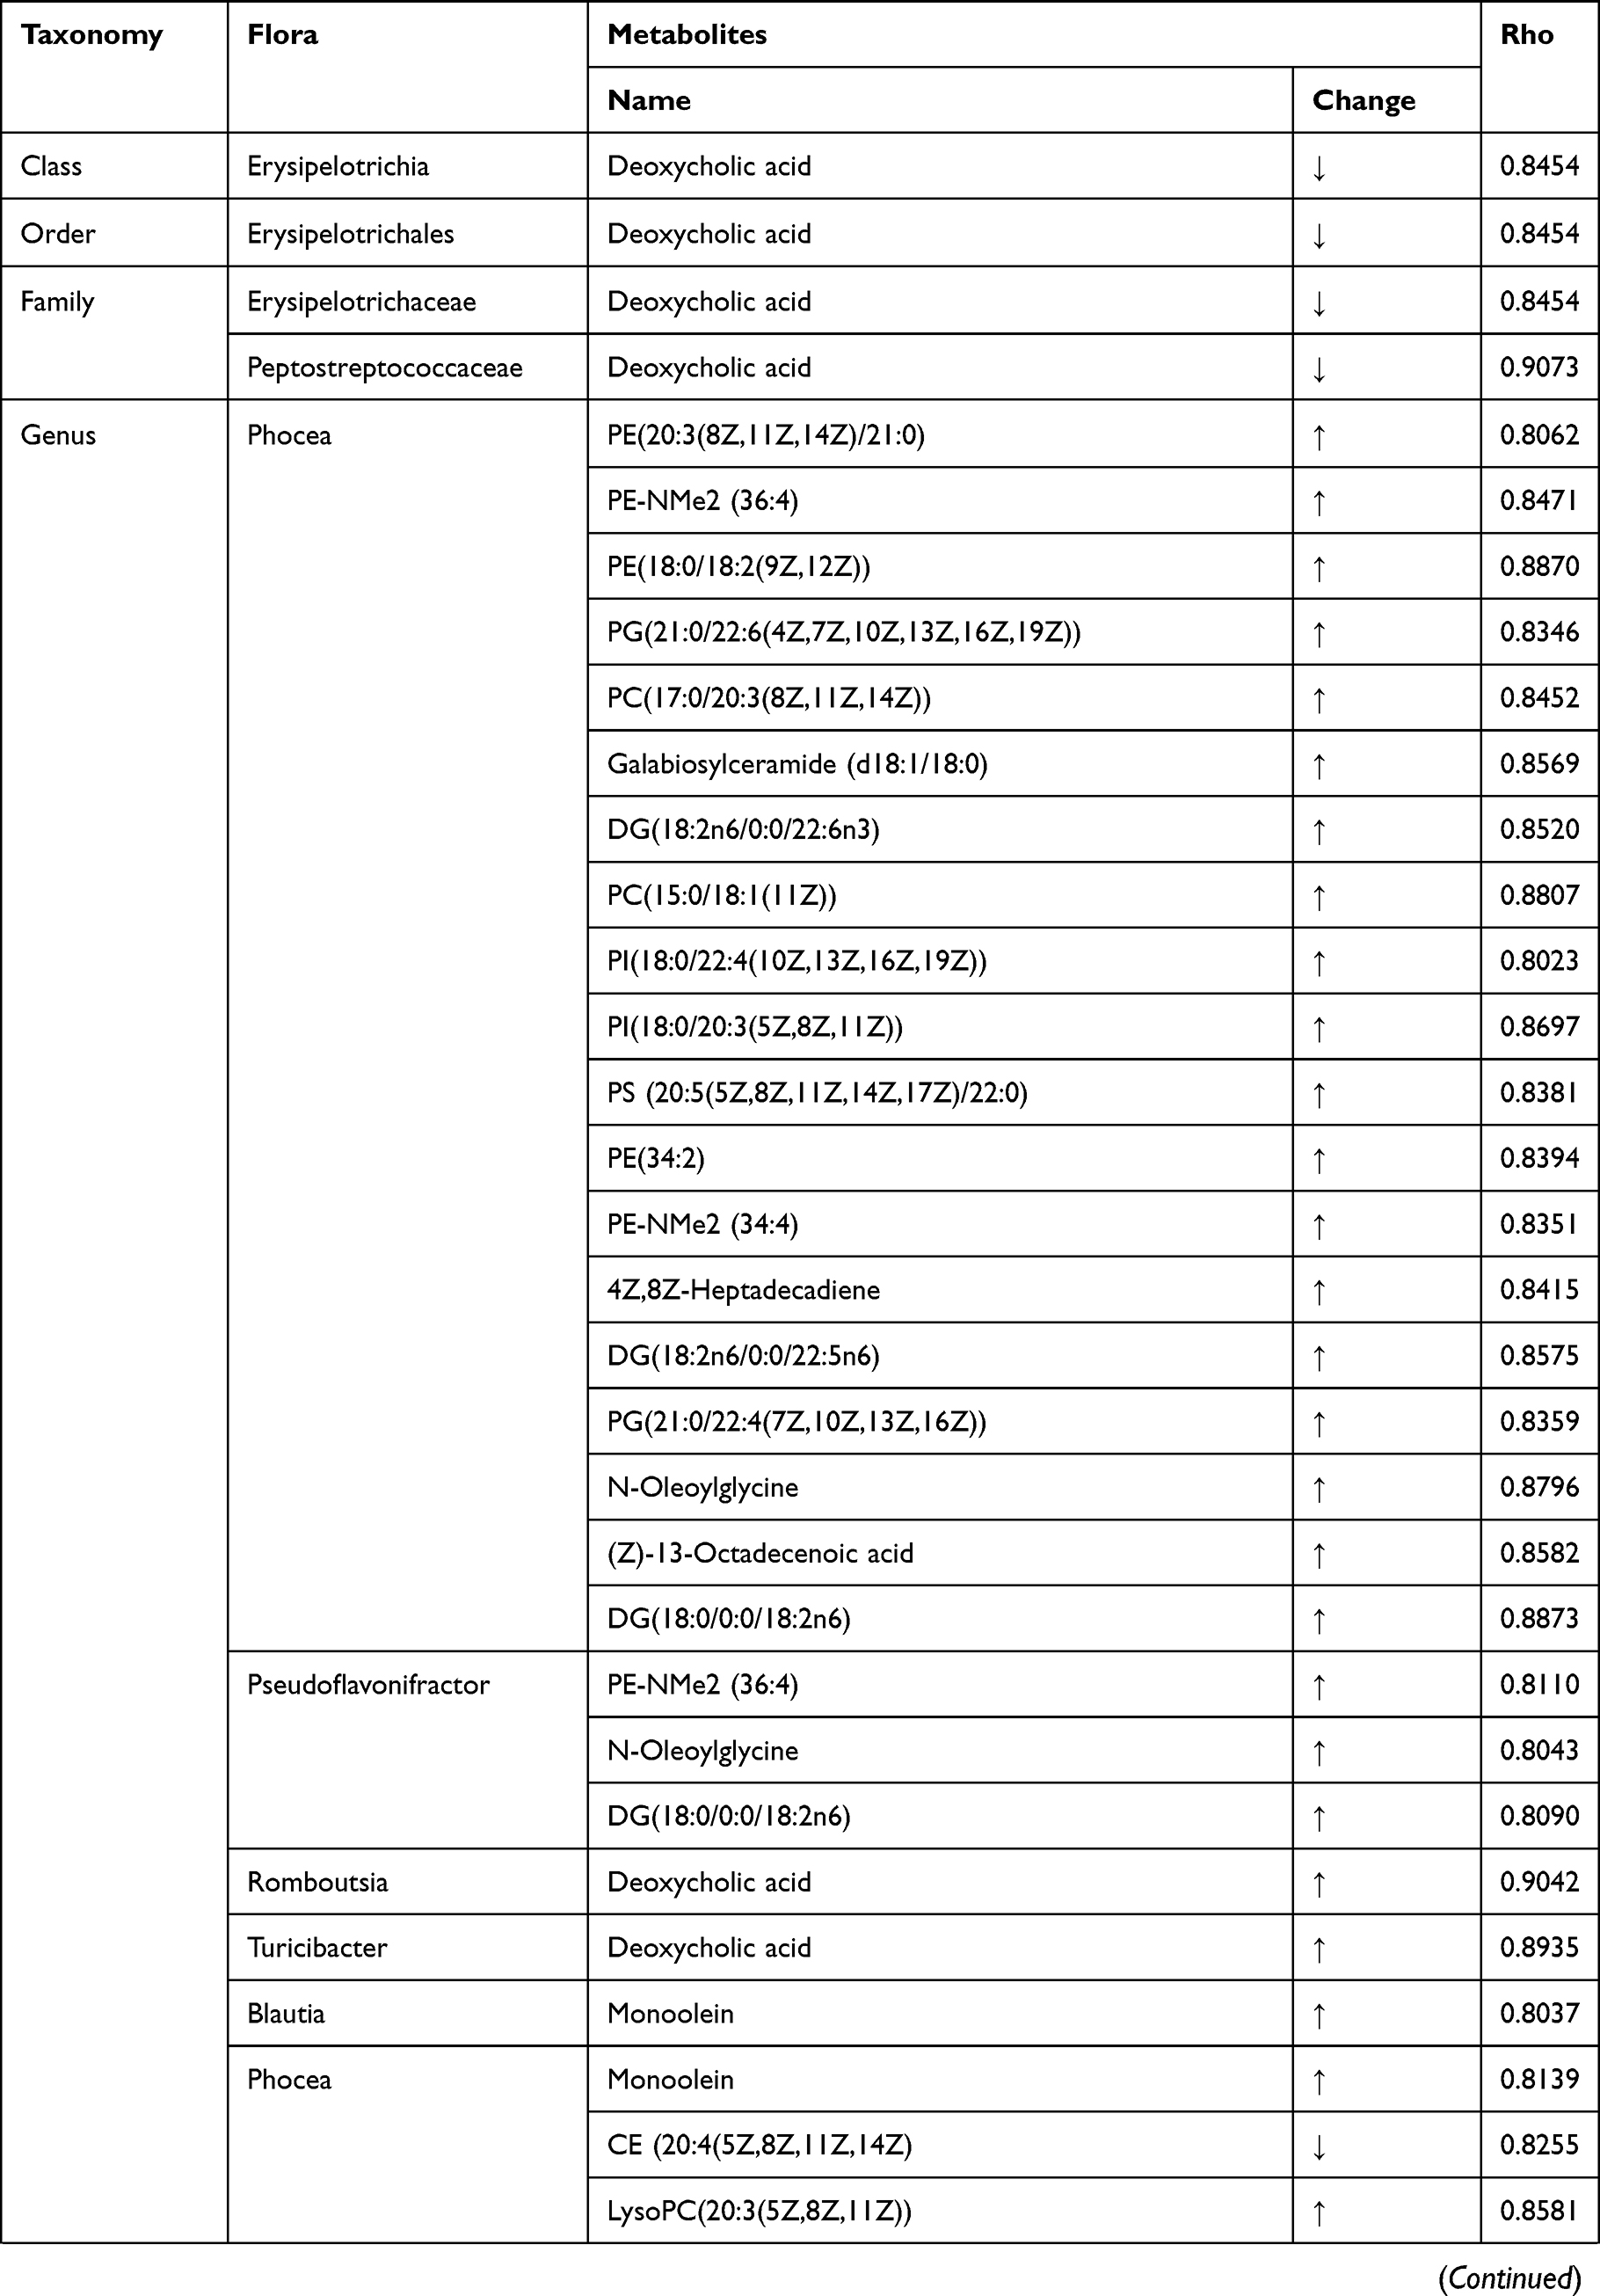 | 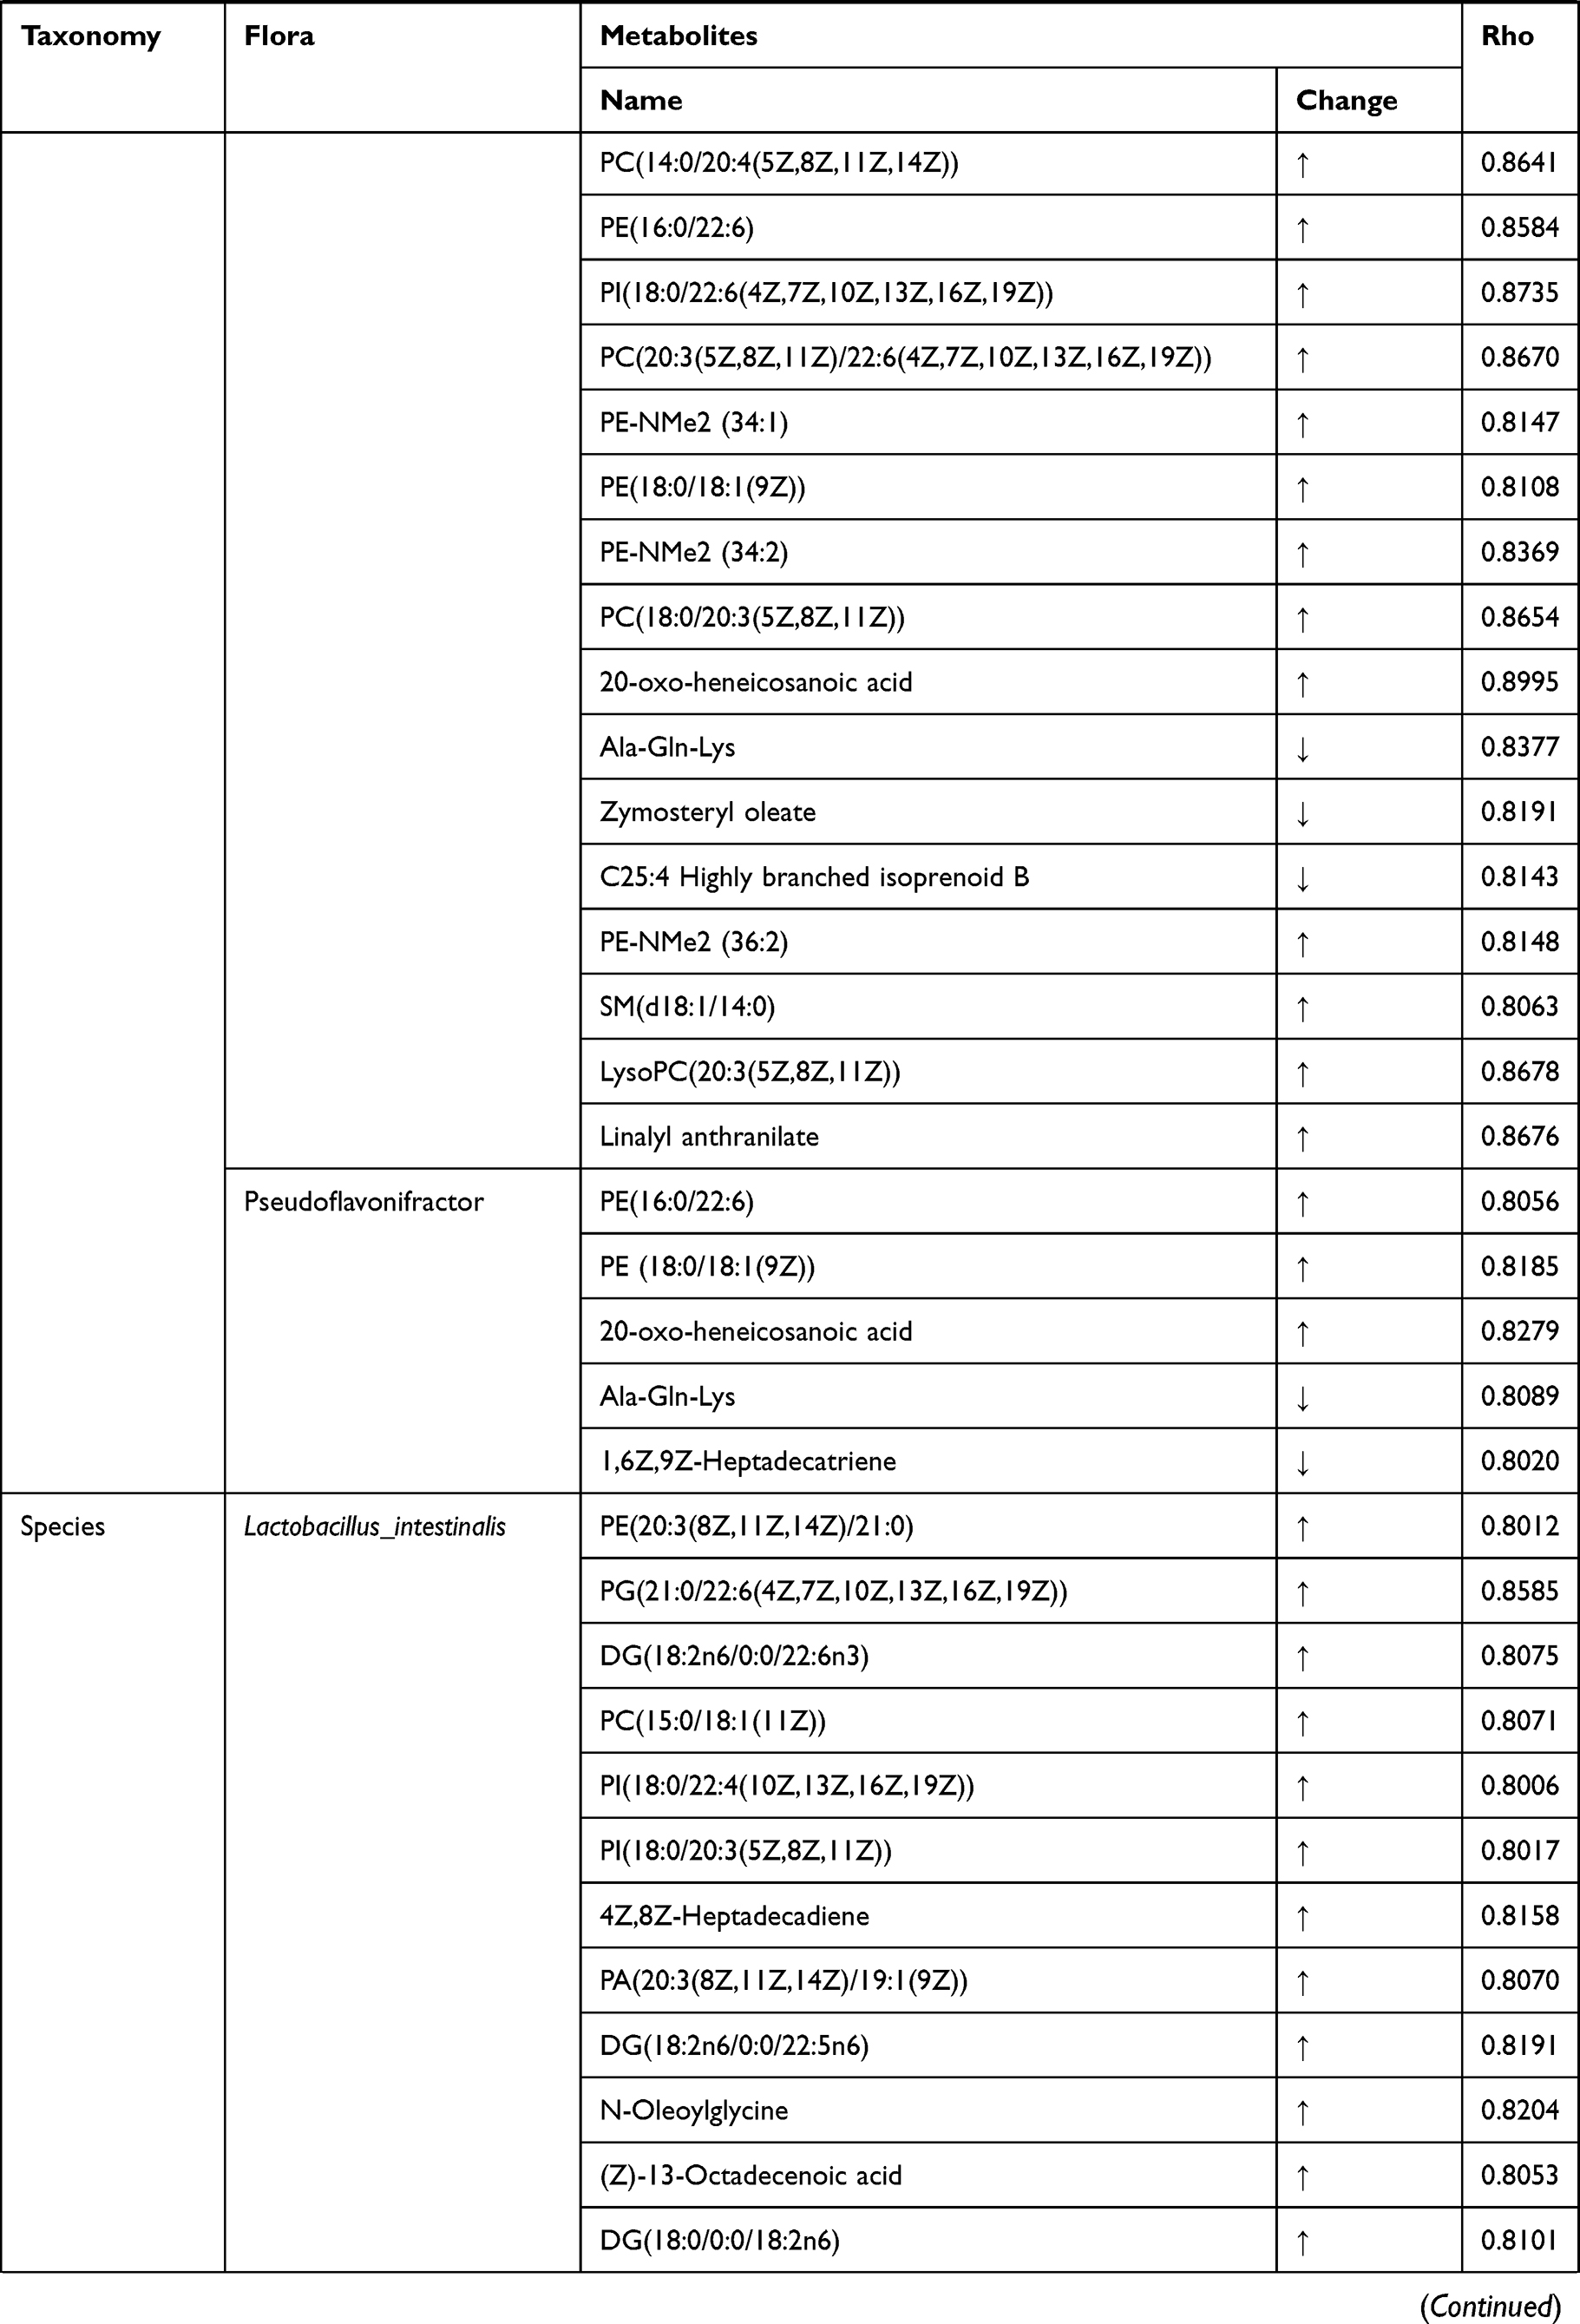 | 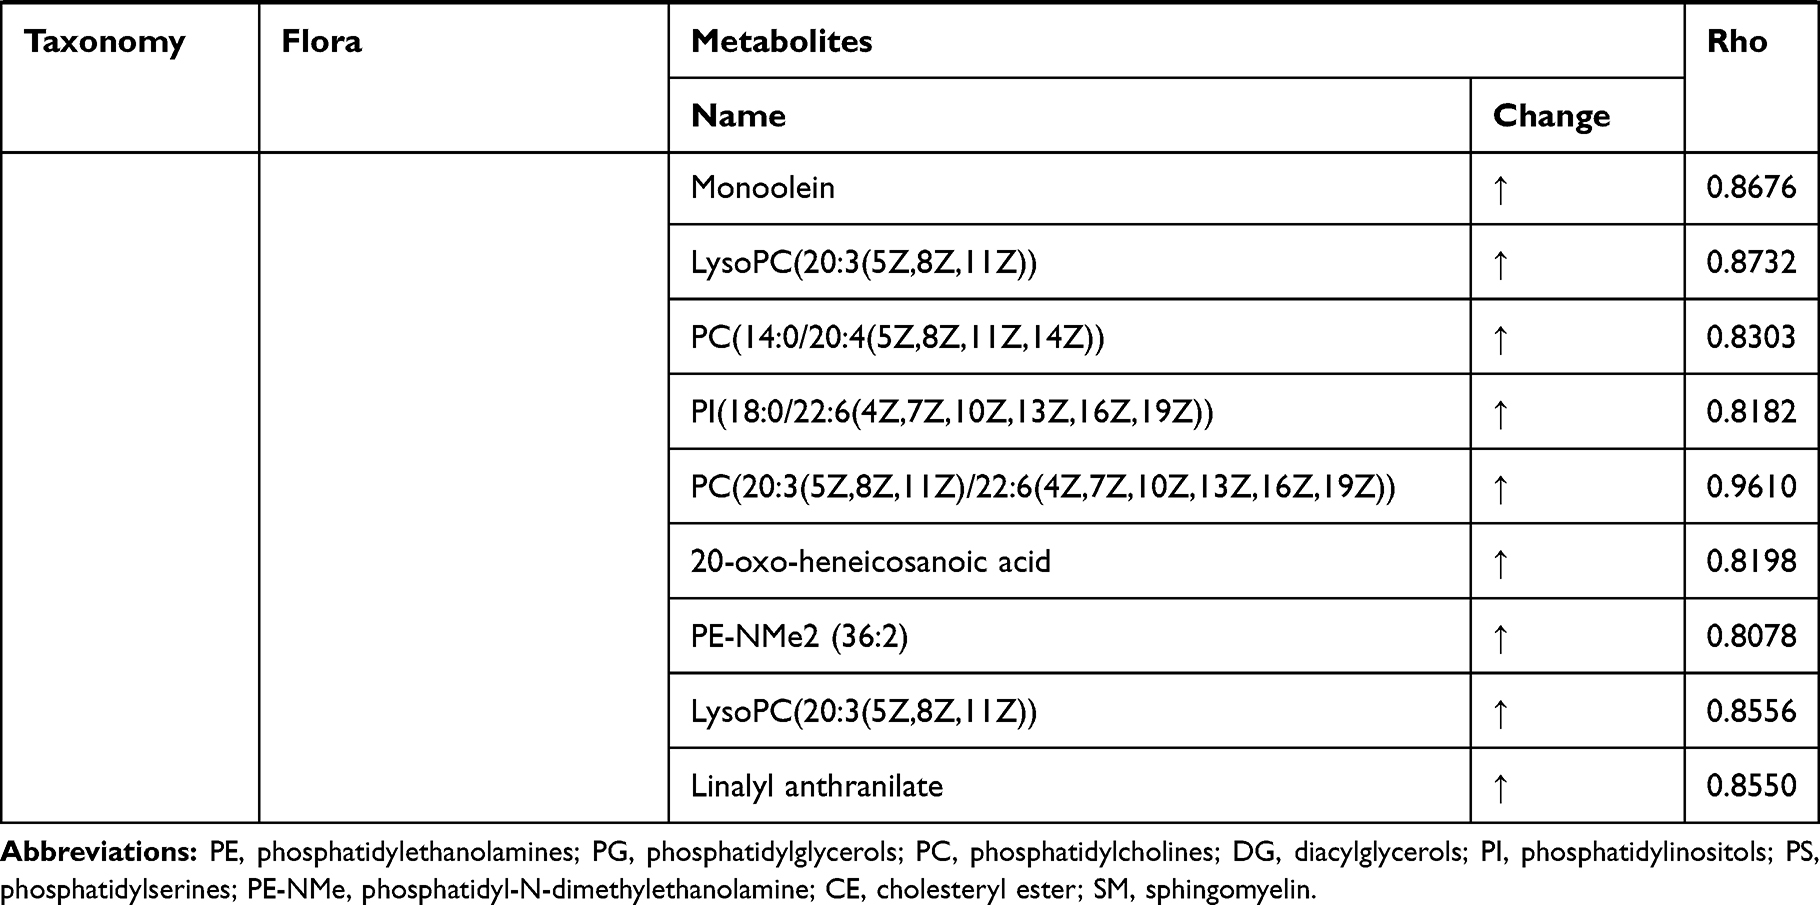 |
Table 1 Results of Association Analysis of Differential Metabolites and Biomarkers of Bacterial Flora. The Results in the Table Only Contain the Metabolite with p Value Less Than 0.05 and Rho Was Greater Than 0.8, as Well as Their Associated Flora |
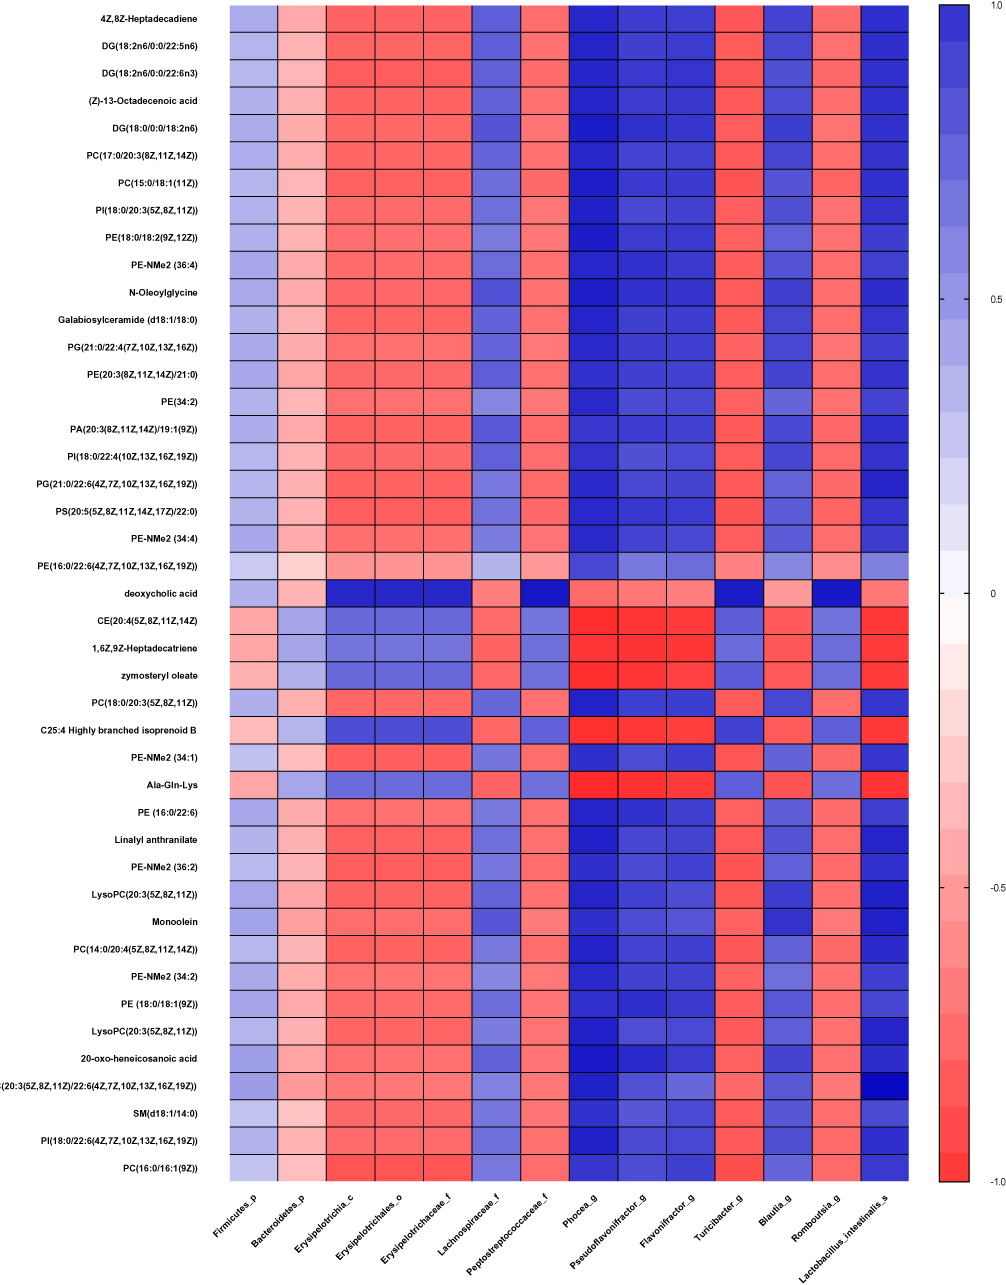 |
Figure 6 Correlation plot showing the correlation between perturbed gut bacteria and altered plasma metabolites. Abbreviations: p, phylum; c, class; o, order; f, family; g, genus; s, species. |
Discussion
Obesity is one of the main causes of T2DM and associates with IR.31,32 Intestinal microorganisms can affect the energy homeostasis and metabolic level of the host through the transformation of food.33 In ZDF rats, T2DM was induced by excessive consumption of a high-energy diet. Here, we took advantage of this rodent model to investigate the influence of intestinal microorganisms on the host in the process of obesity-induced T2DM.
Our study demonstrates that intestinal microbiome composition and plasma metabolites of ZDF rats in the fa/fa group displayed different patterns compared to the control group. Specifically, some of these differential metabolites are functional correlative with the perturbation of intestinal flora. As indicated in the results, not only the occurrence of T2DM would interfere with the growth of the intestinal microbial community, but might in turn further aggravate the disturbance of host metabolite homeostasis. These findings may provide novel insights into exploring the etiology and development mechanism of T2DM.
Our results first demonstrated significant alterations in proportion and abundance in the gut microbial community. Consistent with our findings, previous studies also have suggested the variations in the gut microbiota composition existed in the development of metabolic syndrome and obesity. For example, Hildebrandt et al reported that rapid changes, reducing Bacteroidetes and increasing Firmicutes, was observed in the high-fat-fed mice.34 These changes were supposed to be associated with accelerating calorie absorption and gain weight by helping the host to digest polysaccharides or activate AMP-activated protein kinase (AMPK).35,36 At phylum level, the abundance of Firmicutes is the most, Bacteroidetes is the second, and other phyla are few in both groups. At other levels, 12 gut flora biomarkers are obtained by statistical analysis of great significance. A previous study suggested that low abundance Erysipelotrichia can be used to predict the occurrence of T1D, with 69% prediction accuracy in NOD (no obesity diabetes) mice.37 In this study, we found that class Erysipelotrichia and order Erysipelotrichales, family Erysipelotrichaceae, which belong to the offshoots of the same evolutionary line, all decreased in fa/fa group. Thus, these results supported the association with the low abundance of this evolutionary line and T2DM. At family level, besides Erysipelotrichaceae, we also noticed that Peptostreptococcaceae also decreased in fa/fa group, while Lachnospiraceae showed the opposite trend. Plenty of members of family Lachnospiraceae have been linked to obesity in human38 and mice studies. They could accelerate the course of diabetes39 and positively correlates with the degree of atherosclerotic lesions in apoE (apolipoprotein E) KO (knockout) mice,40 which also suggested that high abundance of Lachnospiracea might potentially predict serious complications like cardiovascular disease. A population research suggested Peptostreptococcacea enriched in a normal group compared to T2DM group,41 which was consistent with our study. At genus level, Phocea, Pseudoflavonifractor, and Flavonifractor that all belonged to family Ruminococcaceae had higher abundance in fa/fa group. Many previous studies indicated that the variation trends of Ruminococcaceae and Lachnospiraceae, both of which belong to energy metabolic advantage families, were often the same, and their high abundance was related to metabolic disorders.40,42,43 On the other hand, the relative abundance of Flavonifractor has a positive correlation with inflammation cytokines, like interleukin, cholesterol and LDL levels in plasma.44,45 Flavonifractor may cleave the flavonoid C-ring and degenerate quercetin to increase oxidative stress and trigger inflammatory markers such as C5a, IL-6, IL-7, IL-8, IL-1β and IL-21.46 Notably, by obstructing the insulin signal transduction, IL-6 can induce insulin resistance.47 Moreover, IL-1β, IL-6, and IL-8 can lead to β-cell deterioration in pancreatic islets.48 So an increase in Flavonifractor may be associated with the development of T2DM.
Some studies suggested that Phocea and Pseudoflavonifractor are probiotic,49 but an increase of them in fa/fa group may be due to a decrease of else profitable strain. Other differential bacteria at genus level included Blauita, Turicibacter, and Romboutsia. The former increased, but the latter two declined. According to the previous reports, rich abundance Blauita is highly related to glucose disorders, low levels of insulin and arterial hypertension.50,51 So in this case abundant Blautia and Lachnospiraceae were possibly related to cardiovascular and cerebrovascular complications. The abundance of Turicibacter significantly increases in the early stage of diabetes.21 The genus Romboutsia was isolated from the digestive samples of ileum for the first time in 2014.52 For the past few years, studies have shown that Romboutsia is negatively correlated with fasting glucose, insulin, and HDL-C, and positively correlated with serum TC, TG, and LDL-C.53–56 A recent study found Romboutsia increased in T2DM mice model.57 Our experiment firstly illustrated a clear correlation between Romboutsia and T2DM in a diabetes rat model. But we need further evidence to see if this strain is also comparably sensitive in human T2DM prediction. The augment of species Lactobacillus intestinalis is higher in fecal samples of diabetic patients than in those of control subjects.58 Therefore, our study validated these biomarkers’ fundamental roles in predicting T2DM progression and associated complications.
Meanwhile, the plasma metabolite profile also shows variation between groups. PC(32:1) and PC(38:3) were increased in diabetes in a prospective investigation in European populations, which is consistent with our results.30 In our analysis, PC(32:1) is accurate to PC(16:0/16:1(9Z)) and PC(38:3) is accurate to PC(18:0/20:3(5Z,8Z,11Z)). And a study found that some lipids, including PE(16:0/22:6), were potential biomarkers for T2DM patients.59
Changes in the bile acid pool can cause a shift in some parameters of the metabolic syndrome (such as insulin resistance, hyperglycemia, hepatic steatosis, low HDL cholesterol levels, and cardiovascular risk).60 DCA, a secondary bile acid, is positively correlated with GLP-1, which has a hypoglycemic effect.61 Although no study yet has confirmed that bile acid can be used as an early predictor and diagnostic marker for T2DM, the results of our study supported that DCA should be further studied. DCA was also proved to be one of the endogenous ligands of Farnesoid X Receptor (FXR) that improved various dysfunctions of glucose, cholesterol, lipid, triglyceride and cholesterol metabolism.62–64 We already know that FXR-deficient mice have lower serum leptin concentrations, increased plasma-free fatty acid levels, and insulin resistance.65,66 Mechanistically, the decrease of DCA is related to the reduced absolute abundance of Bacteroidetes, the bacteria involved in DCA generation.67 Our research indicates reduced DCA also positively correlates with some members in Firmicutes, inclusive of the evolutionary branching of class Erysipelotrichia, family Peptostreptococcaceae and genus Turicibacter, Romboutsia. So it is reasonable to take DCA as a potential plasma metabolites biomarker in T2DM according to the correlation between gut microbiota abundance.
Except for DCA, the top 20 metabolites selected by p-value are most influenced by genus Phocea, Pseudoflavonifractor and species Lactobacillus intestinalis. The relative abundance of these three strains all decreased in the fa/fa group. Furthermore, genus Phocea, Pseudoflavonifractor both belong to family Ruminococcaceae which is related to energy metabolism and insulin sensitivity.68 It may reflect that some members of family Ruminococcaceae disrupt the metabolic balance then aggravate the metabolic disorders of T2DM patients.
However, we cannot draw a definite conclusion on whether T2DM changes the intestinal microflora, which in turn accentuates further disease, or pathogenic factors, such as unhealthy diet and obesity, changes gut microbiota first, thus speed up the development of sub-health leading to T2DM, or both of these situations exist.
Our study makes the influential pathway of intestinal microbe on T2DM clearer, but we also need to study further about the causal relationship between intestinal microbe and T2DM, so as to find the target of T2DM treatment or preventive measures.
Conclusion
The results showed that compared with the control group, the intestinal microbiome and plasma metabolomics of ZDF fa/fa rats were changed. There are 12 potential biomarkers of gut microbes associated with T2DM complications and hundreds of different metabolites, including DCA, were identified. In addition, correlation analysis showed that some intestinal bacteria were highly correlated with changes in plasma metabolites. In summary, these data indicated that perturbation in the intestinal microbial community in T2DM hosts is related to disorders of metabolic level. Thus, these florae may be crucial biomarkers for future studies on the pathogenesis of T2DM and its complications.
Ethics Statement
All protocols were approved by the Institutional Animal Management and Ethics Committee of Shandong University (License No: SYXK 20150015). The animal welfare followed in this study was guideline for ethical review of animal welfare in the People’s Republic of China.
Acknowledgments
This study was supported by the Program for Changjiang Scholars and Innovative Research Team in University (IRT_17R68) and The Open Project of Shandong Provincial Key Laboratory of Infection and Immunity, No. 2.
Disclosure
Yuxin Wang, Xibao Gao, Chunyang Fu, and Xiaodong He report grants from Ministry of Education of the People’s Republic of China and People’s Government of Shandong Province during the conduct of the study. The authors report no other conflicts of interest in this work.
References
1. Wu YL, Ding YP, Tanaka Y, Zhang W. Risk factors contributing to type 2 diabetes and recent advances in the treatment and prevention. Int J Med Sci. 2014;11(11):1185–1200. doi:10.7150/ijms.10001
2. Cho NH, Shaw JE, Karuranga S, et al. IDF diabetes atlas: global estimates of diabetes prevalence for 2017 and projections for 2045. Diabetes Res Clin Pract. 2018;138:271–281. doi:10.1016/j.diabres.2018.02.023
3. Ahmed KA, Muniandy S, Ismail IS. Type 2 diabetes and vascular complications: a pathophysiologic view. Biomed Res. 2010;21(2):147–155.
4. Shulman GI. Ectopic fat in insulin resistance, dyslipidemia, and cardiometabolic disease. New Engl J Med. 2014;371(23):2241.
5. Larsen N, Vogensen FK, van den Berg FWJ, et al. Gut microbiota in human adults with type 2 diabetes differs from non-diabetic adults. PLoS One. 2010;5(2):2. doi:10.1371/journal.pone.0009085
6. Ley RE, Backhed F, Turnbaugh P, Lozupone CA, Knight RD, Gordon JI. Obesity alters gut microbial ecology. Proc Natl Acad Sci U S A. 2005;102(31):11070–11075. doi:10.1073/pnas.0504978102
7. Turnbaugh PJ, Hamady M, Yatsunenko T, et al. A core gut microbiome in obese and lean twins. Nature. 2009;457(7228):480–U487. doi:10.1038/nature07540
8. Karlsson FH, Tremaroli V, Nookaew I, et al. Gut metagenome in European women with normal, impaired and diabetic glucose control. Nature. 2013;498(7452):
9. Qin JJ, Li YR, Cai ZM, et al. A metagenome-wide association study of gut microbiota in type 2 diabetes. Nature. 2012;490(7418):55–60. doi:10.1038/nature11450
10. Tremaroli V, Backhed F. Functional interactions between the gut microbiota and host metabolism. Nature. 2012;489(7415):242–249. doi:10.1038/nature11552
11. Lydic TA, Goo YH. Lipidomics unveils the complexity of the lipidome in metabolic diseases. Clin Transl Med. 2018;7(1):4.
12. Wang TJ, Larson MG, Vasan RS, et al. Metabolite profiles and the risk of developing diabetes. Nat Med. 2011;17(4):448–453. doi:10.1038/nm.2307
13. Guasch-Ferre M, Hruby A, Toledo E, et al. Metabolomics in prediabetes and diabetes: a systematic review and meta-analysis. Diabetes Care. 2016;39(5):833–846. doi:10.2337/dc15-2251
14. Markgraf DF, Al-Hasani H, Lehr S. Lipidomics-reshaping the analysis and perception of type 2 diabetes. Int J Mol Sci. 2016;17(11):11. doi:10.3390/ijms17111841
15. Denery JR, Nunes AAK, Dickerson TJ. Characterization of differences between blood sample matrices in untargeted metabolomics. Anal Chem. 2011;83(3):1040–1047. doi:10.1021/ac102806p
16. Vance JE, Vance DE. Biochemistry of Lipids, Lipoproteins and Membranes. Elsevier; 2008.
17. Phillips MS, Liu QY, Hammond HA, et al. Leptin receptor missense mutation in the fatty Zucker rat. Nat Genet. 1996;13(1):18–19. doi:10.1038/ng0596-18
18. Srinivasan K, Ramarao P. Animal models in type 2 diabetes research: an overview. Indian J Med Res. 2007;125(3):451–472.
19. Peterson RG, Shaw WN, Neel MA, Little LA, Eichberg J. Zucker diabetic fatty rat as a model for non-insulin-dependent diabetes mellitus. ILAR J. 1990;32(3):16–19. doi:10.1093/ilar.32.3.16
20. Yokoi N, Hoshino M, Hidaka S, et al. A novel rat model of type 2 diabetes: the Zucker fatty diabetes mellitus ZFDM rat. J Diabetes Res. 2013;2013:103731. doi:10.1155/2013/103731
21. Zhou W, Xu HY, Zhan LB, Lu XG, Zhang LJ. Dynamic development of fecal microbiome during the progression of diabetes mellitus in Zucker diabetic fatty rats. Front Microbiol. 2019;10:232.
22. Bando K, Kawahara R, Kunimatsu T, et al. Influences of biofluid sample collection and handling procedures on GC-MS based metabolomic studies. J Biosci Bioeng. 2010;110(4):491–499. doi:10.1016/j.jbiosc.2010.04.010
23. Dunn WB, Broadhurst D, Begley P, et al. Procedures for large-scale metabolic profiling of serum and plasma using gas chromatography and liquid chromatography coupled to mass spectrometry. Nat Protoc. 2011;6(7):1060–1083. doi:10.1038/nprot.2011.335
24. Pereira H, Martin JF, Joly C, Sebedio JL, Pujos-Guillot E. Development and validation of a UPLC/MS method for a nutritional metabolomic study of human plasma. Metabolomics. 2010;6(2):207–218. doi:10.1007/s11306-009-0188-9
25. Beckonert O, Keun HC, Ebbels TMD, et al. Metabolic profiling, metabolomic and metabonomic procedures for NMR spectroscopy of urine, plasma, serum and tissue extracts. Nat Protoc. 2007;2(11):2692–2703. doi:10.1038/nprot.2007.376
26. Martin M. Cutadapt removes adapter sequences from high-throughput sequencing reads. EMBnet J. 2011;17(1):10–12. doi:10.14806/ej.17.1
27. Quast C, Pruesse E, Yilmaz P, et al. The SILVA ribosomal RNA gene database project: improved data processing and web-based tools. Nucleic Acids Res. 2013;41(Database issue):D590–D596. doi:10.1093/nar/gks1219
28. Haas BJ, Gevers D, Earl AM, et al. Chimeric 16S rRNA sequence formation and detection in Sanger and 454-pyrosequenced PCR amplicons. Genome Res. 2011;21(3):494–504. doi:10.1101/gr.112730.110
29. Lappas M, Mundra PA, Wong G, et al. The prediction of type 2 diabetes in women with previous gestational diabetes mellitus using lipidomics. Diabetologia. 2015;58(7):1436–1442. doi:10.1007/s00125-015-3587-7
30. Floegel A, Stefan N, Yu ZH, et al. Identification of serum metabolites associated with risk of type 2 diabetes using a targeted metabolomic approach. Diabetes. 2013;62(2):639–648. doi:10.2337/db12-0495
31. Bray GA, Heisel WE, Afshin A, et al. The science of obesity management: an endocrine society scientific statement. Endocr Rev. 2018;39(2):79–132.
32. Wilson PWF, D’Agostino RB, Sullivan L, Parise H, Kannel WB. Overweight and obesity as determinants of cardiovascular risk - The Framingham experience. Arch Intern Med. 2002;162(16):1867–1872. doi:10.1001/archinte.162.16.1867
33. Fabbiano S, Suarez-Zamorano N, Chevalier C, et al. Functional gut microbiota remodeling contributes to the caloric restriction-induced metabolic improvements. Cell Metab. 2018;28(6):907–921 e907. doi:10.1016/j.cmet.2018.08.005
34. Hildebrandt MA, Hoffmann C, Sherrill-Mix SA, et al. High-fat diet determines the composition of the murine gut microbiome independently of obesity. Gastroenterology. 2009;137(5):
35. Turnbaugh PJ, Ley RE, Mahowald MA, Magrini V, Mardis ER, Gordon JI. An obesity-associated gut microbiome with increased capacity for energy harvest. Nature. 2006;444(7122):1027–1031. doi:10.1038/nature05414
36. Kahn BB, Alquier T, Carling D, Hardie DG. AMP-activated protein kinase: ancient energy gauge provides clues to modern understanding of metabolism. Cell Metab. 2005;1(1):15–25. doi:10.1016/j.cmet.2004.12.003
37. Hu Y, Peng J, Li F, Wong FS, Wen L. Evaluation of different mucosal microbiota leads to gut microbiota-based prediction of type 1 diabetes in NOD mice. Sci Rep. 2018;8(1):15451. doi:10.1038/s41598-018-33571-z
38. Cho I, Blaser MJ. The human microbiome: at the interface of health and disease. Nat Rev Genet. 2012;13(4):260–270. doi:10.1038/nrg3182
39. Kameyama K, Itoh K. Intestinal colonization by a Lachnospiraceae bacterium contributes to the development of diabetes in obese mice. Microbes Environ. 2014;29(4):427–430. doi:10.1264/jsme2.ME14054
40. Liu B, Zhang Y, Wang R, et al. Western diet feeding influences gut microbiota profiles in apoE knockout mice. Lipids Health Dis. 2018;17(1):159. doi:10.1186/s12944-018-0811-8
41. Wang Y, Luo X, Mao X, et al. Gut microbiome analysis of type 2 diabetic patients from the Chinese minority ethnic groups the Uygurs and Kazaks. PLoS One. 2017;12(3):e0172774. doi:10.1371/journal.pone.0172774
42. Gomez-Arango LF, Barrett HL, McIntyre HD, et al. Connections between the gut microbiome and metabolic hormones in early pregnancy in overweight and obese women. Diabetes. 2016;65(8):2214–2223. doi:10.2337/db16-0278
43. Bhute SS, Suryavanshi MV, Joshi SM, Yajnik CS, Shouche YS, Ghaskadbi SS. Gut microbial diversity assessment of indian type-2-diabetics reveals alterations in Eubacteria, Archaea, and Eukaryotes. Front Microbiol. 2017;8:214.
44. Huang SL, Mao J, Zhou L, Xiong X, Deng YQ. The imbalance of gut microbiota and its correlation with plasma inflammatory cytokines in pemphigus vulgaris patients. Scand J Immunol. 2019;90(3). doi:10.1111/sji.2019.90.issue-3
45. Dong YH, Cheng HM, Liu Y, Xue ML, Liang H. Red yeast rice ameliorates high-fat diet-induced atherosclerosis in Apoe(-/-) mice in association with improved inflammation and altered gut microbiota composition. Food Funct. 2019;10(7):3880–3889. doi:10.1039/C9FO00583H
46. He Z, Shao T, Li H, Xie Z, Wen C. Alterations of the gut microbiome in Chinese patients with systemic lupus erythematosus. Gut Pathog. 2016;8(1):64. doi:10.1186/s13099-016-0146-9
47. Hotamisligil GS, Peraldi P, Budavari A, Ellis R, White MF, Spiegelman BM. IRS-1-mediated inhibition of insulin receptor tyrosine kinase activity in TNF-alpha- and obesity-induced insulin resistance. Science. 1996;271(5249):665–668. doi:10.1126/science.271.5249.665
48. Ehses JA, Perren A, Eppler E, et al. Increased number of islet-associated macrophages in type 2 diabetes. Diabetes. 2007;56(9):2356–2370. doi:10.2337/db06-1650
49. Sakamoto M, Iino T, Yuki M, Ohkuma M. Lawsonibacter asaccharolyticus gen. nov., sp. nov., a butyrate-producing bacterium isolated from human faeces. Int J Syst Evol Microbiol. 2018;68(6):2074–2081. doi:10.1099/ijsem.0.002800
50. Ferrocino I, Ponzo V, Gambino R, et al. Changes in the gut microbiota composition during pregnancy in patients with gestational diabetes mellitus (GDM). Sci Rep-Uk. 2018;8(1):1–3.
51. Kashtanova DA, Tkacheva ON, Doudinskaya EN, et al. Gut microbiota in patients with different metabolic statuses: Moscow Study. Microorganisms. 2018;6(4):98. doi:10.3390/microorganisms6040098
52. Gerritsen J, Fuentes S, Grievink W, et al. Characterization of Romboutsia ilealis gen. nov., sp nov., isolated from the gastro-intestinal tract of a rat, and proposal for the reclassification of five closely related members of the genus Clostridium into the genera Romboutsia gen. nov., Intestinibacter gen. nov., Terrisporobacter gen. nov and Asaccharospora gen. nov. Int J Syst Evol Micr. 2014;64:1600–1616.
53. Liu J, Yue SJ, Yang ZR, et al. Oral hydroxysafflor yellow A reduces obesity in mice by modulating the gut microbiota and serum metabolism. Pharmacol Res. 2018;134:40–50. doi:10.1016/j.phrs.2018.05.012
54. Li TT, Tong AJ, Liu YY, et al. Polyunsaturated fatty acids from microalgae Spirulina platensis modulates lipid metabolism disorders and gut microbiota in high-fat diet rats. Food Chem Toxicol. 2019;131:110558.
55. Hua PP, Yu ZY, Xiong Y, Liu B, Zhao LN. Regulatory efficacy of Spirulina platensis protease hydrolyzate on lipid metabolism and gut microbiota in high-fat diet-fed rats. Int J Mol Sci. 2018;19(12):4023. doi:10.3390/ijms19124023
56. Wan XZ, Li TT, Liu D, et al. Effect of Marine Microalga chlorella pyrenoidosa ethanol extract on lipid metabolism and gut microbiota composition in high-fat diet-fed rats. Mar Drugs. 2018;16(12):498. doi:10.3390/md16120498
57. Han LH, Li TG, Du M, Chang R, Zhan BY, Mao XY. Beneficial effects of potentilla discolor bunge water extract on inflammatory cytokines release and gut microbiota in high-fat diet and streptozotocin-induced type 2 diabetic mice. Nutrients. 2019;11(3):670. doi:10.3390/nu11030670
58. Sato J, Kanazawa A, Ikeda F, et al. Gut dysbiosis and detection of “live gut bacteria” in blood of Japanese patients with type 2 diabetes. Diabetes Care. 2014;37(8):2343–2350. doi:10.2337/dc13-2817
59. Wang C, Kong HW, Guan YF, et al. Plasma phospholipid metabolic profiling and biomarkers of type 2 diabetes mellitus based on high-performance liquid chromatography/electrospray mass spectrometry and multivariate statistical analysis. Anal Chem. 2005;77(13):4108–4116. doi:10.1021/ac0481001
60. Schaap FG, Trauner M, Jansen PLM. Bile acid receptors as targets for drug development. Nat Rev Gastroenterol Hepatol. 2014;11(1):55–67. doi:10.1038/nrgastro.2013.151
61. Zhai HN, Li Z, Peng MA, et al. Takeda G protein-coupled receptor 5-mechanistic target of rapamycin complex 1 signaling contributes to the increment of glucagon-like peptide-1 production after Roux-en-Y gastric bypass. Ebiomedicine. 2018;32:201–214. doi:10.1016/j.ebiom.2018.05.026
62. Zhang Y, Edwards PA. FXR signaling in metabolic disease. FEBS Lett. 2008;582(1):10–18. doi:10.1016/j.febslet.2007.11.015
63. Prattichizzo F, De Nigris V, Spiga R, et al. Inflammageing and metaflammation: the yin and yang of type 2 diabetes. Ageing Res Rev. 2018;41:1–17. doi:10.1016/j.arr.2017.10.003
64. Sun L, Xie C, Wang G, et al. Gut microbiota and intestinal FXR mediate the clinical benefits of metformin. Nat Med. 2018;24(12):1919–1929. doi:10.1038/s41591-018-0222-4
65. Duran-Sandoval D, Cariou B, Percevault F, et al. The farnesoid X receptor modulates hepatic carbohydrate metabolism during the fasting-refeeding transition. J Biol Chem. 2005;280(33):29971–29979. doi:10.1074/jbc.M501931200
66. Cariou B, van Harmelen K, Duran-Sandoval D, et al. Transient impairment of the adaptive response to fasting in FXR-deficient mice. FEBS Lett. 2005;579(19):4076–4080. doi:10.1016/j.febslet.2005.06.033
67. Jia W, Xie GX, Jia WP. Bile acid-microbiota crosstalk in gastrointestinal inflammation and carcinogenesis. Nat Rev Gastroenterol Hepatol. 2018;15(2):111–128. doi:10.1038/nrgastro.2017.119
68. Moreno-Navarrete JM, Serino M, Blasco-Baque V, et al. Gut microbiota interacts with markers of adipose tissue browning, insulin action and plasma acetate in morbid obesity. Mol Nutr Food Res. 2018;62(3). doi:10.1002/mnfr.201700721
 © 2020 The Author(s). This work is published and licensed by Dove Medical Press Limited. The full terms of this license are available at https://www.dovepress.com/terms.php and incorporate the Creative Commons Attribution - Non Commercial (unported, v3.0) License.
By accessing the work you hereby accept the Terms. Non-commercial uses of the work are permitted without any further permission from Dove Medical Press Limited, provided the work is properly attributed. For permission for commercial use of this work, please see paragraphs 4.2 and 5 of our Terms.
© 2020 The Author(s). This work is published and licensed by Dove Medical Press Limited. The full terms of this license are available at https://www.dovepress.com/terms.php and incorporate the Creative Commons Attribution - Non Commercial (unported, v3.0) License.
By accessing the work you hereby accept the Terms. Non-commercial uses of the work are permitted without any further permission from Dove Medical Press Limited, provided the work is properly attributed. For permission for commercial use of this work, please see paragraphs 4.2 and 5 of our Terms.