")
Back to Journals » International Journal of Chronic Obstructive Pulmonary Disease » Volume 17
Phenotyping COPD Patients with Emphysema Distribution Using Quantitative CT Measurement; More Severe Airway Involvement in Lower Dominant Emphysema
Authors Park J , Kim EK , Lee SH, Kim MA, Kim JH, Lee SM , Lee JS , Oh YM , Lee SD, Lee JH
Received 25 February 2022
Accepted for publication 21 July 2022
Published 31 August 2022 Volume 2022:17 Pages 2013—2025
DOI https://doi.org/10.2147/COPD.S362906
Checked for plagiarism Yes
Review by Single anonymous peer review
Peer reviewer comments 3
Editor who approved publication: Dr Richard Russell
Jisoo Park,1 Eun-Kyung Kim,1 Se Hee Lee,1 Mi-Ae Kim,1 Jung-Hyun Kim,1 Sang Min Lee,2,3 Jae Seung Lee,4,5 Yeon-Mok Oh,4,5 Sang-Do Lee,4,5 Ji-Hyun Lee1 On behalf of the KOLD Study Group
1Department of Pulmonology, Allergy and Critical Care Medicine, CHA Bundang Medical Center, CHA University, Seongnam-si, Gyeonggi-do, Republic of Korea; 2Department of Radiology, Asan Medical Center, University of Ulsan College of Medicine, Seoul, Republic of Korea; 3Research Institute of Radiology, Asan Medical Center, University of Ulsan College of Medicine, Seoul, Republic of Korea; 4Department of Pulmonary and Critical Care Medicine, Asan Medical Center, University of Ulsan College of Medicine, Seoul, Republic of Korea; 5Clinical Research Center for Chronic Obstructive Airway Diseases, Asan Medical Center, University of Ulsan College of Medicine, Seoul, Republic of Korea
Correspondence: Ji-Hyun Lee, Department of Pulmonology, Allergy and Critical Care Medicine, CHA Bundang Medical Center, CHA University, 59, Yatap-ro, Bundang-gu, Seongnam-si, Gyeonggi-do, 13496, Republic of Korea, Tel +82-31-780-5205, Fax +82-31-780-2992, Email [email protected]
Purpose: We explored the differences in clinical manifestations of COPD patients regarding emphysema distribution along with evidence of airway involvement in chest computed tomography (CT) scans.
Patients and Methods: The patients were divided into three groups according to the emphysema distribution: the upper dominant (UD), lower dominant (LD), and homogeneous (HD) groups. Airway wall thickness was quantitatively measured and the presence of bronchiectasis and/or bronchial wall thickening (BE/BWT) was visually assessed. Baseline characteristics including the evidence of airway involvement and long-term outcomes were compared among the three groups. Non-severe patients of each group were first treated with 3 months of ICS/LABA combination after 2 weeks of wash-out period and lung functions before and after the treatment were compared.
Results: Of the 425 patients, 141 were in the UD, 107 in LD, and 177 in HD. The LD had more severe airway obstruction with lower emphysema index (EI) than the UD (LD vs UD; FEV1, 49.5– 14.9 vs 54.6– 16.5; EI, 21.0 [IQR: 14.0– 33.1] vs 26.3 [IQR: 15.8– 39.0]). The LD showed thicker airways (higher WA% and Pi10) and more severe air trapping (higher RV and RV/TLC) than UD. A larger proportion of patients in LD had BE/BWT (35.5% in LD vs 11.3% in UD). In LD, more patients experienced acute exacerbations and the time to first exacerbation was shorter than UD. Non-severe patients in LD treated with 3 months of ICS/LABA combined inhalers showed a notable reduction of RV than UD (LD vs UD; − 531.1– 936.5 vs − 86.5– 623.5).
Conclusion: The LD showed a more prominent airway involvement than UD, which may cause more frequent exacerbations and a marked reduction of RV after the ICS/LABA combination treatment in LD. Phenotyping of the COPD patients using quantitatively measured emphysema distribution would be useful for predicting treatment response and exacerbation.
Keywords: pulmonary disease, chronic obstructive, computed tomography, emphysema
Introduction
Chronic obstructive pulmonary disease (COPD) is a heterogeneous disease caused by irreversible structural changes in the lung, including parenchymal destruction and airway remodeling, of which the relative contribution varies among individuals.1
Chest computed tomography (CT) is a minimally invasive imaging technique capable of providing both high contrast and high-resolution detail of the lung parenchyma and airways.2 Extensive research has been devoted to the application and validation of quantitative techniques in CT-based metrics to define structural abnormality and disease severity of COPD.3–6
Emphysema is an enlargement of airspace in lung pathology caused by abnormal and permanent destruction. Emphysema is classified into two morphological subtypes of centrilobular emphysema (CLE) and panlobular emphysema (PLE) based on the portion of the involved pulmonary lobule.7 CLE is a more common subtype of emphysema in smokers characterized by an enlarged centrilobular space8 and is frequently accompanied by small airway inflammation and narrowing.9,10 The disease is usually distributed to the upper lobe or the superior segment of the lower lobe.11 PLE is characterized by uniform dilation of the entire lobule, including the respiratory bronchioles and alveoli. It is the predominant subtype in patients with α1-antitrypsin deficiency and is typically located in the lower lobe.12 In particular, PLE patients without α1-antitrypsin deficiency are less frequently accompanied by small airway wall thickening.7,10
Visual and quantitative assessments of emphysema distribution can be made in CT scans. Visual assessments correlate quite well with pathological patterns.13 The visually assessed patterns of emphysema proposed by the Fleischner Society provide distinct phenotypes of emphysema, such as CLE, PLE, and paraseptal emphysema (PSE).7 However, the reliability of visual assessment of the presence and severity of emphysema depends on intra- and interobserver agreement.14 Emphysema progresses from the upper to the lower lung as it becomes more severe, while different patterns of emphysema become indistinguishable and therefore even highly trained pathologists can disagree on the classification.15 Moreover, CLE and PLE can coexist in the same patient, for example, with CLE in the upper lobe and PLE in the lower lobe.15 In addition, the visual assessment does not provide quantitative information about emphysema severity. In addition, inter-observer agreement on peripheral airway disease, for example, bronchial wall thickening, is poor despite the use of training and standard slide set in visual assessment of chest CT scan.16
On the other hand, quantitative measurements of emphysema from a CT scan using densitometric analysis provide precise estimates of emphysema severity. Emphysema severity as assessed via chest CT is correlated with lung function decline,17 exacerbations,18–20 and mortality.19,21,22 The distribution and severity of emphysema measured via quantitative CT is correlated with its pathological grade.4,5,23 However, quantitative CT evaluation does not provide information about the phenotyping of emphysema. Instead, distribution patterns of emphysema assessed by quantitative CT scan propose notable features of clinical heterogeneity in terms of lung function impairment,24–27 decline of lung function,25,28,29 and mortality.22 The regional heterogeneity of emphysema is not fully explained in terms of differences in smoking behavior or demographic factors, and the determinants for the predominance of upper versus lower lung emphysema are largely unknown.19,30 Although combined visual and quantitative assessment of chest CT scan may provide more precise information about the heterogeneity of COPD,7,30 it is complicated to apply in daily clinical practice. Quantification of low-attenuation areas, expiratory gas trapping, and airway wall thickness in the chest CT scan using the software can help define specific COPD phenotypes with different clinical and physiologic features.20,29,31–33
Interestingly, only a few studies have reported airway involvement in association with emphysema distribution using a quantitative CT method.30,34 It is unclear if patients with upper dominant emphysema would show more severe airway remodeling and if those with lower emphysema show less airway involvement in line with classic CLE and PLE.
In this study, we explored differences in the clinical manifestations, long-term outcomes, and treatment responses of COPD patients in the Korean Obstructive Lung Disease (KOLD) cohort concerning the emphysema distribution assessed via chest CT using a quantitative method. In doing so, we focused on evidence for airway involvement in terms of emphysema distribution.
Material and Methods
Study Population
All patients were selected from the KOLD study, in which subjects were prospectively recruited, and followed between June 2005 and May 2017 from 16 centers in South Korea.35 COPD was diagnosed if all of the following criteria were met: <0.7 post-bronchodilator forced expiratory volume in 1s/forced vital capacity (FEV1/FVC) after administration of 400 µg inhaled albuterol, more than 10 pack-years of smoking history, and no or minimal abnormalities as determined from a chest radiograph. Patients with suboptimal image quality of chest CT scan due to significant motion artifacts or patients with an emphysema index (EI) < 5% in the whole lung were excluded.30,36 Baseline demographic and clinical data were collected from all patients. Dyspnea was assessed using the modified Medical Research Council (mMRC) score and health-related quality of life was estimated using the Saint George Respiratory Questionnaire (SGRQ). Pre- and post-bronchodilator spirometry, diffusing capacity, lung volume using Vmax22 (SensorMedics, Yorba Linda, CA, USA; PFDX instrument; MedGraphics, St. Paul, MN, USA), and the 6 min walk test (6MWT) were performed according to the American Thoracic Society guidelines.37 Exertional desaturation was defined as post-6MWT oxygen saturation (SpO2) < 90% or a ≥ 4% decrease compared to baseline.38 Comorbidities of each patient were recorded at baseline using the Charlson comorbidity index.39
All patients were followed up every 3 months. Clinical information, including medication history, smoking status, mMRC score, and acute exacerbation history of the previous 3 months were assessed at every visit; pre- and post-bronchodilator spirometry were performed at 6-month intervals; diffusing capacity, lung volume, 6 min walk distance (6MWD), and SGRQ score were checked annually.
Acute exacerbation was defined as worsening of symptoms (dyspnea, cough, or sputum) requiring treatment with either systemic steroids or antibiotics.1
Chest CT Scan
Patients underwent volumetric chest CT scans with a 16-MDCT scanner (Somatom Sensation 16, Siemens Medical Solutions, Forchheim, Germany; GE Lightspeed Ultra, General Electric Healthcare, Milwaukee, WI, USA; and Philips Brilliance 16, Philips Medical Systems, Best, the Netherlands) using a standardized protocol.40 Patients were scanned craniocaudally in the supine position and images from both full inspiratory and expiratory scans were obtained. Routine administration of intravenous contrast media was not performed. The effective dose of CT protocol was approximately 11 mSv. For the patients in the validation group, inspiratory CT scan of the chest was performed using a 64-slice multidetector CT scanner (Somatom Sensation 64, Siemens Healthineers). The scan parameters were equivalent to 16×0.75mm collimation, 100 effective mAs, 140 kVP, and pitch of 1.0. The scanning time depends on the lung size of the patient and the CT machine, but generally it takes 10 to 20 seconds. The scale of attenuation coefficients in this CT scanner ranges from –1024 to 3072 Hounsfield Units (HU). For image reconstruction, we used B30f kernel, 512×512 matrix, 0.75mm thickness and 0.7mm increment on Siemens CT, Standard kernel, 512×512 matrix, 0.625mm thickness and 0.625mm increment on GE CT, B filter, 512×512 matrix, 0.8mm thickness, 0.8mm increment on Philips CT. For D-field of view (FOV), the largest D-FOV including the whole lung was used. All images were analyzed using automatic segmentation software (Aview, Coreline Soft, Seoul, Korea). De-identified scans were transferred to a central imaging laboratory at Asan Medical Center for quality control assessment. Two radiologists participated in the radiological measurements. The EI was determined from the CT data by automatically calculating the volume fraction of the lungs below –950 HU at full inspiration.4 The CT air-trapping index (ATI) was defined as the ratio of mean lung density at expiration and inspiration.41 A quantitative assessment of airway dimensions was performed in the fourth (segmental), fifth, and sixth (subsegmental) generations of the following bronchial pathways: RB1 (apical segment of the right upper lobe), RB4 (lateral segment of the right middle lobe), RB10 (posterobasal segment of the right lower lobe), LB1 (apicoposterior segment of the left upper lobe), LB4 (superior segment of the lingula), and LB10 (posterobasal segment of the left lower lobe). A modified sharpening filter with a 3×9×3 kernel size was used for more accurate airway measurement. There is no significant difference between measurements from standard kernel (B50f) and soft kernel (B30f) with sharpening filter by phantom experiments.18,19 The software automatically detects the airway lumen and the inner and outer boundaries of the airway wall using a full-width-half-maximum method. The validation process using polyacrylic tubes was performed beforehand, and the software discriminated the airway lumen and the inner and outer boundaries of the airway wall automatically by the full-width-maximum method.4 Wall area (WA) and luminal area (LA) were measured in each segmental pathway, and airway wall thickness is presented as mean WA%, defined as (WA/[WA + LA]) × 100 by consensus of two radiologists.35,41 To avoid potential bias from different airway sizes between subjects, a standardized measure for airway wall thickness was derived for each subject by plotting the square root of the airway wall area against the internal perimeter of each measured airway. The resulting regression line was used to calculate the square root of the wall area for a theoretical airway with an internal perimeter of 10 mm (Pi10).6 In addition, the radiologists visually assessed the radiographs for the presence of bronchiectasis (BE) and/or bronchial wall thickening (BWT).
Determinants of Emphysema Distribution
The lungs were categorized as upper lung and as lower lung at the level of the carina. The EI of each portion was compared. When the difference between the two was ≥ 5%, the patient was included in the upper dominant emphysema group (UD); a value ≤ -5% defined the lower dominant emphysema group (LD); a value between the two extremes defined the homogenous group (HD).
Treatment Response After 3 Months of Inhaled Corticosteroid and Long-acting β2-Agonist (ICS/LABA) Combination
We underwent subgroup analysis of “non-severe” patients on the assumption that the effect of ICS/LABA on lung function would be heterogeneous according to emphysema distribution.42,43 The severity of condition was determined at the discretion of treating physicians. If a physician determined that the symptoms of a patient could deteriorate after the discontinuation of the prior prescribed medicine, the physician enrolled the patients as “severe”. On the other hand, we defined “non-severe” as the group of patients who had discontinued their original medicine for 2 weeks and participated in the study of 3 months’ treatment of ICS/LABA combination. After 3 months of treatment, pre-bronchodilator spirometry and lung volume test were repeated and the changes from the baseline values were measured.
Statistical Analysis
We tested normality for continuous variables using the Shapiro–Wilk test. One-way analysis of variance (ANOVA) compared continuous variables with normal distribution among study groups. Post-hoc analyses adopted the Bonferroni method. Likewise, we compared continuous variables without normality using the Kruskal–Wallis test with multiple pairwise comparisons by the Bonferroni method. We analyzed categorical variables by Chi-square tests. We calculated the annual decline rates of FEV1 using a linear regression model with mixed effects. In calculating the annual decline rate, we excluded the initial spirometry data of patients who had wash-out periods of treatment before enrollment. The Kaplan–Meier analysis and Cox’s proportional hazard model were applied to assess the risk for exacerbation and death. We presented continuous variables as a mean with a standard deviation or a median with an interquartile range. All the tests were two-sided, and a p-value less than 0.05 was considered significant. Statistical analyses were conducted using the IBM SPSS statistics version 27 (IBM Corp., Armonk, NY, USA).
Results
Baseline Characteristics
Among 537 COPD patients, 29 subjects with suboptimal CT data and 83 subjects with <5% for the whole lung EI were excluded. Finally, 425 patients were analyzed and categorized into three; the UD had 141 patients, the LD contained 107 patients, and the HD had 177 patients (Figure 1).
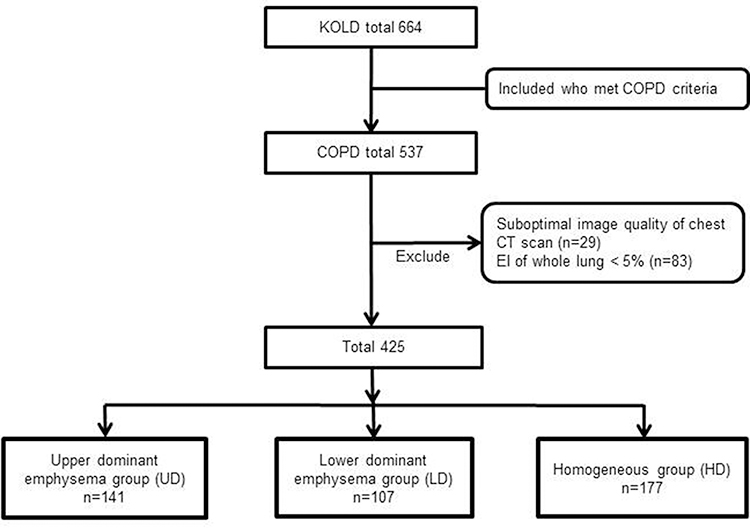 |
Figure 1 Flow diagram of the subjects enrolled in the study. Abbreviations: KOLD, Korean Obstructive Lung disease; COPD, chronic obstructive pulmonary disease; CT, computed tomography; EI, emphysema index. |
The baseline demographic and clinical characteristics of all patients are presented in Supplementary Table 1. Of the 425 patients, the mean age was 68 years, and 413 (97.2%) were male. About one-third of the patients were current smokers with 42 (interquartile range [IQR]: 28–55) pack-years of smoking history. Post-bronchodilator FEV1 was 55.3–16.6 and the median EI of the whole lung was 19.4% (IQR: 11.8–33.2). Eighty-six patients (20.2%) had BE and/or BWT based on the radiological interpretation. Eighty-three patients (19.5%) had a history of exacerbation in the previous year.
Comparison of Baseline Characteristics Among the Three Groups
No significant differences in age, sex, or the proportion of current smokers were observed among the three groups. No difference was noted in the 6MWD or the prevalence of chronic bronchitis symptoms as assessed via classic questionnaire or SGRQ.44 Patients in the HD had milder COPD than the others; they showed the highest post-bronchodilator FEV1, DLco, and BMI along with the lowest SGRQ score, BODE index, EI, and ATI. Patients in the LD had the lowest post-bronchodilator FEV1 (54.5–16.5 in UD vs 49.5–14.9 in LD vs 59.3–16.5% predicted in HD) along with the highest TLC, RV, and RV/TLC. Patients in the UD had the highest mMRC score and the lowest DLco (58.7–19.3 in UD vs 68.9–21.7 in LD vs 74.8–22.4% predicted in HD). The median EI of whole lung was lowest in the HD 14.5% (IQR: 8.2–24.8) and was slightly higher in the UD (26.0% [IQR: 15.8–39.0]) than in the LD (21.0% [IQR: 14.0–33.1]). A greater proportion of patients in the UD exhibited significant dyspnea (mMRC ≥ 2) than those in the LD and HD. Airway measurements of WA% and Pi10 were lowest in the UD. In addition, more subjects in the LD had BE and/or BWT compared to the UD and HD. The smallest number of patients experienced exacerbations during the previous year in HD (Table 1).
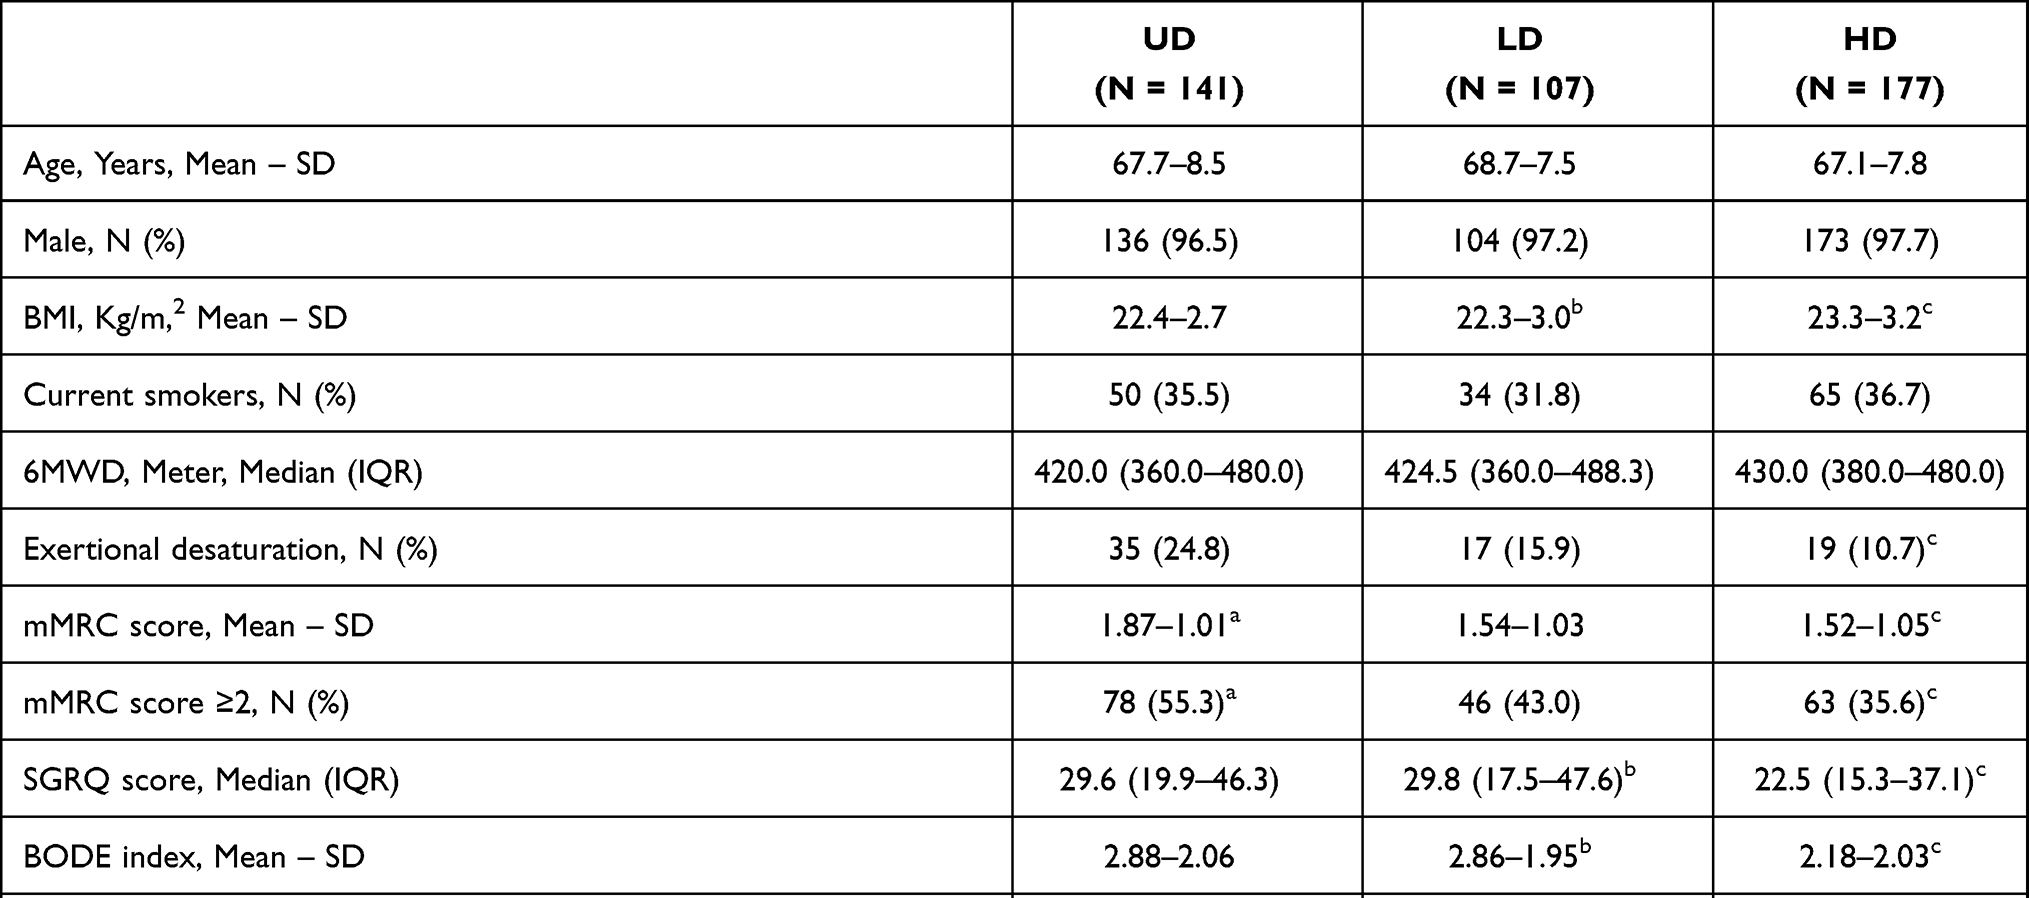 |
Table 1 Comparison of Baseline Characteristics of the Study Subjects |
Long-Term Clinical Outcomes in Terms of Emphysema Distribution
Follow-up duration was not different statistically among the three groups. The median follow-up duration was 1699 (IQR: 792–3243) days in the UD, 1689 (IQR: 1010–2938) days in the LD, and 1831 (IQR: 966–3276) days in the HD. No significant differences were observed in the annual decline of post-bronchodilator FEV1. More patients in the LD (51.4%) experienced acute exacerbations than in the UD (36.2%). The numbers of dropouts were 34 (24%) in the UD, 29 (27%) in the LD, and 32 (18%) in the HD during the period. A total of 26 patients in the UD (18.4%), 17 in the LD (15.9%), and 20 in the HD (11.3%) died during the period (Table 2). Figure 2 shows the Kaplan–Meier curves for the time to first exacerbation (Figure 2A) and the probability of survival (Figure 2B) concerning emphysema distribution. The probability of exacerbation was higher in the LD than in the other two groups (P value = 0.040 in Log rank tests) (Figure 2A). The median time to first exacerbation was shorter in the LD than in the other groups (411 [IQR, 143–649] in UD vs 385 [IQR: 155–951] in LD vs 588 [IQR: 331–843] days in HD). No significant differences in mortality were observed among the three groups (P value = 0.295 in Log rank tests) (Table 2 and Figure 2B).
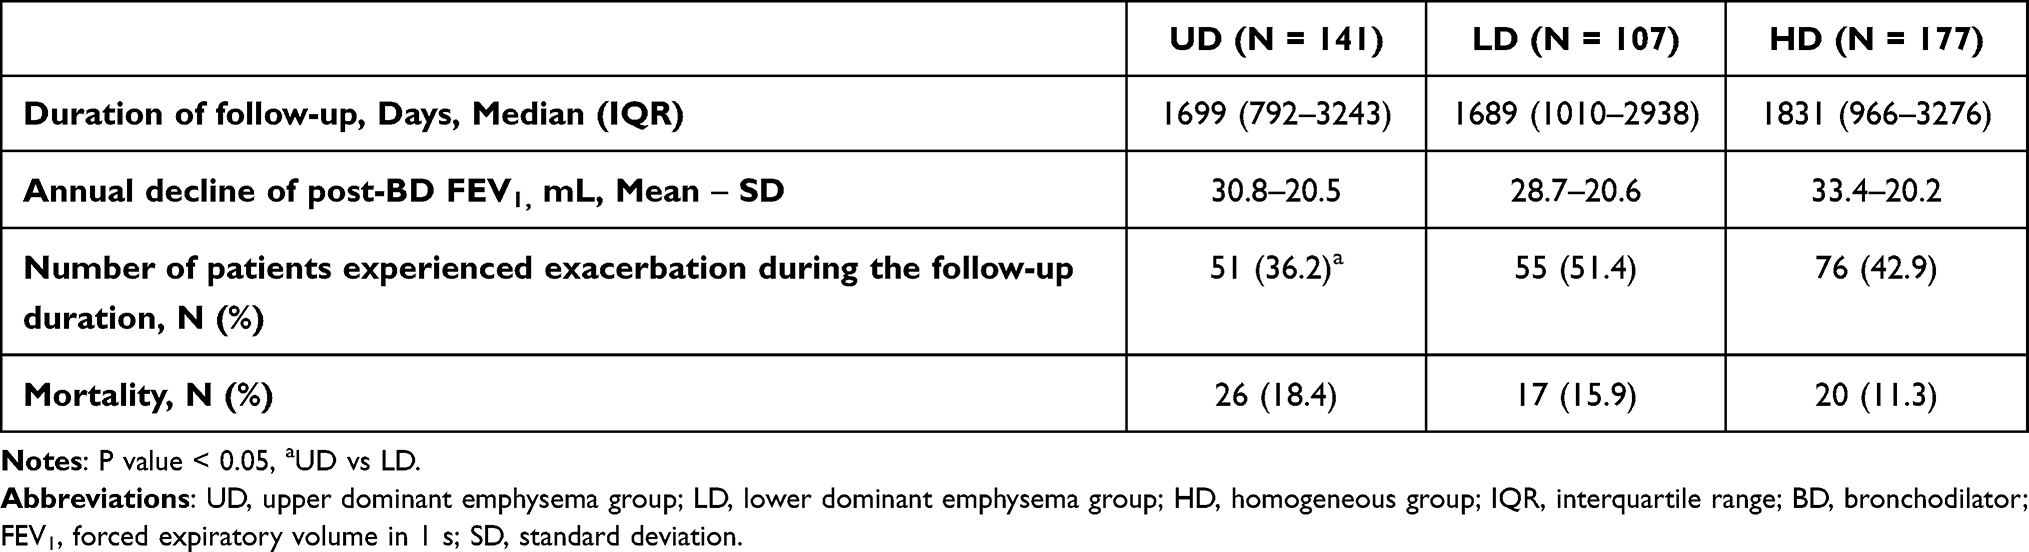 |
Table 2 Long-Term Clinical Outcomes in Terms of Emphysema Distribution |
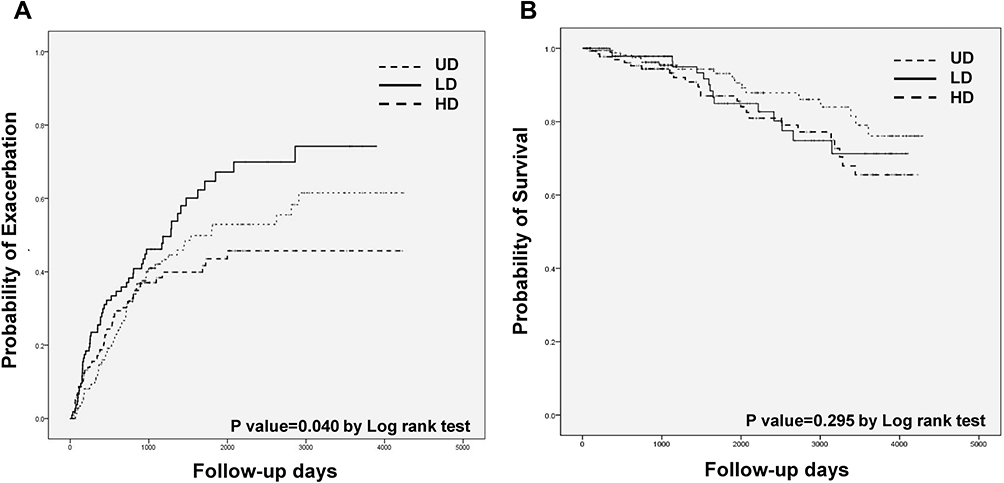 |
Figure 2 Kaplan-Meier curves for the time to first exacerbation (A) and the probability of survival (B) concerning the emphysema distribution. Abbreviations: UD, upper dominant emphysema group; LD, lower dominant emphysema group; HD, homogeneous group. |
Variables Associated with Time to First Exacerbation
In univariate analysis, age, current smoking status, post-bronchodilator FEV1, DLCO, RV/TLC, 6MWD, presence of chronic bronchitis symptoms assessed according to SGRQ, history of exacerbations in the previous year, and the presence of BE and/or BWT were significantly associated with time to first exacerbation. A multivariate Cox-proportional hazard model revealed that current smoking status, RV/TLC, 6MWD, and the presence of BE and/or BWT in a CT scan were significantly related to time to first exacerbation (Table 3).
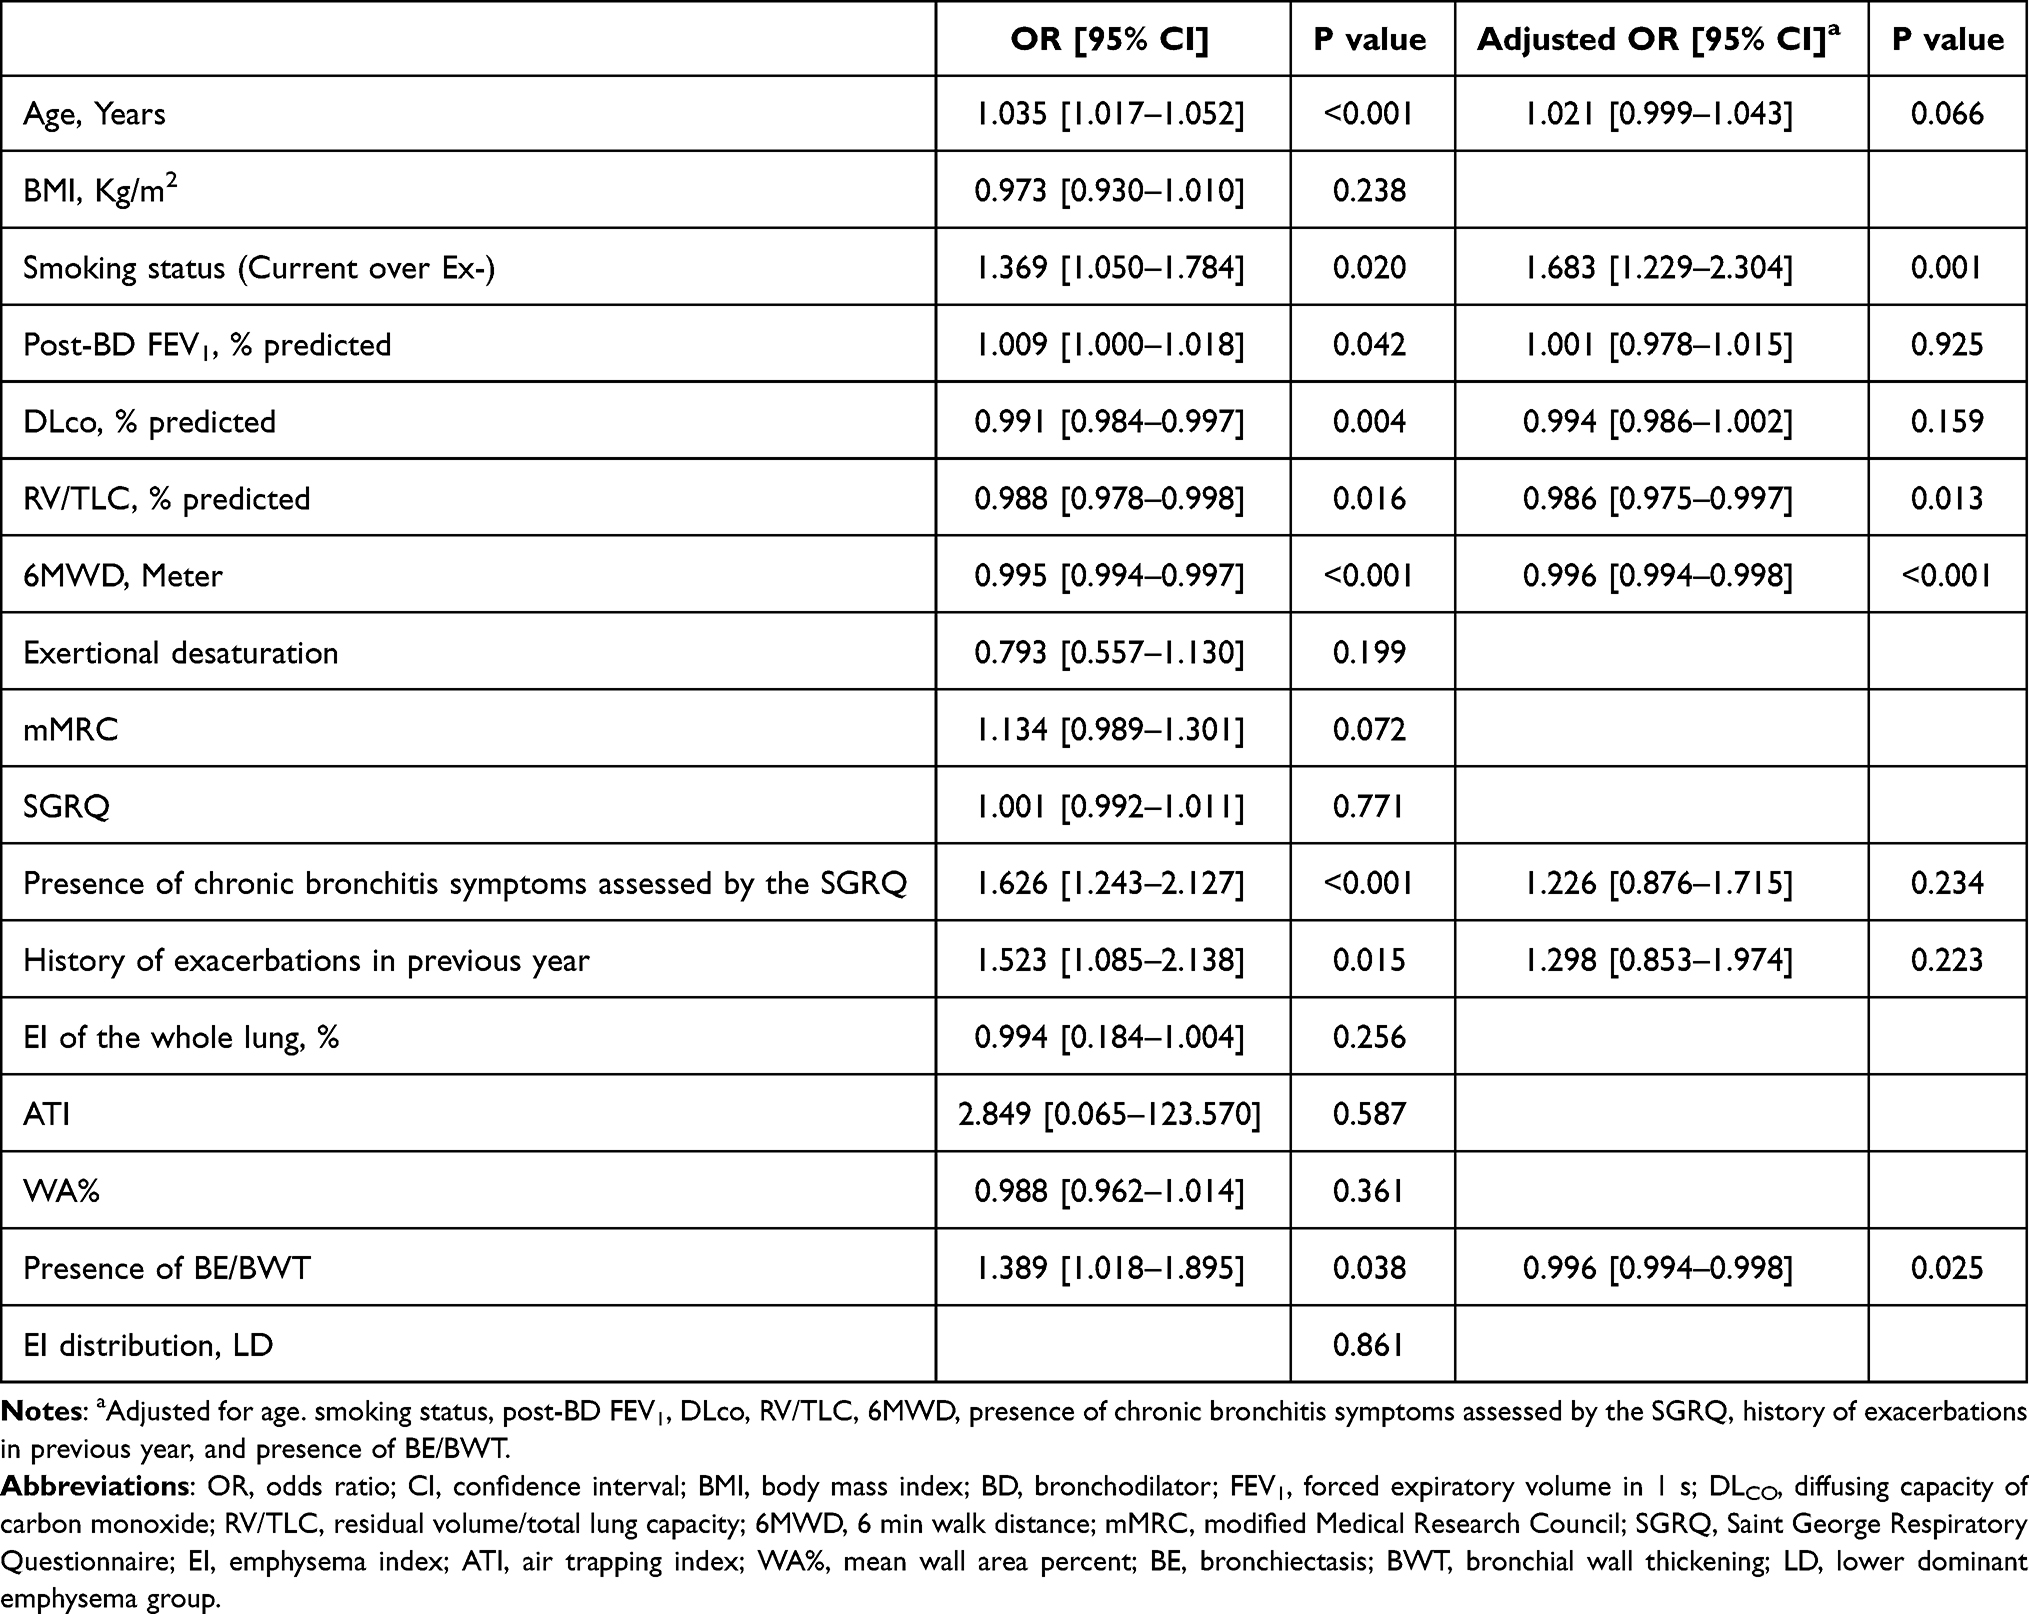 |
Table 3 Variables Associated with Time to First Exacerbation |
Response After 3 Months of ICS/LABA Treatment
Among the 425 patients, 272 “non-severe” patients had a wash-out period for 2 weeks and participated in the study of 3 months’ treatment of ICS/LABA combination. Patients whose symptoms were too severe for them to discontinue their pre-prescribed inhalers were excluded(n=153). Clinical characteristics of the non-severe and severe patients were posted in Supplementary Table 2.
In the 272 non-severe patients, 82 patients in the UD, 56 patients in the LD, and 134 patients in the HD were compared. The baseline characteristics of the three groups of non-severe patients showed a similar tendency to all patients in terms of the pulmonary function test and CT measurements. After the treatment, more improvement of FEV1 and FVC was observed in the LD and HD compared to UD, even though it was not statistically significant. The degree of reduction in RV was larger in the LD than in the UD or HD (–86.5–623.5 in UD vs –531.1–936.5 in LD vs –201.2–589.6 in HD) (Table 4).
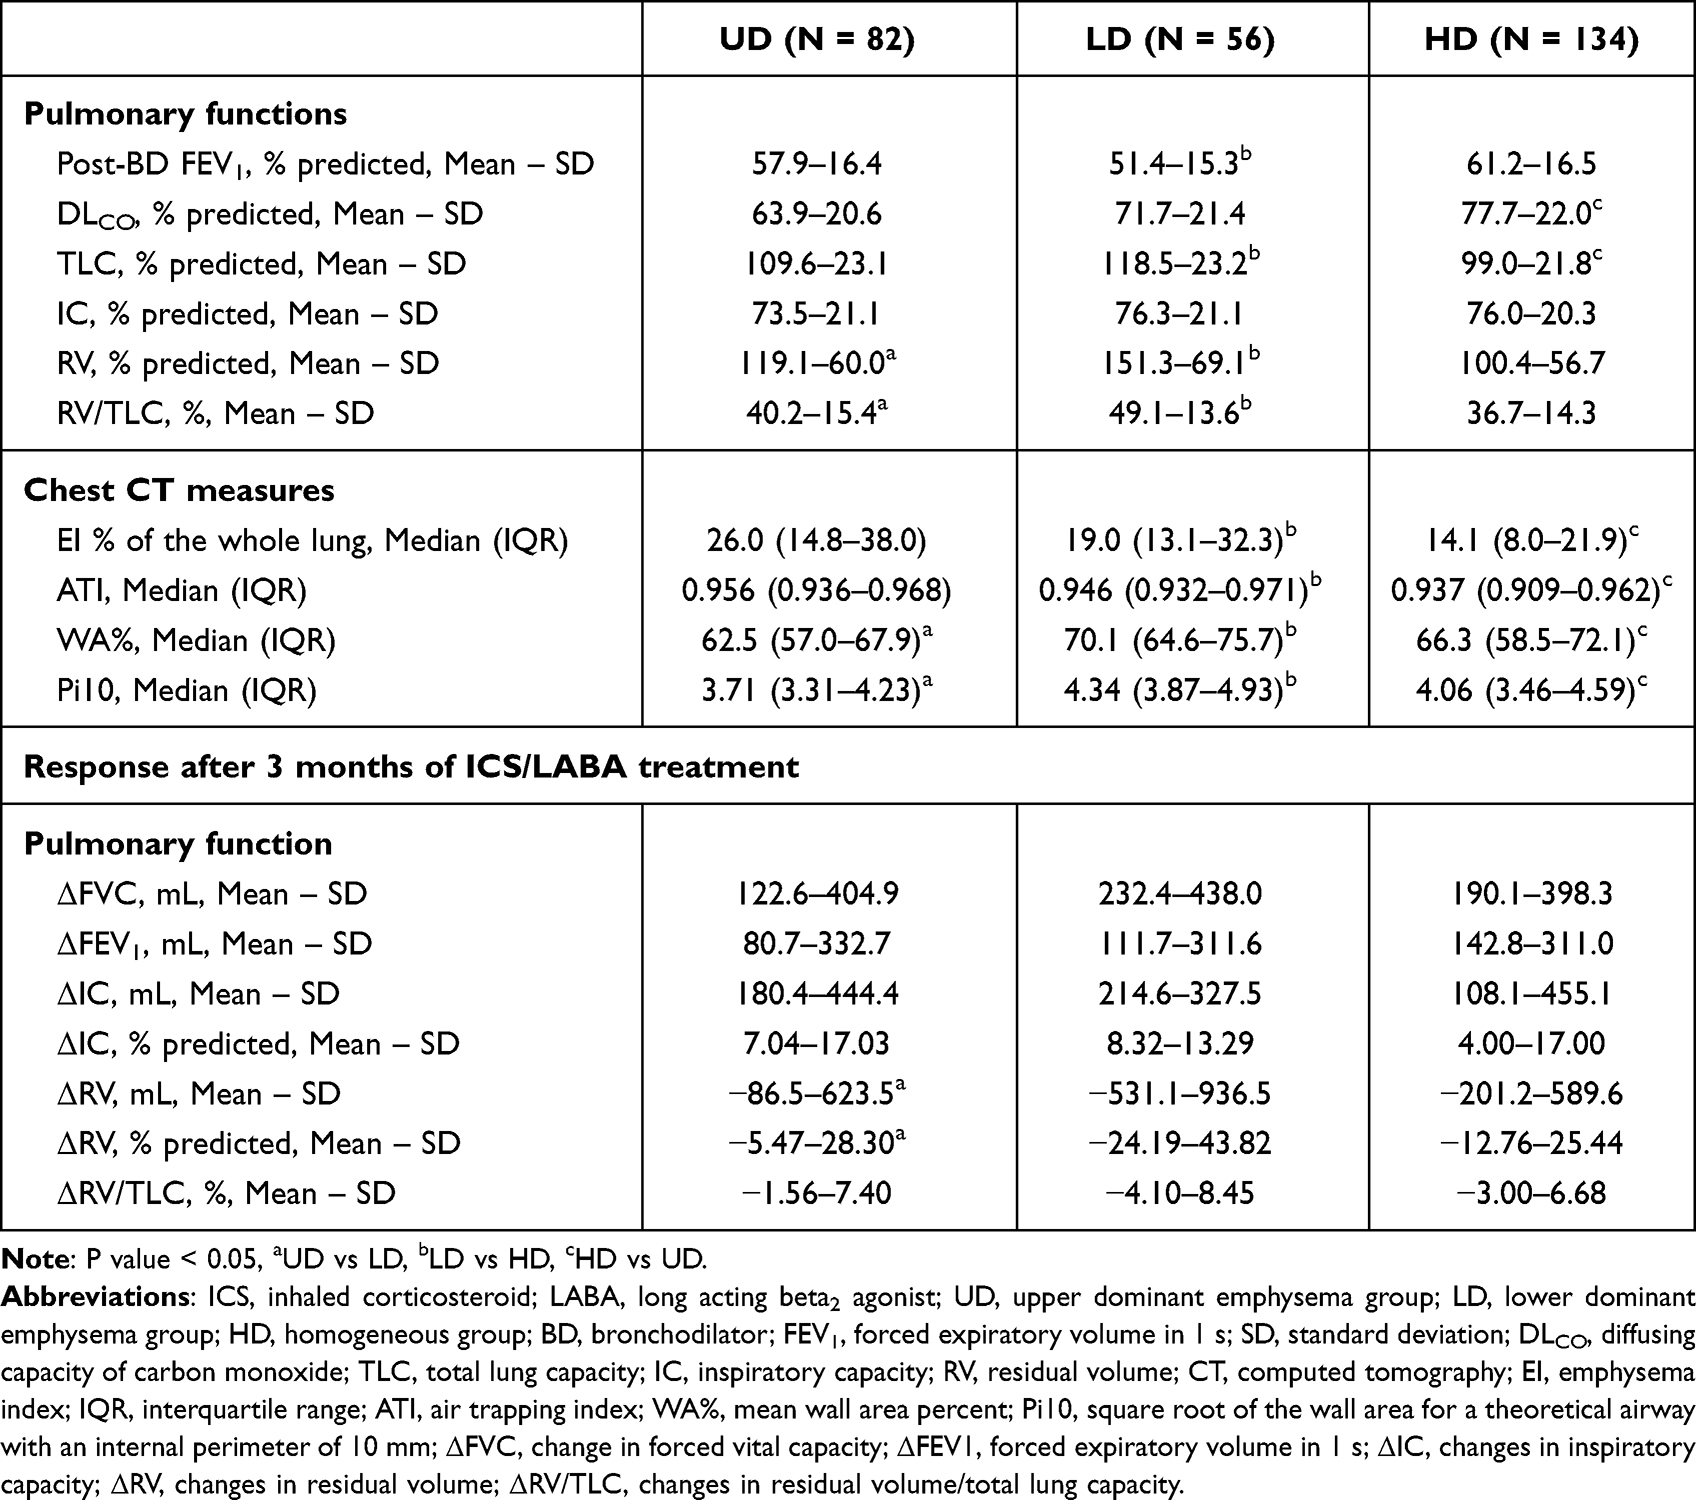 |
Table 4 Response After 3 Months of ICS/LABA Treatment in Non-Severe COPD Patients |
Discussion
This study has demonstrated the clinical manifestations, treatment responses, and long-term clinical outcomes in terms of emphysema distribution in quantitative chest CT in a long-term cohort. The patients in the LD had more severe airway obstruction (lower post-bronchodilator FEV1) with less severe emphysema (higher DLco, lower whole lung EI) compared to those in the UD. The LD had thicker airways (higher WA% and Pi10) as well as more severe air trapping (higher RV and RV/TLC) than the UD. In addition, a greater proportion of patients in the LD had BE and/or BWT which is frequently observed in chest CT scans of COPD patients.7,45,46 Compared to the UD, more patients experienced acute exacerbations and the time to first exacerbation was shorter in the LD. The LD showed a marked reduction of RV after the ICS/LABA combination treatment than the UD.
The strength of our study is that this is the first research to suggest the difference in the exacerbation risk and treatment response by examining small and large airway involvement in terms of emphysema distribution. According to the results of our study, quantification and phenotyping emphysema distribution in chest CT scan that is easily applicable in clinical practice, may provide important information about prognosis and treatment response.
Several studies have shown that patients with lower dominant emphysema present more severe airflow limitation and air-trapping.25,34,47 We focused on the difference in the airway involvement in terms of emphysema distribution in chest CT using a simple and quick quantitative measurement. However, to this day, only a few studies have evaluated the morphological changes in the airway concerning quantitatively measured emphysema distribution in a chest CT scan.30,34
One of the studies was derived from the COPDGene cohort using a quantitative CT measurement. The authors reported that the lower lobe predominant emphysema cluster showed more severe airflow limitation and air-trapping than the upper lobe predominant emphysema cluster despite a similar amount of total emphysema. There was no difference in airway wall thickness or Pi10 between the two groups, which is not consistent with our results.34 The discrepancy may be explained by the different severity of the patient groups.
Interestingly, another study from the COPDGene cohort showed similar findings to our results, in which patients with lower lung predominant emphysema had greater parametric response mapping of functional small airway disease and greater Pi10 values along with worse FEV1 than those with upper dominant emphysema.30 The authors applied a combined visual and quantitative emphysema imaging analysis and categorized patients into CT-defined subtypes. They classified the patients with lower lung predominant emphysema into one subtype of moderate to severe CLE, in which the mean FEV1 was 40.35% predicted and the percentage of emphysema was 20.1, which showed a similar severity to the LD in this study.
In our study, the time to first exacerbation was shorter in the LD than in the UD, with which current smoking status, 6MWD, RV/TLC, and the presence of BE and/or BWT were significantly associated after adjusting for other factors. Therefore, a shorter time to first exacerbation in the LD than UD may be due to the increased RV/TLC and the higher prevalence of BE and/or BWT rather than to the difference in the emphysema distribution between the groups per se. Airway wall thickening as well as emphysema severity measured on chest CT scan was associated with COPD exacerbations,20,48 and increased RV/TLC49 and coexisting BE45,46 are well-known independent risks of exacerbation in COPD.
A low attenuation area in densitometry usually indicates emphysema, but it should be noted that air-trapping due to narrowing of the small airway may also be read as emphysema in quantitative CT measurement, particularly in the lower lung. It is generally accepted that emphysema in the lower lung contributes more actively to airflow obstruction because such obstruction begins earlier in the lower lung due to the gravitational difference, which may explain the marked reduction of RV after the 3 months of ICS/LABA treatment in the LD patients. Also, the decrease in RV after the ICS/LABA treatment in the LD indicates a bronchodilator-induced lung deflation,50 which may be related to more severe airway involvement of LD. This result suggests the possibility of imaging-based subtyping to predict which patients benefit most from a specific treatment.
Our criteria for significant emphysema and the definition of the distribution of emphysema were arbitrary. The cut-off level of significant emphysema varies from study to study.17,30,36,51 We excluded patients with a whole lung EI < 5%,30,32,36 which was 15% of all patients. Those patients had relatively mild COPD with an average EI value of 2.39–1.40 and post-bronchodilator FEV1 of 65.1–13.9% predicted. In addition, no consensus has been reached on the optimal method to describe the distribution of emphysema in a CT scan. The classification criteria vary widely among studies; upper vs lower lung distribution,22,28,52 inner vs outer segments,25 homogenous vs heterogeneous distribution,28 and different lobar distributions.34,45,47
We assumed the proportion of the patients among the three groups should be reasonable and at the same time, the difference between the UD and LD should be relatively explicit in clinical practice. HD indicates the group of patients whose EI difference ranges from −5 to 5 between the upper portion and lower portion of the lung. It would include the patients with even distribution throughout the lung, and also those whose emphysema distribution is not exactly even but severity difference is mild. We arbitrarily chose a 5% cut-off of the difference between the upper portion and lower portion of the lung, and the proportion of patients in HD still turned out to be as high as 41% of the total patients. In another study of regional emphysema distribution using quantitative CT scan in COPD patients, the proportion of the patients with mild/homogeneous distribution of emphysema was 33%, which was somewhat smaller than our data.53 The bigger the proportion of HD, the clearer the difference between LD and UD would be, but the proportion of HD should also remain acceptable. In our study, the clinical difference of LD and UD was evident, and we determined that the 5% cut off was reasonable.
We divided the upper and lower parts at the level of the carina, where parts of the anatomical lower lobe are inevitably allocated to the upper part. However, the iso-gravitational level in the erect position may be more acceptable when dividing the lung into two divisions for inhalation-related diseases, such as emphysema.11 Moreover, we did not analyze the type of emphysema using visual evaluation or pattern recognition from quantitative CT scans,54 which could be an important factor when analyzing the relationship between airway involvement and the distribution of emphysema considering the classical classification of emphysema.
Several limitations of this study should be discussed. First, our cohort included a relatively small number of patients from the pulmonary clinic at a tertiary university hospital. Second, 97.2% of the patients were male, and the study population was composed of relatively elderly patients compared to other general COPD populations and cohorts. The strikingly high proportion of male patients in our study cohort would be explained by the high prevalence of heavy smokers in males in Korea. These two limitations require validation before applying this study to all COPD patients. Third, serum levels of α1-antitrypsin were not examined, as this condition is extremely rare in Korea. Fourth, assessing exacerbation frequency was based on patient recall at each visit, which has implications for accuracy. Lastly, we only identified the presence of BE and BWT and did not quantify BE severity. We also treated BE and BWT as a single variable with evidence of visually detectable prominent airway change, even though these two may reflect different etiologies. BE caused by tuberculosis infection is common in Korea, so BE and BWT in a chest CT scan could be due to other diseases rather than COPD alone, although we tried to rule out patients with other obstructive airway diseases by excluding people with abnormal chest X-ray findings at enrollment.35
Conclusion
In conclusion, smoking-related COPD patients with lower dominant emphysema determined by quantitative CT scans had more frequent small and large airway abnormalities than those with upper dominant emphysema, which may be related to the increased risk of exacerbation and better treatment response. Phenotyping COPD patients by emphysema distribution using quantitative CT measurement would be a valuable tool in predicting treatment response and future exacerbation, where the difference in airway involvement severity plays a critical role.
Abbreviations
ATI, air-trapping index; BD, bronchodilator; BMI, body mass index; BE, bronchiectasis; BODE, Body mass index, degree of airflow Obstruction and Dyspnea and Exercise capacity; BWT, bronchial wall thickening; CI, confidence interval; CLE, centrilobular emphysema; COPD, chronic obstructive pulmonary disease; CT, computed tomography; DLco, diffusing capacity of carbon monoxide; EI, emphysema index; FEV1, forced expiratory volume in 1 sec; FOV, field of view; FVC, forced vital capacity; HD, homogeneous group; HU, Hounsfield units; IC, inspiratory capacity; ICS/LABA, inhaled corticosteroid and long-acting β2-agonist; IQR, interquartile range; KOLD cohort, Korean Obstructive Lung Disease cohort; LD, lower dominant emphysema group; mMRC, modified Medical Research Council; OR, odds ratio; Pi10, the square root of the wall area at the internal perimeter of 10 mm diameter airway; PLE, panlobular emphysema; PSE, paraseptal emphysema; RV, residual volume; SD, standard deviation; SGRQ, Saint George Respiratory Questionnaire; TLC, total lung capacity; UD, upper dominant emphysema group; WA, wall area; LA, luminal area; 6MWD, 6 min walk distance; 6MWT, 6 min walk test.
Ethics Statements
The present study was approved by the institutional review board of the Asan Medical Center Institutional Review Board (No. 2005-0345) and by the Institutional Review Boards of the other 15 hospitals taking part (ie, CHA Bundang Medical Center, Ewha Womans University Mokdong Hospital, Korea University Anam Hospital, Hanyang University Guri Hospital, Ilsan Paik Hospital, Kangbuk Samsung Hospital, Kangnam Sacred Heart Hospital, Kangwon National University Hospital, Seoul National University Hospital, Seoul National University Bundang Hospital, Ajou University Hospital, Konkuk University Hospital, Seoul St. Mary’s Hospital, Yeouido St. Mary’s Hospital, and the National Medical Center). Written informed consent was provided by all patients.
Acknowledgments
We authors thank the members of the KOLD Study Group for the provision of the KOLD Cohort data (Obstructive Lung Disease Research Foundation http://www.oldrf.org): Prof. Sang-Do Lee, Prof. Yeon-Mok Oh, Prof. Jin Won Huh, Prof. Seung Won Ra, Prof. Jae Seung Lee, Prof. Sei Won Lee (Univ. of Ulsan), Prof. Deog Kyeom Kim, Prof. Sang-Min Lee, Prof. Ho Il Yoon (Seoul National Univ.), Prof. Tae-Hyung Kim, Prof. Sang-Heon Kim (Hanyang Univ.), Prof. Young Sam Kim, Prof. Won Yeon Lee (Yonsei Univ.), Prof. Woo Jin Kim (Kangwon National Univ.), Prof. Hye Kyeong Park, Prof. Sung-Soon Lee (Inje Univ.), Prof. Ji-Hyun Lee, Prof. Eun Kyung Kim (Bundang CHA Hospital), Prof. Jin Hwa Lee (Ewha Womans Univ.), Prof. Sang Yeub Lee (Korea Univ.), Prof. Seong Yong Lim, Prof. Hye Yun Park (Sungkyunkwan Univ.), Prof. Tae Rim Shin, Prof. Yong Il Hwang, Prof. Yong Bum Park (Hallym Univ.), Prof. Seung Soo Sheen, Prof. Joo Hun Park (Ajou Univ.), Prof. Kwang Ha Yoo (Konkuk Univ.), Prof. Yee Hyung Kim (Kyung Hee Univ.), and Prof. Chin Kook Rhee (Catholic Univ.). The participating institutions of the Korean Obstructive Lung Disease Study Group are shown in the Supplementary Materials.
Author Contributions
All authors made a significant contribution to the work reported, whether that is in the conception, study design, execution, acquisition of data, analysis, and interpretation, or in all these areas; took part in drafting, revising, or critically reviewing the article; gave final approval of the version to be published; have agreed on the journal to which the article has been submitted; and agree to be accountable for all aspects of the work.
Funding
This study was supported by a grant from the Korea Healthcare Technology R&D Project, Ministry for Health and Welfare (A102065), Seoul, Korea.
Disclosure
Sang Min Lee reports stock in Coreline Soft, Co. Ltd (less than 0.1% of the whole stock; I am just one of the consultants for software feedback for Coreline Soft, Co. Ltd), outside the submitted work. The authors report no other potential conflicts of interest in this work.
References
1. Disease GIfCOL. Global strategy for the diagnosis, management, and prevention of chronic obstructive pulmonary disease 2019 report; 2019.
2. Nakano YMS, Sakai H, Hirai T, et al. Computed tomographic measurements of airway dimensions and emphysema in smokers. Correlation with lung function. Am J Respir Crit Care Med. 2000;162:1102–1108. doi:10.1164/ajrccm.162.3.9907120
3. Müller NLSC, Miller RR, Abboud RT, Abboud RT. “Density mask”. An objective method to quantitate emphysema using computed tomography. Chest. 1988;94(4):782–787. doi:10.1378/chest.94.4.782
4. Gevenois PADMV, De Vuyst P, Zanen J, Yernault JC. Comparison of computed density and macroscopic morphometry in pulmonary emphysema. Am J Respir Crit Care Med. 1995;152(2):653–657. doi:10.1164/ajrccm.152.2.7633722
5. Gevenois PADVP, de Maertelaer V, Zanen J, Jacobovitz D, Cosio MG, Yernault JC. Comparison of computed density and microscopic morphometry in pulmonary emphysema. Am J Respir Crit Care Med. 1996;154(1):187–192. doi:10.1164/ajrccm.154.1.8680679
6. Grydeland TB, Dirksen A, Coxson HO, et al. Quantitative computed tomography measures of emphysema and airway wall thickness are related to respiratory symptoms. Am J Respir Crit Care Med. 2010;181(4):353–359. doi:10.1164/rccm.200907-1008OC
7. Lynch DA, Austin JH, Hogg JC, et al. CT-definable subtypes of chronic obstructive pulmonary disease: a statement of the Fleischner society. Radiology. 2015;277(1):192–205. doi:10.1148/radiol.2015141579
8. Thurlbeck WMMN, Müller NL. Emphysema: definition, imaging, and quantification. Am J Roentgenol. 1994;163(5):1017–1025. doi:10.2214/ajr.163.5.7976869
9. Kim WDED, Izquierdo JL, Ghezzo H, Saetta MP, Cosio MG, Cosio MG. Centrilobular and panlobular emphysema in smokers: two distinct morphologic and functional entities. Am Rev Respir Dis. 1991;144(6):1385–1390. doi:10.1164/ajrccm/144.6.1385
10. Kim WDLS, Coxson HO, English JC, et al. The association between small airway obstruction and emphysema phenotypes in COPD. Chest. 2007;131(5):1372–1378. doi:10.1378/chest.06-2194
11. Takahashi M, Fukuoka J, Nitta N, et al. Imaging of pulmonary emphysema: a pictorial review. Int J Chron Obstruct Pulmon Dis. 2008;3(2):193. doi:10.2147/COPD.S2639
12. Eriksson S. Studies in alpha 1-antitrypsin deficiency. Acta Med Scand Suppl. 1965;432:1–85.
13. Kim SS, Seo JB, Lee HY, et al. Chronic obstructive pulmonary disease: lobe-based visual assessment of volumetric CT by Using standard images–comparison with quantitative CT and pulmonary function test in the COPDGene study. Radiology. 2013;266(2):626635. doi:10.1148/radiol.12120385
14. Dirksen AWM, Wille MMW. Computed tomography–based subclassification of chronic obstructive pulmonary disease. Ann Am Thorac Soc. 2016;13(Supplement 2):S114–117. doi:10.1513/AnnalsATS.201503-178KV
15. Mitchell RS, Silvers GW, Goodman N, Dart G, Maisel JC. Are centrilobular emphysema and panlobular emphysema two different diseases? Hum Pathol. 1970;1(3):433441. doi:10.1016/S0046-8177(70)80076-4
16. Group COCW, Barr RG, Berkowitz EA, et al. A combined pulmonary-radiology workshop for visual evaluation of COPD: study design, chest CT findings and concordance with quantitative evaluation. COPD. 2012;9(2):151–159. doi:10.3109/15412555.2012.654923
17. Vestbo JEL, Scanlon PD, Yates JC, et al.; ECLIPSE Investigators. Changes in forced expiratory volume in 1 second over time in COPD. N Engl J Med. 2011;365(13):1184–1192. doi:10.1056/NEJMoa1105482
18. Yoo JWHY, Seo JB, Chae EJ, et al. Comparison of clinico-physiologic and CT imaging risk factors for COPD exacerbation. J Korean Med Sci. 2011;26(12):1606–1612. doi:10.3346/jkms.2011.26.12.1606
19. Oh YMSS, Park JH, Jin UR, et al. Emphysematous phenotype is an independent predictor for frequent exacerbation of COPD. Int J Tuberc Lung Dis. 2014;18(12):1407–1414. doi:10.5588/ijtld.14.0205
20. Han MKKE, Lynch DA, Liu LX, et al. COPDGene Investigators. Chronic obstructive pulmonary disease exacerbations in the COPDGene study: associated radiologic phenotypes. Radiology. 2011;261(1):274–282. doi:10.1148/radiol.11110173
21. Haruna AMS, Nakano Y, Ohara T, et al. CT scan findings of emphysema predict mortality in COPD. Chest. 2010;138(3):635–640. doi:10.1378/chest.09-2836
22. Martinez FJFG, Curtis JL, Criner G, et al.; NETT Research Group. Predictors of mortality in patients with emphysema and severe airflow obstruction. Am J Respir Crit Care Med. 2006;173(12):1326–1334. doi:10.1164/rccm.200510-1677OC
23. Madani AZJ, de Maertelaer V, Gevenois PA, Gevenois PA. Pulmonary emphysema: objective quantification at multi-detector row CT–comparison with macroscopic and microscopic morphometry. Radiology. 2006;238(3):1036–1043. doi:10.1148/radiol.2382042196
24. Bastos HNNI, Redondo M, Cunha R, Pereira JM, Magalhães A, Fernandes G. Influence of emphysema distribution on pulmonary function parameters in COPD patients. J Bras Pneumol. 2015;41(6):489–495. doi:10.1590/s1806-37562015000000136
25. Nakano YSH, Muro S, Hirai T, Oku Y, Nishimura K, Mishima M. Comparison of low attenuation areas on computed tomographic scans between inner and outer segments of the lung in patients with chronic obstructive pulmonary disease: incidence and contribution to lung function. Thorax. 1999;54(5):384–389. doi:10.1136/thx.54.5.384
26. Mair GMJ, McAllister D, Maclay J, Connell M, Murchison JT, MacNee W. Computed tomographic emphysema distribution: relationship to clinical features in a cohort of smokers. Eur Respir J. 2009;33(3):536–542. doi:10.1183/09031936.00111808
27. Chae EJSJ, Song JW, Kim N, et al. Slope of emphysema index: an objective descriptor of regional heterogeneity of emphysema and an independent determinant of pulmonary function. Am J Roentgenol. 2010;194(3):W248–255. doi:10.2214/AJR.09.2672
28. Hughes JAHD, Bellamy D, Dowd DE, Ryan KC, Hugh-Jones P. Annual decline of lung function in pulmonary emphysema: influence of radiological distribution. Thorax. 1982;37(1):32–37. doi:10.1136/thx.37.1.32
29. Tanabe NMS, Tanaka S, Sato S, et al. Emphysema distribution and annual changes in pulmonary function in male patients with chronic obstructive pulmonary disease. Respir Res. 2012;13:31. doi:10.1186/1465-9921-13-31
30. Park J, Hobbs BD, Crapo JD, et al. Subtyping COPD by using visual and quantitativeCT imaging features. Chest. 2020;157(1):47–60. doi:10.1016/j.chest.2019.06.015
31. Firdaus AA, Mohamed Hoesein MS, Onno M, et al. Discriminating dominant computed tomography phenotypes in smokers without or with mild COPD. Respir Med. 2014;108:136–143. doi:10.1016/j.rmed.2013.08.014
32. Mohamed Hoesein FA, de Jong PA, Lammers JW, et al. Contribution of CT quantified emphysema, air trapping and airway wall thickness on pulmonary function in male smokers with and without COPD. COPD. 2014;11(5):503–509. doi:10.3109/15412555.2014.933952
33. Nambu AZJ, Schroeder J, Jin G, et al. Quantitative computed tomography measurements to evaluate airway disease in chronic obstructive pulmonary disease: relationship to physiological measurements, clinical index and visual assessment of airway disease. Eur J Radiol. 2016;85(11):2144–2151. doi:10.1016/j.ejrad.2016.09.010
34. Boueiz ACY, Cho MH, Washko GR, et al.; COPDGene Investigators. Lobar emphysema distribution is associated with 5-year radiological disease progression. Chest. 2018;153(1):65–76. doi:10.1016/j.chest.2017.09.022
35. Park TSLJ, Seo JB, Hong Y, et al.; KOLD Study Group. Study design and outcomes of Korean Obstructive Lung Disease (KOLD) cohort study. Tuberc Respir Dis. 2014;76(4):169–174. doi:10.4046/trd.2014.76.4.169
36. Hurst JRVJ, Anzueto A, Locantore N, et al.; Evaluation of COPD Longitudinally to Identify Predictive Surrogate Endpoints (ECLIPSE) Investigators. Susceptibility to exacerbation in chronic obstructive pulmonary disease. N Engl J Med. 2010;363(12):1128–1138. doi:10.1056/NEJMoa0909883
37. Crapo RO, Hankinson JL, Irvin C, et al. Standardization of spirometry, 1994 update. American Thoracic Society. Am J Respir Crit Care Med. 1995;152(3):1107–1136.
38. Kim CSJ, Lee SM, Lee JS, et al. Exertional desaturation as a predictor of rapid lung function decline in COPD. Respiration. 2013;86(2):109–116. doi:10.1159/000342891
39. Charlson MEPP, Ales KL, MacKenzie CR. A new method of classifying prognostic comorbidity in longitudinal studies: development and validation. J Chronic Dis. 1987;40:373–383. doi:10.1016/0021-9681(87)90171-8
40. Wood SAZE, Hoford JD, Hoffman EA, Mitzner W, Mitzner W. Measurement of three-dimensional lung tree structures by using computed tomography. J Appl Physiol. 1995;79(5):1687–1697. doi:10.1152/jappl.1995.79.5.1687
41. Lee YKOY, Lee JH, Kim EK, et al.; KOLD Study Group. Quantitative assessment of emphysema, air trapping, and airway thickening on computed tomography. Lung. 2008;186(3):157–165. doi:10.1007/s00408-008-9071-0
42. Kim WJ, Oh YM, Sung J, et al. Lung function response to 12-week treatment with combined inhalation of long-acting beta2 agonist and glucocorticoid according to ADRB2 polymorphism in patients with chronic obstructive pulmonary disease. Lung. 2008;186(6):381–386. doi:10.1007/s00408-008-9103-9
43. Lee JHLY, Kim EK, Kim TH, et al. Responses to inhaled long-acting beta-agonist and corticosteroid according to COPD subtype. Respir Med. 2010;104(4):542–549. doi:10.1016/j.rmed.2009.10.024
44. Kim V, Crapo J, Zhao H, et al. Comparison between an alternative and the classic definition of chronic bronchitis in COPDGene. Ann Am Thorac Soc. 2015;12(3):332–339. doi:10.1513/AnnalsATS.201411-518OC
45. Martínez-García MÁS-CJ, Donat Sanz Y, Catalán Serra P, Agramunt Lerma M, Ballestín Vicente J, Perpiñá-Tordera M. Factors associated with bronchiectasis in patients with COPD. Chest. 2011;140(5):1130–1137. doi:10.1378/chest.10-1758
46. Martinez-Garcia MA, Dl RCD, Soler-Cataluna JJ, et al. Prognostic value of bronchiectasis in patients with moderate-to-severe chronic obstructive pulmonary disease. Am J Respir Crit Care Med. 2013;187(8):823–831. doi:10.1164/rccm.201208-1518OC
47. Saitoh TKH, Shijubo N, Tanaka H, Sugaya F. Lobar distribution of emphysema in computed tomographic densitometric analysis. Invest Radiol. 2000;35(4):235–243. doi:10.1097/00004424-200004000-00004
48. Lim JUKE, Lim SY, Lim SY, et al. Mixed phenotype of emphysema and airway wall thickening is associated with frequent exacerbation in COPD patients. Int J Chronic Obstructive Pulmon Dis. 2019;14:3035–3042. doi:10.2147/COPD.S227377
49. Youlim Kim SHK, Chin Kook R, Jae Seung L, et al. Park air trapping and the risk of COPD exacerbation: analysis from prospective KOCOSS cohort. Front Med. 2022. doi:10.3389/fmed.2022.835069
50. McCartney CT, Weis MN, Ruppel GL, Nayak RP. Residual Volume and total lung capacity to assess reversibility in obstructive lung disease. Respir Care. 2016;61(11):1505–1512. doi:10.4187/respcare.04323
51. Hesselbacher SERR, Schabath MB, Smith EO, et al. Cross-sectional analysis of the utility of pulmonary function tests in predicting emphysema in ever smokers. Int J Environ Res Public Health. 2011;8(5):1324–1340. doi:10.3390/ijerph8051324
52. Washko GRHE, Reilly JJ, Reilly JJ. Radiographic evaluation of the potential lung volume reduction surgery candidate. Proc Am Thorac Soc. 2008;5(4):421–426. doi:10.1513/pats.200802-017ET
53. Stavngaard TSS, Bach KS, Stoel BC, Dirksen A, Dirksen A. Quantitative assessment of regional emphysema distribution in patients with chronic obstructive pulmonary disease (COPD). Acta Radiol. 2006;47(9):914–921. doi:10.1080/02841850600917170
54. Dirksen A, MacNee W. The search for distinct and clinically useful phenotypes in chronic obstructive pulmonary disease. Am J Respir Crit Care Med. 2013;188(9):1045–1051. doi:10.1164/rccm.201309-1649ED
 © 2022 The Author(s). This work is published and licensed by Dove Medical Press Limited. The full terms of this license are available at https://www.dovepress.com/terms.php and incorporate the Creative Commons Attribution - Non Commercial (unported, v3.0) License.
By accessing the work you hereby accept the Terms. Non-commercial uses of the work are permitted without any further permission from Dove Medical Press Limited, provided the work is properly attributed. For permission for commercial use of this work, please see paragraphs 4.2 and 5 of our Terms.
© 2022 The Author(s). This work is published and licensed by Dove Medical Press Limited. The full terms of this license are available at https://www.dovepress.com/terms.php and incorporate the Creative Commons Attribution - Non Commercial (unported, v3.0) License.
By accessing the work you hereby accept the Terms. Non-commercial uses of the work are permitted without any further permission from Dove Medical Press Limited, provided the work is properly attributed. For permission for commercial use of this work, please see paragraphs 4.2 and 5 of our Terms.