")
Back to Journals » Drug Design, Development and Therapy » Volume 13
Pharmacokinetics and pharmacodynamics of the novel Nrf2 activator omaveloxolone in primates
Authors Reisman SA, Gahir SS, Lee CY, Proksch JW, Sakamoto M, Ward KW
Received 8 November 2018
Accepted for publication 16 February 2019
Published 17 April 2019 Volume 2019:13 Pages 1259—1270
DOI https://doi.org/10.2147/DDDT.S193889
Checked for plagiarism Yes
Review by Single anonymous peer review
Peer reviewer comments 3
Editor who approved publication: Prof. Dr. Cristiana Tanase
Scott A Reisman, Sarabjit S Gahir, Chun-Yue I Lee, Joel W Proksch, Mitsumasa Sakamoto, Keith W Ward
Reata Pharmaceuticals, Inc., Irving, TX 75063, USA
Background: Omaveloxolone is a synthetic oleanane triterpenoid that pharmacologically activates Nrf2, a master transcription factor that regulates genes with antioxidative, anti-inflammatory, and mitochondrial bioenergetic properties, and is being evaluated in patients with Friedreich’s ataxia.
Methods: The present study evaluated the pharmacokinetics (PK) and tissue distribution of omaveloxolone in monkeys after single and multiple oral doses, and then compared these data to initial results in Friedreich’s ataxia patients. Pharmacodynamic (PD) evaluations in monkeys consisted of Nrf2 target gene mRNA expression in peripheral blood mononuclear cells (PBMCs), liver, lung, and brain. A PK/PD model was generated with the monkey data, and used to further evaluate the Friedreich’s ataxia patient PK profile.
Results: Oral administration of omaveloxolone to monkeys was associated with dose-linear plasma PK and readily measureable and dose-proportional concentrations in liver, lung, and brain. Dose-dependent induction of Nrf2 target genes in PBMCs and tissues was also observed. Clinically, oral administration of omaveloxolone to Friedreich’s ataxia patients at incremental doses from 2.5 to 300 mg produced dose-proportional systemic exposures. Clinical doses of at least 80 mg were associated with meaningful improvements in neurological function in patients and generated plasma omaveloxolone concentrations consistent with those significantly inducing Nrf2 target genes in monkeys, as shown with the monkey PK/PD model.
Conclusion: Overall, the monkey data demonstrate a well-characterized and dose-proportional PK and tissue distribution profile after oral administration of omaveloxolone, which was associated with Nrf2 activation. Further, systemic exposures to omaveloxolone that produce Nrf2 activation in monkeys were readily achievable in Friedreich’s ataxia patients after oral administration.
Keywords: omaveloxolone, Nrf2, pharmacokinetics, Friedreich’s ataxia, Nqo1, ferritin, NADPH, glutathione
Introduction
Omaveloxolone (N-(2-Cyano-3,12-dioxo-28-noroleana-1,9(11)-dien-17-yl)-2,2-difluoropropanamide; CDDO-DFPA; RTA 408), a semi-synthetic oleanane triterpenoid, is in a class of compounds known to be very potent activators of nuclear factor (erythroid-derived 2)-like-2 factor (Nrf2).1 Nrf2 regulates the expression of nearly all antioxidative enzymes, including the prototypical Nrf2 target gene NAD(P)H quinone:oxidoreductase 1 (Nqo1), as well as thioredoxin reductase 1 (Txnrd1), the peroxiredoxin regulator sulfiredoxin 1 (Srxn1), genes involved in glutathione homeostasis [eg, glutamate–cysteine ligase catalytic subunit (Gclc) and glutathione reductase (Gsr)], aldo-keto reductase 1c1 (Akr1c1), and proteins important in iron homeostasis (eg, ferritin).2,3 Nrf2 also controls the expression of enzymes important in the pentose phosphate pathway and the production of NADPH, namely phosphogluconate dehydrogenase (Pgd) and glucose-6-phosphate dehydrogenase (G6pd).4 NADPH is a critically important reductive co-substrate in many antioxidative enzymatic reactions, including those involving Nqo1, Gsr, Txnrd1, and Akr1c1. Therefore, Nrf2 induces not only many antioxidative enzymes but also the enzymes necessary to generate an adequate supply of indispensable co-substrates.5 Finally, activation of Nrf2 results in the induction of multiple genes that play both direct and indirect roles in the production of ATP within the mitochondria. For example, Nrf2 increases the efficient use of fatty acids and glucose by increasing basal oxygen consumption,6 and through its antioxidative effects, balances reducing equivalents (eg, NADPH and NADH)7 and maintains mitochondrial homeostasis and efficiency.
Friedreich’s ataxia is a rare inherited disease caused by a genetic mutation in a protein important in iron homeostasis (ie, frataxin) that is associated with decreased Nrf2 activity and suppressed mitochondrial function, which consequently leads to a diminished capacity to respond to oxidative stress.8 Lymphoblast cells collected from patients with Friedreich’s ataxia have decreased activity of thioredoxin reductase, a central protein for the function of many other antioxidative enzymes, such as cysteine-dependent redoxins and those involved in glutathione homeostasis.9 Moreover, cultured neurons with silenced frataxin and mice with a conditional frataxin knockout in heart and skeletal muscle have decreased Nrf2 activity.10,11 Thus, pharmacologically activating Nrf2 has the potential to be beneficial in patients with Friedreich’s ataxia and possibly other neurological disorders. Importantly, the Nrf2 activator omaveloxolone has demonstrated efficacy in both in vitro and in vivo non-clinical models of neuronal mitochondrial dysfunction and oxidative stress. For example, omaveloxolone protects cultured cortical neurons from hypomagnesemia-induced cell death. Further, in a rat model of status epilepticus, where Nrf2 has also been shown to be critical for neuronal defense,12 omaveloxolone dramatically decreases the frequency of seizures, increases ATP and glutathione in the cortex and hippocampus, and prevents neuronal cell death.13
Currently, omaveloxolone is undergoing clinical testing in a Phase II trial in patients with Friedreich’s ataxia (A Phase 2 Study of the Safety, Efficacy, and Pharmacodynamics of RTA 408 in the Treatment of Friedreich’s Ataxia; MOXIe; NCT02255435). A lack of frataxin in this patient population leads to degeneration of dorsal root ganglia, neurons, cardiac myocytes, and pancreatic beta cells, causing the three main symptoms of Friedreich’s ataxia, namely ataxia, cardiomyopathy, and diabetes.14 Moreover, recent in vitro work suggests that the mechanism of action of omaveloxolone is directly applicable to the pathophysiology of Friedreich’s ataxia.15 Indeed, encouraging results, in the form of improved neurological and mitochondrial function, and increases in Nrf2 biomarkers (eg, ferritin), were observed in the first part of a Phase II clinical trial in Friedreich’s ataxia patients.16
This study was conducted to evaluate the pharmacokinetic (PK) profile and tissue distribution of omaveloxolone and characterize its effects in selected tissues on Nrf2 target gene mRNA expression in monkeys after oral administration. The plasma concentration–time profile of omaveloxolone and its effects on Nrf2 target gene mRNA expression in peripheral blood mononuclear cells (PBMCs) were used to build a pharmacokinetic/pharmacodynamic (PK/PD) model. In addition, the plasma exposure and PK profile observed in the ongoing Phase II clinical trial with omaveloxolone in Friedreich’s ataxia patients (NCT02255435) are described and compared with the output from the monkey PK/PD model to estimate the dose levels in patients that are predicted to increase Nrf2 target gene expression.
Methods
Materials
Omaveloxolone was supplied by Reata Pharmaceuticals (Irving, TX, USA). Unless otherwise specified, other chemicals were of analytical grade and obtained from Sigma-Aldrich (St Louis, MO, USA) or another major commercial supplier.
Monkey (in vivo) studies
To determine omaveloxolone PK, male and female cynomolgus monkeys (n=5/sex/dose group) received omaveloxolone at 10, 30, or 100 mg/kg/day by oral gavage in sesame oil (5 mL/kg) with collection of blood through 24 hours after a single administration or after 28 days of once-daily administrations. For tissue content and mRNA expression analyses, male and female cynomolgus monkeys (n=2/sex/dose group) received omaveloxolone at 10, 30, or 100 mg/kg/day or vehicle (sesame oil, 5 mL/kg) by oral gavage once daily for 14 days. On day 14, 24 hours after the final dose, monkeys were euthanized. Tissues (liver, lung, and brain) were collected, rinsed with PBS, dry-blotted, and frozen in liquid nitrogen. Blood samples were also collected for analysis of corresponding omaveloxolone concentrations in plasma. Blood for plasma bioanalysis was collected into tubes containing K3EDTA as the anticoagulant and supplemented with sodium sulfite (0.25%, final concentration) to prevent oxidative degradation of omaveloxolone. All plasma and tissue samples were stored at approximately −80°C until analysis.
In a separate study, male and female cynomolgus monkeys (n=3/sex/dose) received a single oral administration of omaveloxolone at 10, 30, and 100 mg/kg/day or vehicle (sesame oil, 5 mL/kg) by oral gavage. Blood was collected pre-dose and 4, 8, 12, and 24 hours post-dose for isolation of PBMCs and plasma. PBMCs were isolated using CPT tubes (catalog number 362760; BD Biosciences, San Jose, CA, USA). The PBMCs were used for mRNA expression analyses, and the plasma was used for determination of corresponding concentrations of omaveloxolone. All monkey studies were performed as per approved protocols by the Institutional Animal Care and Use Committee at the site where the in vivo portion of the study was conducted (MPI Research, Mattawan, MI, USA). Animal welfare was in compliance with the US Department of Agriculture’s (USDA) Animal Welfare Act (9 CFR Parts 1, 2, and 3). Further, the Guide for the Care and Use of Laboratory Animals (Institute of Laboratory Animal Resources, National Academy Press, Washington, DC, 1996) was followed.
Clinical study
Part 1 of the clinical study MOXIe (https://www.clinicaltrials.gov/ct2/show/NCT02255435) was a randomized, placebo-controlled, double-blind, dose-escalation study to evaluate the safety of omaveloxolone at various doses in patients with Friedreich’s ataxia. Patients were randomized to omaveloxolone at the specific cohort dose with five or six patients on active drug and two on placebo for all dose groups except the 160-mg dose group, where 12 patients were on active drug and four on placebo. Patients in the first cohort received 2.5 mg for 2 weeks and then were escalated to 5 mg for the next 10 weeks. Patients in the subsequent cohorts received oral doses of placebo or omaveloxolone capsules at 10, 20, 40, 80, 160, or 300 mg once daily for 12 weeks. Blood samples were collected (with K2EDTA as the anticoagulant) at a presumed steady state for PK analysis after 2 weeks of daily dosing (for all dose groups except the 5 mg dose group, which was collected at a presumed steady state after 8 weeks of daily dosing) at pre-dose and 1, 2, 4, and 8 hours after dose administration. Because the PK collection occurred at steady state, the pre-dose plasma concentration was imputed to the 24-hour time-point for the purposes of exploratory PK analyses. After blood collection and centrifugation, plasma was transferred to cryovials containing sodium sulfite (final concentration 0.25%) to prevent oxidative degradation and stored at approximately −80°C until analysis. The clinical study was designed and implemented in accordance with the International Council for Harmonisation of Technical Requirements for Pharmaceuticals for Human Use (ICH) E6(R1) guidance, with applicable local regulations (eg, US CFR Title 21), and with the ethical principles of the Declaration of Helsinki. All participants provided written informed consent prior to participating in the study. Study approval was obtained for each site by an institutional review board or ethics committee, as appropriate. A tabulated list of the institutional review boards and ethics committees can be found in Table S1. For this study, the de-identified participant data, protocol, and the statistical analysis plan will not be shared for external analysis.
Omaveloxolone quantification in plasma and tissues
Omaveloxolone was extracted from monkey and human plasma and then quantified using liquid chromatography–tandem mass spectrometry (LC-MS/MS) methodology, similarly to methods described previously.17,18 Plasma calibration curves were prepared in the appropriate species biomatrix and supplemented with 0.25% sodium sulfite to prevent oxidative degradation of omaveloxolone.
Omaveloxolone was extracted from monkey tissues using a liquid–liquid extraction technique. The tissues from monkeys were homogenized in ice-cold PBS (500 mg/mL) and then mixed well with acetonitrile supplemented with 0.2% formic acid (200 μL). Methyl tert-butyl ether (5 mL) was then added to the samples, which were then vortexed for 5 minutes and centrifuged for 10 minutes at 2,100 × g. The supernatant was transferred and placed on a heat block (40°C) under a gentle stream of nitrogen gas to evaporate to dryness. The extracted samples were reconstituted with 150 μL acetonitrile, and 7.5 μL was injected for LC-MS/MS analysis. Omaveloxolone was quantified using a Waters Acquity UPLC system (Milford, MA, USA) coupled to a Waters TQD mass spectrometer using an Acquity UPLC BEH Phenyl column (catalog number 18600450). The mobile phases consisted of 0.2% formic acid in water (v/v) and 100% acetonitrile run on a gradient over 2.80 minutes. The MS/MS was run using electrospray ionization in positive ion multiple reaction monitoring mode with omaveloxolone detected at m/z 555.4→446.3. Calibration standards spanning a dynamic range of concentrations were prepared volumetrically in appropriate naïve monkey biomatrices and processed in a similar way to the samples. Samples from vehicle-treated monkeys were also analyzed (data not shown) and considered to be zero for subsequent analyses.
PK parameter estimates
PK parameter estimates were obtained by non-compartmental analysis of the individual omaveloxolone plasma concentration–time data using WinNonlin™ software version 6.2.1 (Pharsight Corp., Cary, NC, USA). The area under the plasma concentration–time curve from time 0 to 24 hours (AUC(0–24 h)) was determined using the linear trapezoidal–linear interpolation method in monkeys and the linear up–log down method in humans. The presented clinical PK parameters are based on interim PK data, and calculated using nominal time-points.
mRNA quantification
mRNA was quantified, as previously described, using the Quantigene™ Plex 2.0 assay from Affymetrix (Santa Clara, CA, USA).19 Panels with targets designed against the human genome were used. Further details for the design of the panels can be found at https://www.thermofisher.com/order/quantigene-plex/configuration. The mRNA expression data were standardized to the internal control ribosomal protein L13A (RPL13A) and presented as fold the mean vehicle control ± SEM.
PK/PD modeling
Population PK/PD analysis was performed using monkey plasma omaveloxolone concentration data and mRNA expression fold changes from baseline in monkey PBMCs. PK/PD analyses were conducted with Phoenix NLME software (Build 8.0.0.3176), and a nonlinear mixed effects model was developed. The modeling was conducted in two stages, beginning with fitting a PK model to the data, and then incorporating the PD data to generate a final PK/PD model. The QRPEM engine was employed for fitting the model to the data.
Statistics
Plasma omaveloxolone concentration and PK data are presented as the mean ± SD. mRNA expression data are presented as mean ± SEM, with the data analyzed by one-way or two-way ANOVA followed by Duncan’s multiple range or Dunnett’s multiple comparisons post-hoc test, where appropriate, with p-values <0.05 considered statistically significant.
Results
Summary of omaveloxolone non-clinical and clinical PK profiles
After a single oral administration to monkeys, near-maximal omaveloxolone concentrations in plasma were observed within 1 hour, and measurable concentrations were observed through 24 hours (Figure 1). Systemic exposures to omaveloxolone, based on peak plasma concentrations (Cmax) and AUC, increased dose-proportionally (Table 1). Peak omaveloxolone concentrations after a single dose in monkeys occurred between 8 and 12 hours (Tmax), and the apparent terminal half-life ranged from approximately 9 to 18 hours. There were no meaningful differences in PK profiles between males and females (data not shown), and exposures (based on AUC) following repeated daily oral administration for 28 days tended to be slightly higher (<2-fold change) than the exposures observed after a single administration. After repeated daily administration, the Tmax at steady state was between 2 and 4 hours, and the variability in half-life decreased compared to the single-dose data with approximate values in the 8–12-hour range (Table 1).
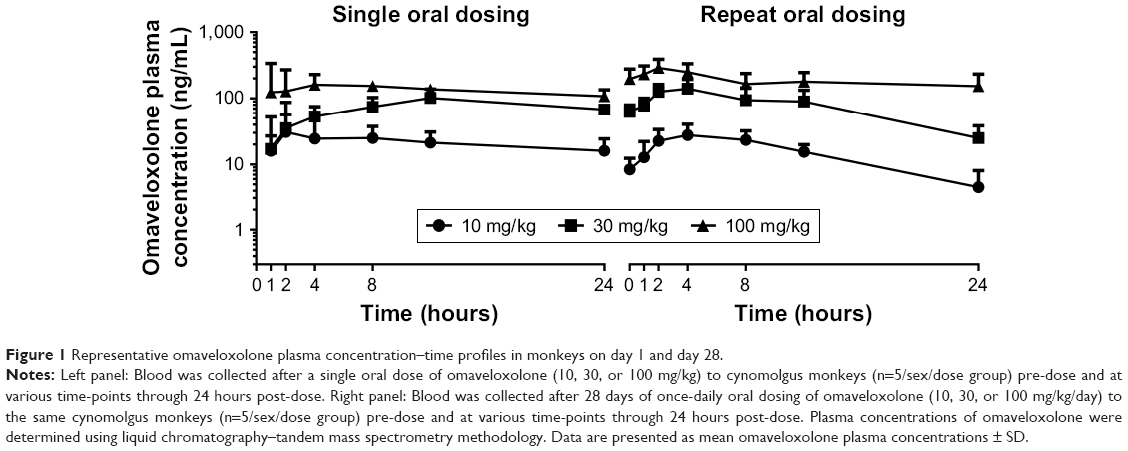 | Figure 1 Representative omaveloxolone plasma concentration–time profiles in monkeys on day 1 and day 28. |
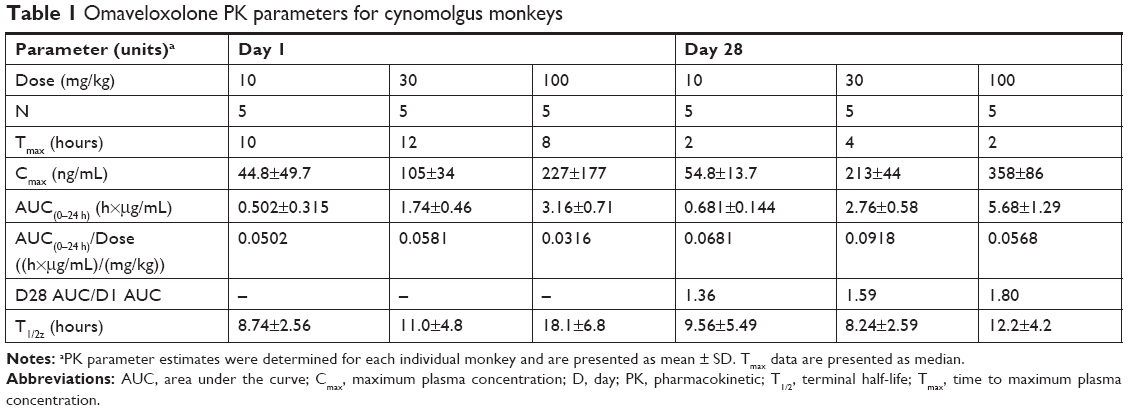 | Table 1 Omaveloxolone PK parameters for cynomolgus monkeys |
Next, clinical PK data obtained following daily oral administration of omaveloxolone capsules to Friedreich’s ataxia patients were analyzed (Figure 2A and Table 2). At the presumed steady state, omaveloxolone demonstrated dose-dependent and linear PK over a dose range of 2.5–300 mg, based on both Cmax and AUC. Omaveloxolone also demonstrated relatively low interpatient variability (Figure 2B and C) with mean %CV across dose groups of approximately 31% for AUC values and approximately 43% for Cmax values. A 160-mg dose was associated with evidence of clinical activity, including improvements in neurological function as assessed by modified Friedreich’s Ataxia Rating Scale (mFARS) scores after 12 weeks of dosing in Part 1 of the Phase II clinical trial.16
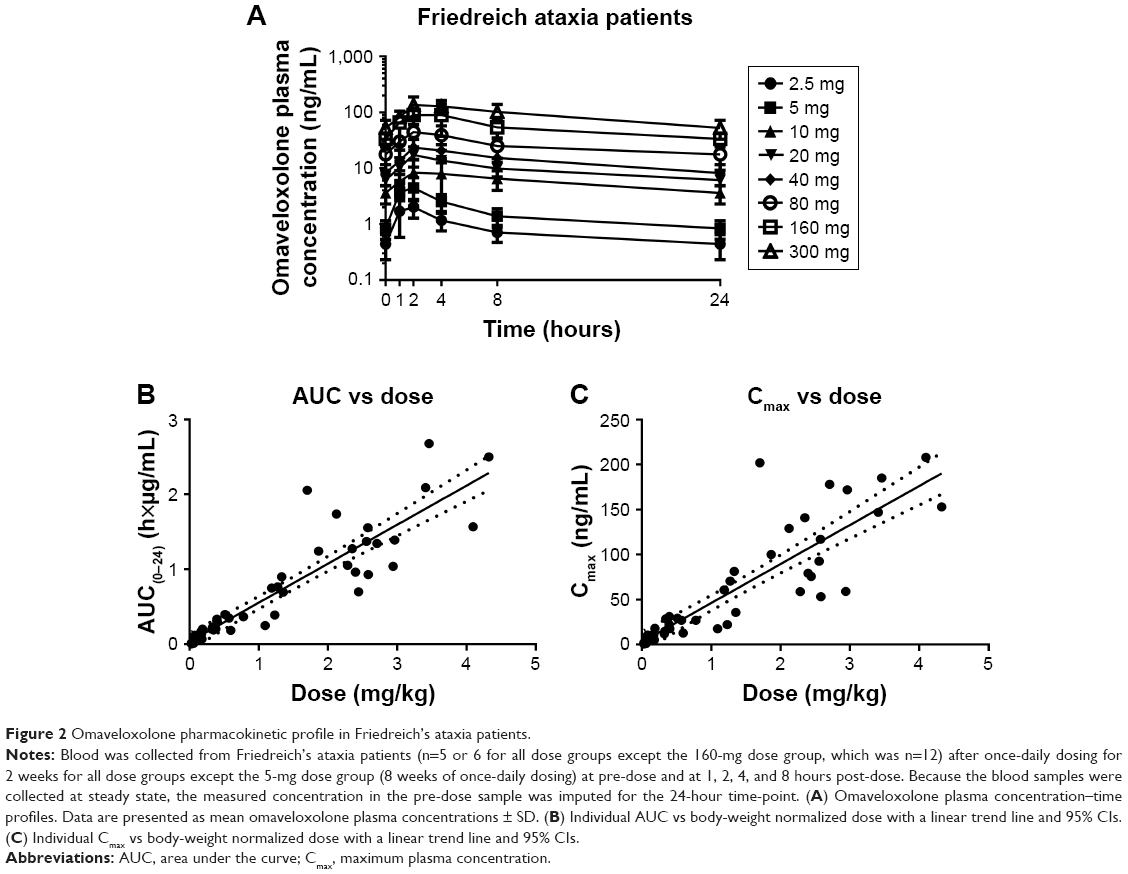 | Figure 2 Omaveloxolone pharmacokinetic profile in Friedreich’s ataxia patients. |
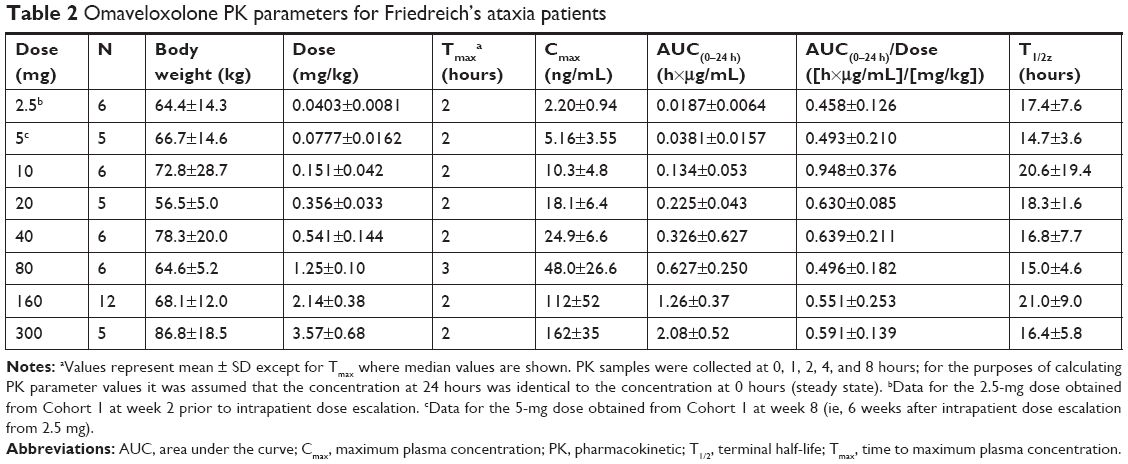 | Table 2 Omaveloxolone PK parameters for Friedreich’s ataxia patients |
The clinical activity observed at the 160-mg dose was also associated with changes in serum biomarkers of Nrf2 pharmacological activity (eg, increased ferritin and decreased creatine kinase). The relatively low interpatient variability and dose-proportional PK observed for omaveloxolone in Part 1 of the clinical trial were important for selection of the dose to be studied in Part 2, which is of longer duration (48 weeks). To improve patient compliance and minimize patient burden in a disease which can affect a patient’s ability to swallow, it was desirable to reduce the total number of daily capsules. By selecting a 150-mg dose, patients are required to take only three capsules of 50 mg each daily instead of three capsules of 50 mg each and an additional 10 mg capsule that would have been required with a 160-mg dose. Based on the data presented herein, systemic exposures, based on both AUC and Cmax, are expected to be nearly identical between the 160-mg dose tested in Part 1 and the 150-mg dose tested in Part 2.
Omaveloxolone distributes to liver, lung, and brain
The distribution of omaveloxolone to liver, lung, and brain was investigated in monkeys after daily oral administration for 14 days (Figure 3). Lung, liver, and brain displayed dose-dependent omaveloxolone content that was slightly higher than concentrations observed in plasma and, overall, demonstrated that omaveloxolone easily distributes to key tissues.
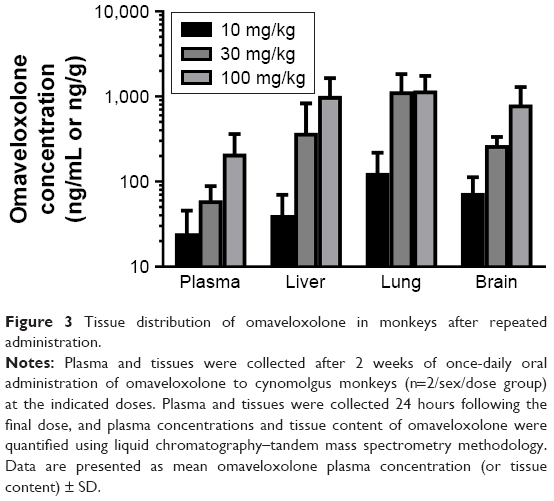 | Figure 3 Tissue distribution of omaveloxolone in monkeys after repeated administration. |
Induction of Nrf2 target gene mRNA expression by omaveloxolone in tissues and PBMCs
Monkey liver, lung, and brain were collected 24 hours after the final dose after 2 weeks of daily oral administration of omaveloxolone (10, 30, and 100 mg/kg) and analyzed for mRNA expression of various Nrf2 target genes (Figure 4). Omaveloxolone significantly and dose-dependently induced a variety of Nrf2 target genes in liver and lung. In brain, there was a trend for some Nrf2 target genes (ie, NQO1, SRXN1, and TXNRD1) to increase with dose, but only GSR and AKR1C1 demonstrated statistical significance in the 100-mg/kg/day dose group.
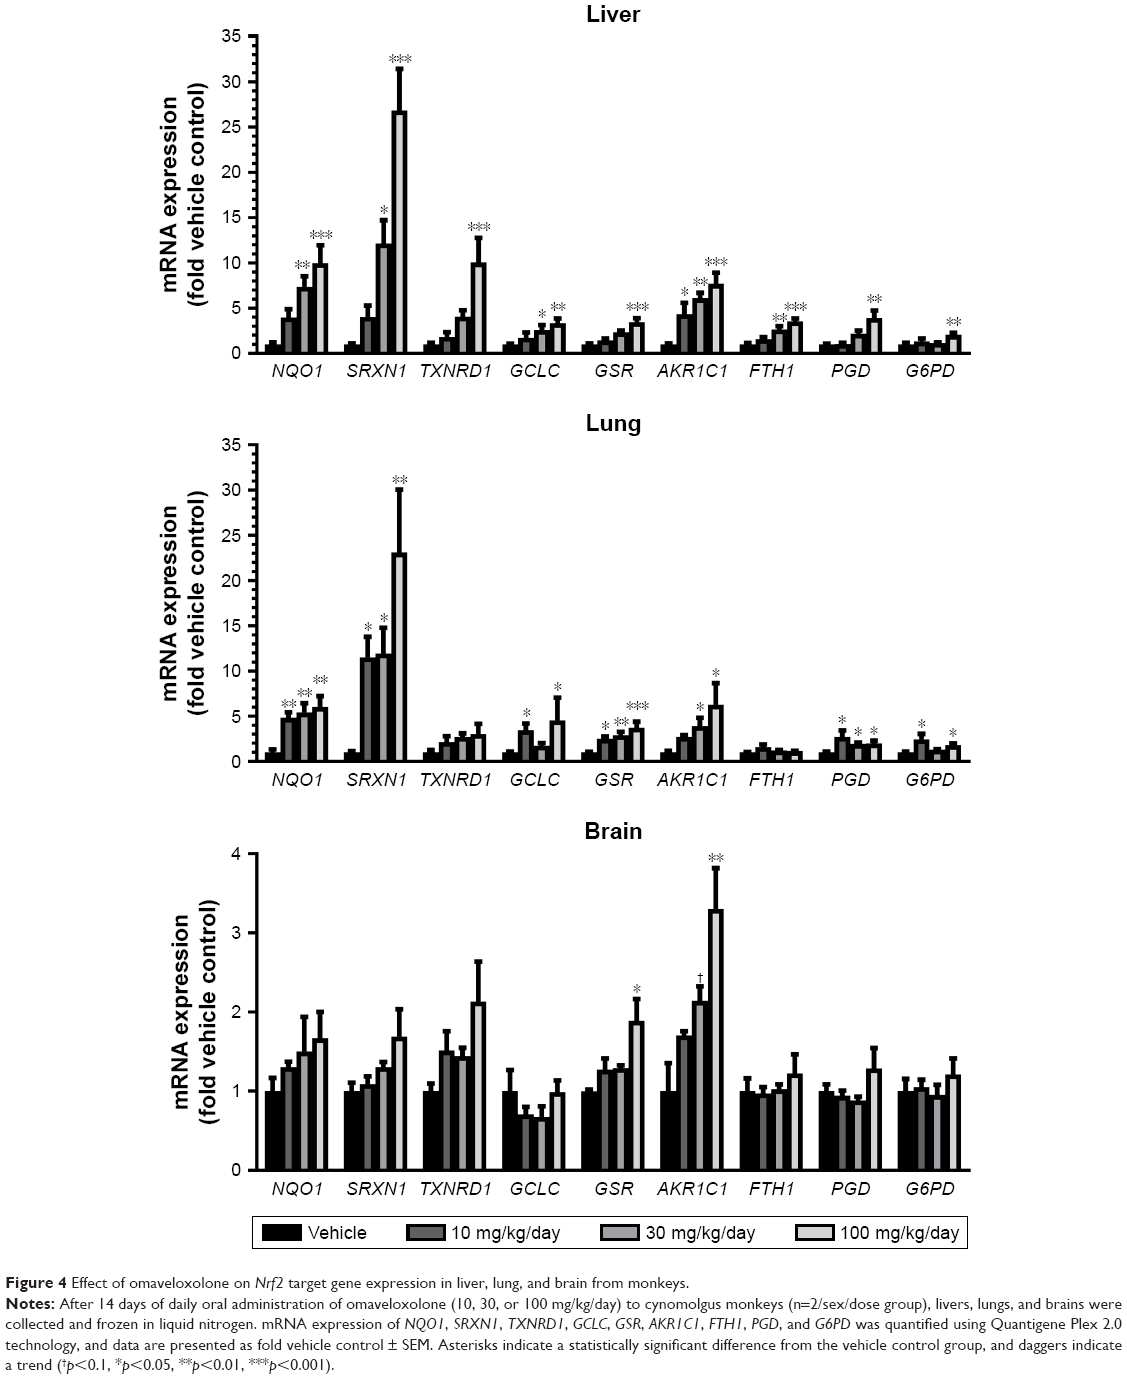 | Figure 4 Effect of omaveloxolone on Nrf2 target gene expression in liver, lung, and brain from monkeys. |
PBMCs were collected from monkeys over a period of 24 hours for analysis of Nrf2 target gene mRNA expression after a single oral dose of omaveloxolone and compared to plasma concentrations of omaveloxolone collected at the same time-points. In general, omaveloxolone significantly and dose- and concentration-dependently induced the mRNA expression of NQO1, SRXN1, TXNRD1, GSR, and PGD in PBMCs (Figure 5).
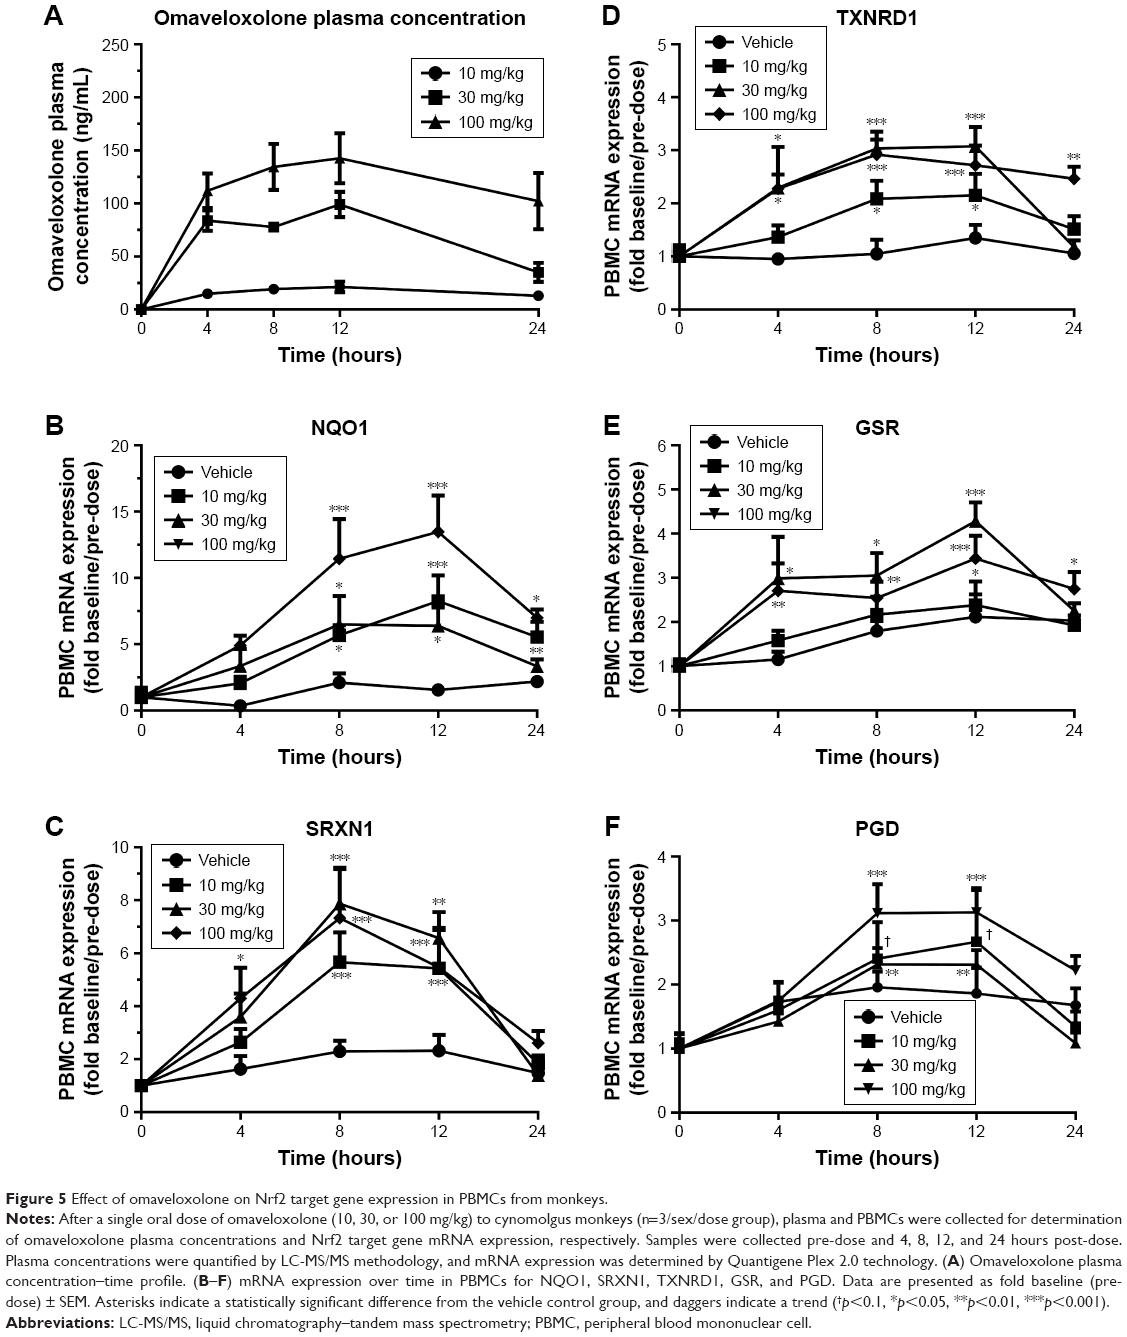 | Figure 5 Effect of omaveloxolone on Nrf2 target gene expression in PBMCs from monkeys. |
PK/PD modeling of monkey data
Population PK/PD analysis was performed on the data using nonlinear mixed-effect modeling. A PK model was first optimized prior to performing PK/PD modeling. The PK data were best described by a one-compartment model with residual additive error, and the model was fitted using the QRPEM engine. The optimized PK model was then used together with the PBMC mRNA expression data for NQO1, SRXN1, TXNDR1, GSR, and PGD to generate a PK/PD model. A PK/ maximum effect (Emax) model with a baseline Emax best described the data.
From the final PK/PD model, tvEC50 values (ie, typical half-maximal effective concentration values of the population) of 82.5, 66.6, 41.7, 38.3, and 26.8 ng/mL were estimated for SRXN1, NQO1, TXNRD1, PGD, and GSR, respectively. The tvEmax values (or typical Emax values of the population) were estimated as 9.1-, 10.8-, 2.5-, 3.5-, and 2.7-fold increase from baseline for SRXN1, NQO1, TXNRD1, PGD, and GSR, respectively. Individual patient omaveloxolone Cmax values were then compared with the monkey EC50 values for each Nrf2 target gene described above (Figure 6). In general, most of the Nrf2 target genes examined were meaningfully increased in monkeys at omaveloxolone concentrations similar to the Cmax values observed in the 80-, 160-, and 300-mg dose groups in Friedreich’s ataxia patients.
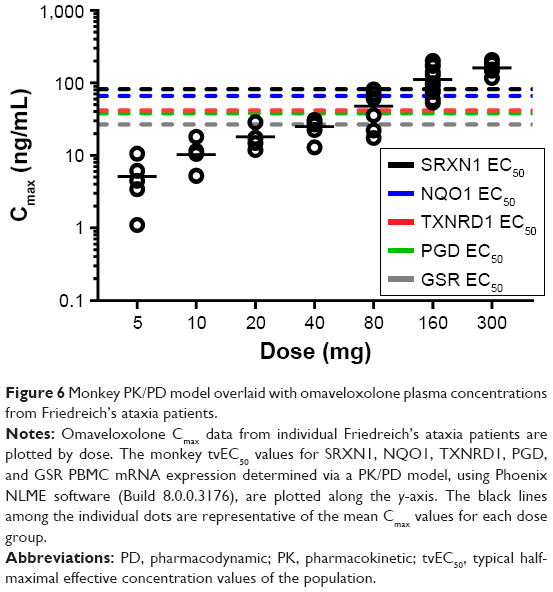 | Figure 6 Monkey PK/PD model overlaid with omaveloxolone plasma concentrations from Friedreich’s ataxia patients. |
Discussion
Omaveloxolone demonstrated consistent dose-proportional and linear systemic exposures (based on Cmax and AUC) in both monkeys and humans. The PK profile determined in Friedreich’s ataxia patients was similar to the PK parameters (ie, AUC, Cmax, and half-life) observed after oral administration of omaveloxolone to cancer patients in a previous Phase I study.20 Further, the mean apparent terminal half-life (range of 15–21 hours) of omaveloxolone in Friedreich’s ataxia patients supports a once-daily oral dosing regimen and appears to provide pharmacologically relevant exposures.
Regarding tissue distribution after oral administration in monkeys, omaveloxolone achieves meaningful concentrations in key tissues that are important in various disease pathologies, such as liver, lung, and brain. In addition, the tissue content of omaveloxolone is dose proportional, with concentrations in brain and lung that are similar to plasma concentrations. Thus, based on the monkey tissue distribution data, it is hypothesized that plasma omaveloxolone concentrations in humans may be comparable to tissue concentrations in the brain and other tissues in humans.
Selected Nrf2 target genes were dose-dependently and significantly induced in the evaluated monkey tissues, including brain. However, despite more than adequate brain penetration of omaveloxolone after oral dosing in monkeys, induction of the subset of Nrf2 target genes evaluated in the brain in this study was not as robust as in other tissues. It is hypothesized that activation of Nrf2 and the coordinated induction of potentially hundreds of Nrf2 target genes in the brain, although lower in magnitude than in other tissues, may have significant biological effects. On the other hand, it is also possible that indiscriminate homogenization of parts of the brain where Nrf2 is not as responsive or as highly expressed with areas where Nrf2 is more responsive may have diluted the mRNA concentration of targets, thereby artifactually showing less robust change in mRNA expression. It is noteworthy that previous studies have demonstrated the capacity of neurons for strong Nrf2 activation and induction of target genes in response to omaveloxolone treatment.13,15
Further, omaveloxolone also elicited concentration-dependent induction of Nrf2 target genes in PBMCs isolated from monkey blood. A PK/PD model was developed to characterize the relationship between omaveloxolone concentrations in plasma and the corresponding changes in Nrf2 target gene mRNA expression in PBMCs. From the monkey PK/PD model, tvEC50 values were determined for several prototypical Nrf2 target genes and were compared with the omaveloxolone concentrations achieved in plasma from Friedreich’s ataxia patients in the Phase II study. From this comparison, it was concluded that robust Nrf2 target gene mRNA induction would be expected in patient PBMCs at omaveloxolone doses of 80 mg and above. To minimize blood collections and patient burden, PBMCs were not collected from the Friedreich’s ataxia patients in the Phase II trial; however, significant induction of Nrf2 target genes in PBMCs isolated from cancer patients treated with omaveloxolone has been observed previously.20 After oral administration of omaveloxolone in cancer patients, evidence of Nrf2 target gene induction was observed at doses in the range of 5–10 mg (the highest dose tested), with no clear effects at the 2.5-mg dose (the lowest dose tested). Additional studies would be needed to fully characterize the PK/PD relationship for omaveloxolone induction of Nrf2 target genes in PBMCs from humans; however, the available data suggest that a 5 mg omaveloxolone dose may produce plasma concentrations that are near the minimal pharmacological effect level and an 80-mg dose may be associated with plasma concentrations near the EC50. Because omaveloxolone also easily distributes to tissues, it is anticipated that the observed plasma concentrations would be associated with pharmacologically relevant concentrations in tissues in humans, suggesting activation of Nrf2 and induction of the antioxidative response in important target tissues. Indeed, evidence of clinically meaningful improvements in neurological function was observed in Friedreich’s ataxia patients in the 80-mg and 160-mg dose groups. Likewise, significant effects of omaveloxolone on serum biomarkers of Nrf2 were also observed in patients in the 80- and 160-mg dose groups, including increases in the iron-binding protein and bona fide Nrf2 target gene ferritin.16
In accord with its PK and ability to activate Nrf2 at relevant exposures, omaveloxolone is highly effective in multiple non-clinical models of human disease. For example, rats treated with omaveloxolone once daily for only 3 days exhibited a decrease in seizure frequency of over 90% during the fourth month following development of a chronic kainic acid-induced model of status epilepticus. Such marked effects by omaveloxolone in the model of status epilepticus were associated with significant increases in glutathione and ATP in the cortex and hippocampus, as well as decreased neuronal and astrocyte cell death.13 The importance of Nrf2 in the pharmacology of omaveloxolone was demonstrated in a mouse model of renal ischemia–reperfusion injury.21 Omaveloxolone significantly improved renal function and decreased neutrophil infiltration, apoptosis, ROS production, and oxidative injury, which was associated with confirmed Nrf2 activation and increased expression of Nqo1, Gsr, and Gclc; however, these effects were absent in mice with targeted deletion of Nrf2.
The YG8R mouse model of Friedreich’s ataxia has decreased frataxin expression and exhibits defects in movement, which is associated with marked decreases in Nrf2 and its target genes (eg, Nqo1 and Gclc) in neuronal tissue and isolated fibroblasts, and increased susceptibility to oxidative stress.9,22 Likewise, Friedreich’s ataxia patient fibroblasts have decreased Nrf2 expression and are also sensitive to oxidative stress.23 Overall, the decreased Nrf2 expression, decreased Nrf2-related antioxidative activity, and the consequential and directly related increased susceptibility to oxidative stress are thought to contribute to the pathophysiology of Friedreich’s ataxia. Most applicable to the clinical development of omaveloxolone, recent non-clinical data have demonstrated that omaveloxolone affords significant protection from hydrogen peroxide-induced oxidative stress in cerebellar granule neurons collected from two different Friedreich’s ataxia mouse models (ie, KIKO and YG8R mice), as well as in fibroblasts collected from patients.15 Notably and in concurrence with protection from oxidative stress, omaveloxolone significantly induced glutathione concentrations and promoted mitochondrial respiration,15 two functional outputs known to be directly regulated by Nrf2.8,24 Further, the antioxidative and bioenergetic activity of omaveloxolone observed in cells collected from Friedreich’s ataxia patients suggests that Friedreich’s ataxia patients have the capacity to activate Nrf2 in response to omaveloxolone therapy.
In the current study, omaveloxolone readily distributed to important tissues in monkeys after oral dosing and induced Nrf2 target genes, including Nqo1, redoxins, and those involved in glutathione homeostasis, which are all diminished in patients with Friedreich’s ataxia. In conclusion, the present data characterize the PK of omaveloxolone after oral administration to monkeys and humans, and provide a preclinical PK/PD-based rationale to support Nrf2 target engagement in Friedreich’s ataxia patients and the evaluation of a 150-mg dose of omaveloxolone in Part 2 of the MOXIe clinical trial.
Disclosure
All authors are employed by and have a financial interest in Reata Pharmaceuticals, Inc., the company developing omaveloxolone for the marketplace. The authors report no other conflicts of interest in this work.
References
Liby KT, Sporn MB. Synthetic oleanane triterpenoids: multifunctional drugs with a broad range of applications for prevention and treatment of chronic disease. Pharmacol Rev. 2012;64(4):972–1003. doi:10.1124/pr.111.004846 | ||
Kerins MJ, Ooi A. The roles of NRF2 in modulating cellular iron homeostasis. Antioxid Redox Signal. 2018;29:1756–1773. doi:10.1089/ars.2017.7176 | ||
Lisk C, McCord J, Bose S, et al. Nrf2 activation: a potential strategy for the prevention of acute mountain sickness. Free Radic Biol Med. 2013;63:264–273. doi:10.1016/j.freeradbiomed.2013.05.024 | ||
Wu KC, Cui JY, Klaassen CD. Beneficial role of Nrf2 in regulating NADPH generation and consumption. Toxicol Sci. 2011;123(2):590–600. doi:10.1093/toxsci/kfr183 | ||
Hayes JD, Dinkova-Kostova AT. The Nrf2 regulatory network provides an interface between redox and intermediary metabolism. Trends Biochem Sci. 2014;39(4):199–218. doi:10.1016/j.tibs.2014.02.002 | ||
Ludtmann MH, Angelova PR, Zhang Y, Abramov AY, Dinkova-Kostova AT. Nrf2 affects the efficiency of mitochondrial fatty acid oxidation. Biochem J. 2014;457(3):415–424. doi:10.1042/BJ20130863 | ||
Holmstrom KM, Baird L, Zhang Y, et al. Nrf2 impacts cellular bioenergetics by controlling substrate availability for mitochondrial respiration. Biol Open. 2013;2(8):761–770. doi:10.1242/bio.20134853 | ||
Holmstrom KM, Kostov RV, Dinkova-Kostova AT. The multifaceted role of Nrf2 in mitochondrial function. Curr Opin Toxicol. 2016;1:80–91. doi:10.1016/j.cotox.2016.10.002 | ||
Shan Y, Schoenfeld RA, Hayashi G, et al. Frataxin deficiency leads to defects in expression of antioxidants and Nrf2 expression in dorsal root ganglia of the Friedreich’s ataxia YG8R mouse model. Antioxid Redox Signal. 2013;19(13):1481–1493. doi:10.1089/ars.2012.4537 | ||
Anzovino A, Chiang S, Brown BE, Hawkins CL, Richardson DR, Huang ML. Molecular alterations in a mouse cardiac model of Friedreich ataxia: an impaired Nrf2 response mediated via upregulation of Keap1 and activation of the Gsk3beta axis. Am J Pathol. 2017;187(12):2858–2875. doi:10.1016/j.ajpath.2017.08.021 | ||
D’Oria V, Petrini S, Travaglini L, et al. Frataxin deficiency leads to reduced expression and impaired translocation of NF-E2-related factor (Nrf2) in cultured motor neurons. Int J Mol Sci. 2013;14(4):7853–7865. doi:10.3390/ijms14047853 | ||
Kraft AD, Lee JM, Johnson DA, Kan YW, Johnson JA. Neuronal sensitivity to kainic acid is dependent on the Nrf2-mediated actions of the antioxidant response element. J Neurochem. 2006;98(6):1852–1865. doi:10.1111/j.1471-4159.2006.04019.x | ||
Shekh-Ahmad T, Eckel R, Dayalan Naidu S, et al. KEAP1 inhibition is neuroprotective and suppresses the development of epilepsy. Brain. 2018;141(5):1390–1403. doi:10.1093/brain/awy071 | ||
Puccio H, Anheim M, Tranchant C. Pathophysiogical and therapeutic progress in Friedreich ataxia. Rev Neurol (Paris). 2014;170(5):355–365. doi:10.1016/j.neurol.2014.03.008 | ||
Abeti R, Baccaro A, Esteras N, Giunti P. Novel Nrf2-inducer prevents mitochondrial defects and oxidative stress in Friedreich’s ataxia models. Front Cell Neurosci. 2018;12:188. doi:10.3389/fncel.2018.00188 | ||
Lynch DR, Farmer J, Hauser L, et al. Safety, pharmacodynamics, and potential benefit of omaveloxolone in Friedreich ataxia. Ann Clin Transl Neurol. 2019;6(1):15–26. doi:10.1002/acn3.660 | ||
Reisman SA, Goldsberry AR, Lee CY, et al. Topical application of RTA 408 lotion activates Nrf2 in human skin and is well-tolerated by healthy human volunteers. BMC Dermatol. 2015;15:10. doi:10.1186/s12895-015-0029-7 | ||
Reisman SA, Lee CY, Meyer CJ, Proksch JW, Ward KW. Topical application of the synthetic triterpenoid RTA 408 activates Nrf2 and induces cytoprotective genes in rat skin. Arch Dermatol Res. 2014;306(5):447–454. doi:10.1007/s00403-013-1433-7 | ||
Reisman SA, Yeager RL, Yamamoto M, Klaassen CD. Increased Nrf2 activation in livers from Keap1-knockdown mice increases expression of cytoprotective genes that detoxify electrophiles more than those that detoxify reactive oxygen species. Toxicol Sci. 2009;108(1):35–47. doi:10.1093/toxsci/kfn267 | ||
Creelan BC, Gabrilovich DI, Gray JE, et al. Safety, pharmacokinetics, and pharmacodynamics of oral omaveloxolone (RTA 408), a synthetic triterpenoid, in a first-in-human trial of patients with advanced solid tumors. Onco Targets Ther. 2017;10:4239–4250. doi:10.2147/OTT.S136992 | ||
Han P, Qin Z, Tang J, et al. RTA-408 protects kidney from ischemia-reperfusion injury in mice via activating Nrf2 and downstream GSH biosynthesis gene. Oxid Med Cell Longev. 2017;2017:7612182. doi:10.1155/2017/7612182 | ||
Abeti R, Uzun E, Renganathan I, Honda T, Pook MA, Giunti P. Targeting lipid peroxidation and mitochondrial imbalance in Friedreich’s ataxia. Pharmacol Res. 2015;99:344–350. doi:10.1016/j.phrs.2015.05.015 | ||
Paupe V, Dassa EP, Goncalves S, et al. Impaired nuclear Nrf2 translocation undermines the oxidative stress response in Friedreich ataxia. PLoS One. 2009;4(1):e4253. doi:10.1371/journal.pone.0004253 | ||
Wild AC, Mulcahy RT. Regulation of gamma-glutamylcysteine synthetase subunit gene expression: insights into transcriptional control of antioxidant defenses. Free Radic Res. 2000;32(4):281–301. |
Supplementary material
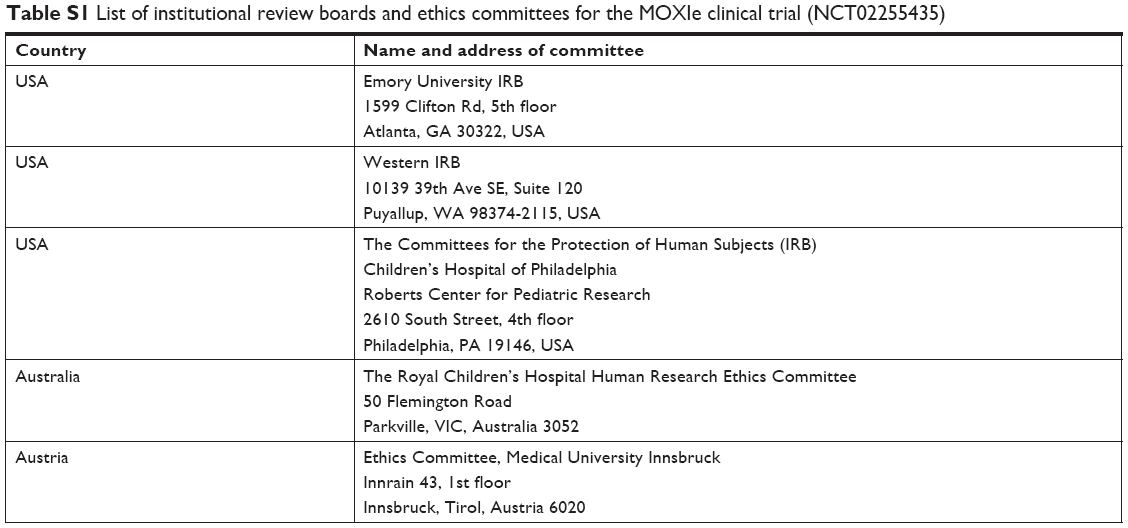 | Table S1 List of institutional review boards and ethics committees for the MOXIe clinical trial (NCT02255435) |
 © 2019 The Author(s). This work is published and licensed by Dove Medical Press Limited. The full terms of this license are available at https://www.dovepress.com/terms.php and incorporate the Creative Commons Attribution - Non Commercial (unported, v3.0) License.
By accessing the work you hereby accept the Terms. Non-commercial uses of the work are permitted without any further permission from Dove Medical Press Limited, provided the work is properly attributed. For permission for commercial use of this work, please see paragraphs 4.2 and 5 of our Terms.
© 2019 The Author(s). This work is published and licensed by Dove Medical Press Limited. The full terms of this license are available at https://www.dovepress.com/terms.php and incorporate the Creative Commons Attribution - Non Commercial (unported, v3.0) License.
By accessing the work you hereby accept the Terms. Non-commercial uses of the work are permitted without any further permission from Dove Medical Press Limited, provided the work is properly attributed. For permission for commercial use of this work, please see paragraphs 4.2 and 5 of our Terms.