")
Back to Journals » Drug Design, Development and Therapy » Volume 14
Pharmacokinetics and Metabolism Research of Shenkang Injection in Rats Based on UHPLC-MS/MS and UHPLC-Q-Orbitrap HRMS
Authors Jiang X, Zhou L, Zuo L, Wang X, Shi Y, Du X, Zhang J, Liu L, Li Z, Xue L, Liu X, Sun Z
Received 22 October 2019
Accepted for publication 21 April 2020
Published 13 May 2020 Volume 2020:14 Pages 1837—1850
DOI https://doi.org/10.2147/DDDT.S235646
Checked for plagiarism Yes
Review by Single anonymous peer review
Peer reviewer comments 2
Editor who approved publication: Dr Sukesh Voruganti
Xiaofang Jiang,1,* Lin Zhou,2,3,* Lihua Zuo,2,3 Xiaohui Wang,4 Yingying Shi,2,3 Xiangyu Du,5 Jun Zhang,2,3 Liwei Liu,2,3 Zhuolun Li,2,3 Lianping Xue,2,3 Xin Liu,1 Zhi Sun2,3
1Department of Traditional Chinese Medicine, The First Affiliated Hospital of Zhengzhou University, Zhengzhou, Henan Province 450052, People’s Republic of China; 2Department of Pharmacy, The First Affiliated Hospital of Zhengzhou University, Zhengzhou, Henan Province 450052, People’s Republic of China; 3Henan Key Laboratory of Precision Clinical Pharmacy, Zhengzhou, Henan Province 450052, People’s Republic of China; 4Department of Ultrasonography, The First Affiliated Hospital of Zhengzhou University, Zhengzhou, Henan Province 450052, People’s Republic of China; 5School of Basic Medical Science, Henan University, Kaifeng, Henan Province 475001, People’s Republic of China
*These authors contributed equally to this work
Correspondence: Zhi Sun; Lin Zhou
Department of Pharmacy, The First Affiliated Hospital of Zhengzhou University, No. 1 Jianshe East Road, Erqi District, Zhengzhou 450052, Henan Province, People’s Republic of China
Tel/Fax +86 371 66862570
Email [email protected]; [email protected]
Purpose: Shenkang injection, a traditional Chinese herbal prescription, had been widely used in renal disease due to its perfect curative effect. In this research, a novel, sensitive, accurate and rapid liquid chromatography-tandem mass spectrometric method was developed to simultaneously detect the seven active ingredients in rat plasma of Shenkang injection and investigate its pharmacokinetic behaviors with metabolism profiling meanwhile.
Methods: For accurate pharmacokinetic quantitation, a WATERS ACQUITY UPLC® BEH C18 column was used to perform a separation and acetonitrile-water (0.1% formic acid) was selected as mobile phase for gradient elution with a flow rate of 0.20 mL/min. A heated electrospray ionization with selective reaction monitoring mode was used to monitor the precursor-product ion transitions for all the analytes and IS.
Results: They all showed good linearity over a wide concentration range (r> 0.996 3) and the lower limit of quantification (LLOQ) was 0.1– 1.0 ng/mL for analytes. The validation parameters were all within the acceptable limits. Furthermore, for metabolism profiling study, metabolites of the seven ingredients were identified from the rat plasma based on the accurate mass and fragment ions. The metabolic pathways mainly focus on reduction, dehydration and conjugation.
Conclusion: This study provided an overview of disposition of Shenkang injection, which is highly instructive for better understanding the effectiveness and toxicity of this drug.
Keywords: Shenkang injection, pharmacokinetics, metabolism profiling, UHPLC-MS/MS, UHPLC-Q-orbitrap HRMS
Introduction
Shenkang (SK) injection, a mixed extract of four herbs used in Traditional Chinese Medicines (TCMs): rhubarb (Rheum officinale), Salvia miltiorrhiza, Astragalus membranaceus and safflower (Carthamus tinctorius L.), plays a key role on the protection against renal disease in clinic.1 Current clinical studies have demonstrated that SK injection could simultaneously reduce the levels of serum creatinine (Scr), total protein (U-TP), microalbumin (mALB), blood urea nitrogen (BUN) and increase the creatinine clearance rate (Ccr), nitric oxide (NO), albumin (Alb) serum levels, and then improve the clinical symptoms and delay the progress in patients.2 Our previous chemical profile and quality analysis researches had found that SK injection contains gallic acid, danshensu, rosmarinic acid, salvianolic acid A, aloe-emodin, rhein and emodin, which were considered as the main bioactive compounds.3,4 However, up to now, many studies paid close attention to the pharmacological and chemical research of SK injection, but its pharmacokinetic behaviors and metabolism profiling are absent.
Pharmacokinetic profile, as a key factor to understand the drug-like property of bioactive compounds, can also provide a useful information for better understanding the process of the compounds in vivo, which can help us to design the drug dosage regimen.5 Especially for TCMs, whose therapeutical effects are through the combination of multiple Chinese herbs, and the interactions between two or more agents can lead to the changes of the pharmacokinetic behaviors and the therapeutic effects in body.6 Similarly, drug metabolism is an integral part of drug discovery, toxicity studies and rational drug use, which could usually affect the drug’s efficacy and toxicity. Therefore, investigating the pharmacokinetics and metabolism properties of TCMs can be beneficial to clarify the TCMs’ underlying pharmacological mechanism and the clinical application and development.7 As far as we know, the detailed pharmacokinetics and metabolism profiling of SK injection remain unknown.
In this paper, a novel UHPLC-MS/MS and UHPLC-Q-orbitrap HRMS method is developed to explore the pharmacokinetic and metabolism profiling of the seven bioactive compounds in rat plasma and urine after intravenous administration of SK in rats at three dosages. By means of the high sensitivity, high selectivity and high accuracy of the mass spectrometry (TQD and Q-Orbitrap), a SRM mode and the data-dependent MS2 capture mode were used for quantitative pharmacokinetic research and qualitative metabolism research, respectively, which were rarely used in the past. We pleasantly found that these modes could also provide a perfect result and show many powerful advantages. Finally, the validated method was successfully applied to the pharmacokinetic and metabolism study after intravenous administration of SK in rats and expected to provide further help for the apprehension of the effective, toxicity and safety.
Materials and Methods
Reagents and Materials
Authentic standards of gallic acid, danshensu, rosmarinic acid, salvianolic acid A, aloe-emodin, rhein and emodin were obtained from Chengdu Must Bio-technology Co., Ltd. (Sichuan, China). Carbamazepine using as internal standard was purchased from National Institute for the Control of Pharmaceutical and Biological Products (Beijing, China). These compounds were determined with the purity >98% by HPLC or GC method. The medicines of SK injection were bought from Xian Shiji Shengkang Pharmaceutical Industry Co., Ltd. (Xian, Shannxi, China).
Methanol and acetonitrile (chromatographic grade) were purchased from Fisher Scientific (Pittsburgh, PA, USA). LC-MS grade formic acid was obtained from Aladdin Industrial Co., Ltd. (Shanghai, China). All the other chemicals were analytical grade. The deionized water (18.2 MΩ) was purified by a Millipore water purification system (Millipore, Shanghai, China) and all of the solutions were filtrated by 0.22 μm pore size filters.
UHPLC-MS/MS Instrument and Conditions for Pharmacokinetics Study
Chromatography separation was conducted on a UHPLC Vanquish system (Thermo Scientific, San Jose, USA) equipped with cooling auto-sampler, column oven enabling temperature control and UV detector. The condition was as follows: Waters ACQUITY UPLC® C18 column (2.1 mm × 50 mm, 1.7 μm) was allocated as a separation column, the temperature was set at 40°C. A binary mobile solvent manager was employed, and the mobile phases was consisted of water containing 0.1% (v/v) formic acid (A) and acetonitrile (B) with gradient elution (0–0.5 min, 5% B; 0.5–3.0 min, 5–100% B; 3.0–4.0 min, 100% B). While, prior to the next injection, the column would be re-equilibrated at 5% B for 2 min. The flow rate was set at 0.20 mL/min, the auto-sampler was conditioned at 10°C and the injection volume was 3 μL for every analysis.
Mass analysis was performed using a TSQ-Altis mass spectrometer (Thermo Scientific, San Jose, USA) equipped with a heated electrospray ionization (HESI) source. The parameters of optimized mass spectrometry were as follows: the spray voltage: +3.5 kV or −2.5 kV; the sheath gas pressure: 50 arb; the aux gas pressure:10 arb; the sweep gas pressure: 0 arb; Ion Transfer Tube Temp (°C): 325°C; Vaporizer Temp (°C): 350°C; Cycle Time (sec): 0.8; Q1 Resolution (FWHM): 0.7; Q3 Resolution (FWHM):1.2; CID Gas (mTorr): 2; Chromatographic Peak Width (sec): 6. All the data acquired would be processed by Thermo TraceFinder 4.1 General Quan (Thermo Scientific, San Jose, USA).
UHPLC-Q-Orbitrap HRMS Instrument and Conditions for Metabolite Profiling
Chromatographic separation was performed on UHPLC Dionex Ultimate 3000 system (Thermo Scientific, San Jose, USA) using a Waters ACQUITY UPLC® HSS T3 column (2.1 mm × 100 mm, 1.8 µm) and the column temperature was set at 40°C. The gradient elution was achieved with 0.1% formic acid in water (A) and acetonitrile (B) as mobile phase and the procedure were at follows: 0.0~3.0 min, 5.0% A; 3.0~16.0 min, 5.0%~15.0% A; 16.0~20.0 min, 15.0%~22.0% A; 20.0~26.0 min, 22.0%~55.0% A; 26.0~30.0 min, 55.0%~100.0% A; 30.0~35.0 min, 100% A at a flow of 0.2 mL/min. The auto-sampler was conditioned at 10°C and the injection volume was 5 µL for analysis.
A Q Exactive high-resolution mass spectrometry that equipped an electrospray ionization (ESI) ion source connected with the UHPLC system. Some parameters such as the temperatures of auxiliary gas, ion source and capillary were 300°C, 350°C and 320°C respectively, with the flow rate of the auxiliary gas 10 μL/min. The gradient collision energy was set at 20, 30 and 40 eV. The spray voltage was set to 3.50 kV and 2.80 kV with the sheath gas flow rate 40 μL/min and 38 μL/min for the positive mode and negative mode, respectively. Samples were detected through acquisition mode of full scan/ddms2 with a range of 80–1200 m/z at the mass resolving power of 17,500 in MS/MS.
Plasma Sample Preparation for Pharmacokinetics and Metabolism Study
A 100 μL aliquot of plasma was vortex mixed with 20 μL of IS solution (containing 500 ng/mL carbamazepine) in an Eppendorf tube for 30 s, and then 300 μL acetonitrile was added to precipitate the protein. The tube was vortex for 5 min, and then centrifuged at 13,000 rpm for 10 min. After that, all of the supernatant was transferred into another clean Eppendorf tube and dried under the vacuum centrifuge enrichment system. Then, the residue was redissolved in 50 μL methanol-water (1:1), vortex and mixed for 2 min, then centrifuged at 13,000 rpm for 5 min, and finally 20 μL supernatant was transferred to the sample bottle for the subsequent pharmacokinetics study and metabolism identification.
The urine sample (200 µL) was spiked with 200 µL pure water, vortexing for 1 min. After centrifuging at 13,000 rpm for 10 min, the supernatant was filtered by 0.22 µm microporous filter membrane into sample bottle for metabolism identification analysis.
Preparation of Calibration Standard and Quality Control (QC) Samples
The stock solutions were prepared by dissolving the standard references with pure methanol and finally making the concentration reaching a level of 1.0 mg/mL. A certain content of each standard reference stock solution was taken out accurately and mixed together to form a mixture solution. Then, the working solutions were produced by diluting the mixture solutions to the designed concentration. In addition, the carbamazepine (IS) solution was prepared at a final concentration of 500 ng/mL in methanol, and all the solutions were stored at 4°C.
The calibration standards and QC samples were prepared by evaporating and dryness 10 μL standard working solution using a vacuum centrifuge enrichment system (Refrigerated Centrivap® Concentrator, LABCONCO, USA) and adding 100 μL blank plasma for redissolving. Finally, the analytes of plasma gradient concentration ranges were 0.1–50.0 ng/mL for gallic acid, 0.5–250.0 ng/mL for danshensu, 0.1–50.0 ng/mL for rosmarinic acid, 0.1–50.0 ng/mL for salvianolic acid A, 1.0–500.0 ng/mL for aloe-emodin, 1.0–500.0 ng/mL for rhein and 0.1–50.0 ng/mL for emodin, respectively. And the QC samples were finally prepared in blank plasma at the concentration of 0.2, 2.5, 40.0 ng/mL for gallic acid; 1.0, 12.5, 200.0 ng/mL for danshensu; 0.2, 2.5, 40.0 ng/mL for rosmarinic acid; 0.2, 2.5, 40.0 ng/mL for salvianolic acid A; 2.0, 25.0, 400.0 ng/mL for aloe-emodin; 2.0, 25.0, 400.0 ng/mL for rhein and 0.2, 2.5, 40.0 ng/mL for emodin, respectively. The standards and QC samples were processed on each analysis day with the same procedures as described below.
Method Validation
The established method was validated in terms of specificity, linearity, lower limit of quantification (LLOQ), precision, accuracy, recovery, matrix effect, stability and dilution integrity according to the guidelines for bio-analytical method validation as issued by the FDA Center for Drug Evaluation and Research.8
Selectivity and Specificity
The selectivity and specificity of the current method were evaluated by comparing the chromatograms of blank plasma from six individual rats, plasma sample obtained after intravenous administration of SK injection, and plasma sample spiked with seven analytes and IS to ensure the absence of the potential interferences at LC peak region for analytes and IS.
Linearity and LLOQ
The calibration curves were constructed using the peak area ratios of the targeted analytes to IS versus plasma concentrations with a 1/X2 weighted linear least-squares regression model. The LLOQ was the lowest concentrations that could be quantitatively determined with precision (expressed as the relative standard deviation, RSD) and accuracy (expressed as the relative error, RE).
Precision and Accuracy
The precision and accuracy were demonstrated by analyzing the QC samples in six replicates at three levels (low, medium and high) on the same day and three consecutive days, respectively.
Recovery and Matrix Effect
The extraction recovery was evaluated by comparing the mean peak areas of extracted spiked samples with the mean peak areas of the corresponding standard solutions added into the post-extracted spiked samples. Matrix effects usually occurred when endogenous substance was co-eluting with the targeted analytes, which could enhance or decrease the ionization efficiency of the electrospray interface. The Matrix effects were assessed via comparing the mean peak areas of standard solution dissolved in post-extracted blank matrix against the mean peak areas of that dissolved in methanol. The extraction recovery and matrix effect were calculated with six replicates at three QC levels.
Stability Experiment
Stability experiment was achieved by analyzing the plasma samples at three QC levels with six replicates under various conditions: 4 h exposure before preparation at room temperature (23°C), three freeze/thaws cycles (from −80°C to 20°C), 24 h storage at 4°C and 14 days storage at −20°C. In addition, the extracted QC samples would be kept in the auto-sampler for 24 h to evaluate the post-preparative stability. All the analytes would be considered stable when the assay values were within the acceptable limits of precision (≤15% RSD) and accuracy (±15% RE).
Dilution Integrity
The dilution integrity was tested by analyzing six replicate samples with the concentration of 500.0 ng/mL for gallic acid, 2.5 μg/mL for danshensu, 500.0 ng/mL for rosmarinic acid, 500.0 ng/mL for salvianolic acid A, 5.0 μg/mL for aloe-emodin, 5.0 μg/mL for rhein and 500.0 ng/mL for emodin, respectively, which would be diluted 10-fold with blank rat matrix. These diluted samples were then analyzed using the new established calibration curve to calculate the value of RE and RSD, which should be within the criterion of ±15%.
Application to Pharmacokinetics and Metabolism Study
This study was approved by the Animal Ethics Committee of the First Affiliated Hospital of Zhengzhou University (Zhengzhou, China), and the animal experiment was operated under the Animal Management Regulations. Six healthy SD male rats, weighing 200±20 g, were purchased from the Experiment Animal Center of Henan province (Zhengzhou, China). All animals were fed to adapt to the environment under the controlled temperature (20 ± 2°C) and humidity (60 ± 5%) for one week, then, they were fasted for 12 h but with free access to water before the experiment. Many efforts were made to minimize animals’ suffering and reduce the numbers of the experimental animals.
In this study, the rats were administered intravenously with SK injection at a dose of 3.0, 6.0 and 9.0 mL/kg (the concentrations of gallic acid, danshensu, rosmarinic acid, salvianolic acid A, aloe-emodin, rhein and emodin in SK injection were as follows: 17.7 µg/mL, 73.6 µg/mL, 0.7 µg/mL, 0.7 µg/mL, 1.6 µg/mL, 5.3µg/mL and 0.5 µg/mL, respectively). Plasma samples (approximately 0.40 mL) were collected from suborbital vein and transferred into heparinized eppendorf tubes at 0 (pre-dose), 0.083, 0.167, 0.333, 0.50, 0.667, 0.833, 1, 1.5, 2, 4, 6 and 8 h after drug intravenously administration. Subsequently, the samples were immediately centrifuged at 0.9 × g for 10 min at 4°C to separate the plasma, then the harvested supernatant was transferred into a clean eppendorf tubes and frozen at −20°C until LC-MS/MS analysis.
Statistical Analysis
Pharmacokinetics analysis was performed using compartmental model by DAS 2.0 software program (Chinese Pharmacological Society) to calculate the pharmacokinetics parameters such as Cmax, Tmax, T1/2, CLz/F, AUC0-t and AUC0-∞, all of the data were expressed as mean ± SD.
The HRMS data of all the test and control samples were processed in the Compound Discoverer 2.1 (CD, Thermo Fisher Scientific) to extract the metabolite-related dataset. The extract data included molecular formula, molecular weight and biotransformation which assisted in conjecturing structure. Then, the speculative structure and mass spectrometry were further exported to the Mass Frontier 7.0 (MF, Thermo Fisher Scientific) to observe whether the structure and fragments match.
Results and Discussion
Method Optimization
Optimization of Sample Preparation
Initially, for sample pretreatment, both protein precipitation (PPT) and liquid-liquid extraction (LLE) were taken into consideration. Therefore, the PPT with precipitators (such as methanol and acetonitrile) and the LLE with organic solvents (such as methanol, chloroform, hexane, ethyl acetate, ether with different hydrophobicity and ratios) were investigated to screen a good pretreatment method. The results showed that the recovery values of PPT for the analytes and IS were higher than those of LLE, and the matrix effect of PPT also indicated an acceptable result. Furthermore, for PPT method, acetonitrile turned out a better extraction ability than methanol. As a result, a protein precipitation method using acetonitrile was developed for sample pretreatment.
Moreover, when the supernatant was prepared for evaporating to dryness in the process of sample preparation, a vacuum centrifuge enrichment system was employed instead of the traditional nitrogen stream. On account of the instabilities of the water-bath heating and the flow rate of the nitrogen, it is hard for the traditional method to get good recoveries and the relevant SD values. Compared with the nitrogen stream method, many powerful advantages had been demonstrated for the vacuum centrifuge enrichment system, such as reducing the analytes loss, preventing the oxidation of samples, shorten the enrichment time and avoiding the environment pollution. Through the optimized sample preparation method, the goals of low matrix effect, high recovery percentile and good peak reproducibility would be well achieved.
Optimization of Chromatographic Condition and Mass Spectrometry Condition
In this study, in order to obtain symmetrical peaks shape, short chromatographic retention times and high response, various mobile phase conditions including methanol, acetonitrile, water and different concentrations of formic acid were tried. The result showed that, compared with methanol, acetonitrile could give a shorter running time, higher intensity and lower background noise; the addition of 0.1% formic acid in water could not only enhance the ionization efficiency, but also prevent the peak-tailing to achieve better symmetry; while, gradient elution could narrow the peak shape and improve the intensity of the analytes and IS. Finally, based on the preliminary experiment above, a gradient elution with acetonitrile and water containing 0.1% formic acid at a flow rate of 0.20 mL/min was selected and a perfect separation was achieved rapidly within 4 min.
To optimize MS parameters, scans were conducted in both positive and negative ion detection mode simultaneously. The negative HESI mode of the analytes offered greater sensitivity than that of the positive HESI mode. Higher sensitivity was attained for the IS in the positive HESI mode. For TSQ Altis, SRM mode performed quantitative analysis using parent–daughter ion pair, which had better specificity and sensitivity compared with SIM mode. And SRM had the greatest advantages of simpleness, speediness and time saving while ensuring the precision qualitation and quantification. Meanwhile, other MS parameters, including the precursor-product ion pairs, collision energy, min dwell time, polarity, the heated temperature and the gas pressure, were all carefully optimized for maximum response and summarized in Table 1.
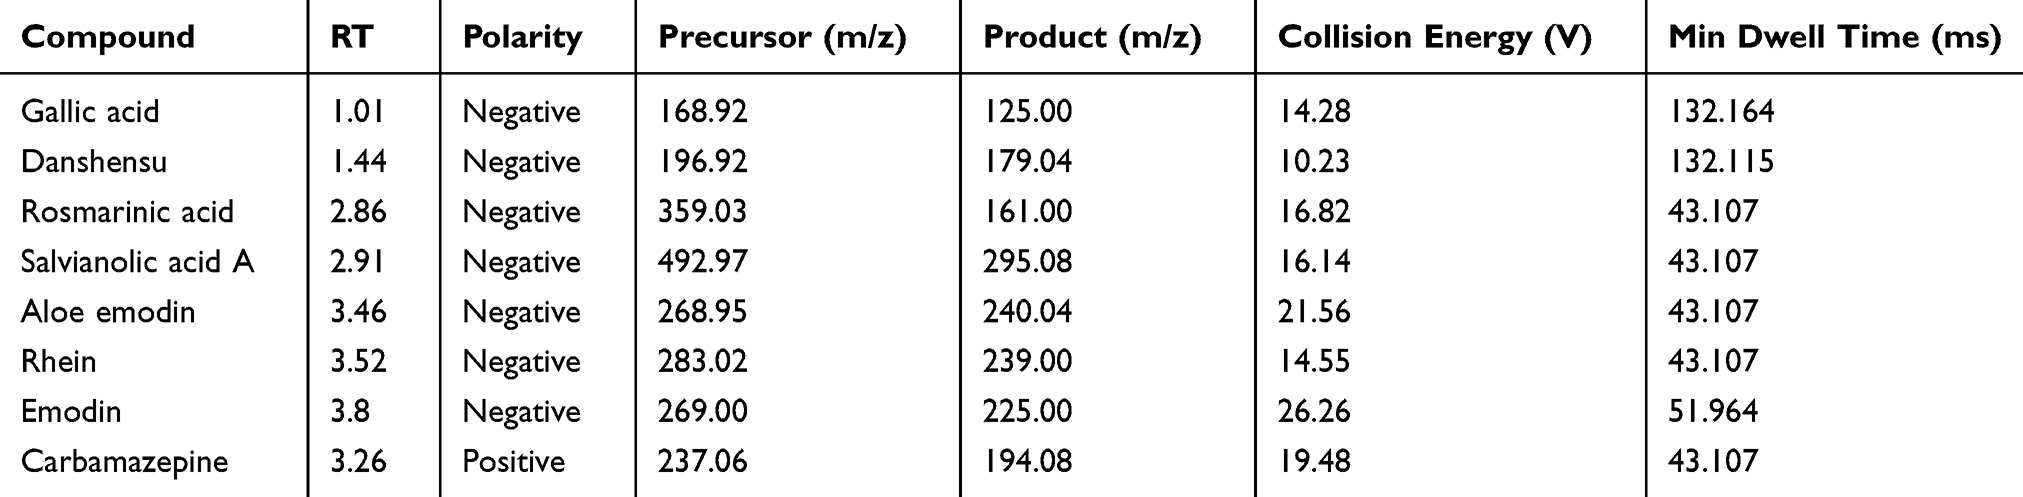 |
Table 1 Mass Parameters of All the Analytes and IS |
Selection of Internal Standard (IS)
It is important to choose appropriate internal standards during the analysis of biological sample. Generally, an ideal internal standard should be the isotope compound or the structure which was similar to the analytes would be the satisfactory choice. However, in this research every ingredient had their own properties, therefore, the stable analogue was hard to obtain. Fortunately, by means of the detection of the seven compounds under positive and negative ion mode simultaneously, carbamazepine, which had a perfect response and no interference with the analytes and the complex biological matrix, was finally selected in our experiment as an ideal internal standard.
Method Validation
Selectivity and Specificity
The typical chromatograms of from blank plasma, blank plasma spiked with the standard solution and IS, and plasma samples obtained following intravenous administration of SK injection are shown in Figure 1. Under the optimized chromatographic conditions, there was no endogenous interference for any of the analytes, which demonstrated that the method was satisfactory.
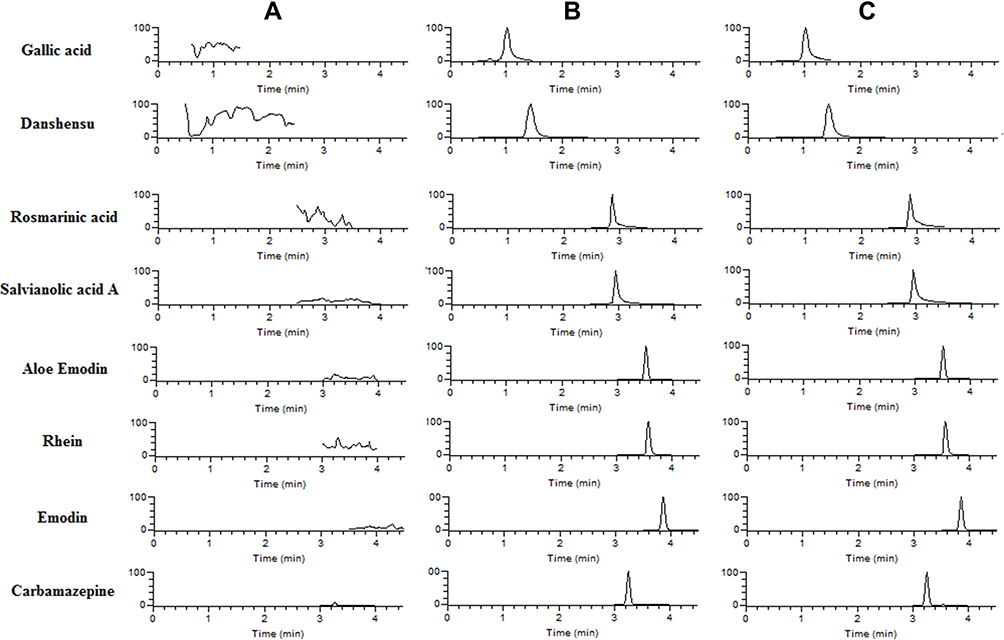 |
Figure 1 The extracted ion chromatograms (XIC) of the seven analytes in rat plasma. (A) Blank plasma, (B) blank plasma spiked with seven analytes and IS, and (C) rat plasma samples at 0.083 h after intravenous administration of SK injection. |
Linearity and LLOQ
The linear regression equations, linear ranges, correlation coefficients and LLOQ for the determination of the seven analytes were all summarized in Table S1. In our study, the linearity of the method was established by analyzing the corresponding standard references at seven concentration levels. The calibration curves were described by plotting the peak area ratios of analytes to IS (Y) versus the relative plasma concentration (X); the correlation coefficients (r) of the analytes ranged from 0.996 3 to 0.998 0, which exhibited good linearity. Data showed that the LLOQ for gallic acid, danshensu, rosmarinic acid, salvianolic acid A, aloe-emodin, rhein and emodin was 0.1, 0.5, 0.1, 0.1, 1.0, 1.0 and 0.1 ng/mL, respectively, which were sufficient for pharmacokinetics study of the seven analytes after the intravenous administration of SK injection to rats.
Precision and Accuracy
The results of intra-day and inter-day precision and accuracy of the QC samples at four concentrations were summarized in Table S2. The intra-day precision (RSD%) of all analytes was less than 6.68%, and the accuracy (RE%) ranged between −8.37% and 9.85%. Similarly, the inter-day precision (RSD%) was below 9.85%, and the accuracy (RE%) ranged from −6.98% to 9.51%. It turned out that the assay method was reproducible and accurate for the detection of the analytes.
Extraction Recovery and Matrix Effect
The extraction recovery and matrix effect data of all analytes were shown in Table S3. Values for extraction recovery were measured for six replicates in QC samples at three concentration levels, and all of them were in the range from 81.38% to 90.82% (RSD: 4.05–8.58%), demonstrating no significant loss of analytes occurred during the protein precipitation. The Matrix effects obtained from the QC samples were in the range from 94.84% to 104.43% (RSD: 3.56–8.26%), which suggested that no significant matrix effect existed in rat plasma, indicating that the ionization suppression between the analytes and the endogenous elution near by could be negligible.
Stability
Stability of the analytes stored under different conditions was evaluated in six replicates of QC samples at three concentration levels, the detailed results were exhibited in Table S4. The RSD values of all analytes ranged from 1.13% to 7.27% for 4 h before preparation at room temperature (23°C), 1.84% to 5.59% in auto-sampler pool for 24 h during the analysis process, 2.12% to 8.92% for three freeze-thaw cycles (from −80°C to 20°C), 2.24% to 9.40% for 24 h storage at 4°C, 1.80% to 6.62% for 14 days storage at −20°C, indicating that the compounds were stable and no obvious degradation occurred in plasma samples under the different conditions.
Dilution Integrity
The six replicates samples which were diluted in 10-fold were analyzed, then the precision (RSD) and accuracy (RE) were calculated to compare with the nominal values. The RSD and the RE were all less than 4.83% and ±9.9%, which were in the acceptable range of 15%. The result demonstrated that the method we established could be applied for the higher concentrations exceeding the linear ranges in the later quantitative analysis.
Pharmacokinetics Study
The established LC-MS/MS method was successfully validated and applied to investigate the pharmacokinetics profiles of seven ingredients from rat plasma after intravenous administration of SK injection at the three doses of 3.0, 6.0 and 9.0 mL/kg. In this study, the pharmacokinetics parameters of the drug were calculated by DAS 2.0 software and were summarized in Table 2, while, the mean plasma concentration versus time curves of the seven ingredients were presented in Figure 2.
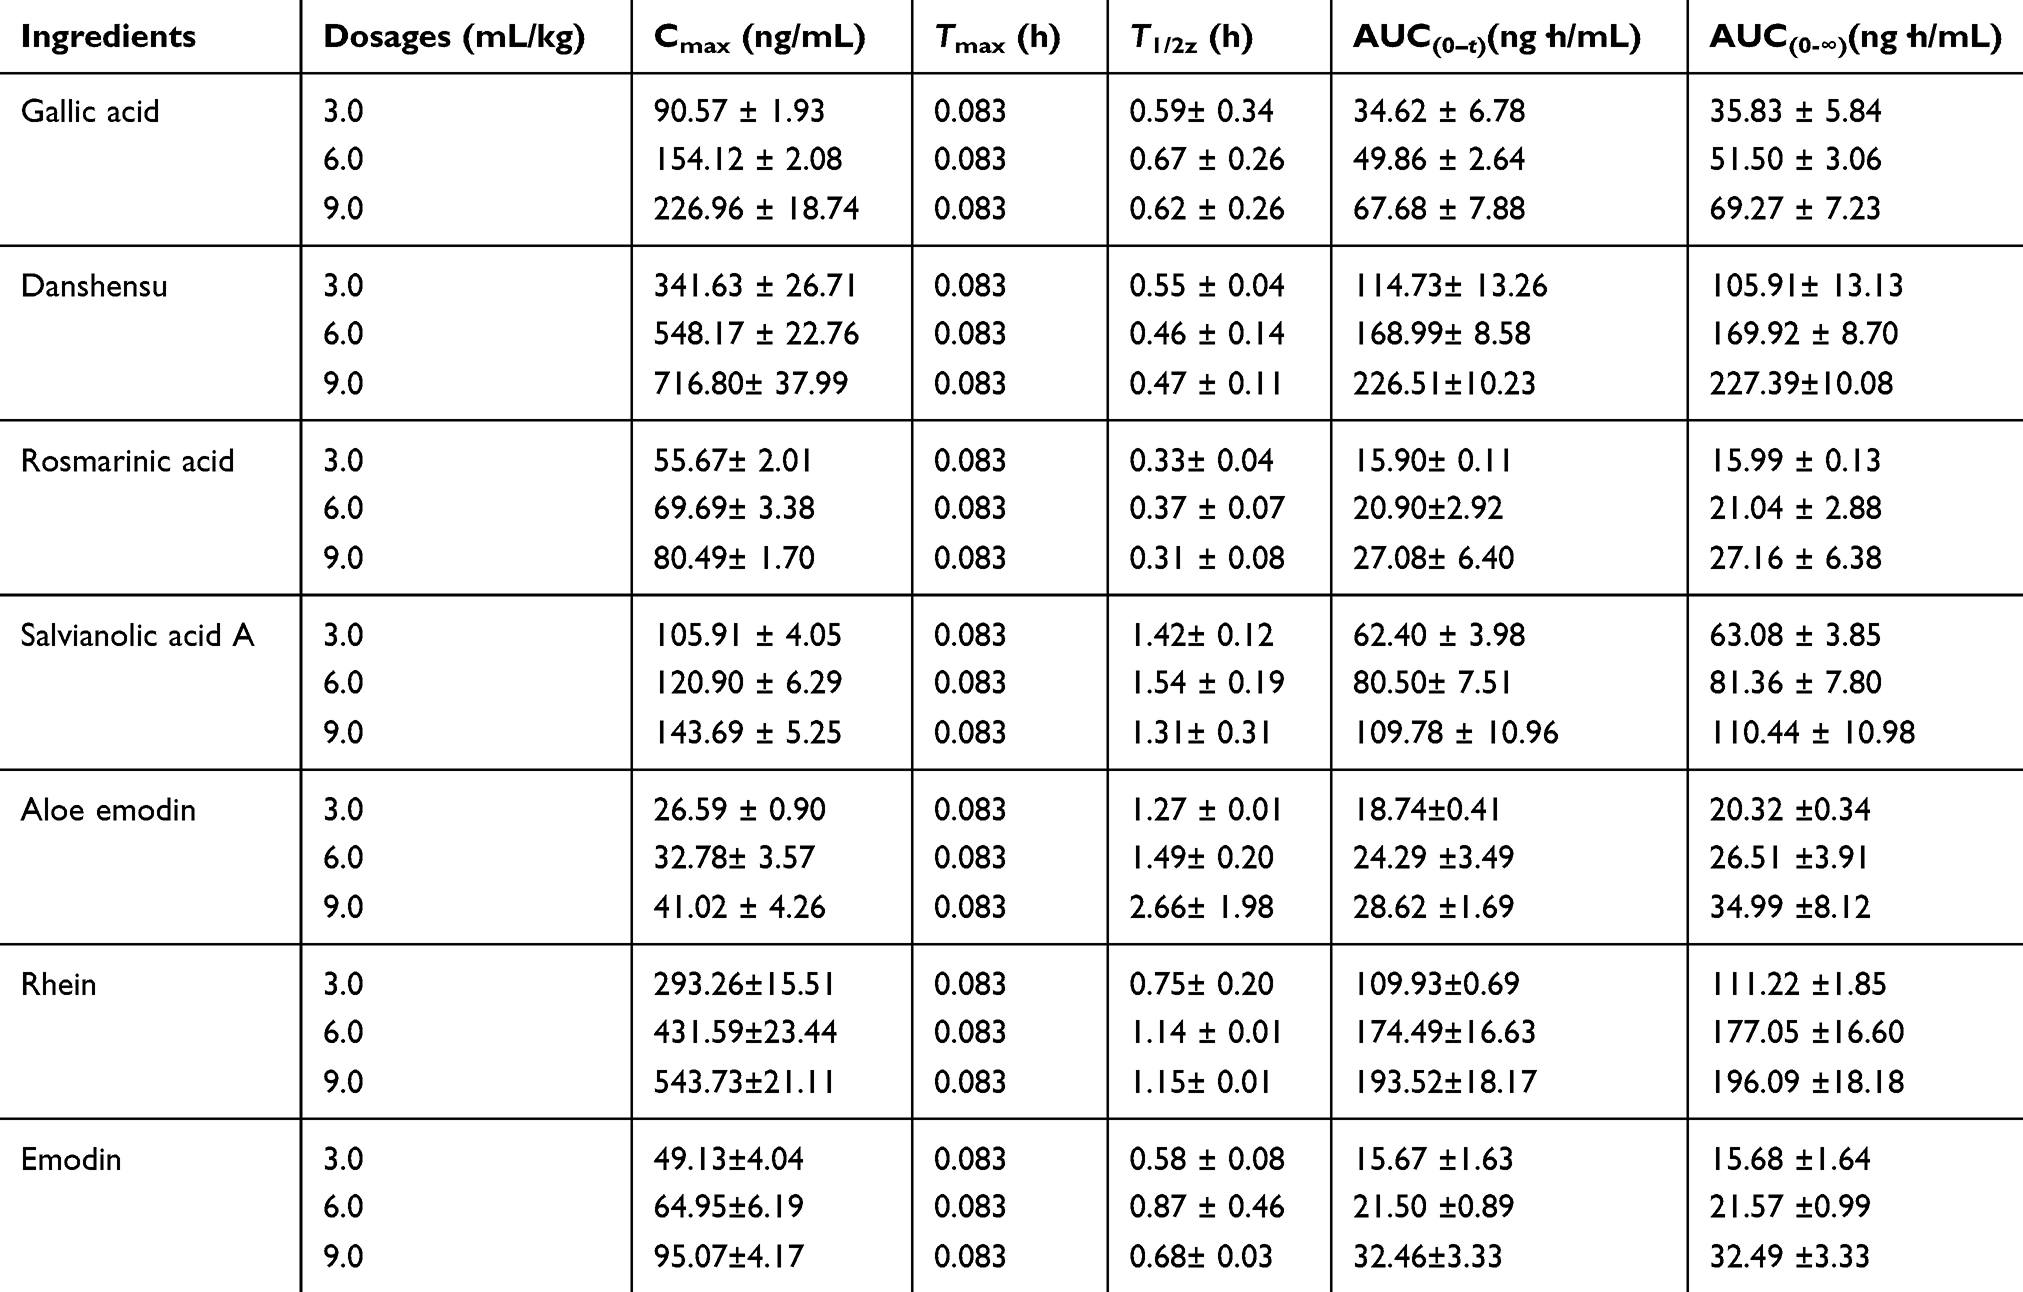 |
Table 2 Pharmacokinetic Parameters of Gallic Acid, Danshensu, Rosmarinic Acid, Salvianolic Acid A, Aloe-Emodin, Rhein and Emodin After Intravenous Administrations of SK Injection to Six Male SD Rats (mean±SD, n=6) |
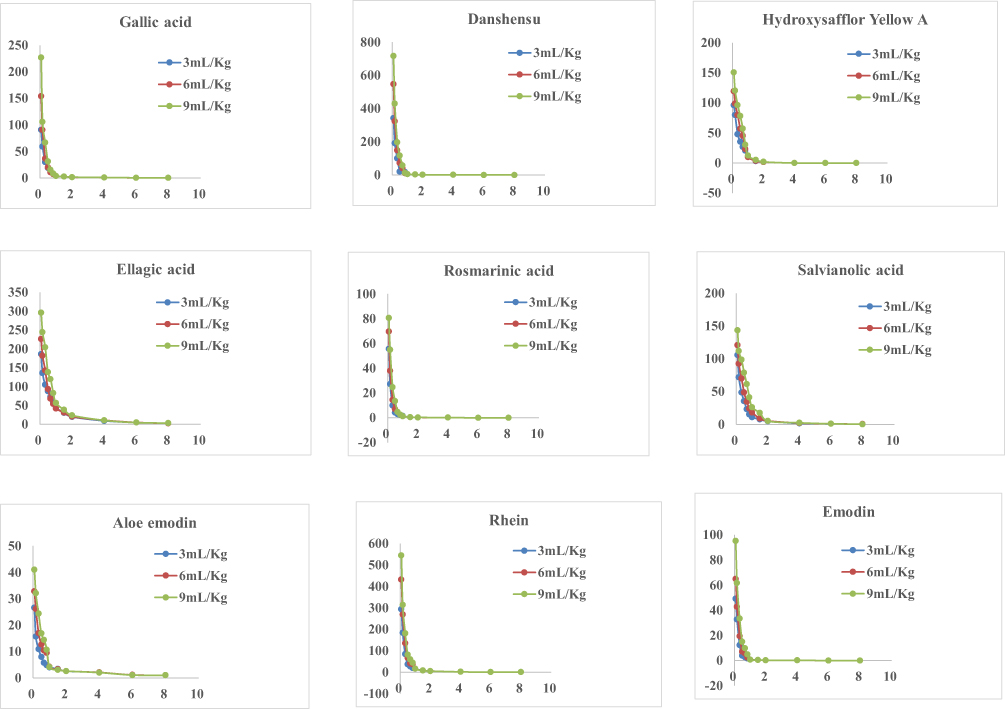 |
Figure 2 Mean (±SD, n=6) plasma concentration-time profiles of the seven analytes in rats after intravenous administration of 3.0, 6.0 and 9.0 mg/kg SK injection. |
From a general overview, AUC(0-∞) and Cmax values of seven analytes were proportional to doses for 3.0, 6.0 and 9.0 mL/kg, and the linear correlation coefficient (r) of AUC(0-∞) and Cmax to the three doses for the seven analytes was all over 0.90, indicating a good linear relationship. Thus, we might conclude that the pharmacokinetics behavior of SK injection was positively related to dose at the dose range of 3.0–9.0 mL/kg. While, from the Drug–time curves of Figure 2, it could be observed that the trends of drug elimination for seven analytes were all similar among different doses. And there was no significant difference among three dosing levels (p>0.05) for other pharmacokinetics parameters such as Tmax and T1/2z.
For single dose (such as 9 mL/kg) in this research, all of the analytes could be classified into two parts: four phenolic acids (gallic acid, danshensu, rosmarinic acid, salvianolic acid A) and three anthraquinones (aloe emodin, rhein, emodin). From Figure 2, we could read that all the active ingredients experienced a rapid metabolism, performing a sharp decline in the drug–time curve. Concretely, from Table 2, we could discover that the maximum plasma concentration (Cmax) of the phenolic acids was higher, implying a strong effect at a certain time. The phenolic acids were the main compounds in the Salvia miltiorrhiza, which was a Chinese herb that often played a role in promoting the blood circulation and met the main pharmacological effects of SK injections.9 While, the T1/2z of the anthraquinones were relatively higher than the phenolic acids, indicating a slow elimination and a long-term effect. The reasons might be that the anthraquinones compounds were weakly polar compounds with strong lipid solubility and had high plasma protein binding rate. Therefore, they rapidly distributed to various tissues and organs in vivo, resulting a relatively slow elimination. What’s more, these compounds had the important role of anti-microbial, antiviral, anti-tumor, anti-inflammatory and diuresis.10,11
From the AUC data, we could find that, danshensu, an active ingredient which had the function of antioxidant, heart protection, renal protection, anti-inflammatory and antithrombus, had the biggest content (226.51 ± 10.23 ng·h/mL) in vivo, suggesting an important role in the course of drug therapy.12–14 The tissue distribution of the drug can be reflected by some pharmacokinetics data and there are some correlations between them. More interesting, combined with the tissue distribution research, danshensu had a shortest T1/2z in plasma, while, it could still keep a high concentration than other components in the kidney at 0.5 h, indicating that danshensu might rapidly distribute to the kidney and effect quickly at the early time. Due to the diversities of the chemical structures and the drug–drug interactions between compounds, each of the active ingredients often showed different characteristics of pharmacokinetics. Some active ingredients had a bigger parameter of Cmax and some had a long time of T1/2z, every one played their own roles to meet a comprehensive therapy of SK injection, and it was also considered the basic theory of TCM.
Metabolism Study
The metabolite-related data were obtained from the UHPLC-HRMS and processed by the CD software. And the processed data contained formula, molecular weight and potential transformations, which contributed to predict the metabolite structures (Shown in Table S5) and understand the biotransformation.
M1 was Gallic acid, and M1-1, M1-2, M1-3 and M1-4 were speculated as its metabolites. For details, M1-1 (C7H4O) was generated from M1 by the process of dehydration (−2H2O) and reduction (-O2, +H2). M1-2 (C8H4O3) was generated by the process of dehydration (−2H2O) and methylation (+CH2). M1-3 (C9H9NO3) was generated by the process of dehydration (-H2O), reduction (-O2, +H2) and glycine conjugation (+NH2CH2CO). M1-4 (C9H8O3) was generated by the process of dehydration (-H2O), reduction (-O2, +H2) and acetylation (+CH2CO).
M2 was Danshensu, M2-1 (C9H8O2) was generated from danshensu by the process of dehydration (-H2O), desaturation (-H2) and reduction (-O2, +H2). M2-2 (C9H6O3) was generated from danshensu by the process of dehydration (−2H2O). M2-3 (C9H8O3) was generated from danshensu by the process of dehydration (−2H2O) and reduction (+H2). M2-4 (C10H8O4) was generated from danshensu by the process of dehydration (−2H2O) and methylation (+CH2). M2-5 (C11H15NO4) was generated from danshensu by the process of reduction (-O2, +H2) and glycine conjugation (+NH2CH2CO). M2-6 (C14H18N2O5) was generated from danshensu by the process of desaturation (-H2), reduction (-O2, +H2) and glutarnine conjugation (+C5H8N2O2). M2-7 (C14H20N2O5) was generated from danshensu by the process of reduction (-O2, +H2) and glutarnine conjugation (+C5H8N2O2).
M3 was rosmarinic acid, M3-1 (C9H8O2) was generated from 3,4-Dihydroxyphenyl-lactic acid which was fractured from rosmarinic acid by the process of dehydration (-H2O) and reduction (-O2, +H2). M3-2 (C9H6O3) was generated from 3,4-Dihydroxyphenyl-lactic acid by the process of dehydration (−2H2O). M3-3 (C9H8O3) was generated from 3,4-Dihydroxyphenyl-lactic acid by the process of desaturation (-H2) and reduction (-O2, +H2). M3-4 (C10H8O4) was generated from 3,4-Dihydroxyphenyl-lactic acid by the process of dehydration (-H2O) and Methylation (+CH2). M3-5 (C11H15NO4) was generated by the process of reduction (-O2, +H2) and glycine conjugation (+NH2CH2CO). M3-6 (C14H18N2O5) was generated from 3,4-Dihydroxyphenyl-lactic acid by the process of reduction (-O2) and Glutarnine Conjugation (+C5H8N2O2). M3-7 (C14H20N2O5) was generated from caffeic acid which was fractured from rosmarinic acid by the process of reduction (-O2, +H2) and glutarnine conjugation (+C5H8N2O2).
M4 was Salvianolic acid A, M4-1 (C9H6O3) was generated from the danshensu fractured from Salvianolic acid A by the process of dehydration (−2H2O). M4-2 (C9H8O3) was generated from danshensu by the process of desaturation (-H2) and reduction (-O2, +H2). M4-3 (C10H8O4) was generated from danshensu by the process of dehydration (-H2O) and Methylation (+CH2). M4-4 (C14H18N2O5) was generated from danshensu by the process of reduction (-O2, +H2) and Glutarnine Conjugation (+C5H8N2O2). M4-5 (C14H18N2O5) was generated from danshensu by the process of reduction (-O2) and glutarnine conjugation (+C5H8N2O2). M4-6 (C14H20N2O5) was generated from danshensu by the process of reduction (-O2, +H2) and glutarnine conjugation (+C5H8N2O2).
M5 was Aloe emodin, M5-1 (C15H14O3) was generated from Aloe Emodin by the process of reduction (−2O2, +2H2). M5-2 (C21H22O8) was generated by the process of reduction (-O2, +H2) and Glucoside Conjugation (+C6H11O6).
M6 was Rhein, M6-1 (C15H14O3) was generated from Rhein by the process of dehydration (-H2O) and reduction (−2O2, +2H2). M6-2 (C15H10O5) was generated by the process of reduction (-O2, +H2) and Oxidation (+O).
M7 was Emodin, M7-1 (C15H14O3) was generated from Emodin by the process of reduction (−2O2, +2H2). M7-2 (C15H10O5) was generated by the process of reduction (-O2, +H2) and Glucoside Conjugation (+C6H11O6).
Based on the metabolites identified above, the pathways of the seven active ingredients from SK injection were proposed, as shown in Figures 3–9. The metabolic pathways mainly concluded as reduction, dehydration and conjugation reaction.
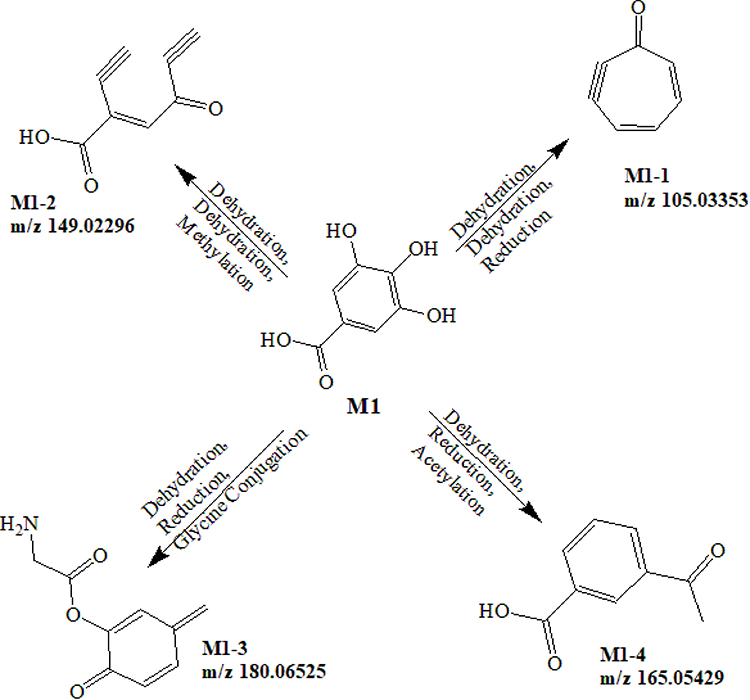 |
Figure 3 Proposed metabolic pathways of Gallic acid. |
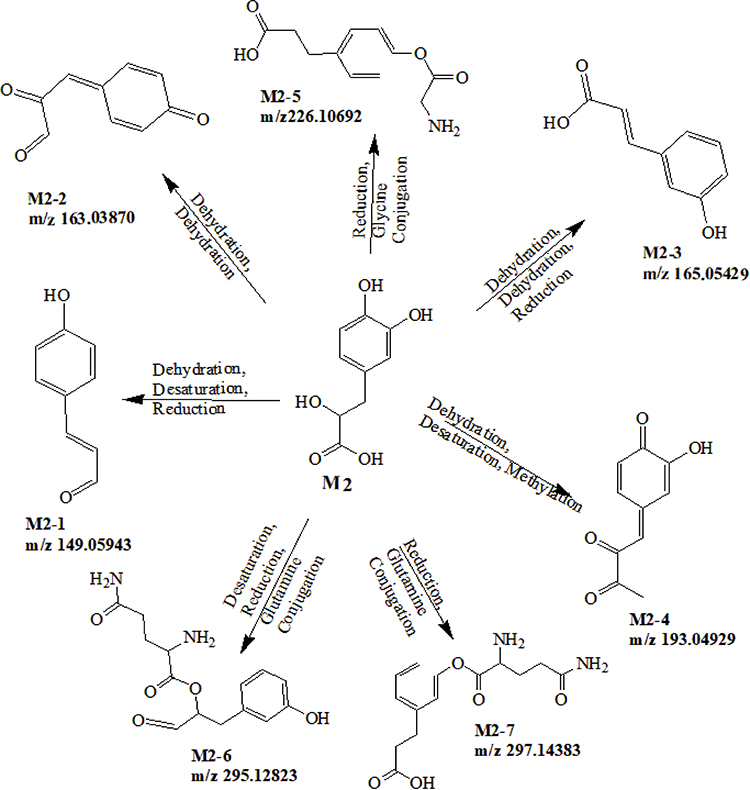 |
Figure 4 Proposed metabolic pathways of Danshensu. |
 |
Figure 5 Proposed metabolic pathways of Rosmarinic acid. |
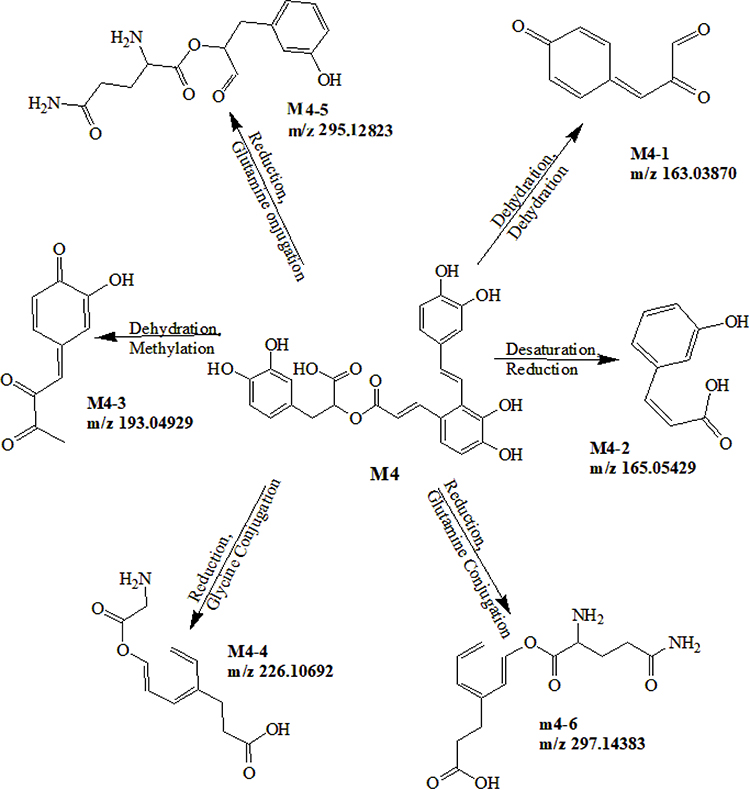 |
Figure 6 Proposed metabolic pathways of Salvianolic acid A. |
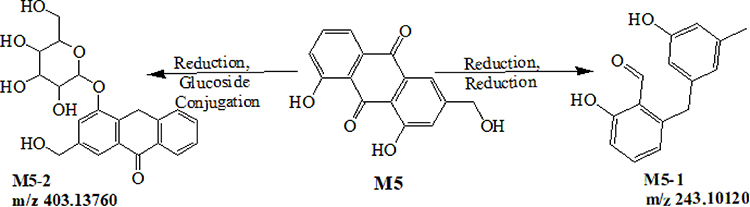 |
Figure 7 Proposed metabolic pathways of Aloe emodin. |
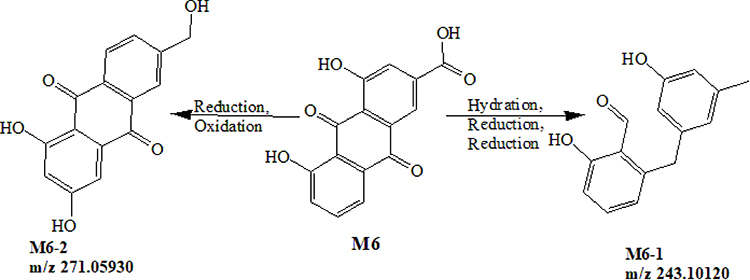 |
Figure 8 Proposed metabolic pathways of Rhein. |
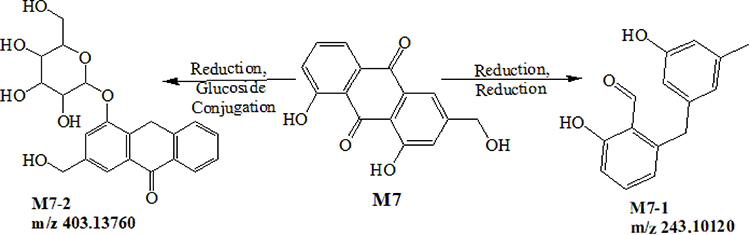 |
Figure 9 Proposed metabolic pathways of Emodin. |
In the study, the newly-developed UHPLC-MS/MS coupled UHPLC-Q-Orbitrap HRMS method was employed and showed many advantages over previously reported method: (1) the sample preparation procedures were very simple and fast; (2) the analysis process was rapid and time-saving; (3) the sensitivity (LLOQ of the current method ranged from 0.5 to 1.0 ng/mL) was higher than the previous study; (4) minor matrix effect and excellent extraction recovery; (5) the analysis method could be employed for pharmacokinetics and metabolism profiling simultaneously, and showed good practicality for other relevant mode.
It is important to note that the pharmacological mechanism had not been studied in this research. However, this study showed the phenomenon of the pharmacokinetics and metabolism profiling clearly, which provided a basis for the further research. Next, it will be planed to study the detailed pharmacological mechanism of the drug, in terms of pharmacokinetics interaction and pathological changes in the disease mode. In addition, the relationship between its pharmacokinetics and pharmacodynamics would also be explored, which may allow better and more rigorous guidance on the clinical use of the drug.
Conclusions
In this research, an effective, rapid and sensitive UHPLC-MS/MS method using carbamazepine (IS) as internal standards was successfully employed in rat plasma to investigate the pharmacokinetics of SK injection. The multiple dosages and seven active components of the drug were monitored at the same time in this study, revealing a large number of dynamic information in vivo, which was particularly practical and scientific for a comprehensive pharmacokinetics study of SK injection. What’s more, a UHPLC-Q-Orbitrap HRMS method was developed to trace and identify the metabolites of the seven ingredients from the plasma and urine, and the pathways mainly concluded as reduction, oxidization and conjugation reaction.
Nowadays, with the wide application of TCM, the occurrence rate of the adverse drug reactions becomes higher sharply and draws great attention. Therefore, actions should be done to establish a rational use strategy and ensure the security and prevent the ADR of TCM. While, an in-depth study of pharmacokinetic and metabolism profiling could not only understand the complex action of the active ingredients, but also reveal the scientific connotations of the interaction effect caused by the different compounds in Chinese herb medicine, and finally predict the efficacy and toxicity of TCM.15 As far as we know, it is the first time to report the pharmacokinetic and the metabolism profiling studies of the seven active ingredients in vivo following the intravenous administration SK. The study would also provide an important evidence for the further clinical application of SK injection and lay a foundation of further study on Chinese medicinal herbs.
Acknowledgments
This work was also supported by the Foundation of Henan Educational Committee (No. 19A320070) and Foundation of the First Affiliated Hospital of Zhengzhou University.
Disclosure
The authors declare that they have no competing interests.
References
1. Liu MY, Park J, Wu XX, et al. Shen-Kang protects 5/6 nephrectomized rats against renal injury by reducing oxidative stress through the MAPK signaling pathways. Int J Mol Med. 2015;36(4):975–984. doi:10.3892/ijmm.2015.2328
2. Zhang Y, Zhou N, Wang HY, et al. Effect of Shenkang granules on the progression of chronic renal failure in 5/6 nephrectomized rats. Exp Ther Med. 2015;9(6):2034–2042. doi:10.3892/etm.2015.2383
3. Zhi XR, Liu HT, Wu Y, et al. Simultaneous determination of 7 active constituents in Shenkang injection by UPLC-MS/MS. Chin J Pharm Anal. 2017;37(1):37–42. doi:10.16155/j.0254-1793.2017.01.01
4. Liu F, Guo SY, Chai SW, et al. Analysis on chemical constituents in Shenkang injection by UPLC-Q-TOF-MS. Drugs Clinic. 2017;32(6):975–977. doi:10.7501/j.issn.1674-5515.2017.06.003
5. Bao BH, Kang A, Zhao Y, et al. A selective HPLC-MS/MS method for quantification of SND-117 in rat plasma and its application to a pharmacokinetic study. J Chromatogr B. 2017;1052:60–65. doi:10.1016/j.jchromb.2017.03.008
6. Zhou X, Seto SW, Chang D, et al. Synergistic effects of Chinese Herbal Medicine: a comprehensive review of methodology and current research. Front Pharmacol. 2016;7:1–16. doi:10.3389/fphar.2016.00201
7. Li W, Zhou HJ, Chu Y, et al. Simultaneous determination and pharmacokinetics of danshensu, protocatechuic aldehyde, 4-hydroxy-3-methyloxyphenyl lactic acid and protocatechuic acid in human plasma by LC-MS/MS after oral administration of compound Danshen dripping pills. J Pharm Biomed Anal. 2017;145:860–864. doi:10.1016/j.jpba.2017.06.014
8. Guidance for industry, bioanalytical method validation, US Department of Health and Human Services Food and Drug Administration, Center for Drug Evaluation and Research (CDER), Center for Veterinary Medicine (CV). 2001. 4–10.
9. Liu J, Li WJ, Jiang SJ, et al. Phenolic acids and antioxidant activities of Danshen injection. Chem Nat Compd. 2014;50(1):83–87. doi:10.1007/s10600-014-0872-5
10. Fouillaud M, Venkatachalam M, Girard-Valenciennes E, et al. Anthraquinones and derivatives from marine-derived fungi: structural diversity and selected biological activities. Mar Drugs. 2016;14(4):64. doi:10.3390/md14040064
11. Lee J-H, Kim Y-G, Ryu SY, et al. Calcium-chelating alizarin and other anthraquinones inhibit biofilm formation and the hemolytic activity of Staphylococcus aureus. Sci Rep. 2016;6(1):19267. doi:10.1038/srep19267
12. Worner F, Cequier A, Bardají A, et al. Comments on the ESC guidelines for the management of acute myocardial infarction in patients presenting with ST-segment elevation. Rev Esp Cardiol. 2013;66(1):5–11. doi:10.1016/j.rec.2012.10.009
13. Tang Y, Wang M, Le X, et al. Antioxidant and cardioprotective effects of Danshensu (3- (3, 4-dihydroxyphenyl) −2-hydroxy-propanoic acid from Salvia miltiorrhiza) on isoproterenol-induced myocardial hypertrophy in rats. Phytomedicine. 2011;18(12):1024–1030. doi:10.1016/j.phymed.2011.05.007
14. Guan Y, Wu XX, Duan JL, et al. Effects and mechanism of combination of Rhein and Danshensu in the treatment of chronic kidney disease. Am J Chin Med. 2015;43(7):1381–1400. doi:10.1142/S0192415X15500780
15. Liu JX, Lin L, Zhang Y, et al. Further study of indicated pharmacokinetics of traditional Chinese medicine. Mode Tradit Chin Med Mater Med. 2012;14(3):1562–1566. doi:10.1016/S1876-3553(13)60002-2
 © 2020 The Author(s). This work is published and licensed by Dove Medical Press Limited. The full terms of this license are available at https://www.dovepress.com/terms.php and incorporate the Creative Commons Attribution - Non Commercial (unported, v3.0) License.
By accessing the work you hereby accept the Terms. Non-commercial uses of the work are permitted without any further permission from Dove Medical Press Limited, provided the work is properly attributed. For permission for commercial use of this work, please see paragraphs 4.2 and 5 of our Terms.
© 2020 The Author(s). This work is published and licensed by Dove Medical Press Limited. The full terms of this license are available at https://www.dovepress.com/terms.php and incorporate the Creative Commons Attribution - Non Commercial (unported, v3.0) License.
By accessing the work you hereby accept the Terms. Non-commercial uses of the work are permitted without any further permission from Dove Medical Press Limited, provided the work is properly attributed. For permission for commercial use of this work, please see paragraphs 4.2 and 5 of our Terms.