")
Back to Journals » Drug Design, Development and Therapy » Volume 10
Pharmacokinetic profile of defibrotide in patients with renal impairment
Authors Tocchetti P, Tudone E, Marier J, Marbury T , Zomorodi K, Eller M
Received 6 May 2016
Accepted for publication 11 June 2016
Published 16 August 2016 Volume 2016:10 Pages 2631—2641
DOI https://doi.org/10.2147/DDDT.S112181
Checked for plagiarism Yes
Review by Single anonymous peer review
Peer reviewer comments 2
Editor who approved publication: Prof. Dr. Wei Duan
Paola Tocchetti,1 Elena Tudone,2 Jean-Francois Marier,3 Thomas C Marbury,4 Katie Zomorodi,5 Mark Eller6
1Gentium, 2Clinical Operations, Gentium, Villa Guardia, Como, Italy; 3Reporting and Analysis Services, Pharsight, a Certara Company, Montreal, Quebec, Canada; 4Orlando Clinical Research Center, Orlando, FL, 5Early Development and Clinical Pharmacology, Jazz Pharmaceuticals, 6Early Drug Development, Jazz Pharmaceuticals, Palo Alto, CA, USA
Abstract: Hepatic veno-occlusive disease, also called sinusoidal obstruction syndrome (VOD/SOS), is an unpredictable, potentially life-threatening complication of hematopoietic stem cell transplant conditioning. Severe VOD/SOS, generally associated with multiorgan dysfunction (pulmonary or renal dysfunction), may be associated with >80% mortality. Defibrotide, recently approved in the US, has demonstrated efficacy treating hepatic VOD/SOS with multiorgan dysfunction. Because renal impairment is prevalent in patients with VOD/SOS, this Phase I, open-label, two-part study in adults examined the effects of hemodialysis and severe or end-stage renal disease (ESRD) on defibrotide pharmacokinetics (PK). Part 1 compared defibrotide PK during single 6.25 mg/kg doses infused with and without dialysis. Part 2 assessed defibrotide plasma PK after multiple 6.25 mg/kg doses in nondialysis-dependent subjects with severe/ESRD versus healthy matching subjects. Among six subjects enrolled in Part 1, percent ratios of least-squares mean and 90% confidence intervals (CIs) on dialysis and nondialysis days were 109.71 (CI: 97.23, 123.78) for maximum observed plasma concentration (Cmax); 108.39 (CI: 97.85, 120.07) for area under the concentration–time curve to the time of the last quantifiable plasma concentration (AUC0–t); and 109.98 (CI: 99.39, 121.70) for AUC extrapolated to infinity (AUC0–∞). These ranges were within 80%–125%, indicating no significant effect of dialysis on defibrotide exposure/clearance. In Part 2, defibrotide exposure parameters in six subjects with severe/ESRD after multiple doses (AUC0–t, 113 µg·h/mL; AUC over dosing interval, 113 µg·h/mL; Cmax, 53.8 µg/mL) were within 5%–8% of parameters after the first dose (AUC0–t, 117 µg·h/mL; AUC0–∞, 118 µg·h/mL; Cmax, 54.9 µg/mL), indicating no accumulation. Defibrotide peak and extent of exposures in those with severe/ESRD were ~35%–37% and 50%–60% higher, respectively, versus controls, following single and multiple doses. One adverse event (vomiting, possibly drug-related) was reported. These findings support defibrotide prescribing guidance stating no dose adjustment is necessary for hemodialysis or severe/ESRD.
Keywords: dialysis, end-stage renal disease, hepatic veno-occlusive disease, sinusoidal obstruction syndrome
Introduction
Hepatic veno-occlusive disease, also called sinusoidal obstruction syndrome (VOD/SOS), is a potentially fatal complication of the conditioning regimen for hematopoietic stem cell transplantation (HSCT).1,2 Clinical characteristics include hepatomegaly and/or right upper quadrant pain, ascites, otherwise unexplained weight gain, and jaundice.1–3 Diagnosis is clinical and generally made according to a set of predefined signs/symptoms: the Baltimore criteria (presence, within 21 days of HSCT, of bilirubin ≥2 mg/dL plus two or more of the following: hepatomegaly, ascites, weight gain ≥5%)4 or the modified Seattle criteria (presence, within 20 days of HSCT, of two or more of the following: bilirubin >2 mg/dL, hepatomegaly or right upper quadrant pain, and/or >2% weight gain, sometimes further modified as >5%).5 Although increased bilirubin is a component of both sets of criteria, recent data indicate that this sign may be absent in some cases of VOD/SOS, particularly in children, and in adult patients with relatively late-developing VOD/SOS.6–9
The reported prevalence of VOD/SOS following HSCT has varied widely, with a mean incidence of 13.7% (range 0%–62.3%), as determined by a meta-analysis of 135 studies.10 The same meta-analysis also found that mean VOD/SOS incidence had increased from 11.5% during the period of 1979 to 1994 to 14.6% from 1994 to 2007; although the reasons for this elevation were unclear, it may be due to increased awareness of the disease.10 In contrast, single-center studies in patients receiving HSCT during the time period since the late 1990s have reported VOD/SOS prevalence of ~6.5% to 9%, suggesting that risk reduction measures, such as decreased intensity of the conditioning regimen, may have reduced the incidence of VOD/SOS, although it remains a serious complication after HSCT.11–13
Severe VOD/SOS is typically associated with multiorgan dysfunction (MOD), including dysfunction of the kidneys, lungs, and/or heart.1,10,14 At study entry of the Phase III trial of defibrotide for patients with VOD/SOS and MOD, for example, 20% of patients in the treatment arm were dialysis-dependent.15 Severe VOD/SOS is also associated with a mortality rate >80%.10 Development of severe VOD/SOS is often unpredictable; reported incidence has ranged from 0% to 77% of all patients with VOD/SOS in specific study populations and depending on the size of the population studied.10,12,13,16 In allogeneic HSCT, up to 48% of VOD/SOS cases diagnosed by Baltimore criteria have been reported to be VOD/SOS with MOD.11
VOD/SOS pathophysiology appears to stem initially from extensive injury to sinusoidal endothelial cells, hepatocytes, and stellate cells, triggering a pathophysiologic cascade involving venular microthrombosis, fibrin deposition, ischemia, fibrogenesis, portal hypertension, and hepatorenal syndrome.1,17–19 VOD/SOS with MOD is a manifestation of hepatorenal syndrome.1
Defibrotide, a sodium salt of complex single-stranded polydeoxyribonucleotides derived from porcine intestinal mucosa by controlled depolymerization, is approved for the treatment of severe hepatic VOD/SOS following HSCT in the EU.20 As of March 30, 2016, defibrotide has been similarly approved by the US Food and Drug Administration (FDA) for the treatment of adult and pediatric patients with hepatic VOD/SOS with renal or pulmonary dysfunction following HSCT.21,22 Defibrotide is also recommended as first-line treatment of VOD/SOS by the European Society for Blood and Marrow Transplantation,19 based on clinical Phase II/III study data in HSCT patients with VOD/SOS and MOD23,24 and for VOD/SOS prevention and treatment by the British Committee for Standards in Haematology/British Society of Blood and Marrow Transplantation (strength of recommendation: strong; quality of evidence: high, except moderate for prevention in adults),14 based on clinical Phase II/III data in HSCT patients at risk for VOD/SOS.7,23,24
In vitro evidence suggests that defibrotide protects and stabilizes endothelial cells through antithrombotic, profibrinolytic, and anti-inflammatory actions, and restores the endothelial thrombo-fibrinolytic balance.25–30 Because of defibrotide’s demonstrated efficacy in the treatment of hepatic VOD/SOS with MOD (including renal dysfunction),15,23,31 evidence of tolerability in other conditions,32–34 and the high prevalence of renal impairment in patients with VOD/SOS, a two-part study was conducted to assess the pharmacokinetics (PK) of defibrotide in renal-impaired subjects. The primary trial objectives were: (Part 1) to investigate the effects of hemodialysis on defibrotide PK, chiefly whether defibrotide is cleared by dialysis, in subjects with end-stage renal disease (ESRD) receiving intermittent hemodialysis; and (Part 2) to compare the plasma PK profile of defibrotide in subjects with severe renal disease/ESRD not dependent on dialysis with that in healthy matching subjects. Secondary objectives were to evaluate the general safety and tolerability profile of defibrotide in renal-impaired subjects.
Careful evaluation of the effects of kidney disease in subjects with varying degrees of renal dysfunction, including those on hemodialysis (the most common renal replacement method used in patients with ESRD), on drug PK is recommended by the FDA35 and the European Medicines Agency.36 Impaired renal function often leads to drug accumulation, requiring dose reduction to minimize toxicity; on the other hand, dialysis may remove drugs from the body, possibly below the therapeutic plasma threshold and thus necessitating an initial or further dose adjustment.37 For patients with renal impairment treated with defibrotide, prescribing guidance in the US notes that defibrotide does not accumulate with repeated dosing,22 and European prescribing guidance states that dose adjustment is not necessary, but patients should be monitored.20
Previous PK data from an animal study showed that defibrotide administered via intravenous (IV) injection is excreted primarily in urine, without significant plasma accumulation following multiple doses.38 ESRD and dialysis may affect drug PK differently, however, and so it was important to evaluate defibrotide PK parameters in the setting of renal impairment of various degrees and of dialysis, independently of HSCT and presence of VOD/SOS, in order to isolate and assess the independent effects of these factors.
Materials and methods
Ethics
The protocol for this study received Aspire IRB approval, and the study was conducted in accordance with the Declaration of Helsinki, FDA Codes of Federal Regulations, and the International Conference on Harmonisation E6 Guidelines on Good Clinical Practice. At the screening visit prior to the initiation of any study-related procedures, subjects provided written informed consent.
Subjects
Subjects were males and females aged 18 to 80 years. Part 1 enrolled subjects with dialysis-dependent ESRD, with estimated glomerular filtration rate (eGFR) <15 mL/min/1.73 m2, calculated using the Modification of Diet in Renal Disease equation:
|
|
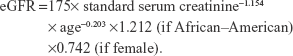
Subjects were still eligible if screening occurred on a dialysis day and eGFR was >15 mL/min/1.73 m2.
Part 2 enrolled subjects with severe renal disease/ESRD who were not dialysis-dependent, with eGFR <30 mL/min/1.73 m2 (Modification of Diet in Renal Disease equation). Part 2 also enrolled healthy matching subjects as controls who were required to have renal function within normal limits, defined as eGFR (calculated using the Modification of Diet in Renal Disease equation) ≥90 mL/min/1.73 m2 for subjects 18 to 59 years of age and ≥80 mL/min/1.73 m2 for those 60 to 80 years of age. The healthy subjects were matched to the renal-impaired subjects for age (±10 years), body mass index (±20%), sex, and race, and were required to be on a normal sodium diet as judged by the investigator.
Key exclusion criteria for both parts of the study included positive test for human immunodeficiency virus, hepatitis B surface antigen, or hepatitis C virus; clinically relevant abnormal electrocardiogram at screening; weight >136 kg (300 lb); use of aspirin dose >100 mg/day within 30 days of first dose of defibrotide (doses ≤100 mg/day allowed); history of any significant bleeding event during the 6 months prior to screening; donations of blood, plasma, or platelets, or significant blood loss (0.450 mL) within 30 days of screening; hemodynamic instability within 30 days prior to first dose of defibrotide; and use of a thrombolytic or anticoagulant therapy within 30 days of the first dose of defibrotide, with the exception of heparin for hemodialysis in Part 1 subjects. Key exclusion criteria specific to renal-impaired subjects in both parts of the study included platelet count <90,000 mm3 and changes in stable dose regimens for chronic treatments (eg, diabetes, hypertension) within 2 weeks of screening.
Study design
This was a sequential, two-part, open-label study (Figure 1). Part 1 was conducted in six subjects with ESRD who were receiving intermittent hemodialysis. Following completion of Part 1, Part 2 was conducted in six subjects with severe renal disease or ESRD who were not receiving dialysis and in six healthy matching subjects. In both parts of the study, eligible subjects were admitted to the clinical pharmacology unit the day before administration of the first dose of defibrotide (day–1; dialysis occurred prior to admission for dialysis-dependent subjects) and remained in-house 24 hours after the last dose of defibrotide (Part 1: day 5; Part 2: day 3). A safety follow-up phone call was made ~5 days after discharge (Part 1: day 10±3 days; Part 2: day 8±3 days).
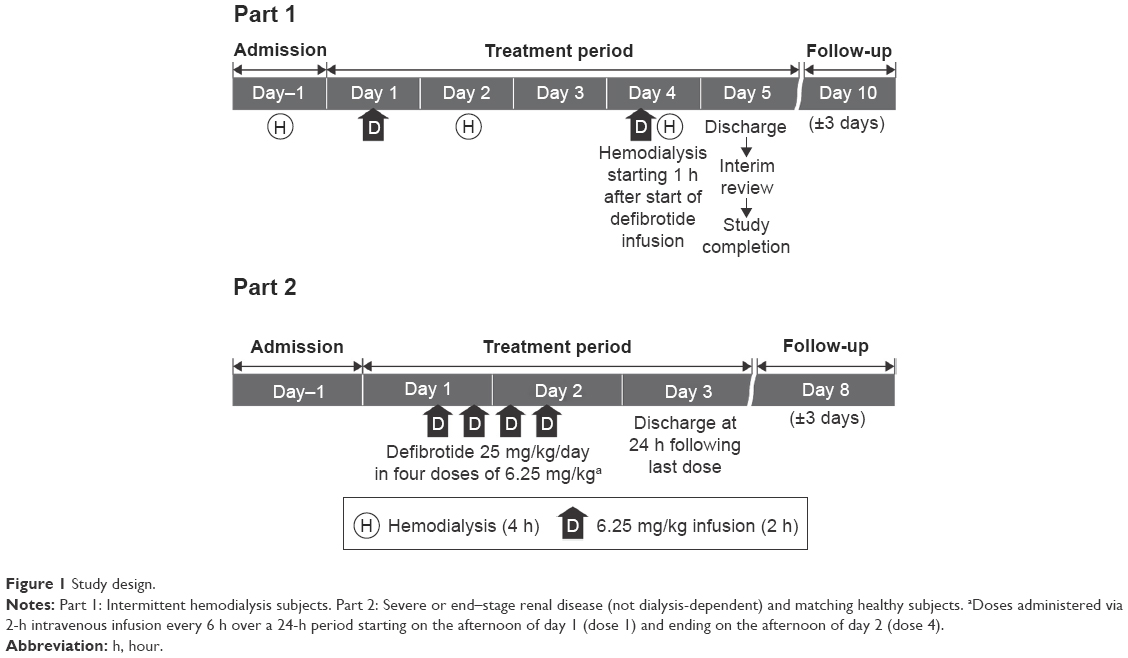 | Figure 1 Study design. |
Treatments
For Part 1, subjects were administered two doses of defibrotide 6.25 mg/kg via 2-hour (±10 minutes) IV infusion: one dose on a nondialysis day (day 1) and the other dose on a dialysis day (day 4). Hemodialysis treatments were administered for 4 hours each on days 2 and 4, using Fresenius Optiflux® F180NR dialysis filters (Fresenius Medical Care, Waltham, MA, USA); on day 4, the hemodialysis treatment began 1 hour after the start of the defibrotide 6.25 mg/kg 2-hour IV infusion and occurred over 4 hours, resulting in a 1-hour overlap between the defibrotide infusion (ie, second hour) and the hemodialysis session (ie, first hour). To prevent thrombosis, subjects received a loading dose of heparin (2,000 to 4,000 units) and an additional 500 to 1,000 units of heparin hourly through hour 3 of hemodialysis.
For Part 2, all renal-impaired and healthy matching subjects received defibrotide 25 mg/kg/day in four divided doses of 6.25 mg/kg via 2-hour (±10 minutes) IV infusion, administered every 6 hours. The four doses were administered over a 24-hour period starting on the afternoon of day 1 (dose 1) and ending on day 2 (dose 4).
Safety and tolerability parameters included monitoring of adverse events (AEs).
PK sampling collection
Plasma
For both parts of the study, blood sample collection for plasma defibrotide PK analysis was conducted at 15- to 30-minute intervals over 6-hour periods starting before, continuing through, and ending after the 2-hour defibrotide IV infusions, occurring on days 1 and 4 for Part 1, and days 1 (dose 1) and 2 (dose 4) during Part 2. Blood samples (3 mL) from a peripheral venous cannula opposite to the site of drug infusion were collected into lithium heparin Vacutainer®-type tubes and centrifuged to collect plasma. Plasma samples were stored at ~−30°C±10°C until shipment to the bioanalytical laboratory.
Dialysate
In Part 1, dialysate samples for determination of defibrotide concentrations were collected over 0.5-hour intervals during hemodialysis, with the exception of hour 4.5 after starting defibrotide (ie, 3.5 hours after starting dialysis), when none was collected. Dialysate samples were immediately separated into three aliquots of 500 μL and frozen at −80°C pending shipment to the bioanalytical site.
Urine
In Part 2, urine samples were collected in four sequential collections every 6 hours for 24 hours, with collection completed within 5 minutes prior to administration of each dose of defibrotide. Urine collection containers were refrigerated, mixed, and aliquoted into 2×10 mL tubes and frozen at −20°C pending shipment to the bioanalytical site.
PK parameters
Plasma
Both Parts 1 and 2 included plasma PK measured as area under the concentration–time curve (AUC) to the time of the last quantifiable plasma concentration (AUC0–t), AUC extrapolated to infinity (AUC0–∞), maximum observed plasma concentration (Cmax), time of Cmax, apparent terminal phase half-life (t1/2), systemic plasma clearance (CL), and volume of distribution at steady state. Part 2 also measured the AUC during the dosing interval (6 hours; AUCτ).
Dialysate
Part 1 also measured dialysate PK parameters, including the amount of defibrotide excreted in dialysate over the period from 1 hour after the start of infusion up to 6 hours (collected at half-hour intervals; AD[1–6]), the fraction of defibrotide removed by the 4-hour hemodialysis session (fD), and dialysis clearance (CLD).
Urine
Part 2 also measured urinary PK parameters, including amount of defibrotide excreted unchanged in urine over a 6-hour collection interval, fraction of defibrotide excreted unchanged in urine over a 6-hour collection interval, and renal clearance after a single dose (dose 1) and after multiple doses (dose 4).
Bioanalytical methods
Bioanalytical methods for assay of defibrotide in plasma, dialysate, and urine were validated at Eurofins ADME BIOANALYSES, Vergèze, France, following recommendations from the FDA and the European Medicines Agency.39,40 The analyses involved a fluorimetric method. The results demonstrated that the bioanalytical methods can be used to assay defibrotide in human plasma from 0.2 μg/mL (lower limit of quantification) to 10 μg/mL (upper limit of quantification) and to assay defibrotide in human urine and dialysate from 0.5 μg/mL (lower limit of quantification) to 15 μg/mL (upper limit of quantification).
Biostatistical analysis
Both parts of the study used descriptive statistics to summarize concentration data and PK parameters.
For Part 1, which assessed the effect of dialysis on defibrotide PK in subjects with ESRD, a linear effects model was performed on natural log (ln)-transformed values of defibrotide AUC0–t, AUC0–∞, and Cmax on nondialysis (day 1) and dialysis (day 4) days; the model included day as a fixed effect and measurements within subject as a repeated measure. For Part 2, assessing the difference in defibrotide PK between renal-impaired, nondialysis-dependent subjects and healthy matching subjects, a linear mixed-effects model was used to compare log-transformed PK parameters (AUC0–t, AUC0–∞, AUCτ, and Cmax) with renal function status (impaired or healthy) as a fixed effect and measurements within subject as a random effect.
Point estimates and 90% confidence intervals (CIs) for log-scale differences were exponentiated to obtain point estimates for ratios of geometric least-squares (LS) means on the original scale; renal-impaired subjects not dependent on dialysis were compared with healthy matching subjects after single and multiple doses. The ln-transformed PK parameters also were used in an analysis of variance in both parts of the study. The geometric LS means and CIs were expressed as a percentage relative to the geometric LS means of the reference treatment (for each pairwise comparison, the reference formulation was the denominator for each ratio). The intrasubject coefficient of variation was estimated using the formula  , where MSE is the estimated mean square error from analysis of variance. Inferential statistics were performed using WinNonlin® version 5.2 (Certara, L.P., Princeton, NJ, USA).
Results
All participants (Table 1) in Parts 1 and 2 completed the study.
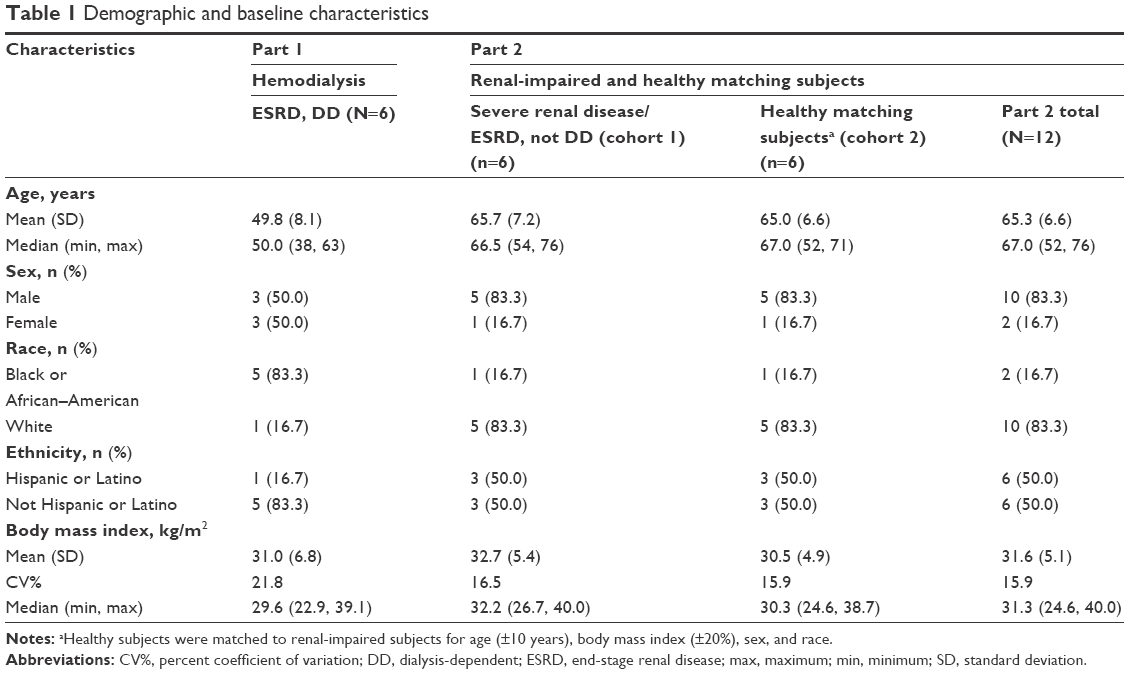 | Table 1 Demographic and baseline characteristics |
Plasma PK analyses: Part 1 – hemodialysis
Mean plasma concentration–time profiles of defibrotide following a single dose declined monoexponentially on a nondialysis day (day 1) and a dialysis day (day 4), and were similar on both days (Figure 2). Mean AUC0–t, AUC0–∞, and Cmax on a nondialysis day were within 10% of those observed on a dialysis day (Table 2). Peak defibrotide concentrations occurred at the end of infusion (median time to Cmax range, 1.78 to 1.90 hours) on both nondialysis and dialysis days.
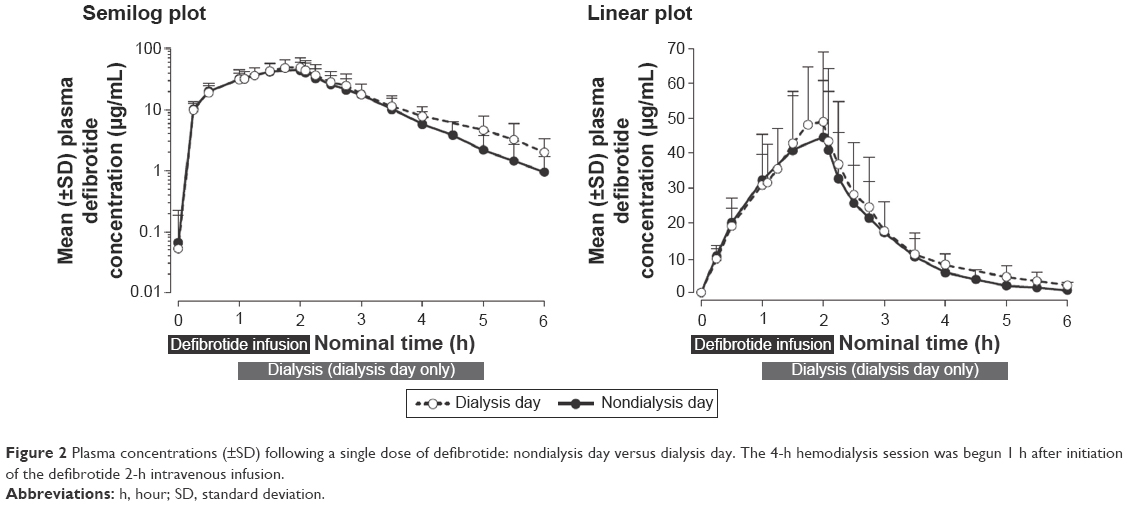 | Figure 2 Plasma concentrations (±SD) following a single dose of defibrotide: nondialysis day versus dialysis day. The 4-h hemodialysis session was begun 1 h after initiation of the defibrotide 2-h intravenous infusion. |
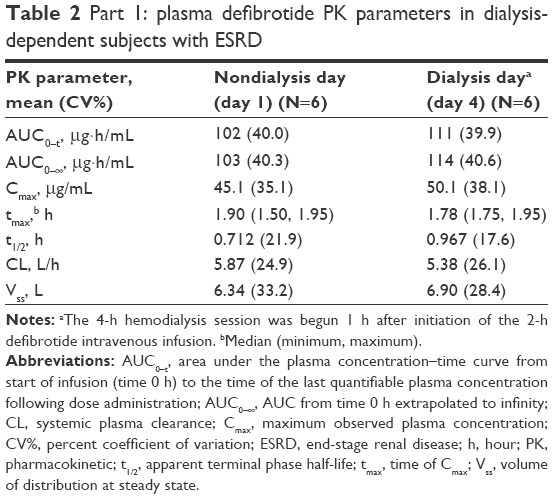 | Table 2 Part 1: plasma defibrotide PK parameters in dialysis-dependent subjects with ESRD |
Mean clearance on the nondialysis day was within 10% of that observed on the dialysis day. The analysis of variance analysis showed that the percent ratios of LS means and 90% CIs of the ln-transformed Cmax, AUC0–t, and AUC0–∞ on a dialysis day versus a nondialysis day were within the 80% to 125% range (Table 3), indicating that dialysis did not significantly affect exposure to defibrotide. All dialysate concentrations of defibrotide were below the limit of quantitation of the assay across all collection intervals, and therefore all related PK parameters (AD[1–6], fD, and CLD) were reported as zero.
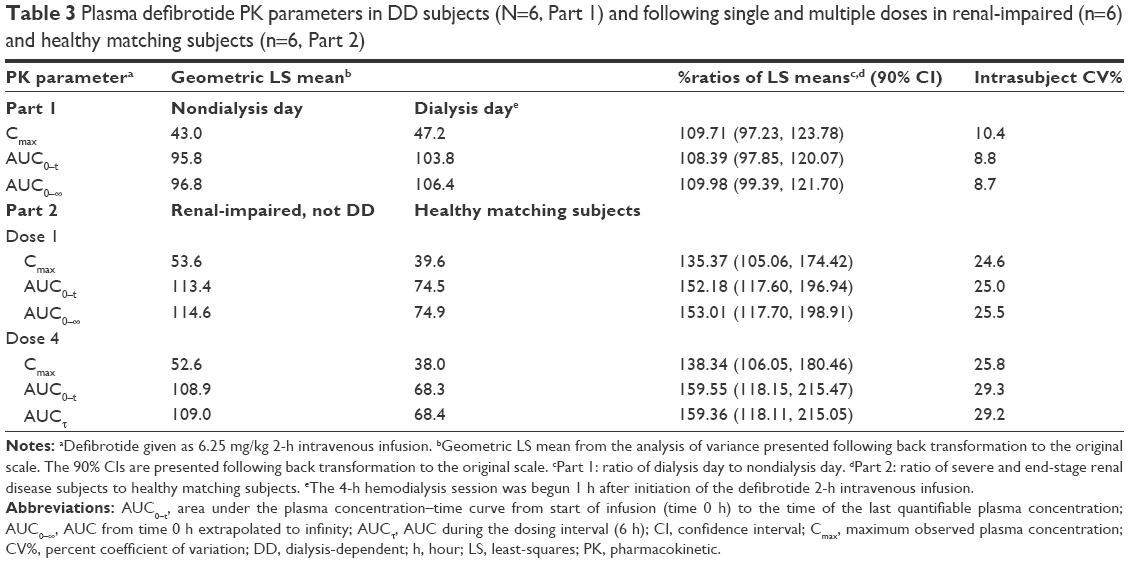 | Table 3 Plasma defibrotide PK parameters in DD subjects (N=6, Part 1) and following single and multiple doses in renal-impaired (n=6) and healthy matching subjects (n=6, Part 2) |
Plasma PK analyses: Part 2 – renal-impaired and healthy matching subjects
As in Part 1, mean defibrotide concentration levels declined in a monoexponential fashion after infusion (Figure 3). Mean plasma concentration–time profiles of defibrotide were generally higher at all time points in the renal-impaired versus healthy matching subjects.
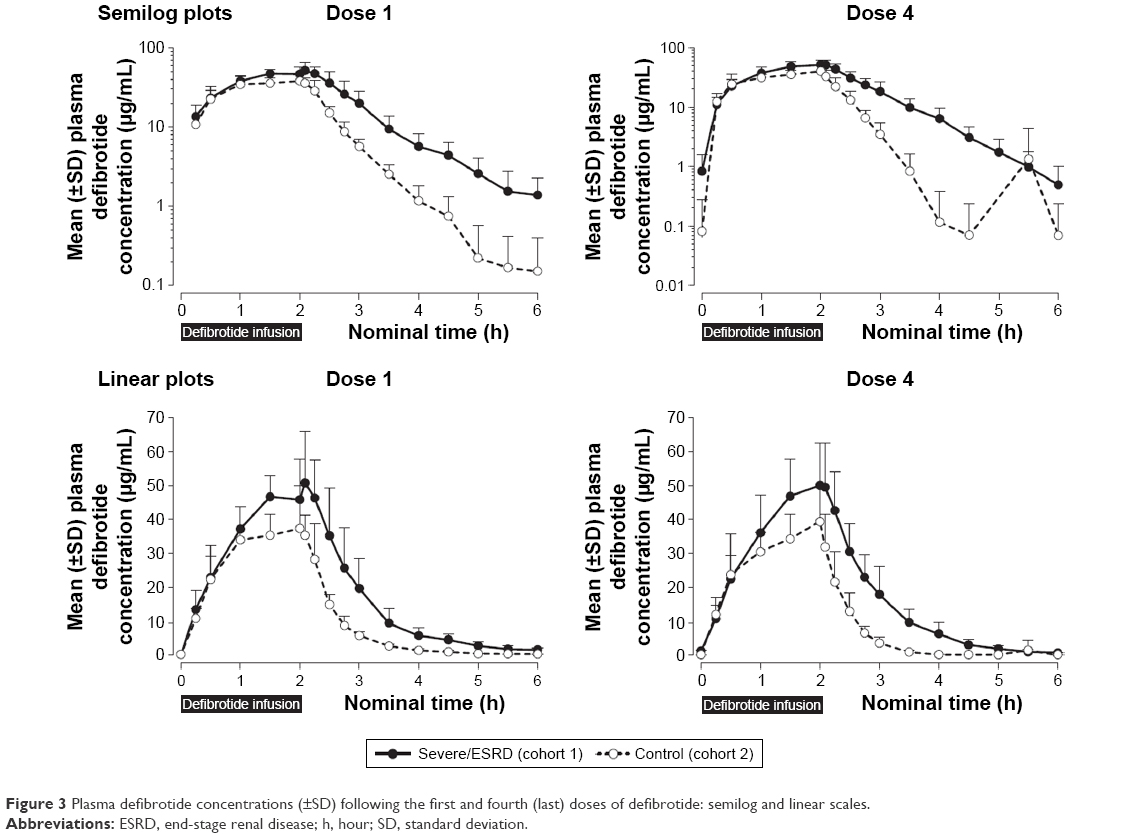 | Figure 3 Plasma defibrotide concentrations (±SD) following the first and fourth (last) doses of defibrotide: semilog and linear scales. |
Overall, defibrotide concentrations were comparable following the first and fourth administrations of defibrotide in the renal-impaired cohort as well as in the healthy cohort, suggesting no drug accumulation (Table 3). Exposure parameters (ie, AUC0–t, AUCτ at steady state, AUC0–∞, Cmax) in the renal-impaired subjects following multiple administrations of defibrotide (dose 4) were within 5%–8% of these parameters following a single dose (dose 1), and similar results were obtained in the healthy matching subjects (Table 4). Thus, there was no accumulation of defibrotide following multiple doses in either cohort.
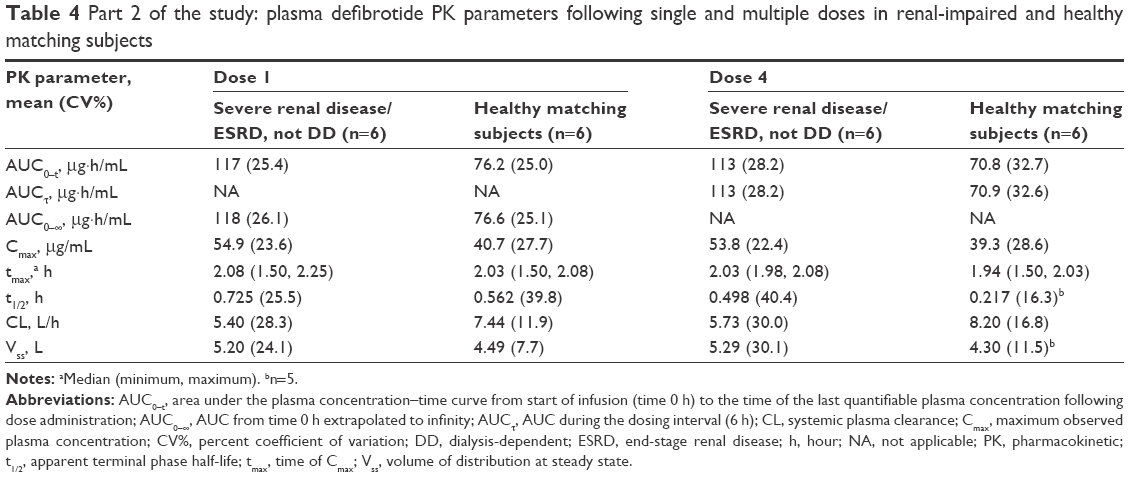 | Table 4 Part 2 of the study: plasma defibrotide PK parameters following single and multiple doses in renal-impaired and healthy matching subjects |
The percent ratios of LS means and 90% CIs of the ln-transformed exposure PK parameters (AUC0–t, AUC0–∞/AUCτ, and Cmax) between renal-impaired and healthy matching subjects were outside the 80% to 125% range following single and multiple doses (Table 3). Net defibrotide exposure (AUC) was ~50% to 60% higher, and peak exposure (Cmax) ~35% to 37% higher, in the renal-impaired versus healthy matching subjects, following single and multiple administrations of defibrotide. Among renal-impaired subjects, the mean t1/2 of the defibrotide group following single and multiple doses increased by 1.3- and 2.3-fold, respectively, compared with the corresponding value for the healthy matching subjects (Table 4).
Urinary recovery of defibrotide was higher in the healthy matching subjects (12% to 14%) compared with the renal-impaired subjects (5%) after both single and multiple doses (Table 5).
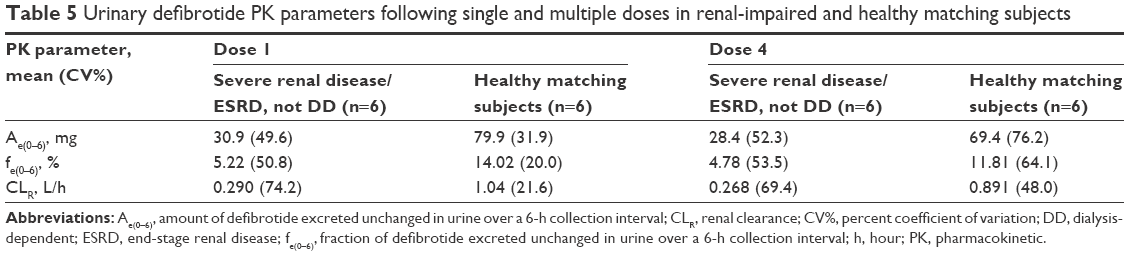 | Table 5 Urinary defibrotide PK parameters following single and multiple doses in renal-impaired and healthy matching subjects |
Safety and tolerability: Parts 1 and 2
No deaths, serious AEs, or discontinuations due to AEs occurred over the course of either part of this study. One AE was reported during Part 1: one subject (16.7%) experienced a treatment-emergent AE (TEAE) of vomiting that occurred 53 minutes after the start of the 2-hour defibrotide infusion on a nondialysis day (day 1). The TEAE was judged mild in severity, nonserious, and possibly related to defibrotide; defibrotide administration was not stopped, and the TEAE resolved with no sequelae. The subject continued in the study. There were no AEs on day 4. No TEAEs were reported during Part 2.
Discussion
This two-part trial showed overall that defibrotide PK is not affected by intermittent dialysis and that defibrotide is eliminated without accumulation following multiple doses in both renal-impaired and healthy matching subjects. Following a single standard 6.25 mg/kg dose of defibrotide, hemodialysis does not significantly affect the PK or the tolerability profile of defibrotide in renal-impaired, dialysis-dependent subjects. Defibrotide exposure in plasma was ~50% higher in renal-impaired subjects not dependent on dialysis, compared with healthy matching subjects. However, the comparisons between a single dose and multiple standard 6.25 mg/kg doses during Part 2 showed no drug accumulation in plasma in either cohort. In addition, no new safety issues were identified.
The effects of renal impairment and dialysis on drugs may vary, even among agents in the same drug class, such as angiotensin-converting enzyme inhibitors, chemotherapy drugs, and antibiotics.41–43 As a class, the PK of oligonucleotides has been assessed in animal and human studies and consistently characterized across species by rapid distribution t1/2 (≤1 hour), plasma clearance dominated by distribution into the tissues, and minor urinary excretion of the drug,44–46 such as demonstrated in this study with defibrotide. These characteristics are advantageous in the setting of renal dysfunction, a prominent feature of VOD/SOS with MOD, because they lower the risk of drug accumulation and consequent toxicity in patients with impaired urinary elimination of drugs. This reduced risk was borne out in this study by the occurrence of a single TEAE among the patients, which was judged possibly related to defibrotide.
Although this descriptive study utilized a small sample size of six subjects in each part, which may constrain the definitive characterization of the PK profile of defibrotide in patients with renal impairment, it was conducted following US and EU guidances35,36,39,40 and satisfies those requirements based on the consistency of the results.
Conclusion
After administration of a single 6.25 mg/kg dose of defibrotide in subjects receiving intermittent hemodialysis, mean AUC0–t, AUC0–∞, Cmax, and CL on nondialysis day were within 10% of those observed on dialysis day, and peak defibrotide concentrations were observed at the end of infusion for both nondialysis and dialysis days. The percent ratios of dialysis day to nondialysis day LS means and 90% CIs of AUC0–t, AUC0–∞, and Cmax were within the 80% to 125% range. Therefore, hemodialysis (using Fresenius Optiflux F180NR filters) did not have a clinically significant effect on defibrotide exposure or plasma clearance in subjects with dialysis-dependent ESRD.
Patients undergoing intermittent hemodialysis requiring defibrotide for treatment of severe hepatic VOD/SOS can continue their treatment even during hemodialysis without affecting the PK of defibrotide. Only one TEAE (vomiting, mild severity), which was possibly related to defibrotide, was reported.
In Part 2 of the study, defibrotide peak and extent of exposure were ~35% to 37% and 50% to 60% higher, respectively, in subjects with severe renal disease/ESRD not on dialysis compared with healthy matching subjects after a single dose and multiple doses. As expected, due to the short plasma t1/2 of defibrotide, the overall exposure after the daily dose of 25 mg/kg divided into four doses every 6 hours showed no accumulation, with PK parameters after multiple doses within 5% to 8% of those after the first dose. Approximately 12% to 14% and 5% of the administered dose of defibrotide is excreted in urine as defibrotide in the first 6 hours after infusion in the healthy subjects and subjects with severe renal disease/ESRD, respectively. No TEAEs were reported.
Due to the limited urinary excretion, lack of accumulation, and tolerability profile of defibrotide, differences in the PK profile in subjects with severe renal disease/ESRD compared with healthy matching subjects were consistent with US and European prescribing guidance.20,22
Acknowledgments
The authors gratefully acknowledge Maria Ballabio for her contributions to the study and interpretation of results. This study was funded by Jazz Pharmaceuticals, Inc. Under the direction of the authors, Larry Deblinger, employee of The Curry Rockefeller Group, LLC, provided medical writing assistance for this publication. Editorial assistance in formatting, proofreading, copyediting, and fact checking was also provided by The Curry Rockefeller Group, LLC. Jazz Pharmaceuticals, Inc, provided funding to The Curry Rockefeller Group, LLC, for support in writing and editing this manuscript.
Disclosure
PT was an employee of Gentium at the time the study was conducted. ET is an employee of Gentium, and in the course of employment has received stock options exercisable for, and other stock awards of, ordinary shares of Jazz Pharmaceuticals plc. J-FM and TCM are employees of research organizations that provided services to Jazz Pharmaceuticals plc. KZ and ME are employees of Jazz Pharmaceuticals plc, and in the course of their employment have received stock options exercisable for, and other stock awards of, ordinary shares of Jazz Pharmaceuticals plc. The authors report no other conflicts of interest for this work.
References
Bearman SI. The syndrome of hepatic veno-occlusive disease after marrow transplantation. Blood. 1995;85(11):3005–3020. | ||
Richardson P, Guinan E. Hepatic veno-occlusive disease following hematopoietic stem cell transplantation. Acta Haematol. 2001;106(1–2):57–68. | ||
Kumar S, DeLeve LD, Kamath PS, Tefferi A. Hepatic veno-occlusive disease (sinusoidal obstruction syndrome) after hematopoietic stem cell transplantation. Mayo Clin Proc. 2003;78(5):589–598. | ||
Jones RJ, Lee KS, Beschorner WE, et al. Venoocclusive disease of the liver following bone marrow transplantation. Transplantation. 1987;44(6):778–783. | ||
McDonald G, Hinds MS, Fisher LD, et al. Veno-occlusive disease of the liver and multiorgan failure after bone marrow transplantation: a cohort study of 355 patients. Ann Intern Med. 1993;118(4):255–267. | ||
Mohty M, Malard F, Abecassis M, et al. Sinusoidal obstruction syndrome/veno-occlusive disease: current situation and perspectives-a position statement from the European Society for Blood and Marrow Transplantation (EBMT). Bone Marrow Transplant. 2015;50(6):781–789. | ||
Corbacioglu S, Cesaro S, Faraci M, et al. Defibrotide for prophylaxis of hepatic veno-occlusive disease in paediatric haemopoietic stem-cell transplantation: an open-label, phase 3, randomized controlled trial. Lancet. 2012;379(9823):1301–1309. | ||
Naples J, Skeens M, Bajwa R. Anicteric hepatic veno-occlusive disease after hematopoietic stem cell transplantation in children [ASH abstract 5849]. Blood. 2014;124(21):5849. | ||
Myers KC, Dandoy C, El-Bietar J, Davies SM, Jodele S. Veno-occlusive disease of the liver in the absence of elevation in bilirubin in pediatric patients after hematopoietic stem cell transplantation. Biol Blood Marrow Transplant. 2015;21(2):379–381. | ||
Coppell JA, Richardson PG, Soiffer R, et al. Hepatic veno-occlusive disease following stem cell transplantation: incidence, clinical course, and outcome. Biol Blood Marrow Transplant. 2010;16(2):157–168. | ||
Carreras E, Díaz-Beyá M, Rosiñol L, Martínez C, Fernández-Avilés F, Rovira M. The incidence of veno-occlusive disease following allogeneic hematopoietic stem cell transplantation has diminished and the outcome improved over the last decade. Biol Blood Marrow Transplant. 2011;17(11):1713–1720. | ||
Kalayoglu-Besisik S, Yenerel MN, Caliskan Y, Ozturk S, Besisik F, Sargin D. Time-related changes in the incidence, severity, and clinical outcome of hepatic veno-occlusive disease in hematopoietic stem cell transplantation patients during the past 10 years. Transplant Proc. 2005;37(5):2285–2289. | ||
Tsirigotis PD, Resnick IB, Avni B, et al. Incidence and risk factors for moderate-to-severe veno-occlusive disease of the liver after allogeneic stem cell transplantation using a reduced intensity conditioning regimen. Bone Marrow Transplant. 2014;49(11):1389–1392. | ||
Dignan FL, Wynn RF, Hadzic N, et al; Haemato-oncology Task Force of the British Committee for Standards in Haematology; British Society for Blood and Marrow Transplantation. BCSH/BSBMT guideline: diagnosis and management of veno-occlusive disease (sinusoidal obstruction syndrome) following haematopoietic stem cell transplantation. Br J Haematol. 2013;163(4):444–457. | ||
Richardson PG, Riches M, Kernan NA, et al. Phase 3 trial of defibrotide for the treatment of severe veno-occlusive disease and multi-organ failure. Blood. 2016;127(13):1656–1665. | ||
Carreras E, Bertz B, Arcese W, et al. Incidence and outcome of hepatic veno-occlusive disease after blood or marrow transplantation: a prospective cohort study of the European Group for Blood and Marrow Transplantation. Blood. 1998;92(10):3599–3604. | ||
DeLeve LD, McCuskey RS, Wang X, et al. Characterization of a reproducible rat model of hepatic veno-occlusive disease. Hepatology. 1999;29(6):1779–1791. | ||
Ho VT, Linden E, Revta C, Richardson PG. Hepatic veno-occlusive disease after hematopoietic stem cell transplantation: review and update on the use of defibrotide. Semin Thromb Hemost. 2007;33(4):373–388. | ||
Carreras E. EBMT-ESH Handbook, Chapter 11. 2012. Available from: http://ebmtonline.forumservice.net/media/11/tex/content_alt/EBMT_Handbook2012_CHAP11.pdf. Accessed January 28, 2015. | ||
Defitelio. Summary of product characteristics. Available from: http://ec.europa.eu/health/documents/community-register/2015/20150112130561/anx_130561_en.pdf. Accessed April 7, 2016. | ||
US Department of Health and Human Services, Food and Drug Administration. FDA approves first treatment for rare disease in patients who receive stem cell transplant from blood or bone marrow [FDA News Release]. March 30, 2016. Available from: http://www.fda.gov/NewsEvents/Newsroom/PressAnnouncements/ucm493225.htm. Accessed March 30, 2016. | ||
Defitelio® (defibrotide sodium) [prescribing information]. Palo Alto, CA: Jazz Pharmaceuticals, Inc.; 2016. | ||
Richardson PG, Soiffer RJ, Antin JH, et al. Defibrotide for the treatment of severe hepatic veno-occlusive disease and multiorgan failure after stem cell transplantation: a multicenter, randomized, dose-finding trial. Biol Blood Marrow Transplant. 2010;16(7):1005–1017. | ||
Richardson P, Tomblyn M, Kernan N, et al. Defibrotide (DF) in the treatment of severe hepatic veno-occlusive disease (VOD) with multi-organ failure (MOF) following stem cell transplantation (SCT): results of a phase 3 study utilizing a historical control [ASH abstract 654]. Blood. 2009;114(22):654. | ||
Richardson PG, Corbacioglu S, Ho VT, et al. Drug safety evaluation of defibrotide. Expert Opin Drug Saf. 2013;12(1):123–136. | ||
Bianchi G, Barone D, Lanzarotti E, et al. Defibrotide, a single-stranded polydeoxyribonucleotide acting as an adenosine receptor agonist. Eur J Pharmacol. 1993;238(2–3):327–334. | ||
Eissner G, Multhoff G, Gerbitz A, et al. Fludarabine induces apoptosis, activation, and allogenicity in human endothelial and epithelial cells: protective effect of defibrotide. Blood. 2002;100(1):334–340. | ||
Echart C, Iacobelli M, Richardson P, et al. Pre-clinical evidence for an anti-tumor activity of defibrotide, a DNA-based, endothelium stabilizing drug [ASCO abstract 14144]. J Clin Oncol. 2007;25(Suppl18):14144. | ||
Palmer KJ, Goa KL. Defibrotide. A review of its pharmacodynamic and pharmacokinetic properties, and therapeutic use in vascular disorders. Drugs. 1993;45(2):259–294. | ||
Porta R, Calvani AB, Pescador R, Mantovani M, Prino G. Absorption through the peritoneum of the macromolecular profibrinolytic drug defibrotide in the rabbit. Semin Thromb Hemost. 1991;17(4):404–406. | ||
Richardson PG, Elias AD, Krishnan A, et al. Treatment of severe veno-occlusive disease with defibrotide: compassionate use results in response without significant toxicity in a high-risk population. Blood. 1998;92(3):737–744. | ||
Bonomini V, Vangelista A, Frascà G. A new antithrombotic agent in the treatment of acute renal failure due to hemolytic-uremic syndrome and thrombotic thrombocytopenic purpura. Nephron. 1984;37(2):144. | ||
Vangelista A, Frascà GM, Raimondi C, Liviano-D’Arcangelo G, Bonomini V. Effects of defibrotide in acute renal failure due to thrombotic microangiopathy. Haemostasis. 1986;16(Suppl 1):51–54. | ||
Frascà GM, Martello M, Sestigiani E, Canova C, Vangelista A, Bonomini V. Effects of defibrotide treatment in patients with IgA nephropathy and reduced renal function. Nephrol Dial Transplant. 1996;11(2):392–393. | ||
US Department of Health and Human Services, Food and Drug Administration. Guidance for industry: pharmacokinetics in patients with impaired renal function – study design, data analysis, and impact on dosing and labeling, draft guidance [March 2010]. Available from: http://www.fda.gov/downloads/Drugs/GuidanceComplianceRegulatoryInformation/Guidances/UCM204959.pdf. Accessed March 16, 2015. | ||
European Medicines Agency. Note for guidance on the evaluation of the pharmacokinetics of medicinal products in patients with impaired renal function [2004]. Available from: http://www.emea.europa.eu/pdfs/human/ewp/022502en.pdf. Accessed February 23, 2015. | ||
Verbeeck RK, Musuamba FT. Pharmacokinetics and dosage adjustment in patients with renal dysfunction. Eur J Clin Pharmacol. 2009;65(8):757–773. | ||
Fisher J, Johnston AM, Holland TK, et al. Pharmacokinetics, absorption, distribution and disposition of [125I]-defibrotide following intravenous or oral administration in the rat. Thromb Res. 1993;70(1):77–90. | ||
US Department of Health and Human Services, Food and Drug Administration. Guidance for industry: bioanalytical method validation [May 2001]. Available from: http://www.fda.gov/downloads/Drugs/Guidances/ucm070107.pdf. Accessed April 2, 2015. | ||
European Medicines Agency. Guideline on Bioanalytical Method Validation; 2011. Available from: http://www.ema.europa.eu/docs/en_GB/document_library/Scientific_guideline/2011/08/WC500109686.pdf. Accessed May 19, 2015. | ||
Song JC, White CM. Clinical pharmacokinetics and selective pharmacodynamics of new angiotensin converting enzyme inhibitors: an update. Clin Pharmacokinet. 2002;41(3):207–224. | ||
Janus N, Launay-Vacher V, Deray G, Thyss A, Thariat J. [Management of chemotherapy in hemodialysis patients]. Bull Cancer. 2012;99(3):371–380. | ||
Matuszkiewicz-Rowińska J, Małyszko J, Wojtaszek E, Kulicki P. Dosing of antibiotics in critically ill patients: are we left to wander in the dark? Pol Arch Med Wewn. 2012;122(12):630–640. | ||
Yu RZ, Geary RS, Levin AA. Pharmacokinetics and pharmacodynamics of antisense oligonucleotides. In: Meibohm B, editor. Pharmacokinetics and Pharmacodynamics of Biotech Drugs: Principles and Case Studies in Drug Development. Weinheim, Germany: Wiley-VCH Verlag GmbH & Co. KGaA; 2006:93–115. | ||
Geary RS, Yu RZ, Levin AA. Pharmacokinetics of phosphorothioate antisense oligodeoxynucleotides. Curr Opin Investig Drugs. 2001;2(4):562–573. | ||
Geary RS. Antisense oligonucleotide pharmacokinetics and metabolism. Expert Opin Drug Metab Toxicol. 2009;5(4):381–391. |
 © 2016 The Author(s). This work is published and licensed by Dove Medical Press Limited. The full terms of this license are available at https://www.dovepress.com/terms.php and incorporate the Creative Commons Attribution - Non Commercial (unported, v3.0) License.
By accessing the work you hereby accept the Terms. Non-commercial uses of the work are permitted without any further permission from Dove Medical Press Limited, provided the work is properly attributed. For permission for commercial use of this work, please see paragraphs 4.2 and 5 of our Terms.
© 2016 The Author(s). This work is published and licensed by Dove Medical Press Limited. The full terms of this license are available at https://www.dovepress.com/terms.php and incorporate the Creative Commons Attribution - Non Commercial (unported, v3.0) License.
By accessing the work you hereby accept the Terms. Non-commercial uses of the work are permitted without any further permission from Dove Medical Press Limited, provided the work is properly attributed. For permission for commercial use of this work, please see paragraphs 4.2 and 5 of our Terms.