")
Back to Journals » Drug Design, Development and Therapy » Volume 10
Pharmacokinetic and pharmacodynamic interactions between metformin and a novel dipeptidyl peptidase-4 inhibitor, evogliptin, in healthy subjects
Authors Rhee S, Choi Y, Lee S , Oh J , Kim S, Yoon SH, Cho J , Yu K
Received 16 April 2016
Accepted for publication 20 May 2016
Published 10 August 2016 Volume 2016:10 Pages 2525—2534
DOI https://doi.org/10.2147/DDDT.S110712
Checked for plagiarism Yes
Review by Single anonymous peer review
Peer reviewer comments 2
Editor who approved publication: Prof. Dr. Wei Duan
Su-jin Rhee,1,* YoonJung Choi,1,* SeungHwan Lee,1,2 Jaeseong Oh,1 Sung-Jin Kim,3 Seo Hyun Yoon,1 Joo-Youn Cho,1 Kyung-Sang Yu1
1Department of Clinical Pharmacology and Therapeutics, Seoul National University Hospital, Seoul National University College of Medicine, Seoul, Republic of Korea; 2Clinical Trials Center, Seoul National University Hospital, Seoul, Republic of Korea; 3Department of Clinical Development, Dong-A ST Co., Ltd., Seoul, Republic of Korea
*These authors contributed equally to this work
Abstract: Evogliptin is a newly developed dipeptidyl peptidase-4 (DPP-4) inhibitor, which is expected to be combined with metformin for treating type 2 diabetes mellitus. We investigated the potential pharmacokinetic and pharmacodynamic interactions between evogliptin and metformin. A randomized, open-label, multiple-dose, six-sequence, three-period crossover study was conducted in 36 healthy male subjects. All subjects received three treatments, separated by 7-day washout intervals: evogliptin, 5 mg od for 7 days (EVO); metformin IR, 1,000 mg bid for 7 days (MET); and the combination of EVO and MET (EVO + MET). After the last dose in a period, serial blood samples were collected for 24 hours for pharmacokinetic assessments. During steady state, serial blood samples were collected for 2 hours after an oral glucose tolerance test, and DPP-4, active glucagon-like peptide-1, glucose, glucagon, insulin, and C-peptide were measured to assess pharmacodynamic properties. EVO + MET and EVO showed similar steady state maximum concentration and area under the concentration–time curve at steady state values for evogliptin; the geometric mean ratios (90% confidence interval) were 1.06 (1.01–1.12) and 1.02 (0.99–1.06), respectively. EVO + MET slightly reduced steady state maximum concentration and area under the concentration–time curve at steady state values for metformin compared to MET, with geometric mean ratios (90% confidence interval) of 0.84 (0.79–0.89) and 0.94 (0.89–0.98), respectively. EVO + MET and EVO had similar DPP-4 inhibition efficacy, but EVO + MET increased active glucagon-like peptide-1 and reduced glucose to larger extents than either EVO or MET alone. Our results suggested that EVO+MET could provide therapeutic benefits without clinically significant pharmacokinetic interactions. Thus, the EVO + MET combination is a promising option for treating type 2 diabetes mellitus.
Keywords: type 2 diabetes, drug interaction, DA-1229, DPP-4 inhibitor, OGTT
Introduction
Type 2 diabetes mellitus (DM) is a chronic disorder. DM arises due to insulin insufficiency, a condition characterized by increasing insulin resistance and reduced insulin secretion. In patients with type 2 diabetes, the optimal medical care includes controlling blood glucose to a near-normal level.1 To this end, monotherapy with an oral antidiabetic drug (eg, metformin) is recommended as the first-line therapy. However, the initial monotherapy often fails to achieve appropriate glycemic control; thus, a second agent is typically added to the initial monotherapy.2
For over 50 years, metformin has been the most common first-line treatment for type 2 DM worldwide.3 Metformin works through the liver by suppressing hepatic glucose production, consistent with reducing blood glucose levels. This effect increases insulin sensitivity in patients with insulin resistance.4 The primary benefit of metformin treatment is a reduction in all-cause mortality, even in overweight patients with type 2 DM.5
Dipeptidyl peptidase-4 (DPP-4) inhibitors are an emerging new approach in the treatment of type 2 DM.6 DPP-4 inhibitors increase the production of incretin hormones (eg, glucose-dependent insulinotropic polypeptide and glucagon-like peptide-1 [GLP-1]). The incretins increase insulin secretion and, thus, decrease blood glucose levels after a meal.7 In accordance with the American Diabetes Association recommendations, DPP-4 inhibitors should be used in combination with metformin for patients who exhibit inadequate control with metformin monotherapy.8,9
Evogliptin (DA-1229) is a newly developed DPP-4 inhibitor for the treatment of type 2 DM. In a first-in-human study, evogliptin was well tolerated and showed dose proportional pharmacokinetics (doses between 1.25 and 60 mg) with a long half-life (≥30 hours) after a single administration.10 In terms of efficacy, a monotherapy of evogliptin (5 mg dose daily for 12 weeks) significantly reduced the mean HbA1c by 0.66% point, and improved oral glucose tolerance test (OGTT) results and β-cell function compared to the placebo in patients with type 2 DM who exhibited inadequate glycemic control with diet and exercise alone.11 Recently, a once daily dose of evogliptin (5 mg) was approved in the Republic of Korea (October 2015) for the treatment of patients with type 2 DM.
The coadministration of a DPP-4 inhibitor and metformin comprises an effective treatment for type 2 DM due to their complementary mechanisms of action.12 In a previous study, a DPP-4 inhibitor combined with metformin resulted in increased glycemic control in patients with type 2 DM who exhibited inadequate improvement in glycemic control with metformin alone.13 Therefore, evogliptin is likely to be used as an add-on treatment in combination with metformin, which is also consistent with the American Diabetes Association recommendations. However, we lack information about potential pharmacokinetic and pharmacodynamic drug–drug interactions between evogliptin and metformin.
The objectives of the present study were to evaluate the pharmacokinetic and pharmacodynamic profiles of coadministered evogliptin and metformin and compare them with profiles of each drug alone, at steady state. To this end, we conducted a multiple-dosing drug interaction study of coadministered evogliptin and metformin in healthy volunteers.
Methods
Study design
The present study was designed as a randomized, open-label, multiple-dose, three-period crossover study, with three treatments delivered in six different sequences. This study was conducted in accordance with the Declaration of Helsinki and with the Korean Good Clinical Practice guidelines. The study protocol was reviewed and approved by the Institutional Review Board of Seoul National University Hospital (ClinicalTrials.gov registry number: NCT 01941199, Institutional Review Board number: 1304-049-480).
Healthy male volunteers were eligible for the study if they were 20–45 years of age, had a body mass index of 18–27 kg/m2, and had no clinically significant abnormalities at screening, based on a medical history, physical examination, and clinical laboratory tests. Subjects were excluded when a clinical condition was detected that might have affected the pharmacokinetics of the study drugs. Subjects with a family history of diabetes were also excluded from the study. Every subject gave written informed consent before any study-related procedure was performed.
A total of 36 male subjects were enrolled and randomized into one of six treatment sequences (Figure 1). Assuming the highest intra-subject variability of 29% for both evogliptin and metformin,14,15 a sample size ≥30 was estimated to have a power ≥80% with a 5% type I error to detect a 20% difference in the pharmacokinetic parameters (steady state maximum concentration [Cmax,ss] and area under the concentration–time curve at steady state [AUCτ,ss]) of evogliptin and metformin. Each 7-day treatment period was separated by a washout interval of 7 days or more. The three crossover treatments were: evogliptin, 5 mg od, for 7 days (EVO); metformin IR, 1,000 mg bid, for 7 days (MET); and coadministration of evogliptin, 5 mg od, and metformin, 1,000 mg bid, for 7 days (EVO + MET). The study drugs were orally administered under fasted conditions, with 240 mL of water.
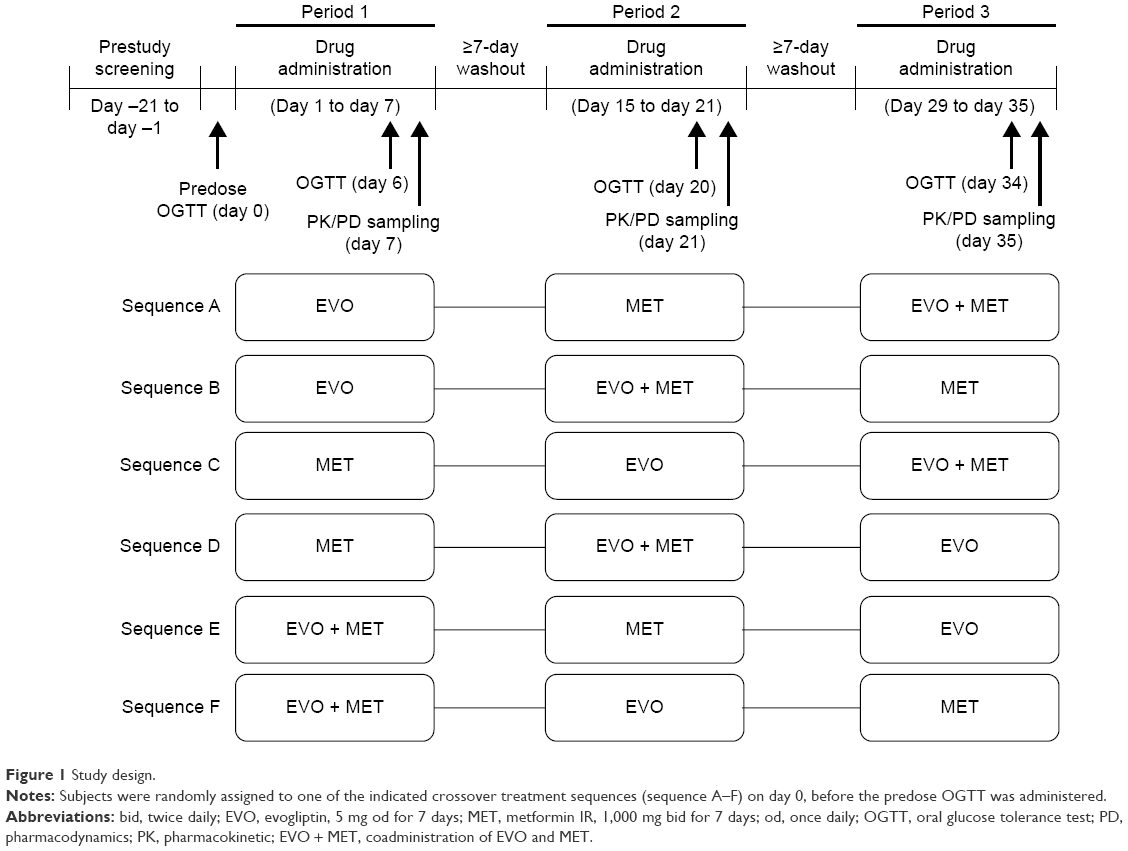 | Figure 1 Study design. |
For pharmacokinetic evaluations of evogliptin and metformin, serial blood and urine samples were collected over a 24-hour period, starting after the last dose in each treatment period. Serial blood samples were collected at 0 (predose), 1, 2, 3, 4, 5, 6, 7, 8, 10, 12, 15, and 24 hours postdose, for evogliptin, and at 0 (predose), 0.5, 1, 1.5, 2, 3, 4, 5, 6, 8, 12, and 24 hours postdose for metformin. In addition, to ensure that steady state had been achieved for both evogliptin and metformin, predose blood samples were obtained on days 4, 5, 6, and 7 (ie, the last 4 days) of each treatment period.
For pharmacodynamic evaluations, we measured blood DPP-4 activity, active GLP-1, glucose, glucagon, insulin, and C-peptide levels before and after treatment. Serial blood samples were collected for analysis of DPP-4 activity in plasma before the first dosing (baseline) and at 0 (predose), 1, 2, 3, 4, 5, 6, 8, 12, and 24 hours after the last dosing (only for EVO and EVO + MET). For analysis of active GLP-1, glucagon, insulin, and C-peptide levels in plasma and glucose levels in serum, serial blood samples were collected for 2 hours during an OGTT (75 g of glucose). The OGTT tests were conducted before the first dosing (baseline) and 2 hours after dosing on the sixth dosing day in each treatment period. The blood samples were collected at 0 (pre-OGTT), 0.25, 0.5, 1, 1.5, and 2 hours post-OGTT.
Pharmacokinetic assessment
Plasma and urine concentrations of evogliptin and metformin were determined with a validated liquid chromatography, tandem mass spectrometry method. Briefly, two internal standards were used for quantitation: sitagliptin for quantifying evogliptin and phenformin for quantifying metformin. The mobile phase consisted of 5 mM ammonium formate buffer and acetonitrile. Evogliptin and sitagliptin were separated on a Zorbax extend-C18 column (50×2.1 mm, 1.8 μm; Agilent Technologies, Santa Clara, CA, USA). Metformin and phenformin were separated on a Kinetex HILIC column (50×2.1 mm, 5 μm; Phenomenex, Torrance, CA, USA). For plasma samples, the calibration curves were linear over the range of 0.5–125 ng/mL for evogliptin and 10–5,000 ng/mL for metformin (r2≥0.9909 and r2≥0.9971, respectively). The intra- and inter-day precisions of the plasma quality control (QC) samples for evogliptin were always <7.476%, and the accuracies were within the ranges of 90.01%–96.18% and 89.74%–99.42%, respectively. The intra- and inter-day precisions of the plasma QC samples for metformin were always <7.954%, and the accuracies were within the ranges of 93.28%–102.4% and 95.55%–105.1%, respectively. For urine samples, linear calibration curves were constructed over the range of 100–5,000 ng/mL for evogliptin and 100–25,000 ng/mL for metformin (r2≥0.9940 and r2≥0.9969, respectively). The intra- and inter-day precisions of the urine QC samples for evogliptin were always <3.657%, and the accuracies were within the ranges of 89.78%–117.5% and 92.39%–113.7%, respectively. The intra- and inter-day precisions of the urine QC samples for metformin were always <7.610%, and the accuracies were within the ranges of 92.37%–104.8% and 93.63%–99.24%, respectively.
The individual steady state pharmacokinetic parameters for each treatment group were calculated with the noncompartmental method provided in Phoenix WinNonlin® software (Version 6.3; Certara, St Louis, MO, USA). The Cmax,ss and the corresponding time (Tmax) for evogliptin and metformin were determined, by observation, from the plasma concentration–time data. For each dosing interval, the AUCτ,ss was calculated with the linear trapezoidal method, for ascending concentrations, and with the log trapezoidal method, for descending concentrations. The dosing interval was 24 hours for evogliptin and 12 hours for metformin. The apparent clearance at steady state (CLss/F) was defined as the quotient of the dose administered divided by the AUCτ,ss. The fraction of dose that was excreted unaltered into the urine within a dosing interval (feτ,ss) was defined as the quotient of the total quantity of drug excreted in urine during a dosing interval divided by the dose administered. Steady state renal clearance (CLR,ss) was defined as the quotient of the quantity of drug that was excreted unaltered into the urine over 24 hours divided by the AUC within the same time interval.
Pharmacodynamic assessment
To determine DPP-4 activity, we used a continuous spectrophotometric assay with the substrate, Gly-Pro-pNA (Bachem, Bubendorf, Switzerland).16 The intra- and inter-assay precisions were 1.9%–8.3% and 3.5%–5.5%, respectively. The measurements of plasma DPP-4 activity were expressed as the percentage change from baseline DPP-4 activity, which was determined before the first dosing. We quantified the active GLP-1, glucose, glucagon, insulin, and C-peptide levels as previously described.15
The individual pharmacodynamic parameters for each treatment group were calculated with the noncompartmental method. For DPP-4 activity measurements, we calculated the area under the effect–time curve over the dosing interval at steady state (AUECτ,ss) and the maximum (inhibitory) effect on DPP-4 activity at steady state (Emax,ss). These were measured both before (baseline) and after treatment with EVO and EVO + MET. For GLP-1, glucose, glucagon, insulin, and C-peptide measurements, we calculated the areas under the concentration–time curves (AUCs) over the dosing interval. These were measured before (baseline) and after treatment with EVO, MET, and EVO + MET. We used the linear trapezoidal method to calculate the AUECτ,ss and the AUCs. The observed values were used to calculate the Emax,ss.
Safety assessment
Safety was assessed throughout the study, based on physical examinations, vital signs, 12-lead electrocardiograms, and clinical laboratory tests. Any adverse event (AE) reported by the subjects was recorded throughout the entire study period, and the investigators determined its relationship to the treatment.
Statistical analysis
Descriptive statistics were used to summarize the baseline demographics, pharmacokinetic parameters, and pharmacodynamic parameters of evogliptin and metformin. To assess the pharmacokinetic and pharmacodynamic interactions between evogliptin and metformin, we derived the geometric mean ratios (GMRs) and their 90% confidence intervals (CIs) from the natural logarithmic-transformed pharmacokinetic parameters (Cmax,ss and AUCτ,ss of evogliptin and metformin) and pharmacodynamic parameters (AUECτ,ss and Emax,ss for DPP-4 activity) with a linear mixed model. In this model, treatment, period, and sequence were fixed effects, and the sequence assignment was a random effect. We employed an analysis of variance with Tukey’s post hoc test at alpha level of 0.05 to compare the post-OGTT AUCs of active GLP-1, glucose, insulin, C-peptide, and glucagon between treatment groups. All statistical analysis were performed with IBM SPSS Statistics software Version 21.0 (SPSS Incorporated, Chicago, IL, USA).
Results
Demographics
A total of 36 healthy male subjects were enrolled. The mean age, height, and body weight were (mean ± standard deviation) 26.9±5.9 years, 173.5±4.1 cm, and 68.0±7.1 kg, respectively. During the second period of the study, three subjects dropped out; two subjects withdrew consent and one subject discontinued, due to a major protocol violation (concomitant medication). Thus, 33 subjects completed the study. The dropouts were removed from the pharmacokinetic and pharmacodynamic analysis. However, the safety assessment included all 36 subjects because all were administered at least a single dose of the study drug.
Pharmacokinetic results
At the end of each 7-day EVO and/or MET treatment, steady state had been satisfactorily achieved. Steady state was confirmed by examining daily drug concentrations in predose blood samples. After the fourth dosing day, the concentrations were similar each day for both evogliptin and metformin. The steady state pharmacokinetic profile of evogliptin was comparable between EVO and EVO + MET (Figure 2). Consequently, the GMRs (EVO + MET to EVO) were close to unity for the Cmax,ss and AUCτ,ss of evogliptin, and their 90% CIs fell entirely within the conventional bioequivalence range of 0.80–1.25.17 In addition, the other pharmacokinetic parameters for evogliptin, Tmax,ss, CLss/F, and CLR,ss, were also comparable between EVO and EVO + MET (Table 1). The steady state pharmacokinetic profiles of metformin showed a slight decrease in Cmax,ss for EVO + MET compared to that for MET (Figure 2). Consequently, the GMR and 90% CI (EVO + MET to MET) for the Cmax,ss was close to the lower range of the commonly accepted bioequivalence criteria (Table 1). However, the GMR and 90% CI for the AUCτ,ss of metformin were within the range of the conventional bioequivalence criteria. The other pharmacokinetic parameters, including Tmax,ss and CLR,ss, were similar between MET and EVO + MET, but the CLss/F was slightly increased for EVO + MET compared to MET (Table 1).
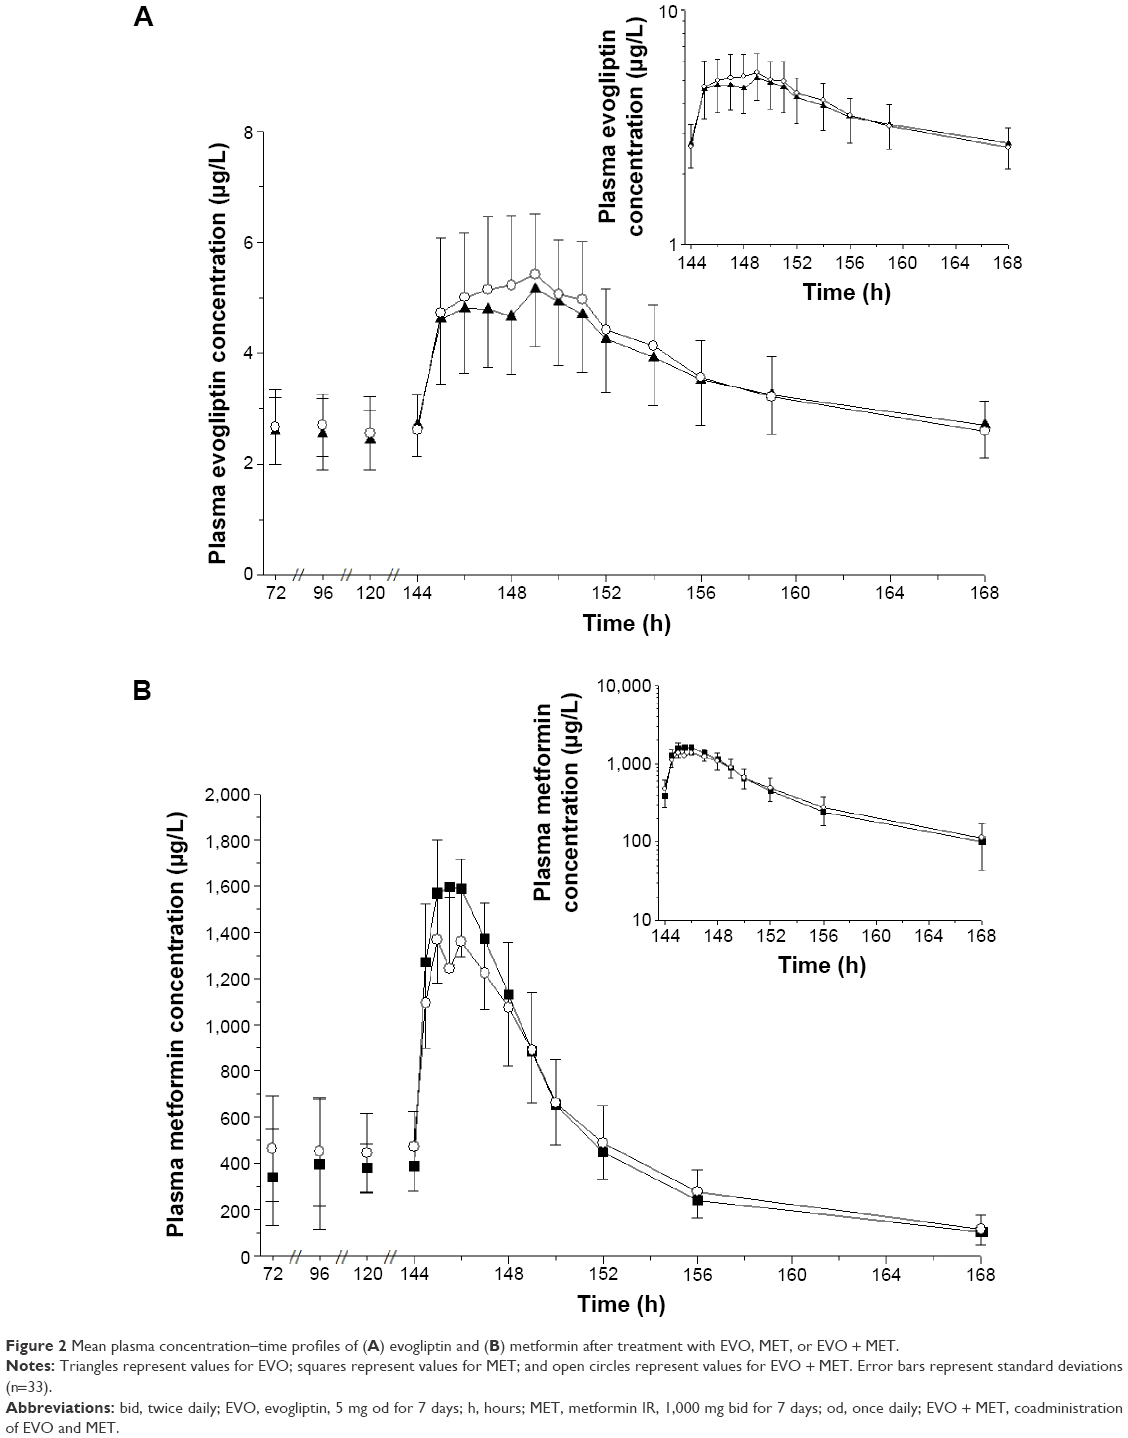 | Figure 2 Mean plasma concentration–time profiles of (A) evogliptin and (B) metformin after treatment with EVO, MET, or EVO + MET. |
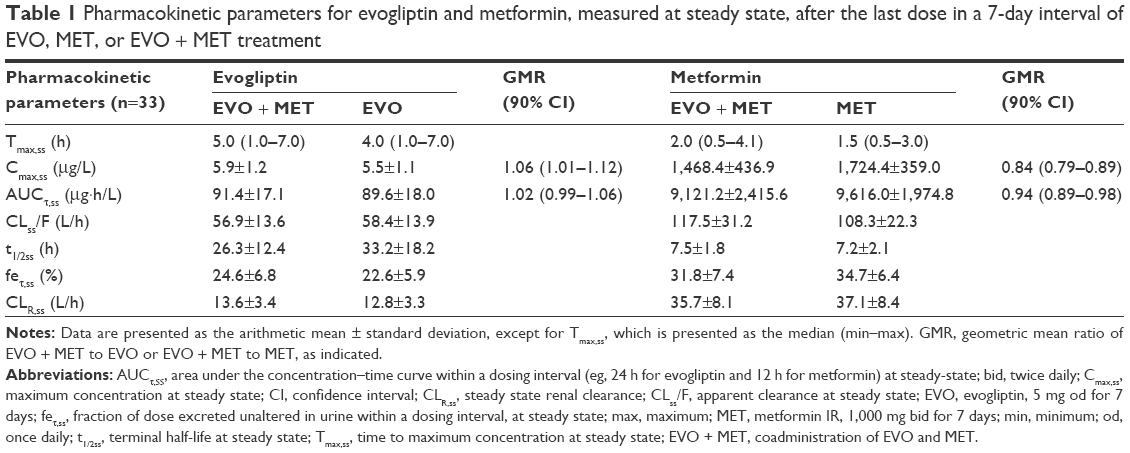 | Table 1 Pharmacokinetic parameters for evogliptin and metformin, measured at steady state, after the last dose in a 7-day interval of EVO, MET, or EVO + MET treatment |
Pharmacodynamic results
The inhibitory effect of evogliptin on DPP-4 activity was very similar between EVO and EVO + MET. In fact, the time courses of the percentage inhibition of DPP-4 activity compared to baseline were nearly superimposable between EVO and EVO + MET (Figure 3). Moreover, there were no significant differences in Emax,ss or AUECτ,ss; thus, the corresponding GMRs (EVO + MET to EVO) were close to 1.00. Furthermore, EVO and EVO + MET provided similar maximal (~90%) inhibition of DPP-4 activity, and at least 80% inhibition of DPP-4 activity was sustained for ~24 hours (Table 2).
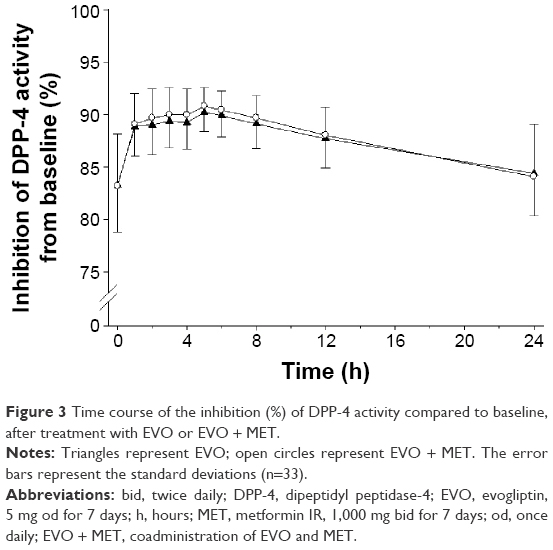 | Figure 3 Time course of the inhibition (%) of DPP-4 activity compared to baseline, after treatment with EVO or EVO + MET. |
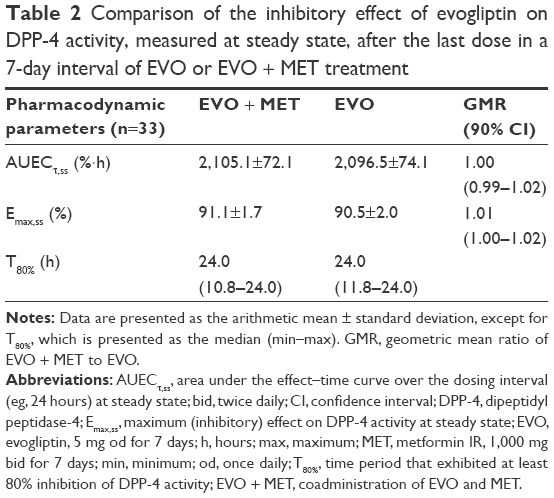 | Table 2 Comparison of the inhibitory effect of evogliptin on DPP-4 activity, measured at steady state, after the last dose in a 7-day interval of EVO or EVO + MET treatment |
For the different treatments, the 2-hour concentration–time profiles during the OGTT for active GLP-1, glucose, glucagon, insulin, and C-peptide were similar in direction, but different in the extent of change (Figure 4). The AUCs of active GLP-1 during the OGTT for EVO, MET, and EVO + MET were ~2.21-, 1.76-, and 3.80-fold greater than baseline, respectively. However, the AUC of active GLP-1 for EVO + MET was significantly greater than those for EVO and MET (by ~1.70- and 2.23-fold, respectively). Additionally, the AUCs for glucose during the OGTT for EVO, MET, and EVO + MET were significantly smaller than baseline, by ~0.87-, 0.87-, and 0.79-fold, respectively. However, the AUC of glucose for EVO + MET was significantly smaller than those for EVO and MET (by ~0.90- and 0.92-fold, respectively). On the other hand, the AUCs for glucagon during the OGTT were not significantly different from baseline for all three treatments. However, the AUC of glucagon for EVO + MET was significantly greater than that for EVO (~1.22-fold). Finally, the AUCs of both insulin and C-peptide during the OGTT were significantly reduced compared to baseline after all three treatments. These AUCs were not significantly different among EVO, MET, and EVO + MET treatments (Table 3).
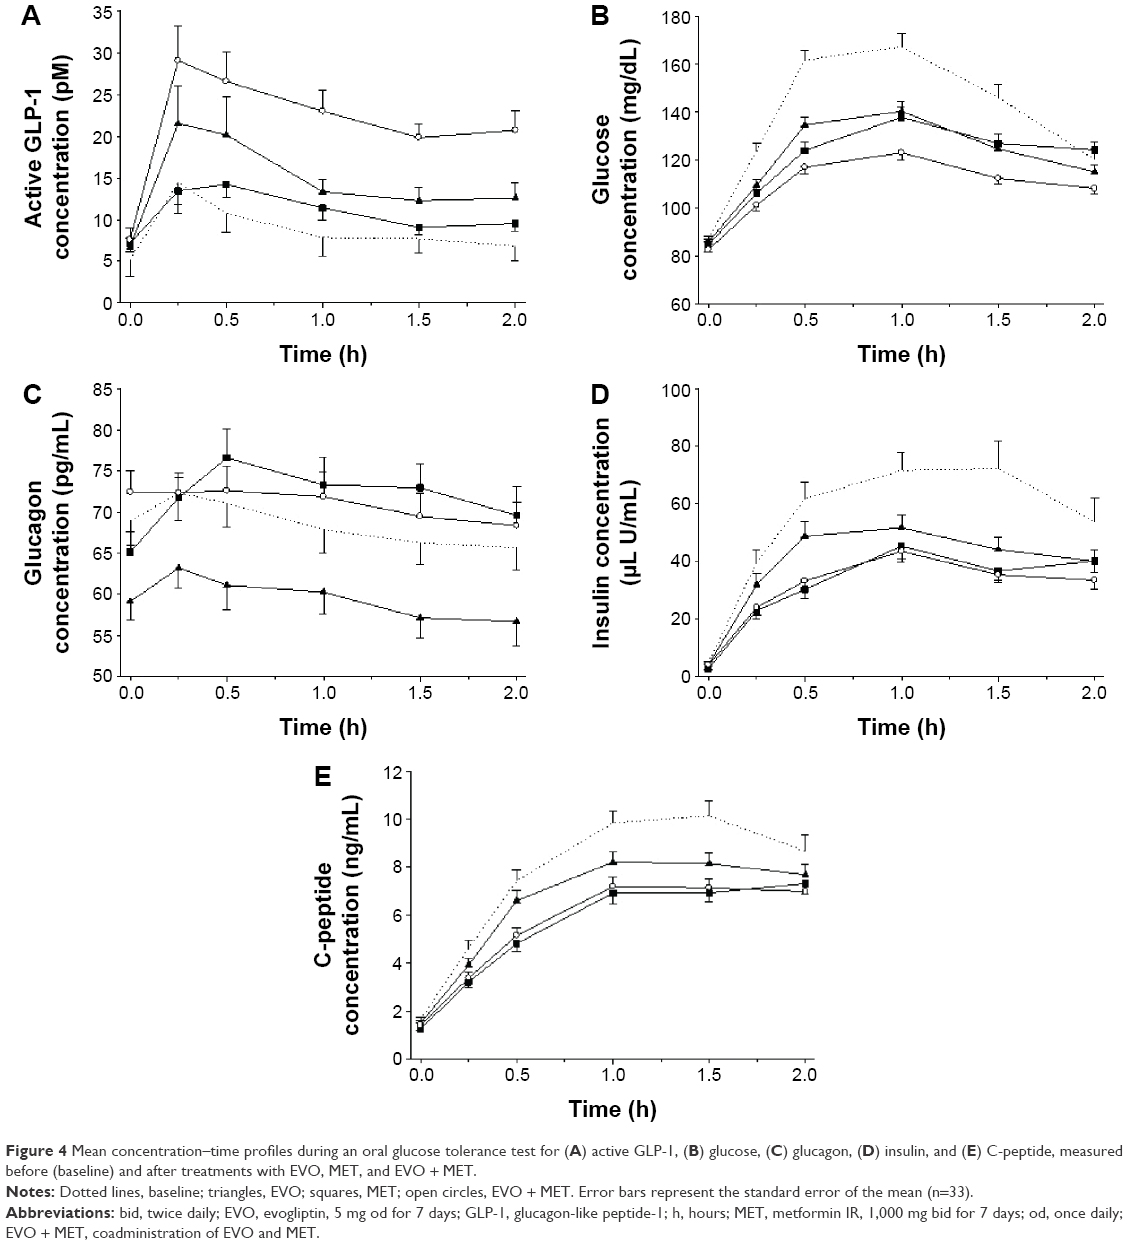 | Figure 4 Mean concentration–time profiles during an oral glucose tolerance test for (A) active GLP-1, (B) glucose, (C) glucagon, (D) insulin, and (E) C-peptide, measured before (baseline) and after treatments with EVO, MET, and EVO + MET. |
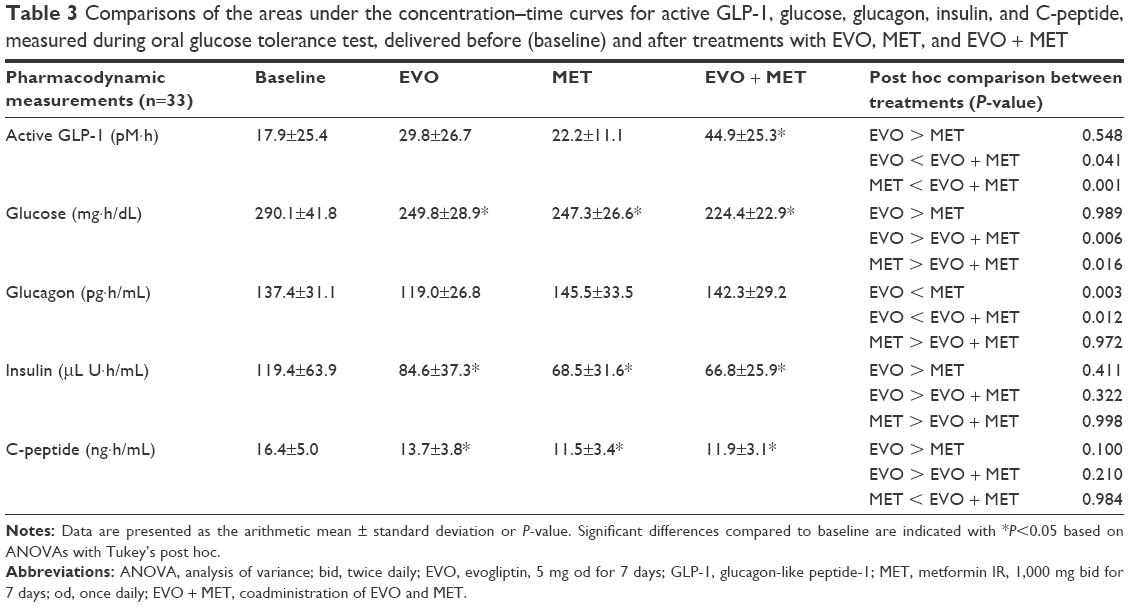 | Table 3 Comparisons of the areas under the concentration–time curves for active GLP-1, glucose, glucagon, insulin, and C-peptide, measured during oral glucose tolerance test, delivered before (baseline) and after treatments with EVO, MET, and EVO + MET |
Safety results
A total of 102 AEs was reported by 34 subjects. Among these, 95 AEs were considered to be possibly related to the study drug(s); 14 AEs in nine subjects, 41 AEs in 24 subjects, and 40 AEs in 24 subjects occurred after treatment with EVO, MET, and EVO + MET, respectively. The most common “possibly drug-related” AEs were gastrointestinal disorders, such as diarrhea, nausea, and abdominal pain. All AEs were mild in intensity, and medications were not needed for management, except for one subject with a rash who received topical prednicarbate cream. No subject was withdrawn from this study due to AE, and no clinically significant changes were observed in the vital signs, physical examinations, electrocardiograms, or clinical laboratory results.
Discussion
The present study evaluated potential pharmacokinetic and pharmacodynamic interactions between evogliptin and metformin at steady state concentrations. The dosing duration for achieving steady state and the washout period were determined based on previously reported pharmacokinetic studies for evogliptin and metformin in healthy volunteers.10,18 Accordingly, we implemented 7-day dosing in this study, which was over fourfold longer than the terminal half-lives for both evogliptin and metformin. Also, the washout period was set to at least 7 days, which was considered sufficient for complete elimination of drug from the blood.
The OGTT allows all the normal stages of insulin secretion and glucose processing to take place in sequence without causing stress or trauma to the subject. Accordingly, comparisons of the fluctuations in serum glucose, insulin, and glucagon levels during the OGTT, with and without medications, can lead to a better understanding of which treatment might be most beneficial and least toxic.19 Consequently, the present study implemented the OGTT for assessing and comparing the antidiabetic effects of evogliptin and metformin.
Evogliptin is primarily metabolized by cytochrome P45020 and urinary excretion is not the major elimination pathway.10 On the other hand, metformin is predominantly (~90% of absorbed metformin) eliminated by renal excretion.21 Therefore, we might expect potential pharmacokinetic drug–drug interactions to be unlikely between evogliptin and metformin. However, the present study showed that the systemic exposure of metformin was slightly reduced by coadministration of evogliptin; nevertheless, this effect was not considered clinically meaningful. Coadministered evogliptin appeared to reduce the bioavailability of metformin by increasing the CLss/F of metformin, without altering the terminal half-life at steady state (t1/2ss) and CLR,ss. This tendency of a DPP-4 inhibitor to decrease metformin pharmacokinetics (particularly Cmax) with coadministration was reported previously in other drug–drug interaction studies on metformin and DPP-4 inhibitors (eg, linagliptin and gemigliptin).15,22 However, these drugs are currently used with metformin in clinical settings, and they have caused no meaningful clinical change in the glycemic efficacy of metformin.
The major pharmacologic effect of evogliptin is to inhibit DPP-4 activity. We found that this effect was similar, with or without metformin coadministration, which suggested that no significant interaction occurred between evogliptin and metformin, regarding the inhibition of DPP-4 activity. This finding was supported by the different mechanisms of action of these drugs.4,8 In addition, in the present study, the percentage inhibition of DPP-4 activity (~90% inhibition) was comparable to findings in previous reports on evogliptin efficacy following multiple doses of evogliptin (5 mg).14
In the present study, the increase in active GLP-1 was significantly enhanced with EVO + MET compared to EVO or MET alone. One effect of metformin is to increase the total GLP-1 plasma concentration; in contrast, DPP-4 inhibitors suppress GLP-1 degradation, which stabilizes active GLP-1.6,23 Therefore, the combination of evogliptin and metformin was expected to exert complementary effects on active GLP-1 levels. Similarly, the combination of evogliptin and metformin potentiated the glucose lowering effects of evogliptin and metformin monotherapies, which also might have been due to their independent complementary mechanisms.4,8 On the other hand, glucagon levels during the OGTT were significantly lower with evogliptin alone than with metformin alone, even though the glucose increase was similar between the two treatments. This might be explained by the known effect of active GLP-1, which suppresses glucagon production;24 thus, an increase in active GLP-1 by evogliptin would be expected to suppress glucagon release. This evogliptin effect would be maintained, regardless of the coadministration of metformin. Indeed, we observed a flat (barely increased) glucagon profile with the EVO + MET treatment during the OGTT.
The EVO + MET treatment was generally well tolerated in healthy male subjects, and no differences in safety profiles were observed compared to the MET or EVO treatments. Gastrointestinal disorders were the most frequently reported AEs. These AEs are typically the most common side effects of metformin in type 2 DM.25 In addition, the safety profiles observed in our study were consistent with previous reports for other DPP-4 inhibitors.22 Therefore, the safety and tolerability profiles of evogliptin and metformin treatments were not altered by coadministration of both drugs.
Overall, although the metformin pharmacokinetics seemed to be affected by coadministration of evogliptin in the present study, the slight changes in Cmax,ss and AUCτ,ss would not be expected to meaningfully alter the euglycemic efficacy of metformin. First, the EVO + MET treatment showed rather more favorable increases in active GLP-1 and decreases in glucose than the MET or EVO treatments. In addition, metformin had no relevant drug–drug interaction that affected the ability of evogliptin to inhibit DPP-4 activity. Finally, metformin has a wide therapeutic window, and it can be administered over a wide range of doses (250–3,000 mg) in clinical settings.21 Therefore, this potential pharmacokinetic interaction between evogliptin and metformin would not be clinically meaningful, particularly with regard to the pharmacological therapeutic effect.
The results of the present study suggested that both the pharmacokinetic and pharmacodynamic effects of the combination treatment of evogliptin and metformin may be beneficial for patients with type 2 DM. However, there are differences between healthy subjects and patients with diabetes (ie, baseline glucose status, physiologic condition, comorbidity, and so on). These differences could lead to different responses to the pharmacologic effects of one or both of these drugs. Therefore, the clinical efficacy of the combination therapy of evogliptin and metformin requires confirmation and quantification in patient populations.
Conclusion
In conclusion, the coadministration of evogliptin and metformin showed no clinically relevant pharmacokinetic differences compared to the administration of each drug alone. The coadministered metformin did not alter the inhibitory effect of evogliptin on DPP-4 activity. In fact, the complementary actions of evogliptin and metformin, which increase active GLP-1 and decrease glucose, showed additive effects in healthy volunteers. Therefore, based on our findings of therapeutic benefit without clinically significant pharmacokinetic interactions, the combination of evogliptin and metformin may be used as a therapeutic option for treating type 2 DM.
Acknowledgment
This study was sponsored by Dong-A ST Co., Ltd., Seoul, Republic of Korea.
Disclosure
SJK is an employee of Dong-A ST Co., Ltd., and reports no other conflicts of interest in this work. The other authors report no conflicts of interest in this work.
References
Nathan DM, Buse JB, Davidson MB, et al. Medical management of hyperglycemia in type 2 diabetes: a consensus algorithm for the initiation and adjustment of therapy: a consensus statement of the American Diabetes Association and the European Association for the Study of Diabetes. Diabetes Care. 2009;32(1):193–203. | ||
Cook MN, Girman CJ, Stein PP, Alexander CM. Initial monotherapy with either metformin or sulphonylureas often fails to achieve or maintain current glycaemic goals in patients with type 2 diabetes in UK primary care. Diabet Med. 2007;24(4):350–358. | ||
Foretz M, Viollet B. Therapy: Metformin takes a new route to clinical efficacy. Nat Rev Endocrinol. 2015;11(7):390–392. | ||
Miller RA, Chu Q, Xie J, Foretz M, Viollet B, Birnbaum MJ. Biguanides suppress hepatic glucagon signaling by decreasing production of cyclic AMP. Nature. 2013;494(7436):256–260. | ||
UK Prospective Diabetes Study (UKPDS) Group. Effect of intensive blood-glucose control with metformin on complications in overweight patients with type 2 diabetes (UKPDS 34). Lancet. 1998;352(9131):854–865. | ||
Deacon CF, Ahren B, Holst JJ. Inhibitors of dipeptidyl peptidase IV: a novel approach for the prevention and treatment of type 2 diabetes? Expert Opin Investig Drugs. 2004;13(9):1091–1102. | ||
Patel NP, Pugh ME, Goldberg S, Eiger G. Hyperinsulinemic euglycemia therapy for verapamil poisoning: a review. Am J Crit Care. 2007;16(5):498–503. | ||
Inzucchi SE, Bergenstal RM, Buse JB, et al. Management of hyperglycemia in type 2 diabetes, 2015: a patient-centered approach: update to a position statement of the American Diabetes Association and the European Association for the Study of Diabetes. Diabetes Care. 2015;38(1):140–149. | ||
Kountz D. The dipeptidyl peptidase (DPP)-4 inhibitors for type 2 diabetes mellitus in challenging patient groups. Adv Ther. 2013;30(12):1067–1085. | ||
Kim TE, Lim KS, Park MK, et al. Evaluation of the pharmacokinetics, food effect, pharmacodynamics, and tolerability of DA-1229, a dipeptidyl peptidase IV inhibitor, in healthy volunteers: first-in-human study. Clin Ther. 2012;34(9):1986–1998. | ||
Jung CH, Park CY, Ahn KJ, et al. A randomized, double-blind, placebo-controlled, phase II clinical trial to investigate the efficacy and safety of oral DA-1229 in patients with type 2 diabetes mellitus who have inadequate glycaemic control with diet and exercise. Diabetes Metab Res Rev. 2015;31(3):295–306. | ||
Goldman-Levine JD. Beyond metformin: initiating combination therapy in patients with type 2 diabetes mellitus. Pharmacotherapy. 2011;31(12 Suppl):44S–53S. | ||
Yokoh H, Kobayashi K, Sato Y, et al. Efficacy and safety of the dipeptidyl peptidase-4 inhibitor sitagliptin compared with alpha-glucosidase inhibitor in Japanese patients with type 2 diabetes inadequately controlled on metformin or pioglitazone alone (Study for an Ultimate Combination Therapy to Control Diabetes with Sitagliptin-1): A multicenter, randomized, open-label, non-inferiority trial. J Diabetes Investig. 2015;6(2):182–191. | ||
Gu N, Park MK, Kim TE, et al. Multiple-dose pharmacokinetics and pharmacodynamics of evogliptin (DA-1229), a novel dipeptidyl peptidase IV inhibitor, in healthy volunteers. Drug Des Devel Ther. 2014;8:1709–1721. | ||
Shin D, Cho YM, Lee S, et al. Pharmacokinetic and pharmacodynamic interaction between gemigliptin and metformin in healthy subjects. Clin Drug Investig. 2014;34(6):383–393. | ||
Liu JJ, Cheng XH, Fu L. LC-MS based assay method for DPP-IV inhibitor screening and substrate discovery. Anal Methods. 2012;4(6):1797–1805. | ||
U.S. Department of Health and Human Services, Food and Drug Administration, Center for Drug Evaluation and Research (CDER). Guidance for Industry, Drug Interaction Studies – Study Design, Data Analysis, Implications for Dosing, and Labelling Recommendations; February 2012. | ||
Cullen E, Liao J, Lukacsko P, Niecestro R, Friedhoff L. Pharmacokinetics and dose proportionality of extended-release metformin following administration of 1000, 1500, 2000 and 2500 mg in healthy volunteers. Biopharm Drug Dispos. 2004;25(6):261–263. | ||
Ernsberger P, Koletsky RJ. The glucose tolerance test as a laboratory tool with clinical implications. In: Chackrewarthy S, editor. Glucose Tolerance. Rijeka, Croatia: InTech; 2012:3–14. | ||
Kim HJ, Kwak WY, Min JP, et al. Discovery of DA-1229: a potent, long acting dipeptidyl peptidase-4 inhibitor for the treatment of type 2 diabetes. Bioorg Med Chem Lett. 2011;21(12):3809–3812. | ||
Graham GG, Punt J, Arora M, et al. Clinical pharmacokinetics of metformin. Clin Pharmacokinet. 2011;50(2):81–98. | ||
Graefe-Mody EU, Padula S, Ring A, Withopf B, Dugi KA. Evaluation of the potential for steady-state pharmacokinetic and pharmacodynamic interactions between the DPP-4 inhibitor linagliptin and metformin in healthy subjects. Curr Med Res Opin. 2009;25(8):1963–1972. | ||
Migoya EM, Bergeron R, Miller JL, et al. Dipeptidyl peptidase-4 inhibitors administered in combination with metformin result in an additive increase in the plasma concentration of active GLP-1. Clin Pharmacol Ther. 2010;88(6):801–808. | ||
Quesada I, Tuduri E, Ripoll C, Nadal A. Physiology of the pancreatic alpha-cell and glucagon secretion: role in glucose homeostasis and diabetes. J Endocrinol. 2008;199(1):5–19. | ||
Bytzer P, Talley NJ, Jones MP, Horowitz M. Oral hypoglycaemic drugs and gastrointestinal symptoms in diabetes mellitus. Aliment Pharmacol Ther. 2001;15(1):137–142. |
 © 2016 The Author(s). This work is published and licensed by Dove Medical Press Limited. The full terms of this license are available at https://www.dovepress.com/terms.php and incorporate the Creative Commons Attribution - Non Commercial (unported, v3.0) License.
By accessing the work you hereby accept the Terms. Non-commercial uses of the work are permitted without any further permission from Dove Medical Press Limited, provided the work is properly attributed. For permission for commercial use of this work, please see paragraphs 4.2 and 5 of our Terms.
© 2016 The Author(s). This work is published and licensed by Dove Medical Press Limited. The full terms of this license are available at https://www.dovepress.com/terms.php and incorporate the Creative Commons Attribution - Non Commercial (unported, v3.0) License.
By accessing the work you hereby accept the Terms. Non-commercial uses of the work are permitted without any further permission from Dove Medical Press Limited, provided the work is properly attributed. For permission for commercial use of this work, please see paragraphs 4.2 and 5 of our Terms.