")
Back to Journals » Nanotechnology, Science and Applications » Volume 14
Pharmacodynamic Studies of Fluorescent Diamond Carriers of Doxorubicin in Liver Cancer Cells and Colorectal Cancer Organoids
Authors Firestein R, Marcinkiewicz C, Nie L, Chua HK , Velazquez Quesada I, Torelli M, Sternberg M, Gligorijevic B, Shenderova O, Schirhagl R , Feuerstein GZ
Received 10 June 2021
Accepted for publication 14 August 2021
Published 7 September 2021 Volume 2021:14 Pages 139—159
DOI https://doi.org/10.2147/NSA.S321725
Checked for plagiarism Yes
Review by Single anonymous peer review
Peer reviewer comments 2
Editor who approved publication: Professor Israel (Rudi) Rubinstein
Ron Firestein,1,2,* Cezary Marcinkiewicz,3,4,* Linyan Nie,5 Hui Kheng Chua,1,2 Ines Velazquez Quesada,4 Marco Torelli,6 Mark Sternberg,3 Bojana Gligorijevic,4 Olga Shenderova,6 Romana Schirhagl,5 Giora Z Feuerstein3
1Centre for Cancer Research, Hudson Institute of Medical Research, Clayton, Victoria, 3168, Australia; 2Department of Molecular and Translational Sciences, Monash University, Clayton, Victoria, 3800, Australia; 3Debina Diagnostics Inc., Newtown Square, PA, USA; 4College of Engineering, Department of Bioengineering, Temple University, Philadelphia, PA, USA; 5Groningen University, Groningen, 9727, the Netherlands; 6Adámas Nanotechnologies, Inc., Raleigh, NC, 27617, USA
*These authors contributed equally to this work
Correspondence: Giora Z Feuerstein
Debina Diagnostics Inc., 33 Bishop Hollow Road, Newtown Square, PA, 19073, USA
Tel +4842221575
Email [email protected]
Background: We recently reported on preferential deposition of bare fluorescent diamond particles FDP-NV-700/800nm (FDP-NV) in the liver following intravenous administration to rats. The pharmacokinetics of FDP-NV in that species indicated short residency in the circulation by rapid clearance by the liver. Retention of FDP-NV in the liver was not associated with any pathology. These observations suggested that cancer therapeutics, such as doxorubicin, linked to FDP-NV, could potentially serve for anti-cancer treatment while sparing toxicities of peripheral organs.
Purpose: To generate proof-of-concept (POC) and detail mechanisms of action of doxorubicin-coated FDP-NV-700/800nm (FDP-DOX) as a prospective chemotherapeutic for metastatic liver cancer.
Methods: FDP-DOX was generated by adsorption chemistry. Experimental design included concentration and time-dependent efficacy studies as compared with naïve (baren) FDP-NV in in vitro liver cancer cells models. Uptake of FDP-NV and FDP-DOX by HepG-2, Hep-3B and hCRC organoids were demonstrated by flow-cytometry and fluorescent microscopy. FDP-DOX pharmacodynamic effects included metabolic as well as cell death biomarkers Annexin V, TUNEL and LDH leakage. DOX desorpted from FDP-DOX was assessed by confocal microscopy and chemical assay of cells fractions.
Results: FDP-DOX efficacy was dose- and time-dependent and manifested in both liver cancer cell lines and human CRC organoids. FDP-DOX was rapidly internalized into cancer cells/organoids leading to cancer growth inhibition and apoptosis. FDP-DOX disrupted cell membrane integrity as evident by LDH release and suppressing mitochondrial metabolic pathways (AlamarBlue assay). Access of free DOX to the nuclei was confirmed by direct UV-Visible fluorescent assay and confocal microscopy of DOX fluorescence.
Conclusion: The rapid uptake and profound cancer inhibition observed using FDP-DOX in clinically relevant cancer models, highlight FDP-DOX promise for cancer chemotherapeutics. We also conclude that the in vitro data justify further investment in in vivo POC studies.
Keywords: liver cancer cell-lines, human colorectal cancer organoids, fluorescent diamond particles-NV-700/800nm, doxorubicin, apoptosis
Introduction
Nanomedicine is the latest evolution of rapidly advancing pharmaceuticals and materials sciences as witnessed by over 30,000 publications posted on PubMed at the close of 2020. Nanomedicine has already been interwoven within many medical applications using diverse materials, additives, and conjugated composites.1–7 In fact, this relatively new discipline is fulfilling the “third leg” for pharmaceuticals innovations beyond small organic molecules and proteins therapeutics. The legitimacy of nanomedicine has already been “stamped” by clinical applications approved by the US Food and Drug Agency (FDA) and international regulatory agencies.8–10.
No other medical discipline exceeds oncology in its intense and diverse explorations of nanomedicine in treatment and diagnosis of cancers. Combined imaging, targeted delivery, and treatment (“Theranostics”) using traditional and novel chemotherapeutics stand to diminish “off target” toxicities while preserving efficacy.11–15 Furthermore, engineered organic and non-organic fluorescent nano-carriers are offering alternatives for extra-corporeal imaging in lieu of hazardous radiation, radioactivity, high costs, and non-ambulatory setting (e.g., magnetic resonance imaging, MRI). Furthermore, contemporary carriers such as liposomes16,17 and co-polymers18,19 have “blazed the trail” by delivering clinically successful drugs yet are still marred by deficiencies such as stability, biocompatibility, and durability.19 Among novel fluorescent reagents, nanodiamond particles containing color centers exhibit extraordinary photostability20 and the capability to sense external magnetic, electrical, and thermal fields of cellular environments21 while displaying high biocompatibility.22 Moreover, fluorescent nanodiamonds (FNDs) containing nitrogen-vacancy (NV) centers can be used as dual-mode contrast agents which can be visualized both in fluorescence imaging as well as in MRI due to optically induced 13C hyperpolarization in diamond particles with a benefit of substantial accelerated image acquisition in wide-field scenarios.23 FNDs are increasingly used as contrast agents and quantum probes for in vitro and in vivo research and in the development of therapeutics.24,25
Contemporary trends seek low nanometer (1–100 nm) carriers driven by the regulatory quest for safety by excretion of smaller size particles through physiological routes – the renal and biliary system.1 In this respect, FDP-NV-700/800nm (the subject of our research and development) are contrarian to contemporary trends for their apparent long-term retention in the targeted organ.
We have recently observed that FDP-NV-700/800nm (FDP-NV) infused via the jugular vein to intact rats are almost exclusively deposited in the liver, a minor fraction in the spleen, and virtually none in lung, kidney, heart, and brain.26,27 Acute pharmacokinetic study (in intact rats) established short residency time in the circulation with T1/2 (“half-life” < 5 minutes) due to fast clearance from the circulation and removal by the liver (> 95% within 20 min).26,27 While liver depositions of nanodiamonds particles (NDP) are well known,28,29 the speed, extent, and prolonged retention along with exceptional biocompatibility of FDP-NV-700/800nm are uniquely differentiated from single or double-nm scales of nanodiamonds particles.25–27
The liver is a frequent site of cancer metastasis across several malignancies, including colorectal, pancreatic, breast, and lung cancers.30–33 In particular, the liver is a sentinel organ for colorectal cancer metastasis and is the ultimate cause of death in most cases.33 Hence, there is an unmet medical need and urgency to develop both diagnostic tools and therapeutic regimens for early diagnosis and highly effective treatment at early stages of the disease. Within this context, we aimed first to establish “proof-of-concept” support for employing FDP-NV as a carrier of doxorubicin for advanced liver metastatic disease. We have chosen to deploy doxorubicin-coated FDP-NV (FDP-DOX) due to extensive information on the successful deployment of a variety of carriers of anthracycline compounds for clinical treatment of various cancers, such as paclitaxel (Taxol) and doxorubicin (Doxil).34–36 Prominent among the carriers that reached clinical development and further on were registered for treatment of patients with metastatic cancer are lipid carriers in the form of liposomes.36 However, Doxil (a modified PEGylated liposome-based carrier of doxorubicin) and related composites still suffer from pharmacological shortages such as systemic adverse effects, limited stability, and immune response (e.g., Doxil) which do not occur in FDP-DOX.37,38 Also, none of the lipid carriers provide targeted imaging of the specific pathology. Nanodiamonds might offer opportunities to reduce “off target” adverse events, high biocompatibility, durability, and flexible to diverse ligands such as chemotherapeutics.39–44 Affording imaging of the targeted tumor by using extra-corporeal near-infrared (NIR) monitoring technology stands to revolutionize scanning of pathological targets by non-radiation and non-radioactive methods. Moreover, nanodiamond particles carrying DOX have already shown promising potential in elimination of cancer cells in in vitro and in vivo models.43–45 The specific objectives of the experiments presented in this manuscript should be viewed as in vitro “proof of concept” aimed to “pave the way” for in vivo studies of cancer models and further on, clinical development.
Materials and Methods
Material
Fluorescent Nanodiamond Particles
FDP-NV-700/800nm (FDP-NV) surface functionalized by carboxylation were obtained from Adamas Nanotechnologies, Inc. (Raleigh, NC). The particles were synthesized by a high-pressure, high temperature approach and fluorescence properties induced by formation of NV color centers at a level of ~3 ppm.3 Fluorescent diamond particles containing NV provide red-to-near-infrared fluorescence with peak emission at 680–700 nm and can be excited in a broad range at 520–600 nm with a peak excitation at ~570 nm. Two types of particles were deployed: (1) naïve/bare (FDP-NV) and (2) FDP-NV-700/800nm coated by various loads of doxorubicin (FDP-DOX). Both products were provided as sterile, dry powder.
Source of Cell Lines
HepG-2 liver cancer cells were purchased from ATCC (Manassas, VA 20110, USA) and Hep-3B liver cancer cells from Sigma (St. Louis, MO, USA). Patient-Derived Tumor (PDT), human colorectal cancer (hCRC) organoids line 18SH112T was obtained from the Hudson-Monash Cancer Center, (Melbourne, Australia) where all organoid-based studies are performed under proper authorization.
Methods
Coating of FDP-NV with Doxorubicin
Coating of FDP-NV with doxorubicin (DOX) and its impact on physical-chemical properties have been reported previously.2,3 The procedure involves incubation of the particles with DOX in the presence of NaOH (sodium hydroxide) where the ratio of FDP to DOX determines the degree of loading. To evaluate DOX adsorption, the DOX concentration in the reaction was varied from 5 to 250 μg per 100 μg FDP-NV (Figure 1A). Based on the results of the adsorption in Figure 1A, DOX adsorption on the particles was performed for high, medium, and low doses using respectively 200 μg, 150 μg, and 50 μg DOX per 100 μg FDP-NV yielding coatings of densities 35 μg/mg (60 nmol/mg), 11 μg/mg (19 nmol/mg), and 1.8 μg/mg (3 nmol/mg), as summarized in Table 1. A stock solution of DOX HCl (MedKoo Biosciences, Morrisville, NC) was prepared at 0.5 mg/mL and sterilized through a 0.2 μm filter. The DOX stock solution was added to sterile (autoclaved) FDP-NV (0.2 mg/mL) to produce a desired DOX: FDP ratio, e.g. 2:1 (200 μg DOX per 100 μg FDP-NV) for the highest loading dose, in DI water. 1M NaOH was then added at a final reaction concentration of 2.5 mM causing color shift from orange/red to deep purple (Figure 1B). The solution was stirred for 15 minutes and then centrifuged (5 min., 10,000 x g). Supernatant was decanted and pellet resuspended and loaded into Eppendorf tubes where they were pelleted again and dried (in vacuo). Particles were then characterized by dynamic light scattering (DLS, Malvern Panalytical Ltd, Malvern, UK) as depicted in Figure 2. Pelleted DOX-loaded particles were reconstituted and monitored directly via UV-Visible spectroscopy (Lambda 35, PerkinElmer, Waltham, MA).
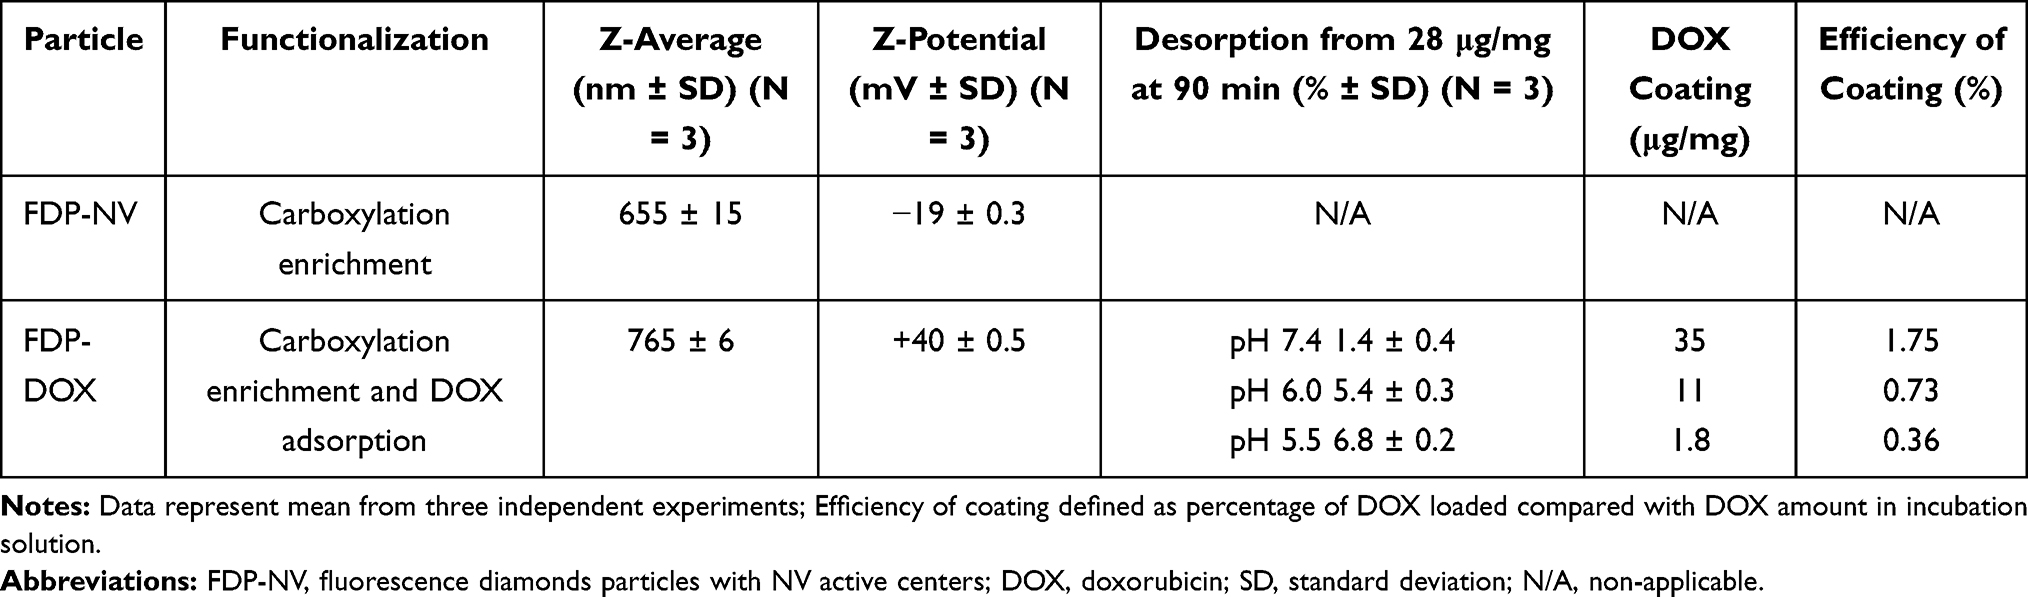 |
Table 1 Dynamic Light Scattering of FDP-NV and FDP-DOX and Ability of DOX Adsorption by Particles |
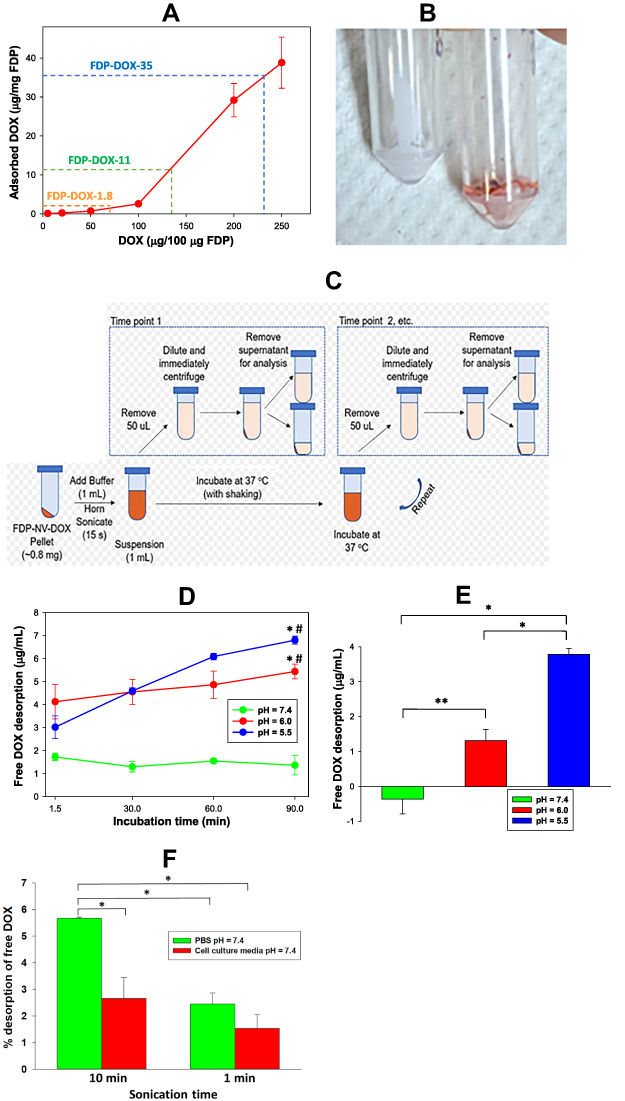 |
Figure 1 Absorption and desorption of DOX from particles surface under different experimental conditions. Abbreviations: FDP-NV, fluorescence diamonds particles with NV active centers; DOX, doxorubicin; PBS, phosphate buffered saline; Ex, excitation; Em, emission; SD, standard deviation. Notes: (A) Concentration dependent efficiency of absorption of DOX on the FDP-NV surface. Dashed lines indicate the conditions of adsorption used for the preparation of three different loads of FDP-DOX. Error bars represent SD from triplicated samples. (B) Picture of lyophilized pellets of naïve FDP (FDP-NV) and particles adsorbed on the surface DOX (FDP-DOX). (C) Schematic view of procedural steps of desorption DOX from FDP-DOX in different time points under two pH conditions. (D) Graph representing results of desorption of DOX from FDP-DOX under conditions presented in scheme (C). Error bars represent SD of triplicate samples. *P < 0.001 for comparison with pH = 7.4; #P < 0.05 for comparison with the lowest time (1.5 min) using one-way ANOVA. (E) Graph presenting the increases of desorption of DOX from 1.5 min to 90 min for each pH value. Error bars represent SD of triplicated samples. *P < 0.001, **P = 0.005 calculated using one-way ANOVA. (F) Effect of different sonication times on desorption of DOX from FDP-DOX suspended in PBS pH =7.4, or HepG-2 culture media. Samples were centrifuged (16,000 x g at room temperature) immediately after sonication, and fluorescence of supernatants was measured using 480 nm Ex and 590 nm Em wavelengths. Free DOX found in the supernatant, calculated as percent of DOX adsorbed on the particles (FDP-DOX-35) matched to a standard curve of free DOX executed in parallel. Error bars represent SD from triplicate samples. *P < 0.001 in one-way ANOVA. |
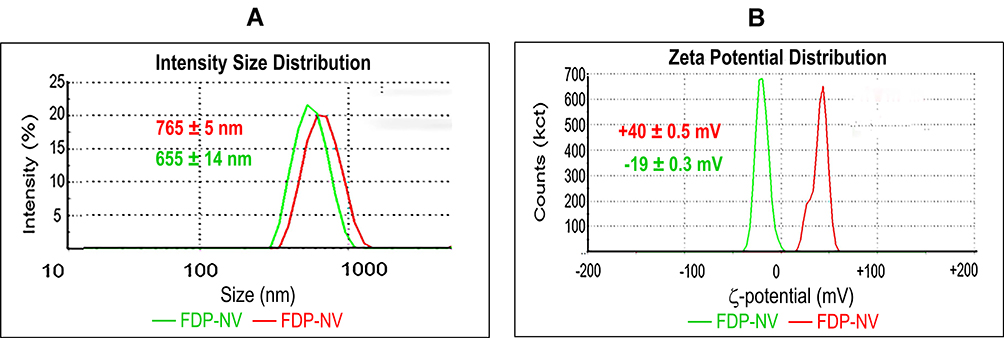 |
Figure 2 Zetasizer analysis of FDP coated or not with DOX. Abbreviations: FDP-NV, fluorescence diamonds particles with NV active centers; DOX, doxorubicin; DLS, dynamic light scattering; SD, standard deviation. Notes: (A) Size distribution of FDP performed using DLS technique. Numbers present average values of FDP ± SD from three independent measurements. P < 0.001 by one-way ANOVA analysis of values between particle types. (B) ζ-potential analysis. Numbers present average values of FDP ± SD from three independent measurements. P < 0.001 for one-way ANOVA analysis of values between particle types. |
Desorption of DOX from Suspension of FDP-DOX by pH and Sonication
Desorption studies followed principles detailed in previously published protocols.46,47 Aliquots of FDP-DOX were suspended in phosphate buffered saline (PBS, pH = 7.4) at a concentration of 0.8 mg/mL in either PBS pH = 7.4, pH = 6.0 or pH = 5.5 (PBS titrated with 6 M HCl). FDP-DOX suspension was kept at 37°C (to mimic physiological conditions), followed by 15 s of horn ultra-sonication (to obtain optimal FDP-DOX dispersion). Aliquots of 50 μL were tested for free DOX starting at 1.5 min post FDP-DOX suspension followed by 5 repeats throughout 90 min (Figure 1D). At each time point FDP-DOX were sedimented and supernatant removed and tested for desorpted DOX by UV-Visible. Since FDP-DOX were routinely sonicated prior to application into cell culture medium, we further characterized the impact of sonication on DOX desorption in various solutions and duration of sonication including cell culture media used for liver cancer cells culture.
Effect of FDP-DOX on Metabolic Activity of HepG-2 Cells Measured by AlamarBlue Fluorescent
The AlamarBlue (AB) assay is designed to test cell viability and cytotoxicity in a range of biological and environmental systems.48,49 The AB assay is based on the detection of activity of reductases, present in the mitochondria and cytoplasm, such as diaphorases, NAD(P)H:quinone oxidoreductase or flavin reductase. The active compound of the AB assay is resazurin, a non-fluorescence dye, which is converted into strong pink fluorescence by reductases. The AlamarBlue (AB) assay was preferred for this task based on studies that demonstrated advantages of AB over the MTT test.49 In brief, HepG-2 were cultured in Eagle’s Minimum Essential Medium (EMEM, ThermoFisher Sci. Waltham, MA, USA), supplemented with 10% fetal bovine serum (FBS) (ThermoFisher Sci.) supplemented with penicillin/streptomycin (ThermoFisher Sci.). Cells were seeded on a 96-well plate at a density of 1×10⁴ cells per well in 100 μL of complete growing medium (EMEM containing 10% FBS) and allowed to attach overnight by incubation at 37°C in 5% CO2. Media were changed to one containing free DOX, or FDP-DOX or naïve FDP-NV in 150 μL of complete cell growing medium. Media were removed and cells were washed with 200 μL of FBS-free DMEM. AB reagent (ThermoFisher Sci.) was diluted 1:10 in FBS-free DMEM and added to the 150 μL wells, according to previously published method. The 100 μL of liquid from each well were transferred to the corresponding wells of separate empty plates for fluorescence reading. That procedure is required to eliminate dispersion of fluorescence light on the attached on the bottom of the wells cells and particles. Plates were incubated at 37°C in 5% CO2 atmosphere for 1 h. Plates were read using fluorescence microplate reader (BioTek FLx800) with 485 nm excitation and 560 nm emission. Fluorescence was recorded in FDP-DOX treated cells and plotted as a ratio of the control (no FDP-DOX).
Effect of FDP-DOX on Lactate Dehydrogenase Release by HepG-2
Lactate Dehydrogenase (LDH) assay followed previously published methods.50,51 Briefly, reagent A was composed of 4 mM iodonitrotetrazolium chloride (INT) in 0.2 M Tris-HCl, pH 8.2. Reagent B was composed of 6.4 mM beta-nicotinamide adenine dinucleotide (NAD) sodium salt and 320 mM lithium lactate in 0.2 M Tris-HCl, pH 8.2. Cells were seeded on the 96-well plates and treated with free DOX or FDP-DOX using the same conditions as described for the AB assay. Following incubation, 50 μL of media from each well were transferred into a new plate, and 50 μL of assay reagent added to each well. Plates were incubated for 1 h under a cover (dark) and at room temperature. The reaction was terminated by adding 50 μL of 1 M acetic acid to each well. Plates were read using an ELISA plate reader (BioTek ELx800) at 490 nm wavelength against blank wells containing only cell culture media. Results were calculated as “test article divided by blank” (culture media only).
Effect of FDP-DOX on Annexin V Expression in HepG-2 Cells
Association of de novo annexin expression is amply documented in a broad variety of cell stress conditions leading to apoptosis and necrosis.52–54 We have resorted to histochemical assays for annexin V detection in FDP-NV and FDP-DOX treated cells and followed principles previously reported.51–53 HepG-2 cells were seeded on 96-well plates and treated with various dosing regimens of free DOX, FDP-NV and FDP-DOX over 24 h. Following incubation, the wells were washed with 200 mL of the annexin-binding buffer (10 mM HEPES, 140 mM NaCl, and 2.5 mM CaCl2, pH 7.4). Annexin V FITC-conjugate stock solution (ThermoFisher Sci.) was diluted 1:10 in annexin-binding buffer and applied to each well (100 μL). After incubation for 15 min at room temperature cells were fixed with 4% PFA for 30 min at room temperature. Nuclei were stained by the standard DAPI method and cells were imaged using fluorescence microscope (Olympus IX81) with 10x objective. Annexin V positive cells were distinguished by intensity of green (FITC) fluorescence, and FDP-NV were visualized using TRITC (red fluorescence).
Effects of FDP-DOX on HepG-2 and Hep-3B Nuclear DNA Integrity Using TUNEL as Biomarker
The TUNEL (terminal deoxynucleotidyl transferase dUTP nick-end labeling) assay was performed using the fluorescence of the In Situ Cell Death Detection Kit (Sigma Inc.) according to the manufacturer’s instructions and published protocols.55–57 Briefly, HepG-2 cells or Hep-3B were seeded in 96-well plates and allowed to adhere overnight. Thereafter, cells were treated with FDP-NV or FDP-DOX (at various DOX coatings) using the same conditions as described for the AlamarBlue assay. After 24 h of incubation, cells were washed with PBS and fixed with 4% paraformaldehyde (PFA) for 30 min at room temperature. Cells were permeabilized by 0.1% Triton X-100 in 0.1% sodium citrate solution while placed on ice for 2 min and 50 μL of TUNEL reaction mixture was added followed by 1 h incubation at 37°C in a humidified atmosphere. Thereafter, plates were washed 3x with PBS pH = 7.4 and analyzed by fluorescence microscopy (Olympus IX81) using 10x objectives. TUNEL positive nuclei were visualized by green fluorescence (FITC), whereas FDP were visualized using TRITC channel (red fluorescence).
Monitoring Free DOX in Separated Nuclei and Cytosol Fractions of FDP-DOX Treated Hepatic Cancer Cells
Fractionation of HepG-2 and Hep-3B into cytosol and nuclei fractions was aimed to prove the presence of free DOX in nuclei of cells treated with FDP-DOX. To this end, treated cells were fractionated into cytosol and nuclei fractions immediately after completion of the incubation period. These data were considered important since FDP-NV are not expected to be transported into the nucleus, yet evidence of TUNEL suggested DOX presence and action in the nuclei. The protocol used for fractionation of each of these cells followed methods reported elsewhere.58 Briefly, cells were seeded into 6 cm cell culture dishes and grown to 80–90% confluency. Cells were exposed to FDP-DOX-35 or free DOX (5–20 μM) for 24 h. Cells were detached using TripleEx and treated with 0.5 mL of “cytoplasm extraction buffer”.58 Supernatant was collected (cytoplasmic fractions) while pellets were suspended in “nuclear extraction buffer”.58 Aliquots of each fraction (100 μL) were transferred to a 96-well plate along with varying concentrations of free DOX to serve for standard curve. DOX fluorescence was measured by Tecan Infinite 200 PRO (Tecan AG, Männedorf, CH) instrument set for 480 nm excitation and 590 nm emission. Fractions were adjudicated via Western Blot; for cytosol MEK, and nuclei Lamin A/C.
Imaging of DOX Accumulation in the Nuclei by Confocal Microscope
Hep-3B cells were seeded on the 8-well glass chamber slide (ThermoFisher Sci.) at density 5×10⁴ per well and allowed to adhere overnight. Cells were treated with FDP-DOX or FDP-NV at density 50 μg/mL in 400 μL per well of cell culture medium for 24 h. Cells were fixed by incubation with 4% PFA for 30 min at room temperature and treated with DAPI. Slides were analyzed by scanning confocal microscopy FV1000 (Olympus, Tokyo, Japan) using 60x oil immersion objective, as previously described.27 DOX was visualized in green using laser excitation light 488 nm and 541–591 nm emission, whereas FDP were visualized in red using 543 nm excitation and 655–755 nm emission. DAPI was visualized in blue. Images were processed for the overlapping colors using ImageJ software.
Uptake of FDP-DOX by Patient Derived Tumor (PDT) Colorectal Cancer Organoids in Culture and Their Effect on Cells’ Metabolism and Viability
Organoid Culture and Maintenance
PDT colon organoids 18SH112T (colorectal cancer organoids) were maintained in culture as described previously.59,60 CRC organoids were grown in complete organoid media, consisting of Advanced DMEM/F12 (GIBCO), supplemented with 1X B27 (GIBCO), 1X N2 (GIBCO), 100 µg/mL Primocin (InvivoGen), 50 ng/μL recombinant human EGF (Peprotech, NJ, USA), 10 nM Gastrin (Sigma Inc.), 500 nM A83-01 (Tocris Bioscience, Bristol, UK), 1.25 mM N-acetylcysteine (Sigma-Aldrich), 10 mM nicotinamide (Sigma Inc.), 20% Noggin conditioned media, 10% R-Spondin 1 conditioned media and 10% Wnt3A conditioned media.
Experimental Layout and Plating
Organoids were harvested at day 5 and seeded at a density of 250 organoids/well in 24-well plates and allowed to settle overnight. FDP-DOX and FDP-NV were prepared in concentrations of 0.15 mg/mL, 0.04 mg/mL, 0.01 mg/mL. The particles were added to the respective wells in duplicates for an AlamarBlue cell viability and proliferation assay (vide supra), and flow cytometry analysis.
Cell Viability and Proliferation Assay
Organoids were treated for 4 days with either FDP-DOX or FDP-NV with the respective concentrations. The test articles were replaced with fresh complete organoid media on day 4 of the assay. Organoid viability and proliferation were assessed using the AlamarBlue™ HS kit (Thermo Fisher, Sci.) on day 7 of the experiment. The cultures were incubated with AlamarBlue (diluted 1:10) at 37°C for 2.5 h. Viability was determined by change in fluorescence intensity, monitored by ClarioStar plate reader, at an excitation between 530–560 nm and emission of 590 nm. The results were analyzed as percentage viability of treated groups against the PBS treated control group.
Flow Cytometry Analysis
Organoids treated with 0.15 mg/mL FDP-DOX and FDP-NV were harvested at 2, 6, 24 and 48 h. Briefly, media containing the particles were removed and the wells washed twice with 1X DPBS (Sigma Inc.) to remove any residual FDP particles. Organoids were harvested and dissociated into single cells by enzyme digest with TrypLE™ Select Enzyme (1X) (GIBCO) for 10 min at 37°C, followed by gentle mechanical pipetting and trituration with a 27 G 1¼ inch needle. Cells’ pellets were resuspended in 1X PBS supplemented with 2% FBS, and the suspension cell culture was collected into a 35 μm strainer tube and stained with DAPI (4ʹ,6-diamidino-2-phenylindole, ThermoFisher, Sci.) for 10 min. Cells were sorted with the LSRFortsea X-20 and the results analyzed with the FlowJo v10.7 software.
Data Analysis and Statistics
Unless mentioned otherwise, all experiments were carried out in triplicate with at least 3 independent repeats. Data are presented as mean ± SD, as indicated in the figure legends. Statistical analyses were done by ANOVA (where appropriate) using SigmaPlot software (SigmaPlot® 12 SPSS, Systat Software Inc., San Jose CA, USA). Statistical significance was established at a value of P < 0.05.
Results
Physicochemical Characteristic of FDP-NV and FDP-DOX by Dynamic Light Scattering (DLS)
Z-average and ζ-potential of FDP-NV and FDP-DOX are depicted in Figure 2 (FDP-NV green and FDP-DOX red) and Table 1. Z-averages of FDP-DOX increased by 110 nm compared with FDP-NV (p< 0.001, N = 3). ζ-potential of FDP-NV (Table 1) changed from −19 mV ± 0.3 mV to +40 mV ± 0.3 mV for FDP-DOX (mean and SD respectively, p<0.001, N = 3). The increase in FDP-DOX diameter is attributed to high surface loading as observed in studies done by others using similar protocols albeit with much smaller nanodiamonds particles (NDP).29 As an example, nanodiamond with Z-average of 50.7 nm ± 3.3 nm assumed Z-average of 93.1 nm ± 8.2 nm following daunorubicin coating.44 Diamond particles are well-known to readily adsorb molecules with conjugated electronic systems (e.g. aromatic heterocycles and related compounds) through interactions with their conjugated π systems, in conjunction with hydrogen bonding.2,3 The presence of protonated amines as part of their chemical formula of anthracycline compounds is considered the cause of the positive charge. The significance of positive surface charge conveyed by the “taxane” payloads increases solubility of nanodiamond-drug complexes in water due to water molecules having a greater affinity for forming hydration shells around charged complexes compared with neutral molecules.29
Adsorption of DOX onto FDP-NV-700/800nm and Desorption of DOX from FDP-DOX Under Various Conditions
As a consequence of the adsorption process described in the Methods section and illustrated in Figure 1A, three different FDP-DOX loads were generated based on varying DOX:FDP ratios for targeted loading densities. Loading densities determined by direct UV-Visible measurements of the particles, yielded 35.7 ± 0.2, 11.2 ± 0.6, and 1.8 ± 0.3 μg DOX per mg of FDP, for the high, medium, and low doses, respectively. The efficiency of the coating process was 1.75% for FDP-DOX-35 μg/mg particles, 0.73% for the medium load and 0.6% for the lowest load as presented in Table 1. Loads of DOX on particles presented as FDP-DOX-X, where X = amount of μg loaded per mg particles mass (e.g., FDP-DOX-35 etc.). While the efficiency of the coating process we observed is lower compared with the 57% efficiency demonstrated by Chow et al.7 for DOX loading on 5 nm particles (at 1:1 ND:DOX ratio, slightly different form the one used here), the result is not unexpected due to the large size of the FDP-NV particles. The specific surface area (SSA) of spherical 700/800 nm particles is ~140x less than 5 nm particles for a constant mass. Thus, if loading efficiency is attributed to the unit area of the particles using a spherical approximation, the real efficiency reported is higher (~4x) than previously reported. It is also known that milled HPHT particles, as used in this study, possess a very high roughness3 that increases the SSA with respect to a spherical approximation. Taken together, considering the realistic SSA for 700/800 nm HPHT, the observed efficiency of DOX correlates to similar level of prior reported results.7
Desorption studies conducted with FDP-DOX have been restricted to 90 min to reflect the short residency time of FDP-NV in the circulation (vide supra).25 Figure 1B illustrates color change of dry powder of FDP-NV from “milky white” to purple following adsorptions of DOX. Figure 1C describes the process whereby the amount of DOX desorpted from the particle was assessed throughout the 90 min of the desorption protocol. Figure 1D provides time and pH dependent desorption of DOX from suspensions of 0.8 mg of FDP-DOX-28 μg/mg in 1 mL of PBS pH = 7.4, pH = 6, or pH = 5.5. Suspension in PBS pH = 7.4 resulted in non-significant desorption at 1.47 ± 0.21 μg/mL (mean and SD, respectively) at 5.2% of DOX load. Statistical analysis by one way ANOVA of DOX desorption in PBS pH = 7.4, indicates a borderline trend (within group analysis at P < 0.072, non-significant), which might suggest possible desorption had incubation time been extended. In marked contrast, desorption at pH = 6.0 (4.56 μg ± 0.49 μg, mean and SD, respectively) amounts to 16.3% of FDP-DOX “payload”, which was statistically significant (P < 0.001) from that obtained at pH = 7.4 throughout the complete set of samples tested over 90 min (Figure 1D). The increased desorption at pH = 6 is in line with previous reports.46,47 The mean desorption at pH = 5.5 further increased (Figure 1D), at 6.8 μg ± 0.2 μg (mean and SD, respectively) that amounted to a significant 20% of FDP-DOX-35 ug/mg “payload”. Figure 1E summarizes the changes in DOX desorption from 1.5 min to 90 min for each of the three pH conditions, indicating that at pH = 5.5 there is continuous and significant desorption compared with pH = 7.4 and even pH = 6.0. Considering the well-known lysosomes acidification capacity (pH = 5.0–5.5) it is expected that FDP-DOX intracellular inclusion bodies if merged with lysosomes, could effectively be desorbed in this intracellular milieu.61 Direct proof on the role of lysosomes in DOX desorption FDP-DOX has not been obtained yet.
We further tested desorption of DOX from FDP-DOX following sonication, a protocol used for optimization of FDP-NV and FDP-DOX particles dispersion prior to application into cell culture. Desorption has been tested in either PBS or culture medium but at same pH = 7.4. We have also tested the latter (impact of cell culture medium) condition since we could not identify publication that explored the impact of sonication on DOX desorption in culture medium used in our cell cultured studies. The data presented in Figure 1F depict desorption at 6.0% of DOX in the media (red bar) and 8.9% in PBS (green bar) over 1 min yet, at 10 min sonication, desorption rose to 20.3% in PBS pH = 7.4 and 10.1% in media pH = 7.4. Our data on the impact of sonication on desorption of DOX when suspended culture in media could serve investigators who might need to be aware of the impact of sonication procedures on the coated particles’ payloads in different suspensions.
Assessment of Cytotoxicity by Biochemical Biomarkers: Highlight on Issues
Evaluation of cytotoxic effects of discrete compounds, composites and xenobiotics requires diverse methods targeting critical mechanisms of cells’ injury and death.62 Acknowledging diversity of methods that frequently do not correspond well with each other, we have focused on a set of assays that have been well vetted and referenced including toxicities of several anthracycline agents. Finally, we scanned prior publications that focused on cancer cells (HepG-2, Hep-3B) tested by anthracycline “payloads” by various carriers that demonstrated disruption of essential cellular and biochemical functions.
Effect of FDP-DOX on Metabolic Activities of HepG-2 Cells Monitored by AlamarBlue Fluorescent Assay
The utility and mechanisms associated with AlamarBlue (AB) cytotoxicity assay have been provided in the Methods section (vide supra). AB is a commonly used assay that serves as a cellular biomarker of metabolic and proliferative activities. Figure 3A–C presents dose-combination of FDP-DOX particles of various DOX loads on HepG-2 cells compared with non-coated FDP-NV. Three different “payloads” of DOX were tested, each at one of three masses of particles. Figure 3A represents the extent of diminution of the metabolic functions represented by AB fluorescence decay, which over 24 h, diminished 80% in cells exposed to FDP-DOX-35 μg/mg particles (60 nmol/mg particles) and lesser (40%) at 19 nmol/mg. Marginal effects were noted following exposure to FDP-DOX-3 nmol/mg (lowest dose, data not shown). Figure 3B represents time-and dose-dependent toxicity of FDP-DOX exposures over 12, 24, 48 and 72 h, suggesting the importance of temporal factors for FDP-DOX pharmacodynamic effects. Figure 3C presents a positive control (free DOX) over broad dosing regimens and 2 time points, 24 or 72 h of exposure. Figure 3C shows free DOX to be more potent than FDP-DOX-35 (top FDP-DOX dose, Figure 3B) as evident by IC50. Thus at 24 h, FDP-DOX reached IC50 at 12 μM while free DOX reached at the same time point an IC50 at 1.3 μM; at 72 h, FDP-DOX reached IC50 at 0.42 μM, yet free DOX reached at the same time frame an IC50 of 0.09 μM (4.7-fold more effective). More rapid and robust access of free DOX over expected lag due to desorption of FDP-DOX “payload” could explain in part this variance.
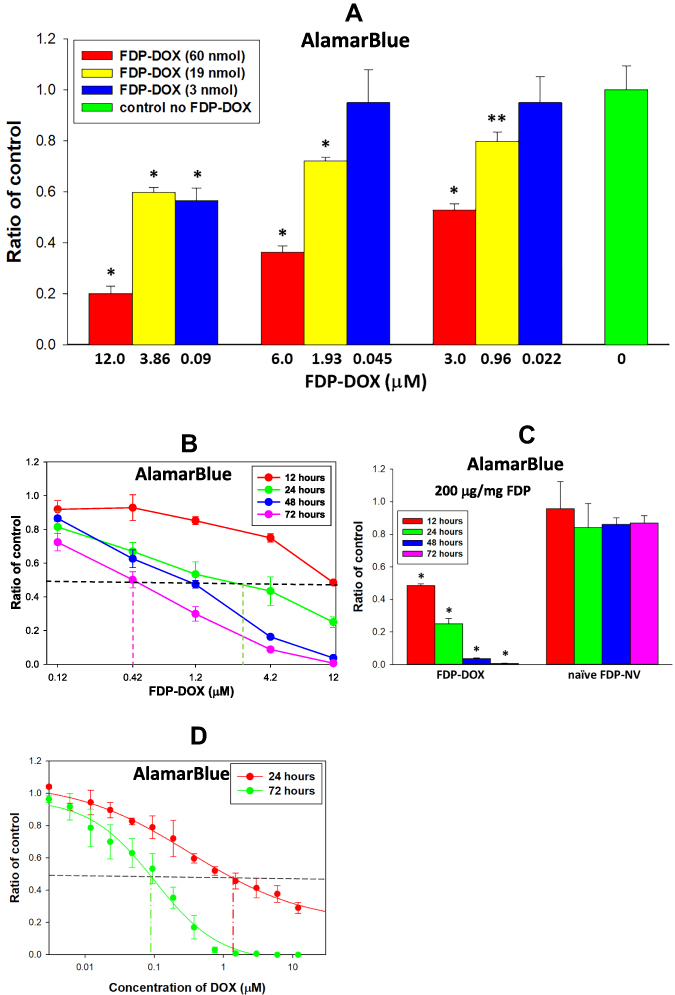 |
Figure 3 Effect of FDP-DOX, on the HepG-2 cell metabolic activity measured by AlamarBlue method. Abbreviations: FDP-NV, fluorescence diamonds particles with NV active centers; FDP-DOX, fluorescence diamonds particles with NV active centers and absorbed DOX; DOX, doxorubicin; SD, standard deviation; HepG-2, liver hepatocellular carcinoma; Ex, excitation; Em, emission. Notes: (A) HepG-2 cells were treated with FDP-DOX (of three varieties, 60, 19 and 3 nmol of DOX per mg of particles) for 24 h. Error bars represent SD from three independent experiments of triplicate samples. *P < 0.001; **P = 0.004 for comparison with control (no FDP, no DOX) in one-way ANOVA (B) HepG-2 cells were treated with FDP-DOX carrying on the surface 60 nmol of DOX per mg of particles for four-time intervals (insert). Error bars represent SD from three independent experiments of triplicate samples. Dashed vertical lines mark concentration of DOX at 50% inhibition points (IC50). IC50 for 24, 48 and 72 h were 1.92 μM, 0.92 μM and 0.42 μM respectively. (C) HepG-2 cells were treated with 200 μg/mL of FDP-DOX carrying on the surface 60 nmol of DOX per mg of particles and 200 μg/mL of naïve FDP-NV for four-time intervals. Error bars represent SD from three independent experiments of triplicate samples. *P < 0.001 for comparison with control (no FDP) in one-way ANOVA. (D) HepG-2 cells were treated with free DOX for 24 and 72 h. Error bars represent SD from three independent experiments of triplicate samples. Dashed line mark concentration of DOX at 50% inhibition (IC50). IC50 for 24 h and 72 h were 1.05 μM and 0.09 μM, respectively. Cells were incubated with AlamarBlue for 1 h, and fluorescence was measured using 485 nm Ex and 560 nm Em. |
Effect of FDP-DOX on LDH Release from HepG-2 into Culture Medium
Presence of LDH (a cytoplasmic enzyme) in cells’ culture medium is often used as a biomarker of cell membrane leakage due to irreparable damage to cells’ membrane integrity.36,37 Figure 4 presents dose-dependent effects of FDP-DOX (vis-à-vis FDP-NV) on LDH release into the culture medium by HepG-2 at 72 h. The dosing regimen was constructed by combination of varying particles’ mass and DOX loads on the particles.
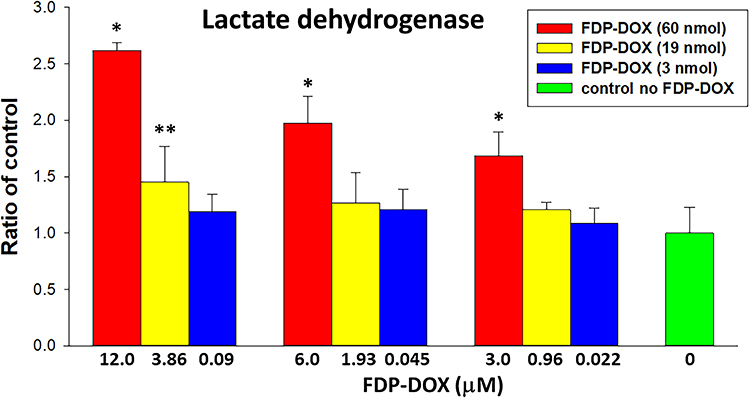 |
Figure 4 Effect of FDP-DOX on LDH release to the culture media by HepG-2 cells. Abbreviations: FDP-DOX, fluorescence diamonds particles with NV active centers and absorbed DOX; DOX, doxorubicin; HepG-2, liver hepatocellular carcinoma; LDH, lactate dehydrogenase; SD, standard deviation. Notes: HepG-2 cells were treated with FDP-DOX (variety of three doses– 60, 19 and 3 nmol of DOX per mg of particles) for 72 h. Error bars represent SD from independent triplicate experiments. *P < 0.001; **P = 0.015 compared with control (no FDP-DOX; no FDP-NV) by one-way ANOVA. |
Activation by FDP-DOX of Annexin V Expression in HepG-2 Cell
Annexin V has been used as a biomarker of activation of biochemical cascades in response to stress conditions that lead to activation of death pathways in cancer.52 Annexin V has also been recognized as a biomarker of anthracycline drugs toxicities.53,54 Figure 5 presents annexin V positive immunohistochemistry of HepG-2 cells exposed to FDP-DOX at various conditions. Figure 5A and B (upper rows) present the effects of FDP-DOX-60 nmol/mg particles (at 0.1 or 0.05 mg/mL, respectively). The high dose (upper row, Figure 5A and B) virtually disrupted (fragmented and diminished) tumor clusters and elicited strong annexin V positive response by 24 h of continuous exposure to this dose. Annexin V staining was accentuated by a red-light filter (right column in each row). Lower doses (Figure 5A and B, 19 nmol/mg, middle rows) manifest strong annexin V signal but lesser impact on cluster size. Remnants circumvented by yellow arrowheads attempt to define the external surface of these remnants. FDP-NV (Figure 5A and B, lower row) had no impact on HepG-2 cluster morphology nor were annexin V positive cells identified. The lowest payload dose, 3 nmol/mg had minimal effect (data not shown). Our data are in accord with previous publications using anthracycline compounds, yet none used FDP-NV-700/800nm size and composition.
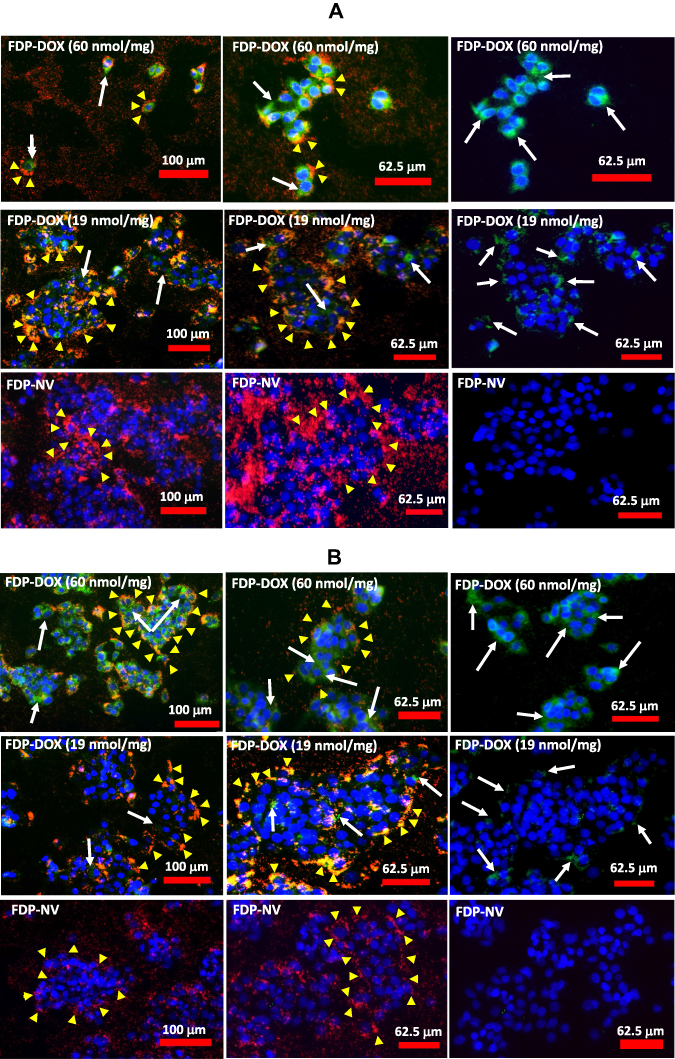 |
Figure 5 Effect of FDP-DOX and FDP-NV on the induction of apoptosis in HepG-2 cells detected by binding of FITC-annexin V and imaged with fluorescence microscope. Abbreviations: FDP-NV, fluorescence diamonds particles with NV active centers; FDP-DOX, fluorescence diamonds particles with NV active centers and absorbed DOX; DOX, doxorubicin; HepG-2, liver hepatocellular carcinoma; FITC, fluorescein isothiocyanate; DAPI, 4ʹ,6-diamidino-2-phenylindole. Notes: HepG-2 cells were treated with FDP-DOX or naïve FDP-NV at concentration of 0.1 mg/mL (A), or 0.05 mg/mL (B) for 24 h. FDP-DOX with respective amounts of adsorbed DOX (nmol/mg) are indicated on the panels, presenting on the top rows 60 nmol of DOX absorbed per mg of FDP, on the middle rows 19 nmol per mg of FDP and on the bottom rows naïve FDP without DOX. Cells were treated with FITC-annexin V and imaged under fluorescence microscope (Olympus IX81) with 10x objective. Left and middle columns of panes represent triple color (green-annexin V, blue-DAPI, red-FDP-NV) of fluorescence; right column of panels represent double (green-annexin V, and blue-DAPI) colors of fluorescence to better illustrate apoptotic cells. White arrows indicate the most positive for annexin V binding areas of cellular membranes, yellow arrowheads indicate accumulated FDP-NV in the cytoplasm. |
Effects of FDP-DOX on HepG-2 and Hep-3B DNA Damage Monitored by TUNEL
TUNEL assay has been designed to detect cells’ nuclei that underwent irreversible DNA damage indicating possible irreparable apoptotic process. In context with other biomarkers of cells’ damage (vide supra) TUNEL assay was deployed to support nuclear site of action of FDP-DOX as previously reported.55 The latter study however deployed NDP at < 10 nm (vs FDP-NV-700/800 nm). We presumed (by lack of evidence of FDP-NV or FDP-DOX identification in the nuclei) that it is unlikely that particles of the size used in our study gain access to cell-nuclei based on our microscopic (including confocal) data reported recently.56 Hence, we explored TUNEL as a biomarker for DOX reaching the nucleus as reported.57 Figure 6A presents definite positive nuclear TUNEL histochemistry in HepG-2 cells, while Figure 7 describes the same biomarker in Hep-3B cells exposed to FDP-DOX at same dosing regimens. In both cell lines high dose of FDP-DOX (60 nmol/mg, upper row) completely disrupted tumor clusters and presented strong TUNEL signal in virtually all nuclei. The medium dose (FDP-DOX-19 nmol/mg), second row in both sections presented lesser TUNEL signal, lesser cluster disruption, that was more clearly illustrated upon filtering the red emission (Figure 6A and B, right columns and Figure 7A and B right columns). The lowest dose (FDP-DOX-3 nmol) generated an inconsistent response (data not shown). Figure 6C clearly demonstrates that FDP-NV had no morphological or histochemical (TUNEL) deviations (even after red light filtered) and clusters size and phenotype remained intact. Figure 6D affirms a positive control of free DOX (upper row) and lack of TUNEL in FDP-NV exposed cells.
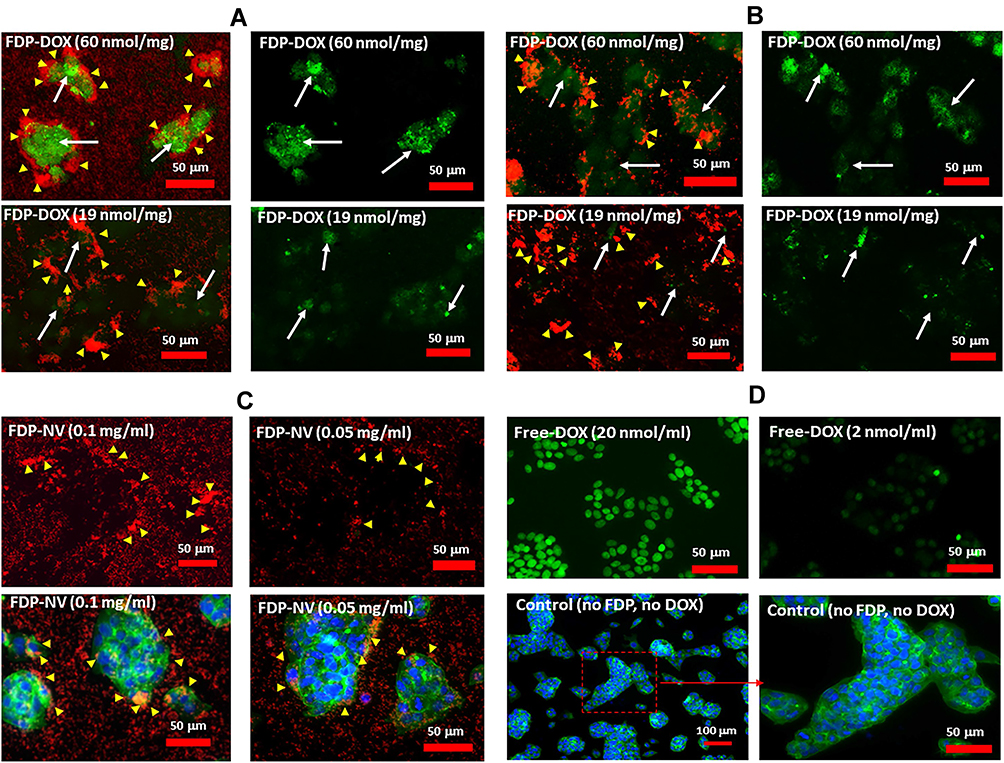 |
Figure 6 Effect of FDP-DOX and FDP-NV on the induction of apoptosis in HepG-2 cells detected by TUNEL assay in fluorescence microscopy imaging. Abbreviations: FDP-NV, fluorescence diamonds particles with NV active centers; FDP-DOX, fluorescence diamonds particles with NV active centers and absorbed DOX; DOX, doxorubicin; HepG-2, liver hepatocellular carcinoma; TUNEL, terminal deoxynucleotidyl transferase biotin-dUTP nick end labeling; FITC, fluorescein isothiocyanate; DAPI, 4ʹ,6-diamidino-2-phenylindole. Notes: HepG-2 cells were treated with FDP-NV-DOX at concentration of 0.1 mg/mL (A), or 0.05 mg/mL (B) for 24 h. FDP-DOX with respective amounts of absorbed DOX (nmol/mg) are indicated on the panels. Left panels of FDP-DOX represent double (green-TUNEL, and red-FDP-NV) colors of fluorescence; right panels of FDP-DOX represent single (green-TUNEL) color of fluorescence to better expose apoptotic nuclei. (C) Images of cells treated with naïve FDP-NV (as indicated in the images); upper panes represent double (green-TUNEL, and red-FDP-NV) colors of fluorescence; lower panels represent staining of cells’ cytoskeleton with FITC-phalloidin (green) and cell nuclei with DAPI (blue). White arrows indicate area the most positive for TUNEL, yellow arrowheads indicate accumulated FDP-NV in cellular cytoplasm. (D) Control images without FDP. Upper images represent cells treated with free-DOX with indicated concentration; bottom panels represent control cells under normal culture conditions (no FDP and free-DOX) with nuclei stained with DAPI (blue) and cytoskeleton stained with FITC-phalloidin (green). |
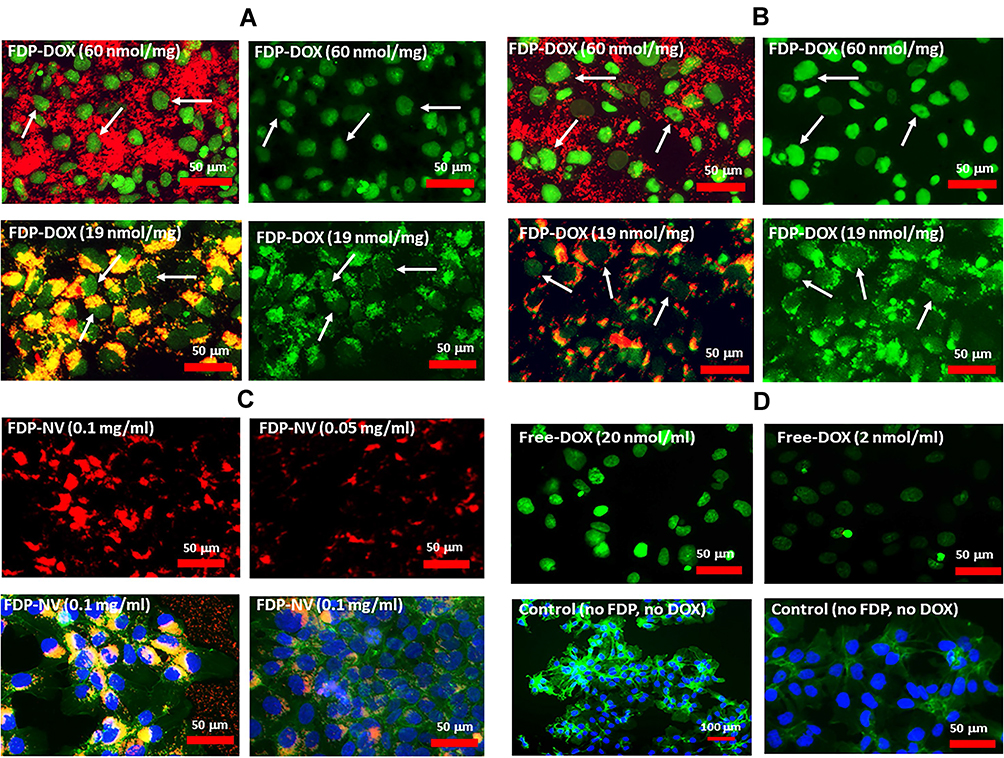 |
Figure 7 Effect of FDP-DOX and FDP-NV on induction of apoptosis in Hep-3B cells detected by TUNEL assay in fluorescence microscopy imaging. Abbreviations: FDP-NV, fluorescence diamonds particles with NV active centers; FDP-DOX, fluorescence diamonds particles with NV active centers and absorbed DOX; DOX, doxorubicin; Hep-3B, liver hepatocellular carcinoma; TUNEL, terminal deoxynucleotidyl transferase biotin-dUTP nick end labeling; FITC, fluorescein isothiocyanate; DAPI, 4ʹ,6-diamidino-2-phenylindole. Notes: Hep3-B cells were treated with FDP-NV-DOX at concentration of 0.1 mg/mL (A), or 0.05 mg/mL (B) for 24 h. FDP-DOX with respective amounts of absorbed DOX (nmol/mg) are indicated on the panels. Left panels of FDP-DOX represent double (green-TUNEL, and red-FDP-NV) colors of fluorescence; right panels of FDP-DOX represent single (green-TUNEL) color of fluorescence to better expose apoptotic nuclei. (C) Images of cells treated with naïve FDP-NV at respective concentrations listed on the images; upper panes represent double (green-TUNEL, and red-FDP-NV) colors of fluorescence; lower panels represent staining of cytoskeleton with FITC-phalloidin (green) and nuclei with DAPI (blue). White arrows indicate area the most positive for TUNEL, yellow arrowheads indicate accumulated FDP-NV in cellular cytoplasm. (D) Control images without FDP. Upper images represent cells treated with free-DOX with indicated concentration; bottom panels represent control cells under normal culture conditions (no FDP and free-DOX) with nuclei stained with DAPI (blue) and cytoskeleton stained with FITC-phalloidin (green). |
Overall, Figures 5–7 provide strong support for the efficacy and potency of FDP-DOX to eradicate cancer cells, likely by activation of apoptotic cell-death mechanisms.
Doxorubicin Distribution in Fractionated HepG-2 and Hep-3B Cell Lines Treated with Free DOX or FDP-DOX-35
The intense TUNEL staining in nuclei of HepG-2 and Hep-3B exposed to FDP-DOX-35 (vide supra and Figures 6 and 7) suggests that desorption of DOX originated in the cytoplasm in any of the intracellular organelles that generate an acidic milieu sufficient to desorb DOX off its carrier. Free DOX is then extruded from these organelles and gains access to the nuclei by diffusion. To further investigate these assumptions, we attempted to measure DOX in cells’ nuclei and cytosol of each cell line exposed to the same DOX mass either as free DOX or FDP-DOX-35. To this end, each cell line was subjected to the fractionation process at the end of the incubation with free DOX or FDP-DOX. Figure 8 asserts DOX presence in the nuclei and cytosol fractions albeit with significant quantitative disparities. The “positive control arm” (free DOX) displayed significantly lower DOX levels in both fractions compared with the FDP-DOX treated cells even though an equal amount of DOX was dispensed to the cells. We postulate that the lower levels of DOX found in the free DOX treated cells compared with the FDP-DOX treatment could be explained by simultaneous excretion of free DOX by the cells’ excretion transport mechanisms well known in the type of cells studied, yet not likely to be applied to FDP-DOX. The significantly higher levels of DOX in the nuclear fraction (both cell lines) compared with the cytosol (Figure 8A) suggest a “nuclear sink trapping” of DOX likely due to DNA intercalation.63,64 We also propose that the DOX levels in the fractions of FDP-DOX treated cells, is under-estimated; while the same mass of DOX was delivered into each of the culture wells, notable amounts of FDP-DOX actually adhere to the well’s plastic (Figures 5 and 6, high magnification) suggesting that the available mass to be taken-up by the cells must be lower for FDP-DOX compared with free DOX. Figure 8B presents a logarithmic display of DOX levels in each fraction of both cell lines, indicating that all DOX measurements were within the standard curve. Figure 8C displays a Western Blot of biomarkers of cytosol (MEK) and nuclei (Lamin A/C); this information was added to ensure that each fraction carries typical biomarkers of the respective fraction.65,66
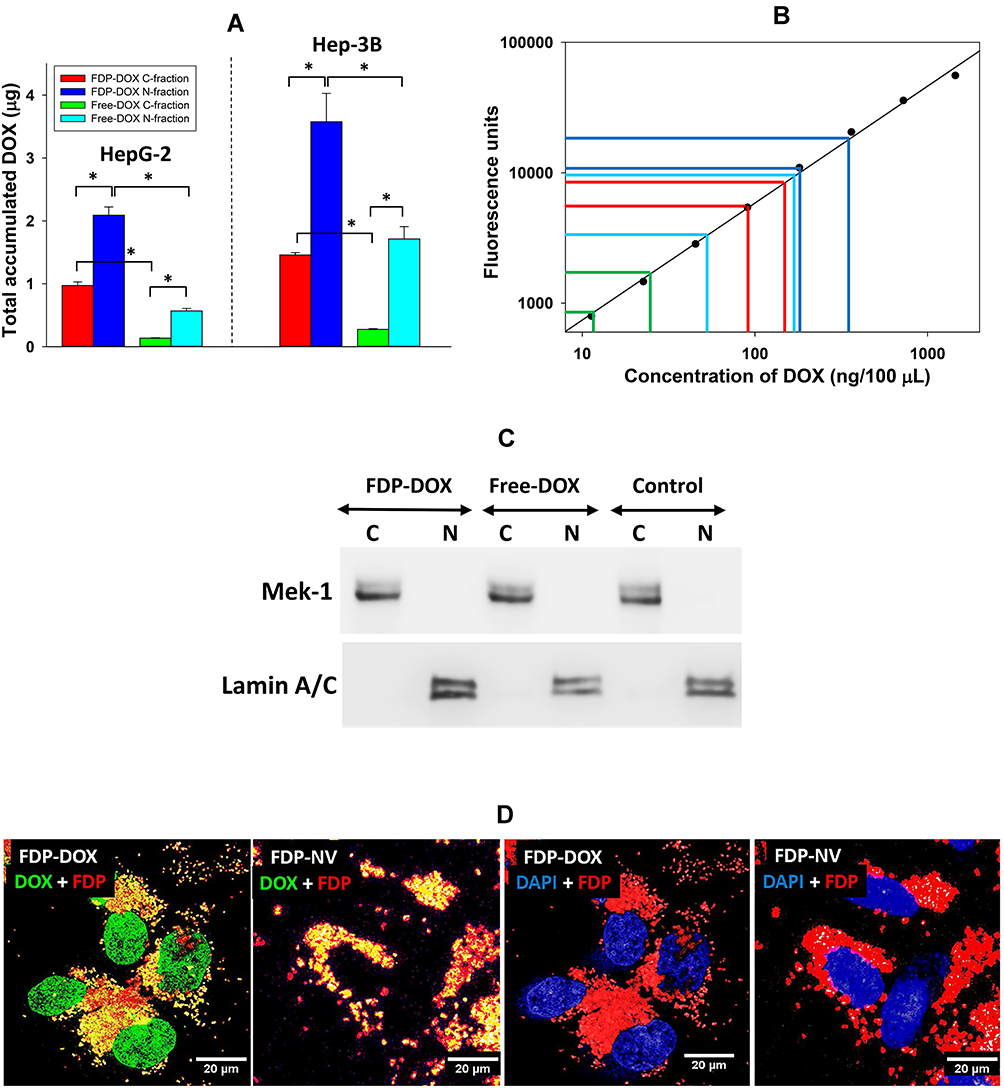 |
Figure 8 Monitoring DOX in cytoplasm and nuclei fractions of HepG-2 and Hep-3B cells following treatment with FDP-DOX or free-DOX in equal concentrations (6 μM). Abbreviations: FDP-NV, fluorescence diamonds particles with NV active centers; HepG-2 and Hep-3B, liver hepatocellular carcinoma; DOX, doxorubicin; SD, standard deviation; C, cytoplasmic fractions; N, nuclear fractions. Notes: (A) Quantification of DOX in cytoplasm and nuclei fractions after 24 h of cells exposure to 17.5 μg of DOX delivered in the free form or attached to the FDP as a carrier in 0.5 mL. Error bars represent SD from independent triplicates. *P < 0.001 in one-way ANOVA. (B) Evidence that DOX levels measured in each fraction from either cell line were within the standard curve where each color represents bars in (A). (C) Verification of separation of cytoplasm and nuclei fractions from HepG-2 cells by Western blot. Anti-Mek-1 antibody was used for the cytoplasmic fractions, anti-Lamin A/C was used for detection of nuclear fractions. Control represents fractionated cells treated with media only (no FDP-DOX, no free-DOX). (D) Confocal images of Hep-3B cells treated with FDP-DOX or FDP-NV. Cells were treated with FDP for 24 h and imaged under confocal microscope using 60x oil objective. DOX was visualized using 488 nm excitation and 541–591 nm emission (green); FDP 543 nm excitation and 655–755 nm emission (red); nuclei were visualized using DAPI filters (blue). |
The presence of DOX in the nuclei of cell treated with FDP-DOX was confirmed by confocal microscopy imaging (Figure 8D). Similar to the fractionation results, DOX released from FDP-DOX diffuses into nuclei where it was detected by fluorescence typical for this taxanes, marked by green fluorescence (Figure 8D). The nuclei of cell treated with the naïve FDP-NV showed no DOX staining.
FDP-DOX Uptake and Pharmacodynamics in Human Metastatic Colorectal Organoids
Patient-Derived Tumor (PDT) organoids are recognized as important preclinical model-systems for cancer research since they recapitulate the diversity of the primary patient-tumors. Organoids provide preclinical phenocopying of tumor progression, acquisition of resistance to therapy, and response to treatment.67–69 We have chosen colorectal cancer since this is a highly prevalent human cancer that has strong propensity to metastasize to the liver.33,70,71.
Figure 9 presents experiments conducted with PDT colorectal cancer (18SH112T) organoids according to published reports (vide supra Methods section). The organoids were exposed to FDP-DOX-35, or FDP-NV, or sham control (PBS) over 4 days under gentle motion. AlamarBlue (AB) fluorescent assay was deployed as described for HepG-2 liver cancer cell line.48 Figure 9A depicts a summary of three independent experiments indicating 85% reduction of AB fluorescence, a biomarker of metabolic and proliferative distress (vide supra). Thus, the organoids’ response to FDP-DOX-35 is in accordance with HepG-2 response. Figure 9B provides representative visuals of organoids (upper panel) in the presence of FDP-NV compared with organoids exposed to FDP-DOX-35 (lower panel) that fit necrotic phenotype. Figure 9C depicts dose-response exposure to FDP-NV (lower panel) or FDP-DOX (upper panel) indicating high toxicity of FDP-DOX-35 across the dose-response to the lowest exposure level of 1 μg/mL where remnants of small organoids are present among mostly debris of necrotic organoids.
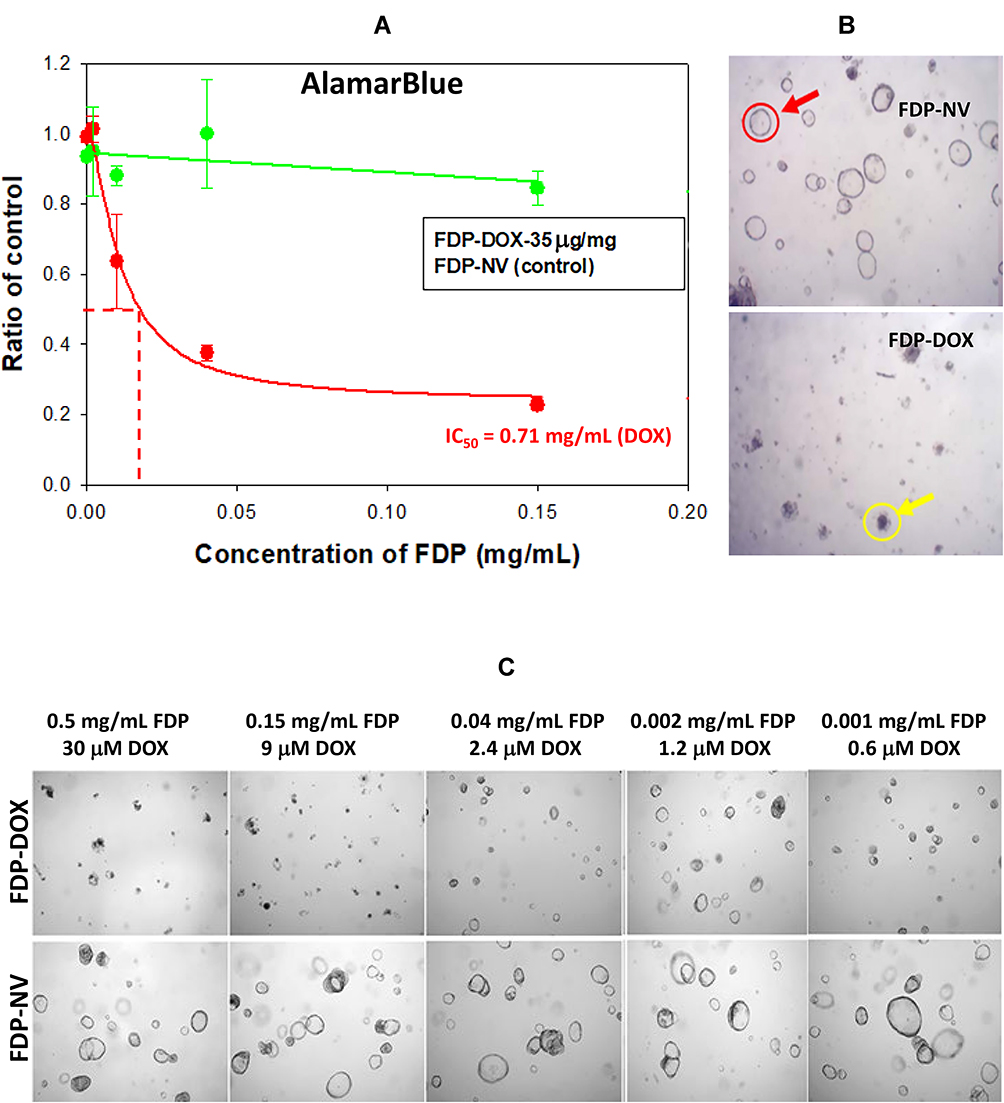 |
Figure 9 Effect of FDP-DOX and naïve FDP-NV on hCRC organoid (induced by 18SH112T cell line) metabolism and morphology. Abbreviations: FDP-NV, fluorescence diamonds particles with NV active centers; DOX, doxorubicin; hCRC, human colorectal cancer; SD, standard deviation. Notes: (A) Graph represent effect of FDP-DOX (35 μg/mg particles of absorbed DOX) and naïve FDP-NV on metabolic activity of organoids measured by AlamarBlue method. Error bars represent SD from three experiments (N = 3). (B) Images of organoids treated with FDP-DOX and naïve FDP-NV. Red circle indicates normal organoid; yellow circle indicates organoid affected by DOX. (C) Representative images of hCRC (18SH112T) organoids treated with different doses of FDP-DOX and naïve FDP-NV. Doses of FDP and associated with the molar concentration of DOX are presented above the images. |
Figure 10 provides flow cytometric analysis of uptake of FDP-DOX and FDP-NV in the hCRC organoids and demonstrates the efficient uptake of particles in greater than 50% of hCRC organoid cells by 24–48 h post-treatment. These results, using patient-derived colorectal cancer organoids, confirm the uptake and anti-cancer properties of FDP-DOX under more relevant physiological conditions.
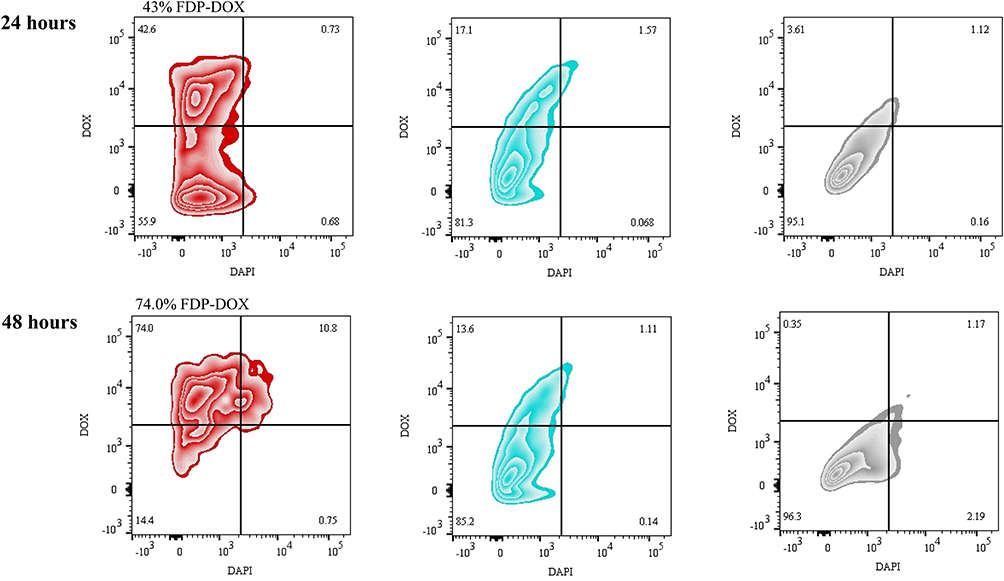 |
Figure 10 Temporal flow cytometry analysis of FDP-DOX and FDP-NV uptake by hCRC organoids (induced by 18SH112T cell line). Abbreviations: FDP-NV, fluorescence diamonds particles with NV active centers; DOX, doxorubicin; hCRC, human colorectal cancer. Notes: Flow cytometry “heat plots” show hCRC organoid 18SH112T cells treated with FDP-DOX particles (red), FDP-NV (blue) or PBS control (grey) for 24 h or 48 h. Cells were measured by viability (DAPI staining, 450 nm channel) and doxorubicin positivity (586 nm channel). Viable cells excluding DAPI dye are depicted in the lower two quadrants while doxorubicin positive cells are depicted in the right-most quadrants. |
Discussion
The primary objective of this study was to explore the prospect of FDP-NV-700/800nm (FDP-NV) to serve as a suitable carrier of anti-cancer drugs for treatment of metastatic liver cancers. The premise of this proposition stems from our recent observations on exceptionally fast and robust uptake of naïve FDP-NV by the liver following systemic injection in rats and mice along with excellent biocompatibility as evident by preservation of liver anatomy, histology, liver function tests and lack of specific histopathology.25–27
Our strategy for realizing the overall objective has been built on the cardinal elements that led to the development and registration of Doxil®/CaelyxTM (liposome modified DOX carriers) which won clinical registration for lesser adverse (mainly cardiac) effects while maintaining acceptable efficacy.36,38,39,72 Yet, the scope of utility of these drugs still nests mostly on partial improvement in safety, reserving opportunities for superior carriers to further the safety and efficacy profile. Furthermore, none of the liposome (or polymers) carriers of anthracyclines is registered for the indication of interest to the authors, the late stages of liver metastasis (Phase III–IV) of the disease. Prominent in this regard are the prospect of FDP-DOX to provide imaging of the targeted liver tumors via extracorporeal NIR scanning that guides response (or lack of) to treatment.
The short residency time of FDP-NV in the circulation (vs prolonged Doxil®/CaelyxTM pharmacokinetics due to PEGylation), should serve to further FDP-DOX specificity (for liver malignancies) and lesser “off target” toxicology compared with the contemporary medicines, Doxil®/CaelyxTM.
Several critical domains have been pursued to verify FDP-NV as a suitable carrier for DOX via a series of in vitro pilot studies as preludes to in vivo testing: A. Selection and characterization of the therapeutic “payload” (DOX), by detailing adsorption capacities and desorption kinetics; B. Validation access and pharmacodynamics of FDP-DOX in liver cancer cells and human CRC organoids; C. Demonstrated dose and time-dependent pharmacodynamics responses; D. Proven access of free DOX to cells’ nuclei – a cardinal “proof of concept” for FDP-DOX mechanism of action since the carrier (FDP-NV) is not expected to cross the nuclear membrane for size limitation; E. Elucidated likely mechanism(s) of actions of DOX via vetted biomarkers of metabolic and cell survival/death pathways such as apoptosis.
Experiments performed in each of these core tasks asserted efficient and effective anti-cancer capabilities of FDP-DOX as follows: A. Successful adsorption of FDP-NV by DOX, and detailing desorption kinetics under various conditions; B. FDP-DOX internalization (dose and time dependent) by each of the liver cancer cell-lines and the PDT hCRC organoids. In liver cancer cells, heavy agglomeration of FDP-DOX around the nuclei (Figures 5–7), in the form of a corona, suggest possible direct and/or indirect interference in nuclear-cytoplasm exchanges; C. Pharmacodynamic consequences to FDP-DOX exposure demonstrated dose and time-dependent inhibition of essential metabolic functions (AB assay, Figure 3), disruption of cells’ membrane integrity (LDH assay, Figure 4); D. Biomarkers of cells’ death (e.g., apoptosis) marked by known biomarkers, annexin V (Figure 5), and DNA damage (TUNEL, Figures 6 and 7). The consistency of FDP-DOX action in both liver cancer cell-lines and hCRC organoids highlights the translational potential of employing FDP-DOX particles in the clinical setting.
Taken together, our data are in accord with published studies referenced across the manuscript, where DOX and other “taxanes” (e.g., daunorubicin, epirubicin, paclitaxel) share the same directional actions as FDP-DOX. Experimental studies with nanoparticles provide further support even though not yet vetted in clinical development.42,73 Of the latter studies, none had practiced large FDP-NV, and none has tested similar indications such as liver cancer metastasis. We conclude that our experiments so far provide strong incentives to proceed with in vivo studies to test FDP-DOX worthiness for further development.
Summary
The authors take the position that the in vitro data presented in this manuscript fulfill proof-of-concept on the efficacy prospect of FDP-DOX, which are in accord with peer-reviewed reports using a variety of “taxanes” and carriers dissimilar to FDP-DOX. Our data support the potential for FDP-DOX to match (as a minimum) or exceed that of Doxil®/CaelyxTM for its oncological indications. The latter expectation builds on perceived advantages of the carrier FDP-NV-700/800 nm over liposomes and polymeric constructs, which still harbor limitations in respect to pharmacokinetic, systemic residual “off target” events, immune response (e.g., anti-PEG antibodies) that marginalize safety benefits besides lacking target imaging (Theranostics) prospects. FDP-DOX is expected to deliver its “cargo” in a highly preferential manner, display agnostic interactions in biological milieu while offering long-term biocompatibility.64–66 In summation, the novel construct of larger FDP carrying DOX (and likely other anthracyclines) is a promising candidate for development toward clinical proof-of-concept studies and ultimately improve the medical benefits of taxanes-carried compounds beyond those currently used in medical practice.67
Disclosure
Cezary Marcinkiewicz, Mark Sternberg, and Giora Z Feuerstein are employees of Debina Diagnostics Inc. Marco Torelli and Olga Shenderova are employees of Adámas Nanotechnologies, Inc. Dr Ron Firestein reports grants from Debina Diagnostics Inc, during the conduct of the study. The authors report no other conflict of interest in conducting this work.
References
1. van der Laan KJ, Hasani M, Zheng T, Schirhagl R. Nanodiamonds for in vivo applications. Small. 2018;14(19):e1703838. doi:10.1002/smll.201703838
2. Mochalin VN, Shenderova O, Ho D, Gogotsi Y. The properties and applications of nanodiamonds. Nat Nanotechnol. 2011;7(1):11–23. doi:10.1038/nnano.2011.209
3. Gibson NM, Luo TJM, Shenderova O, Koscheev AP, Brenner DW. Electrostatically mediated adsorption by nanodiamond and nanocarbon particles. J Nanopart Res. 2012;14(3):1–12. doi:10.1007/s11051-011-0700-9
4. Chipaux M, van der Laan KJ, Hemelaar SR, Hasani M, Zheng T, Schirhagl R. Nanodiamonds and their applications in cells. Small. 2018;14(24):e1704263. doi:10.1002/smll.201704263
5. Etheridge ML, Campbell SA, Erdman AG, Haynes CL, Wolf SM, McCullough J. The big picture on nanomedicine: the state of investigational and approved nanomedicine products. Nanomedicine. 2013;9(1):1–14. doi:10.1016/j.nano.2012.05.013
6. Turcheniuk K, Mochalin VN. Biomedical applications of nanodiamond (Review). Nanotechnology. 2017;28(25):252001. doi:10.1088/1361-6528/aa6ae4
7. Chow EK, Zhang XQ, Chen M, et al. Nanodiamond therapeutic delivery agents mediate enhanced chemo resistant tumor treatment. Sci Transl Med. 2011;3(73):73ra21. doi:10.1126/scitranslmed.3001713
8. Farjadian F, Ghasemi A, Gohari O, Roointan A, Karimi M, Hamblin MR. Nanopharmaceuticals and nanomedicines currently on the market: challenges and opportunities. Nanomedicine. 2019;14(1):93–126. doi:10.2217/nnm-2018-0120
9. Pelaz B, Alexiou C, Alvarez-Puebla RA, et al. Diverse application of nanomedicine. ACS Nano. 2017;11(3):2313–2381.
10. Shi J, Kantoff PE, Wooster R, Farokhzad OC. Cancer nanomedicine: progress, challenges and opportunities. Nat Rev Cancer. 2017;17(1):20–37.
11. Baetke SC, Lammers T, Kiessling F. Applications of nanoparticles for diagnosis and therapy of cancer. Br J Radiol. 2015;88(1054):20150207. doi:10.1259/bjr.20150207
12. Wicki A, Witzigmann D, Balasubramanian V, Huwyler J. Nanomedicine in cancer therapy: challenges, opportunities, and clinical applications. J Control Release. 2015;200:138–157.
13. van der Meel R, Sulheim E, Shi Y, Kiessling F, Mulder WJM, Lammers T. Smart cancer nanomedicine. Nat Nanotechnol. 2019;14(11):1007–1017. doi:10.1038/s41565-019-0567-y
14. Ashfaq UA, Riaz M, Yasmeen E, Yousaf MZ. Recent advances in nanoparticle-based targeted drug-delivery systems against cancer and role of tumor microenvironment. Crit Rev Ther Drug Carrier Syst. 2017;34(4):317–353. doi:10.1615/CritRevTherDrugCarrierSyst.2017017845
15. Soudy R, Byeon N, Raghuwanshi Y, Ahmed S, Lavasanifar A, Kaur K. Engineered peptides for applications in cancer-targeted drug delivery and tumor detection. Mini Rev Med Chem. 2017;17(18):1696–1712. doi:10.2174/1389557516666160219121836
16. Palazzolo S, Bayda S, Hadla M, et al. The Clinical translation of organic nanomaterials for cancer therapy: a focus on polymeric nanoparticles, micelles, liposomes and exosomes. Curr Med Chem. 2018;25(34):4224–4268. doi:10.2174/0929867324666170830113755
17. Pastorino F, Di Paolo D, Piccardi F, et al. Enhanced antitumor efficacy of clinical-grade vasculature-targeted liposomal doxorubicin. Clin Cancer Res. 2008;14(22):7320–7329. doi:10.1158/1078-0432.CCR-08-0804
18. Bernabeua E, Helguera G, Legaspia MJ, et al. Paclitaxel-loaded PCL–TPGS nanoparticles: in vitro and in vivo performance compared with Abraxane®. Colloids Surf B Biointerfaces. 2014;113:43–50. doi:10.1016/j.colsurfb.2013.07.036
19. Arranja AG, Pathak V, Lammers T, Shi Y. Tumor-targeted nanomedicines for cancer theranostics. Pharmacol Res. 2017;115:87–95. doi:10.1016/j.phrs.2016.11.014
20. Reineck P, Francis A, Orth A, et al. Brightness and photostability of emerging red and near-IR fluorescent nanomaterials for bioimaging. Adv Opt Mater. 2016;4(10):1549–1557. doi:10.1002/adom.201600212
21. Sigaeva A, Hamoh T, Perona F, Schirhagl R. Fluorescent nanodiamonds: potential free radical detectors in live cells. Free Radic Biol Med. 2018;120:S87. doi:10.1016/j.freeradbiomed.2018.04.288
22. Vaijayanthimala V, Cheng PY, Yeh SH, et al. The long-term stability, and biocompatibility of fluorescent nanodiamond as an in vivo contrast agent. Biomaterials. 2012;33(31):7794–7802. doi:10.1016/j.biomaterials.2012.06.084
23. Lv X, Walton J, Druga E, et al. Background-free dual-mode optical and 13C magnetic resonance imaging in diamond particles. Proc Natl Acad Sci USA. 2021;118(21):e2023579118. doi:10.1073/pnas.2023579118
24. Su LJ, Wu MS, Hui YY, et al. Fluorescent nanodiamonds enable quantitative tracking of human mesenchymal stem cells in miniature pigs. Sci Rep. 2017;7:45607. doi:10.1038/srep45607
25. Barone FC, Marcinkiewicz CM, Li J, et al. Pilot study on biocompatibility of fluorescent nanodiamond-(NV)-Z~800 particles in rats: safety, pharmacokinetics, and bio-distribution (part III). Int J Nanomedicine. 2018;13:5449–5468. doi:10.2147/IJN.S171117
26. Barone FC, Marcinkiewicz C, Li J, et al. Long-Term biocompatibility of fluorescent diamonds-(NV)-Z~800nm in rats: survival, morbidity, histopathology and particles distribution and excretion studies (Part IV). Int J Nanomedicine. 2019;14:1163–1175. doi:10.2147/IJN.S189048
27. Gerstenhaber JA, Marcinkiewicz C, Barone FC, Sternberg M, Lelkes PI, Feuerstein GZ. Biocompatibility studies of fluorescent diamond particles-(NV)~800nm (Part V): in vitro kinetics and in vivo localization in rat liver following long term exposure. Int J Nanomedicine. 2019;14:6451–6464. doi:10.2147/IJN.S209663
28. Moore L, Grobarova V, Shen H, et al. Comprehensive interrogation of the cellular response to fluorescent, detonation and functionalized nanodiamonds. Nanoscale. 2014;6(20):11712–11721. doi:10.1039/C4NR02570A
29. Moore L, Yang J, Lan THL, et al. Biocompatibility assessment of detonation nanodiamonds in non-human primates and rats using histological, hematologic, and urine analysis. ACS Nano. 2016;10(8):7385–7400. doi:10.1021/acsnano.6b00839
30. Hong SB, Choi SH, Kim KW, et al. Diagnostic performance of [18 F]FDG-PET/MRI for liver metastasis in patients with primary malignancy: a systematic review and meta-analysis. Eur Radiol. 2019;29(7):3553–3563. doi:10.1007/s00330-018-5909-x
31. Clark AM, Ma B, Taylor DL, Griffith L, Wells A. Liver metastases: microenvironments and ex-vivo models. Exp Biol Med. 2016;241(15):1639–1652. doi:10.1177/1535370216658144
32. Keirsse J, Van Damme H, Geeraerts X, Beschin A, Raes G, Van Ginderachter JA. The role of hepatic macrophages in liver metastasis. Cell Immunol. 2018;330:202–215. doi:10.1016/j.cellimm.2018.03.010
33. Tauriello DVF, Calon A, Lonardo E, Batlle E. Determinants of metastatic competency in colorectal cancer. Mol Onclo. 2017;11(1):97–119. doi:10.1002/1878-0261.12018
34. Pramanik A, Garg S. Design of diffusion-controlled drug delivery devices for controlled release of Paclitaxel. Chem Biol Drug Des. 2019;94(2):1478–1487.
35. Zhao Z, Li D, Wu Z, Wang Q, Ma Z, Zhang C. Research progress and prospect of nanoplatforms treatment of oral cancer. Front Pharmacol. 2020;11:616101. doi:10.3389/fphar.2020.616101
36. Barenholz Y. Doxil®–the first FDA-approved nano-drug: lesson learned. J Control Release. 2012;162(2):117–134. doi:10.1016/j.jconrel.2012.03.020
37. Shafei A, El-Bakly W, Sobhy A, et al. A review on the efficacy and toxicity of different doxorubicin nanoparticles for targeted therapy in metastatic breast cancer. Biomed Pharmacother. 2017;951:1209–1218. doi:10.1016/j.biopha.2017.09.059
38. Navashenaq JG, Zamani P, Nikpoor AR, Tavakkol-Afshari J, Jaafari MR. Doxil chemotherapy plus liposomal P5 immunotherapy decreased myeloid-derived suppressor cells in murine model of breast cancer. Nanomedicine. 2020;24:102150. doi:10.1016/j.nano.2020.102150
39. Das S, Ciombor KK, Haraldsdottir H, Goldberg RM. Promising new agents, for colorectal cancer. Curr Treat Options Oncol. 2018;19(6):29. doi:10.1007/s11864-018-0543-z
40. Chen M, Pierstorff ED, Lam R, et al. Nanodiamond-mediated delivery of water-insoluble therapeutics. ACS Nano. 2009;3(7):2016–2022. doi:10.1021/nn900480m
41. Wang X, Low XC, Hou W, et al. Epirubicin-adsorbed nanodiamonds kill chemoresistant hepatic cancer stem cells. ACS Nano. 2014;8(12):12151–12166. doi:10.1021/nn503491e
42. Li Y, Tong Y, Cao R, Tian Z, Yang B, Yang P. In vivo enhancement of anticancer therapy using bare or chemotherapeutic drug-bearing nanodiamond particles. Int J Nanomedicine. 2014;9:1065–1082. doi:10.2147/IJN.S54864
43. Xiao J, Duan X, Yin Q, Zhang Z, Yu H, Li Y. Nanodiamonds-mediated doxorubicin nuclear delivery to inhibit lung metastasis of breast cancer. Biomaterials. 2013;34(37):9648–9656. doi:10.1016/j.biomaterials.2013.08.056
44. Man HB, Kim H, Kim HJ, et al. Synthesis of nanodiamond-daunorubicin conjugates to overcome multidrug chemoresistance in leukemia. Nanomedicine. 2014;10(2):359–369. doi:10.1016/j.nano.2013.07.014
45. Zhang XQ, Lam R, Xu X, Chow EK, Kim HJ, Ho D. Multimodal nanodiamond drug delivery carriers for selective targeting, imaging, and enhanced chemotherapeutic efficacy. Adv Mater. 2011;23(41):4770–4775. doi:10.1002/adma.201102263
46. Wang Y, Yang ST, Wang Y, Liu Y, Wang H. Adsorption and desorption of doxorubicin on oxidized carbon nanotubes. Colloids Surf B Biointerfaces. 2012;97:62–69. doi:10.1016/j.colsurfb.2012.04.013
47. Yan J, Guo Y, Altawashi A, Moosa B, Lecommandoux S, Khashab NM. Experimental and theoretical evaluation of nanodiamonds as pH triggered drug carriers. New J Chem. 2012;36(7):1479–1484. doi:10.1039/c2nj40226b
48. Rampersad SN. Multiple applications of Alamar Blue as an indicator of metabolic function and cellular health in cell viability bioassays. Sensors. 2012;12(9):12347–12360. doi:10.3390/s120912347
49. van Tonder A, Joubert AM, Cromarty AD. Limitations of the 3-(4,5-dimethylthiazol-2-yl)-2,5-diphenyl-2H-tetrazolium bromide (MTT) assay when compared to three commonly used cell enumeration assays. BMC Res Notes. 2015;8:47. doi:10.1186/s13104-015-1000-8
50. Kaja S, Payne AJ, Naumchuk Y, Koulen P. Quantification of lactate dehydrogenase for cell viability testing using cell lines and primary cultured astrocytes. Curr Protoc Toxicol. 2017;72:
51. Forkasiewicz A, Dorociak M, Stach K, Szelachowski P, Tabola R, Augoff K. The usefulness of lactate dehydrogenase measurements in current oncological practice. Cell Mol Biol Lett. 2020;25:35. doi:10.1186/s11658-020-00228-7
52. Crowley LC, Marfell BJ, Scott AP, Waterhouse NJ. Quantitation of apoptosis and necrosis by annexin V binding, propidium iodide uptake, and flow cytometry. Cold Spring Harb Protoc. 2016;2016(11):pdb–rot087288.
53. Kupcho K, Shultz J, Hurst R, et al. A real-time, bioluminescent annexin V assay for the assessment of apoptosis. Apoptosis. 2019;24(1–2):184–197. doi:10.1007/s10495-018-1502-7
54. Hu S, Kiesewetter DO, Zhu L, et al. Longitudinal PET imaging of doxorubicin induced cell death with 18F-Annexin V. Mol Imaging Biol. 2012;14(6):762–770. doi:10.1007/s11307-012-0551-5
55. Kyrylkova K, Kyryachenko S, Leid M, Kioussi C. Detection of apoptosis by TUNEL assay. Methods Mol Biol. 2012;887:41–47.
56. Kabakov AE, Gabai V. Cell death and survival assays. Methods Mol Biol. 2018;1709:107–127.
57. Majtnerova M, Rousar T. An overview of apoptosis assays detecting DNA fragmentation. Mol Biol Rep. 2018;45(5):1469–1478. doi:10.1007/s11033-018-4258-9
58. Abmayr SM, Yao T, Parmely T, Workman JL. Preparation of nuclear and cytoplasmic extracts from mammalian cells. Curr Protoc Mol Biol. 2006;12:
59. Sato T, Stange DE, Ferrante M, et al. Long-term expansion of epithelial organoids from human colon, adenoma, adenocarcinoma, and Barrett’s epithelium. Gastroenterology. 2011;141(5):1762–1772. doi:10.1053/j.gastro.2011.07.050
60. Laptinskiy K, Vervald E, Bokarev A, et al. Adsorption of DNA nitrogenous bases on nanodiamond particles: theory and experiment. J Phys Chem C. 2018;122(20):11066–11075. doi:10.1021/acs.jpcc.7b12618
61. Mindell JA. Lysosomal acidification mechanisms. Annu Rev Physiol. 2012;74:69–86. doi:10.1146/annurev-physiol-012110-142317
62. Miret S, De Groene EM, Klaffke W. Comparison of in vitro assays of cellular toxicity in the human hepatic cell line HepG2. J Biomol Screen. 2006;11(2):184–193. doi:10.1177/1087057105283787
63. Silva EF, Bazoni RF, Ramos EB, Rocha MS. DNA-doxorubicin interaction: new insights and peculiarities. Biopolymers. 2017;107(3):e22998. doi:10.1002/bip.22998
64. Jawad B, Poudel L, Podgornik R, Steinmetz NF, Ching WY. Molecular mechanism and binding free energy of doxorubicin intercalation in DNA. Phys Chem Chem Phys. 2019;21(7):3877–3893. doi:10.1039/C8CP06776G
65. Zheng CF, Guan KL. Cytoplasmic localization of the mitogen-activated protein kinase activator MEK. J Biol Chem. 1994;269(31):19947–19952. doi:10.1016/S0021-9258(17)32112-9
66. Li Y, Jiang X, Zhang Y, et al. Nuclear accumulation of UBC9 contributes to SUMOylation of lamin A/C and nucleophagy in response to DNA damage. J Exp Clin Cancer Res. 2019;38(1):67. doi:10.1186/s13046-019-1048-8
67. Drost J, Clevers HD. Organoids in cancer research. Nat Rev Cancer. 2018;18(7):407–418. doi:10.1038/s41568-018-0007-6
68. Gao D, Vela I, Sboner A, et al. Organoid cultures derived from patients with advanced prostate cancer. Cell. 2014;159(1):176–187. doi:10.1016/j.cell.2014.08.016
69. Bleijs M, van de Wetering M, Clevers H, Drost J. Xenograft and organoid model systems in cancer research. EMBO J. 2019;38(15):e101654. doi:10.15252/embj.2019101654
70. Stoffel EM, Murphy CC. Epidemiology and mechanisms of the increasing incidence of colon and rectal cancers in young adults. Gastroenterology. 2020;158(2):341–353. doi:10.1053/j.gastro.2019.07.055
71. Zacharakis M, Xynos ID, Lazaris A, et al. Predictors of survival in stage IV metastatic colorectal cancer. Anticancer Res. 2010;30(2):653–660.
72. Wei X, Shamrakov D, Nudelman S, et al. Cardinal role of intraliposome doxorubicin-sulfate nanorod crystal in doxil properties and performance. ACS Omega. 2018;3(3):2508–2517. doi:10.1021/acsomega.7b01235
73. Li YQ, Zhou XP, Wang DX, Yang BS, Yang P. Nanodiamond mediated delivery of chemotherapeutic drugs. J Mater Chem. 2011;21:16406–16412. doi:10.1039/c1jm10926j
 © 2021 The Author(s). This work is published and licensed by Dove Medical Press Limited. The full terms of this license are available at https://www.dovepress.com/terms.php and incorporate the Creative Commons Attribution - Non Commercial (unported, v3.0) License.
By accessing the work you hereby accept the Terms. Non-commercial uses of the work are permitted without any further permission from Dove Medical Press Limited, provided the work is properly attributed. For permission for commercial use of this work, please see paragraphs 4.2 and 5 of our Terms.
© 2021 The Author(s). This work is published and licensed by Dove Medical Press Limited. The full terms of this license are available at https://www.dovepress.com/terms.php and incorporate the Creative Commons Attribution - Non Commercial (unported, v3.0) License.
By accessing the work you hereby accept the Terms. Non-commercial uses of the work are permitted without any further permission from Dove Medical Press Limited, provided the work is properly attributed. For permission for commercial use of this work, please see paragraphs 4.2 and 5 of our Terms.