")
Back to Journals » Clinical Ophthalmology » Volume 13
Peripapillary Vessel Density In Unilateral Preperimetric Glaucoma
Authors Mangouritsas G, Koutropoulou N, Ragkousis A , Boutouri E , Diagourtas A
Received 25 July 2019
Accepted for publication 18 October 2019
Published 13 December 2019 Volume 2019:13 Pages 2511—2519
DOI https://doi.org/10.2147/OPTH.S224757
Checked for plagiarism Yes
Review by Single anonymous peer review
Peer reviewer comments 2
Editor who approved publication: Dr Scott Fraser
G Mangouritsas,1 N Koutropoulou,1 A Ragkousis,1 E Boutouri,1 A Diagourtas2
1Eye Clinic, General Hospital ‘‘Red Cross’’, Athens, Greece; 21st University Eye Clinic, General Hospital “G. Gennimatas”, Athens, Greece
Correspondence: G Mangouritsas
Eye Clinic, General Hospital “Red Cross”, Athanasaki 2, Athens 11526, Greece
Tel +306942781166
Email [email protected]
Purpose: To investigate vessel density (VD) of radial peripapillary capillaries (RPC) and structural alterations in patients with unilateral preperimetric glaucoma (PPG) using optical coherence tomography angiography (OCTA).
Methods: This cross-sectional observational study included 13 untreated patients with unilateral PPG. PPG eyes had larger excavation and abnormal thinning of retinal nerve fiber layer (RNFL) and/or ganglion cell complex (GCC) compared with fellow eyes (F). Both RNFL and GCC thickness in F were statistically within normal limits and/or borderline. The RPC VD on optic disc (idVD), of peripapillary (ppVD) and whole image (wiVD) scan area was measured. Twenty healthy eyes (H) served as controls. Structural and vascular parameters obtained by spectral-domain OCT/OCTA (Optovue; Fremont, CA) were compared between PPG, F and H.
Results: Mean RNFL and GCC average thickness in microns differed significantly (p<0.001) between PPG (82.4±7.1, 81.4±5.9), F (91.0±7.1, 88.5±3.8) and H (103.5±6.0, 99.3±5.7). PPG compared with F showed significantly (p<0.001) lower mean ppVD (43.8%±3.0% versus 47.8%±3.2%) and wiVD (45.9%±3.5% versus 50.1%±3.9%). Mean ppVD (49.7%±2.4%) and wiVD (52.6%±3.0%) in H were not significantly higher than in F. Mean idVD showed no significant differences among the 3 groups. Areas under the receiver operating characteristic curves (AUROCs) for RNFL, GCC, ppVD and wiVD between PPG and H were excellent (>0.9). AUROCs between F and H demonstrated an excellent diagnostic ability for structural parameters and a poor one (<0.7) for vascular parameters.
Conclusion: Affected eyes of patients with unilateral PPG demonstrated significant RPC dropout. Clinically unaffected eyes showed thinner structural parameters but no significant microvasculature differences compared with non-glaucomatous eyes. Diagnostic ability of peripapillary vascular parameters was not superior to structural measurements. Microvascular dysfunction seems to be an early but not a primary event in glaucoma continuum at the stage of undetectable visual field loss. OCTA can be useful in early glaucoma diagnosis.
Keywords: optical coherence tomography angiography, glaucoma, preperimetric glaucoma, vessel density, retinal nerve fiber layer, ganglion cell complex
Introduction
The vascular component in the pathogenesis of glaucomatous optic neuropathy has been discussed for many decades.1,2 Various imaging methods have been used to explore optic nerve hemodynamics in glaucoma patients.3–5 However, they have not been established in clinical settings due to lack of accuracy and reliability. Optical coherence tomography angiography (OCTA) is a novel non-invasive technology which creates high-resolution images of the vasculature through the various layers of retina and optic nerve head (ONH).6 Specific algorithms7 implemented in OCTA devices provide visualization of the capillary network distributed in the retinal nerve fiber layer (RNFL). Quantitative analysis of the radial peripapillary capillaries (RPC) density can be delivered with high repeatability and reproducibility.8 The RPC network9 has recently emerged as a promising area in glaucoma diagnosis, management and research. Many investigators showed that OCTA parameters as vessel density or blood flow index of the RPC were reduced in glaucomatous eyes compared with normal eyes.10–19 Several studies demonstrated a strong relationship between extent of RPC drop out and severity of glaucomatous damage.13,17–23 A spatial correlation among RNFL defects, capillary attenuation and visual field loss has been found.11,14,24,25 RPC density showed a significant diagnostic ability to differentiate normal from glaucoma eyes, comparable to that of OCT.13,22,26,27 It has also been reported that peripapillary microvascular changes may precede vision field loss.11,12,19,27–30 The preperimetric stage of glaucoma, defined as nerve fiber damage without detectable defects in standard automated perimetry (SAP), remains a challenging diagnosis which could be facilitated by OCTA. However, it is still under discussion whether the assessment of RPC density could help in preperimetric glaucoma (PPG) detection.13,15,20,26–31 The aim of the present study was to investigate the vascular status of the optic disc and peripapillary area in association with the structural changes in patients with unilateral PPG.
Methods
This was a prospective cross-sectional observational study conducted in the Glaucoma Department of “Red Cross” Hospital in adherence to the tenets of the Declaration of Helsinki. The study was approved by the Scientific Review Board of the Hospital and written informed consent was obtained from the participants. Patients with untreated unilateral PPG and healthy control subjects were recruited. All eyes included had best-corrected visual acuity (BCVA) of 20/30 or better, refraction less than 3.0 diopters sphere and 2.0 diopters cylinder, open angle on gonioscopy and no corneal or retinal pathology. Patients with previous intraocular surgery, trauma or intraocular inflammation and with any systemic (i.e. diabetes, hypertension) or neurological condition that could affect the optic nerve or the visual field were excluded.
Inclusion criteria for the PPG patients were: 1) inter-eye intraocular pressure (IOP) asymmetry at all time points measured, 2) inter-eye cup to disc ratio asymmetry assessed by fundoscopy, 3) outside normal (statistically labeled red in OCT display) RNFL thickness and/or macular ganglion cell complex (GCC) parameters in the eye with higher IOP and within normal or borderline (statistically labeled green or yellow) RNFL thickness and GCC parameters in the fellow eye, and 4) visual fields (VF) labeled within normal limits or borderline. Healthy subjects had no family history of glaucoma, IOP less than 21 mmHg, normal VF test, and both RNFL and GCC parameters within normal limits.
All participants underwent comprehensive ophthalmological examination including review of medical history, BCVA, slit-lamp biomicroscopy, gonioscopy and dilated fundoscopy. Three IOP measurements were obtained by Goldmann applanation tonometry at 9.00, 13.00 and 19.00 o’clock. The highest IOP value was recorded for the analysis. Central corneal thickness was measured by ZEISS IOL master 700 (Zeiss Meditec, Inc., Dublin, CA). We performed SAP using the Swedish Interactive Threshold Algorithm (SITA Standard) 24–2 program of the Humphrey Field Analyzer (model 740). Visual fields with fixation losses <20%, false positive/negatives <15% and no rim or eyelid artifacts were considered reliable. Mean deviation (MD) and pattern standard deviation (PSD) were recorded.
Structural parameters (ONH morphology, peripapillary RNFL and macular GCC thickness) were obtained by SD-OCT (RTVue-XR Avanti, Optovue Inc. Fremont, CA, USA) using ONH and GCC scans. Scan protocols have been described in detail previously.32 The ONH scan consisted of a 10 pixel-wide band along a circle of 3.45 mm in diameter centered on the optic disc. Morphological ONH parameters (i.e. cup/disc area ratio and rim area) and RNFL thickness of eight defined sectors were calculated. The ganglion cell complex (GCC) encompasses three layers of ganglion cells in the retina: the RNFL, the ganglion cell layer and the inner-plexiform layer (IPL). The GCC thickness map covers a 6-mm-diameter area on the macula centered 1mm temporal to the fovea and comprises thickness measurement from internal limiting membrane (ILM) to IPL. Only high-quality images of a signal strength index (SSI) >50 and without segmentation failure or artifacts were accepted. Summary parameters of ONH, RNFL and GCC analysis were displayed in green, yellow or red labeled values characterizing them as within normal (p>5%), borderline (p<5%) or outside normal (p<1%), respectively. RNFL and GCC average thickness were recorded. We also documented the location of the red labeled RNFL and/or GCC thinning in the upper or lower temporal quarter of RNFL circle and/or in the superior or inferior GCC hemisphere.
We obtained OCTA images using AngioVue Software, which utilizes 840nm light source with OCT scanning speed of 70,000 A-scans per second. The optical resolution in tissue is 5 and 15 microns on axial and transverse directions, respectively. Image acquisition and processing is supported by split-spectrum amplitude-decorrelation algorithm (SSADA).6 Using an orthogonal registration algorithm the system registers a set of one vertical- and one horizontal-priority raster volumetric scan and produces a merged three-dimensional angiogram. By comparing consecutive scans at the same location the motion of red blood cells can be captured and converted to vessel delineation. Principles of instrument and technique have been described elsewhere.18 Three-dimensional visualization of retinal and ONH vasculature in slabs of various thicknesses is provided. Vascular information at each retinal layer can be displayed as an en face angiogram and a vessel density (VD) color-coded map. The VD defined as the percentage area occupied by flowing blood vessels in a specified region can be quantitatively delivered. The system’s software version 2017.1.0.151 provides capillary VD calculation excluding the major retinal vessels and taking into account the RPC network segment in the superficial slab, which extends from the ILM to the posterior boundary of the RNFL. Distortions from motion artifacts are minimized through active tracking and axial motion artifact correction in the post-processing phase. Capillary VD measurements were automatically obtained for the whole scanned area, the area inside the optic disc and the peripapillary region. Whole image vessel density (wiVD) is calculated from the entire 4.5 × 4.5 mm scan field centered on the optic disc. Inside disc vessel density (idVD) refers to the area inside an ellipse fitted to the optic disc boundary. Peripapillary vessel density (ppVD) is measured in a 0.75 mm-wide elliptical annulus extending outward from the optic disc boundary. The location of the disc margin and the foveal placement were manually adjusted if required. Images with quality <7, vitreous floaters, artifacts or segmentation failures were excluded from the analysis. The peripapillary sectors approximated the trajectory of the RNFL bundles, starting with the sector definition according to Garway Heath et al's map33 and adapted to a wider peripapillary region.34 This peripapillary annulus is divided into eight sectors and the capillary VD value in each sector is displayed. We calculated the mean VD of the two superotemporal and of the two inferotemporal sectors defined as temporal superior (TS) VD and temporal inferior (TI) VD, respectively. These supero- and inferotemporal areas were qualitatively correlated with the corresponding upper or lower abnormal peripapillary RNFL and/or GCC thickness. Measurements of peripapillary RNFL and corresponding VD areas cannot be quantitatively compared, because sector definition in OCT is different than in OCTA.
Statistical Analysis
All statistical analyses were performed with SPSS software version 23.0 (SPSS Inc., Chicago, IL, USA). The distribution of numerical data was tested for normality using the Shapiro–Wilk test and Kolmogorov–Smirnov test. Inter-eye differences between PPG and fellow eyes were evaluated using the paired-samples t-test. One-way analysis of variance (ANOVA) with Bonferroni post hoc correction was performed to adjust for multiple comparisons. We calculated the differences in functional, structural and vascular parameters among the following 3 groups: the PPG eyes, their fellow non-PPG eyes and the healthy control group. All values were presented as mean±standard deviation (SD) of the means. Areas under the receiver operating characteristic curves (AUROCs) were used to evaluate the diagnostic ability of each parameter to differentiate between glaucomatous patients and healthy subjects. An AUROC of 1.0 represents perfect discrimination, whereas an AUROC of 0.5 represents chance discrimination. For all the analyses, a value of p<0.05 was considered statistically significant.
Results
From 15 patients with unilateral PPG initially recruited, 13 patients (7 females, 6 males, mean age 69.46±4.84 years) were finally included in the study. An age-matched control group was composed of 20 healthy individuals (13 females, 7 males, mean age 65.55±5.97 years). Two patients from the PPG group were excluded due to poor quality OCTA images at least in one eye. Healthy subjects were younger than PPG patients, but this difference was not statistically significant (p=0.057). One eye of each healthy volunteer was randomly selected to be included in the analysis.
PPG eyes had a mean untreated IOP of 23.0±1.8 mm Hg. Mean IOP in fellow and healthy control eyes was 18.8±1.9 mm Hg and 15.3±2.3 mm Hg, respectively. The IOP differences among the 3 groups were statistically significant (p<0.001). Functional, structural and vascular parameters of the 3 groups are shown in Table 1. VF parameters in PPG eyes were lower but not statistically significant compared with fellow eyes. The difference of MD and PSD between PPG and healthy eyes was significant (p<0.01).
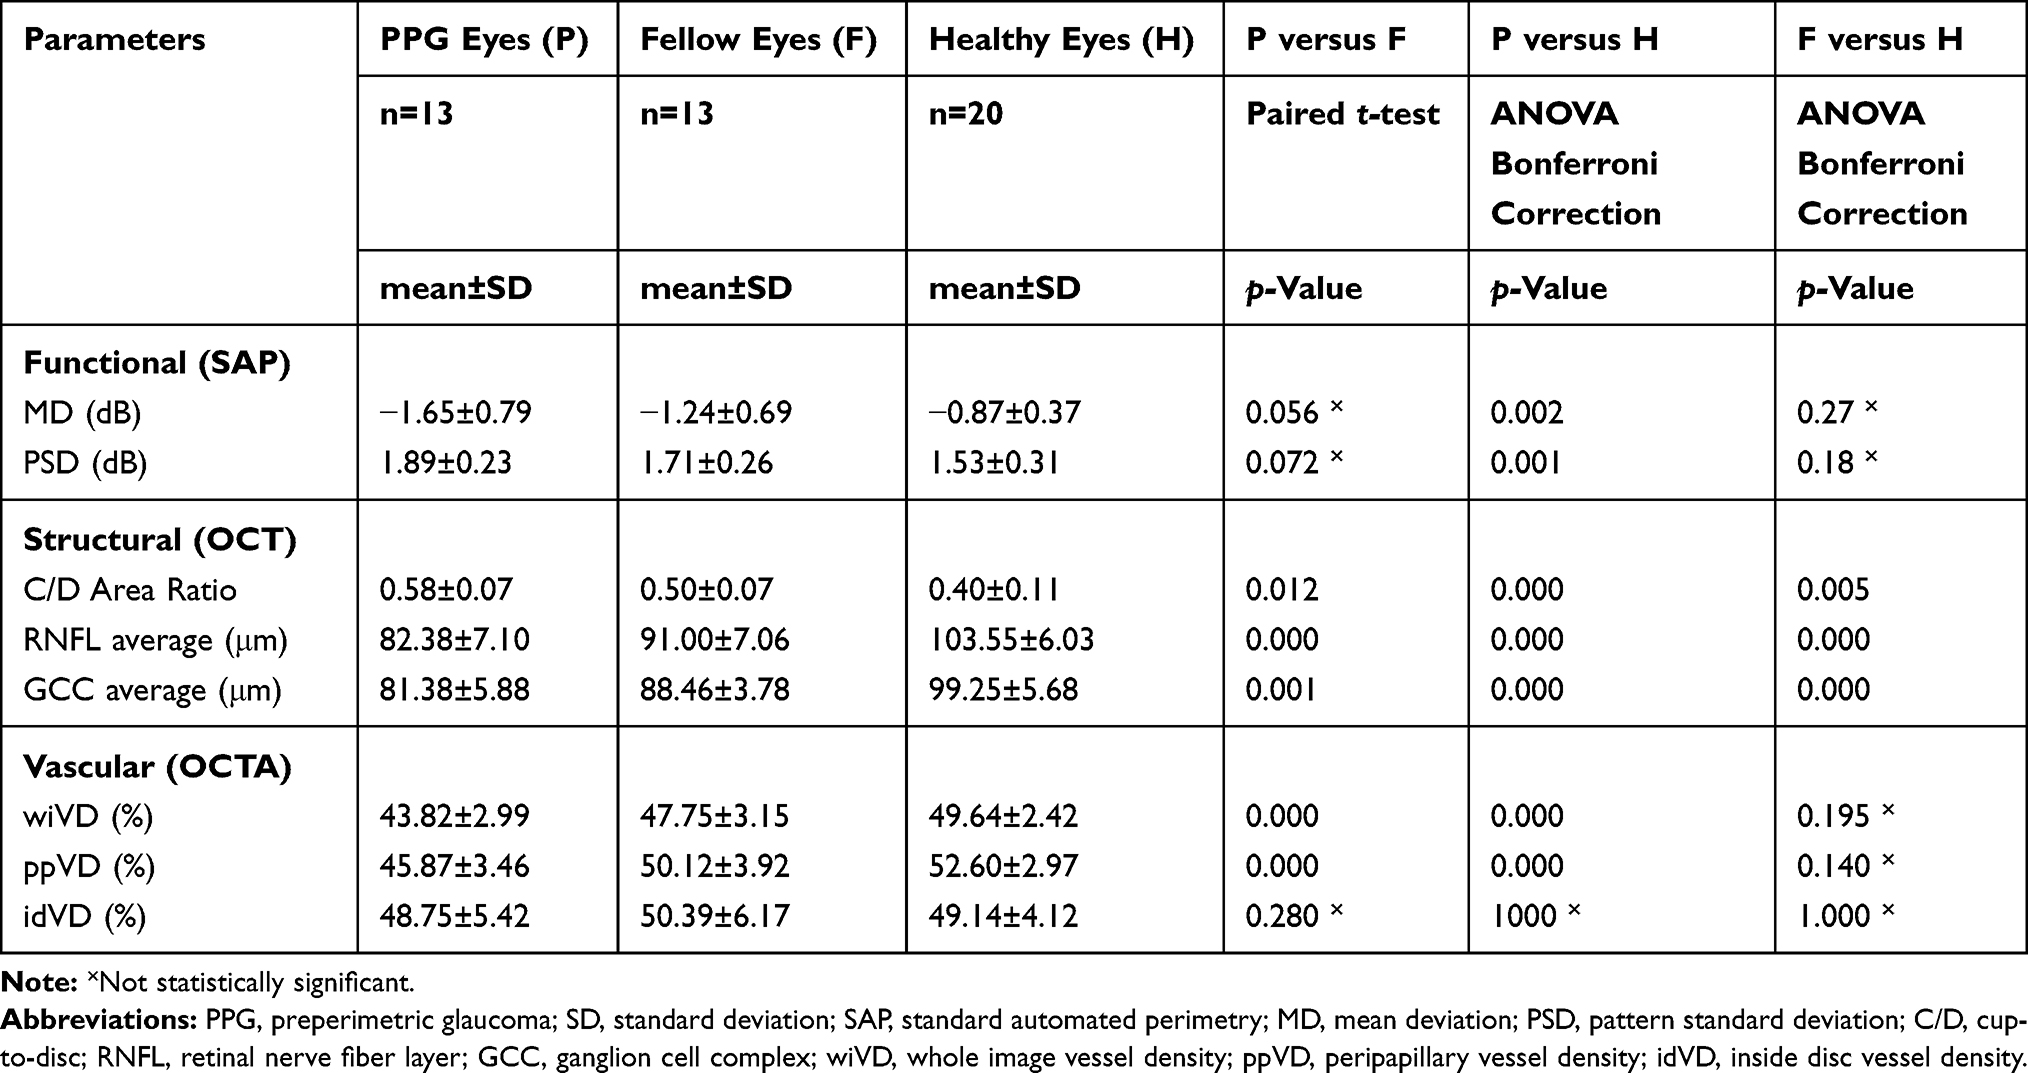 |
Table 1 Functional, Structural And Vascular Parameters In Patients With Unilateral PPG And Healthy Controls |
Structural parameters were found statistically different among the 3 groups. Specifically, average RNFL and GCC thickness showed statistically significant differences (p≤0.001) in all pairwise comparisons.
Qualitative assessment of the angiograms showed that generally fellow PPG eyes and healthy eyes had denser RPC network compared with PPG eyes. RNFL and/or GCC thinning located in the upper or lower hemisphere of PPG eyes correlated spatially with supero- or inferotemporal areas of reduced ppVD (Figure 1). PPG eyes had significantly lower wiVD and ppVD values than fellow and healthy eyes (p<0.001). Mean inter-eye difference in PPG patients was 3.9% (95% CI 2.3–5.5%) for wiVD and 4.3% (95% CI 2.6–5.9%) for ppVD. A larger difference between PPG and healthy eyes was found for wiVD (5.8%, 95% CI 3.3–8.3%) and for ppVD (6.7%, 95% CI 3.7–9.7%). Both VDs did not differ significantly between fellow and healthy eyes. The idVD showed no statistically significant difference among the 3 groups.
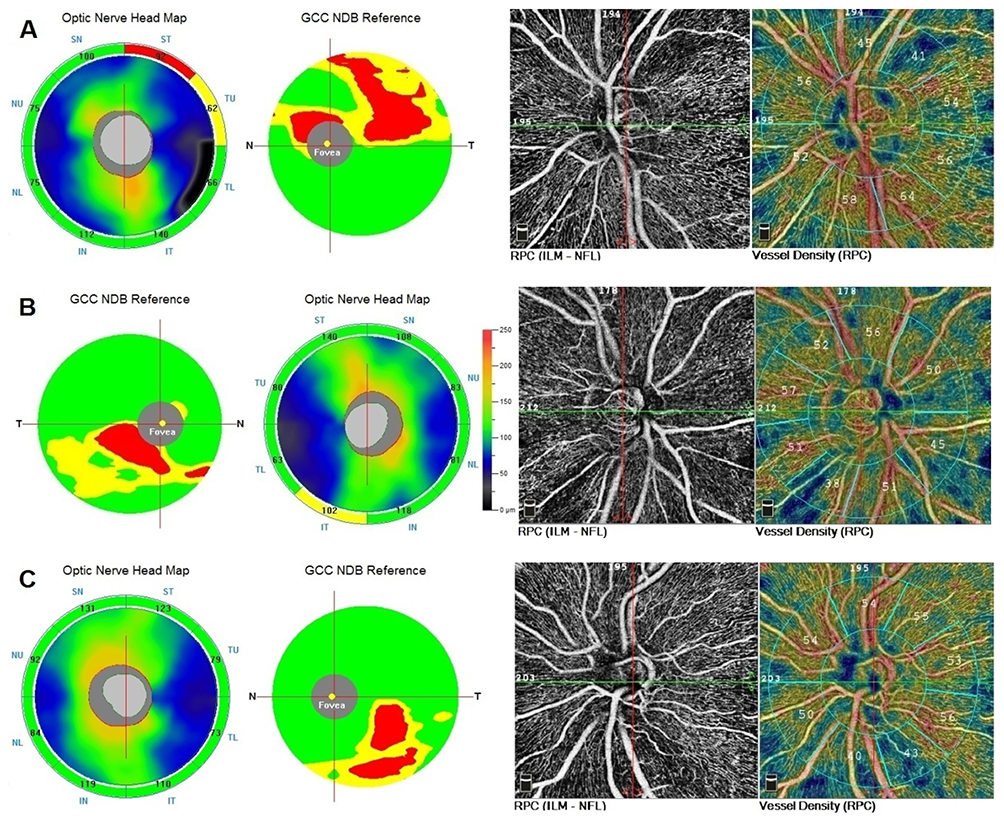 |
Figure 1 RNFL, GCC thickness map and RPC VD in three eyes with unilateral preperimetric glaucoma. (A) Abnormal (red coded) thinning of superior temporal RNFL and superior GCC corresponded with a peripapillary area of decreased VD (41%). The inferior temporal sector showed dense VD (64%). (B) RNFL thickness map was borderline (yellow coded) inferotemporally. In GCC map a statistically abnormal (red coded) inferior focal thinning was detected which corresponded with a peripapillary area of decreased VD (38%). The superior temporal sector showed normal VD (52%). (C) A case of “green disease” in RNFL thickness map. Inferior temporal RNFL thickness was statistically within normal limits (green coded), though there was a difference of 13 μm between superior temporal (123 μm) and inferior temporal (110 μm) sectors. In GCC map a statistically significant red coded inferior focal thinning was detected which corresponded with a peripapillary area of decreased VD (43%). The superior temporal sector showed normal VD (55%). Abbreviations: RNFL, retinal nerve fiber layer; GCC, ganglion cell complex; NDB, normative database; RPC, radial peripapillary capillaries; VD, vessel density. |
The ppVD was affected in 7 PPG eyes superotemporally and in 6 PPG eyes inferotemporally (Table 2). We found a significant inter-eye difference of 9.1% (95% CI 4.3–14.0%) and of 7.8% (95% CI 3.4–12.2%) in PPG patients with affected TS ppVD and affected TI ppVD, respectively. TS and TI ppVD between fellow eyes of PPG patients and healthy eyes did not differ significantly.
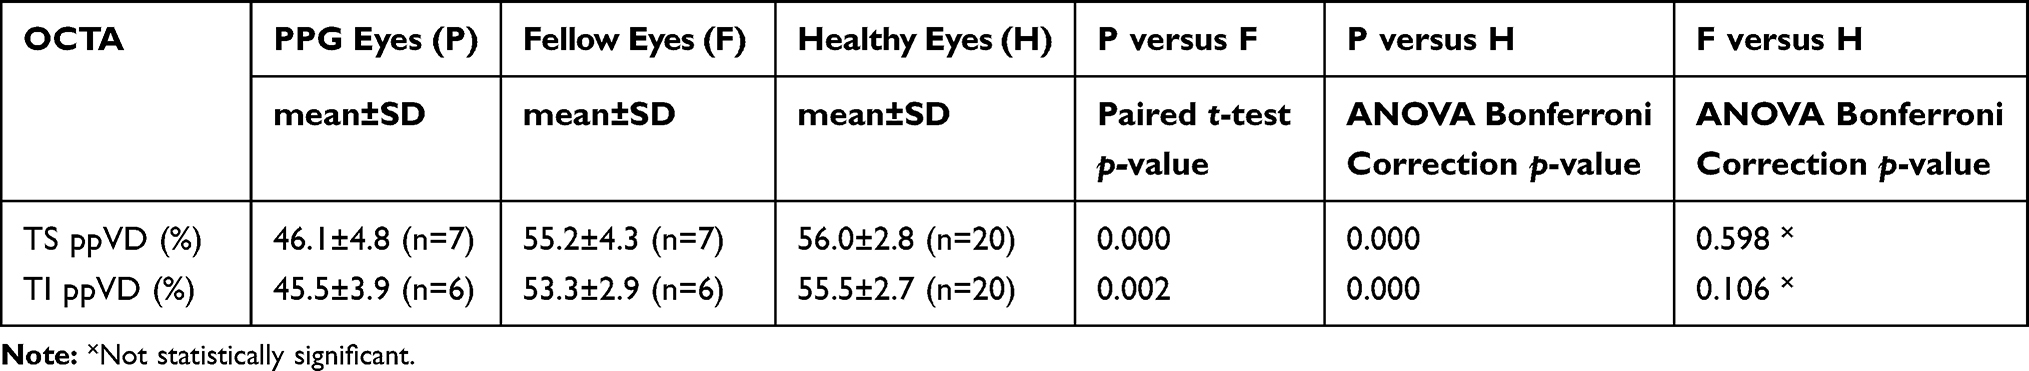 |
Table 2 Peripapillary Vessel Density (ppVD) Of Temporal Superior (TS) And Temporal Inferior (TI) Sectors In Patients With Unilateral PPG And Healthy Controls |
We performed two different receiver operating characteristic curves in order to evaluate the discriminatory ability of the following parameters: RNFL, GCC, ppVD and wiVD. For the differentiation between healthy and PPG eyes, AUROCs were 0.99±0.01, 0.98±0.02, 0.94±0.04 and 0.93±0.04 for RNFL, GCC, ppVD and wiVD, respectively. AUROCs between healthy eyes and fellow eyes of PPG patients were higher for structural parameters (RNFL: 0.92±0.05, GCC: 0.94±0.04) than for vascular parameters (ppVD: 0.67±0.10, wiVD: 0.67±0.10).
Discussion
Examination of optic disc and visual field has traditionally been used in glaucoma diagnosis.35 Measurement of peripapillary RNFL and macular GCC32,36 by means of OCT improved the diagnostic ability to identify early-stage disease. Recently, the VD of RPC obtained by OCTA has emerged as a marker of microvascular disturbances associated with optic nerve damage.8
In the present study, we investigated the superficial capillary density of three defined areas within and around the optic disc in patients with unilateral PPG and in subjects without ocular pathology. As expected, PPG eyes had on average larger C/D area, thinner RNFL and GCC than their fellow eyes. We demonstrated that this inter-eye asymmetry in structure was associated with significant inter-eye difference in VD around the optic disc. VD measurements over the entire scan field (wiVD) and within a peripapillary annulus (ppVD) were lower in PPG eyes compared with fellow and healthy eyes by 4% and 6%, respectively. This inter-eye VD asymmetry found in PPG patients was higher than those reported among normal subjects.37 The ability of both VD indices to identify early glaucoma damage was high, but not superior to structural parameters. The clinical relevance of wiVD and ppVD for early glaucoma diagnosis was comparable. Some investigators12,29 found that wiVD was superior to ppVD in discriminating early damage. They postulated that a larger measured area can provide better detection of early vessel dropout. It is likely that the scanning sensitivity in the peripapillary region may have been improved by the updated software used in this study.
In contrast to wiVD and ppVD, the VD within the optic disc area (idVD) among the three groups remained unchanged. This finding suggests that the idVD is an irrelevant index for early glaucoma detection. Using different OCTA modalities Kumar et al13 also reported similar idVD values between PPG and normal eyes, while, conversely, Akil et al19 and Jia et al6 described ONH microvascular abnormalities in PPG and perimetric glaucoma patients. Crowding of large vessels and narrowness of scanned area may have hindered accurate assessment of the superficial disc microcirculation leading earlier studies to inconclusive results. The current study had the advantage of using updated OCTA software (2017.1.0.151) which provided more accurate VD calculation excluding the major retinal vessels and taking into account only the RPC network. Additionally, distortions from motion artifacts were minimized through active tracking and artifact correction in the post-processing phase. To our knowledge, this is the first study in PPG patients using this new software with SSADA algorithm.
Further analysis revealed a spatial correlation between the structural and vascular damage. Localized RNFL thinning superiorly or inferiorly temporal coincided topographically with an area of decreased ppVD in PPG eyes. RNFL bundle defects spatially associated with localized VD reductions have been observed previously.11,14,24,25 The affected ppVD sectors of PPG eyes compared with those of fellow eyes showed a lower VD value of approximately 10%. This inter-eye sectorial ppVD difference was almost twofold than those of average ppVD. Therefore, it is advisable in glaucoma suspects to evaluate sectorial ppVD between fellow eyes. Beside to global indices, such a specific option in OCTA display would be helpful in early glaucoma detection.
Our findings provide evidence that peripapillary capillary attenuation is associated with early glaucoma damage, before detectable field loss. Several studies using various imaging methods have suggested that capillary dropout and reduced blood flow is an early event in glaucoma process.11,12,20,29,30,38,39 Obviously, our results in absolute values are not directly comparable due to different software and algorithms used in OCTA devices. Earlier publications were based on software version which determined the VD of a thicker slab containing large vessels and vasculature beneath RPC and therefore calculations resulted in higher VD values. Nevertheless, we are in concordance with the majority of studies reporting significant microvascular compromise in early-stage disease.12,30 Investigators using prior SSADA software found a similar VD reduction of 3–5% in PPG12,27,30 and 7% in mild glaucoma (MD −3.0 dB)20 compared with normal eyes, respectively. Akil et al19 reported that VD measurements could discriminate between PPG and normal eyes. Shiga et al39 using laser speckle flowgraphy measured significantly reduced optic nerve head blood flow, in preperimetric normal tension glaucoma. In glaucoma patients with unilateral VF loss, it is described that the perimetrically unaffected eyes had lower VD than healthy eyes.29
Some studies found that VD had similar or even superior diagnostic accuracy to identify early damage compared with the structural parameters.11,12,27,30 On the contrary, some investigators are less supportive for the clinical utility of OCTA parameters in early glaucoma detection. Rao et al18 suggested that overall the diagnostic ability of the vessel density parameters of OCTA was only moderate. Rolle et al27 reported that RPC VD was not significantly different between PPG and healthy eyes. Kim et al31 found that in unilateral normal tension glaucoma the perimetrically unaffected eyes had similar peripapillary capillary densities with normal eyes at the area with a RNFL defect. Chung et al26 considered vessel density parameters of limited diagnostic value in early glaucoma stage. Triolo et al22 concluded that from a diagnostic point of view, vascular parameters were inferior to the structural ones, though the diagnostic ability of peripapillary RPC-VD was still good. Our results also support that VD compared with RNFL and GCC was not superior in discriminating PPG, therefore can be considered as a supplementary parameter for early glaucoma detection.
Fellow eyes of PPG patients without evident damage had on average thinner GCC and RNFL than healthy eyes, though none of their structural parameters were statistically labeled red (outside normal limits) in OCT display. Since chronic open-angle glaucoma is a bilateral disorder with asymmetrical onset,40 such clinically unaffected eyes could be considered as “diseased” being at the earliest stage of undetectable ganglion cells loss. Histological studies41,42 have documented that severe ganglion cell death precedes RNFL thinning. We observed that some of these fellow eyes of PPG patients with “green disease”43 showed also a tendency to capillary compromise. However, discrimination between the latter eyes and healthy controls performed much better by measuring GCC and RNFL thickness than VD. These results suggest that at the earliest stage of glaucoma continuum44 structural parameters may be affected before the appearance of capillary dropout. Nevertheless, longitudinal data are required to provide stronger evidence.
Another finding which could also give insight into the temporal relationship between vascular and structural damage was the discrepancy of VD measurements inside and around the disc in PPG eyes. In glaucoma continuum, RNFL thinning precedes neuroretinal rim notching. Similarly, in eyes with early damage the capillary dropout was more profound in peripapillary area than in optic disc.14,16,24,45 Rao et al18 demonstrated that in mild glaucoma the VD inside the disc had significantly lower diagnostic ability than the peripapillary VD. Lee et al24 observed in patients with unilateral normal tension glaucoma significant capillary compromise in the area of RNFL defect but not in the optic disc area. Chihara et al16 showed that the peripapillary VD decreased in ocular hypertension, whereas the prelaminar blood flow remained unaffected. Rolle et al27 found in VD inside the disc a reduction of 11% among glaucomatous eyes (MD=–4.63 dB), but no difference between PPG and normal eyes. We also demonstrated that eyes with preperimetric nerve fiber damage had decreased peripapillary VD without evident capillary attenuation on disc area. However, RNFL and axons on optic nerve surface have common blood supply by the RPC derived predominately from the central retinal artery.46 Theoretically, if vascular impairment was a primary event, both regions should have been affected concurrently. The discrepancy between reduced ppVD and unchanged idVD indicates that superficial vascular alterations may develop secondary to RNFL damage. Lee et al24 also speculated on a possibility of secondary microvascular changes to nerve damage from the wedge-shaped but not geographic shaped capillary compromise corresponding to RNFL defect area. In the literature, there are various opinions regarding the temporal sequence of structural and vascular damage.11,15,16,24,27,28,31,45 Our hypothesis is in line with several investigators using various methodological approaches. Nevertheless, it should be clarified that the aforementioned theory is simply an explanation regarding the OCTA findings in PPG. The vascular involvement in the whole glaucoma process is a complex issue depending on various microcirculation systems and autoregulation mechanisms of the optic nerve.
Obviously, cause-effect speculations in glaucoma pathogenesis need further research and longitudinal analysis to be elucidated. However, the cross-sectional relationship between structural and vascular damage is also of particular clinical importance in early glaucoma detection. PPG diagnosis is challenging and requires experience, because early signs can be overlooked. Asymmetry in optic nerve head morphology and IOP47 can help in PPG screening. In one third of glaucoma patients RNFL thinning may precede scotomas detectable with SAP by up to 5 years.48 It has also been estimated that eyes at PPG stage may already have lost one-fourth of their ganglion cells.49,50 Measurements of RNFL and GCC thickness have a high diagnostic ability to detect the glaucomatous damage, but sometimes longitudinal follow-up is needed to establish the PPG diagnosis.32,36,51 Statistical evaluation of OCT parameters may often mislead into green or red disease.43,52 Macular co-morbidities may also complicate GCC assessment. Therefore, we support that assessment of peripapillary VD can be useful as an ancillary tool for early glaucoma detection and eventually for monitoring disease progression. Confirmation of PPG diagnosis by OCTA results facilitates the decision for appropriate management before the disease progresses to functional impairment.53,54
We consider as strength of our study that intra-individual measurements have not been influenced by different systemic conditions. Additionally, the possible vascular effect of anti-glaucoma and antihypertensive medications was ruled out. Nevertheless, the small number of PPG eyes should be considered as a weakness of our analysis.
In conclusion, PPG eyes of patients with unilateral PPG had significantly lower peripapillary VD compared with fellow eyes and healthy controls. A spatial correlation between the structural and vascular damage was observed. The diagnostic ability of OCTA to differentiate PPG eyes from fellow and healthy eyes was clinically relevant but not superior to OCT measurements. Clinically unaffected fellow eyes showed thinner structural parameters but no significant microvasculature differences compared with healthy eyes. Microvascular dysfunction seems to be an early but not a primary event in glaucoma continuum at the stage of undetectable visual field loss. Evaluation of peripapillary VD by means of OCTA can be used as an adjunct to RNFL and GCC measurements in early glaucoma diagnosis. Further longitudinal research is warranted to clarify the OCTA usefulness in monitoring progression and to elucidate the vascular involvement in glaucoma pathogenesis.
Disclosure
Dr G Mangouritsas reports personal fees from ELKEA, outside the submitted work. The authors report no other conflicts of interest in this work.
References
1. Fechtner RD, Weinreb RN. Mechanisms of optic nerve damage in primary open angle glaucoma. Surv Ophthalmol. 1994;39(1):23–42. doi:10.1016/S0039-6257(05)80042-6
2. Yanagi M, Kawasaki R, Wang JJ, Wong TY, Crowston J, Kiuchi Y. Vascular risk factors in glaucoma: a review. Clin Exp Ophthalmol. 2011;39(3):252–258. doi:10.1111/ceo.2011.39.issue-3
3. Hayreh SS. Evaluation of optic nerve head circulation: review of the methods used. J Glaucoma. 1997;6(5):319–330. doi:10.1097/00061198-199710000-00009
4. Petrig BL, Riva CE, Hayreh SS. Laser doppler flowmetry and optic nerve head blood flow. Am J Ophthalmol. 1999;127(4):413–425. doi:10.1016/S0002-9394(98)00437-1
5. Sugiyama T, Araie M, Riva CE, Schmetterer L, Orgul S. Use of laser speckle flowgraphy in ocular blood flow research. Acta Ophthalmol. 2010;88(7):723–729. doi:10.1111/j.1755-3768.2009.01586.x
6. Jia Y, Morrison JC, Tokayer J, et al. Quantitative OCT angiography of optic nerve head blood flow. Biomed Opt Express. 2012;3(12):3127–3137. doi:10.1364/BOE.3.003127
7. Zhang A, Zhang Q, Chen CL, Wang RK. Methods and algorithms for optical coherence tomography-based angiography: a review and comparison. J Biomed Opt. 2015;20(10):100901. doi:10.1117/1.JBO.20.10.100901
8. Van Melkebeke L, Barbosa-Breda J, Huygens M, Stalmans I. Optical coherence tomography angiography in glaucoma: a review. Ophthalmic Res. 2018;60(3):139–151. doi:10.1159/000488495
9. Alterman M, Henkind P. Radial peripapillary capillaries of the retina. II. Possible role in Bjerrum scotoma. Br J Ophthalmol. 1968;52(1):26–31. doi:10.1136/bjo.52.1.26
10. Jia Y, Wei E, Wang X, et al. Optical coherence tomography angiography of optic disc perfusion in glaucoma. Ophthalmology. 2014;121(7):1322–1332. doi:10.1016/j.ophtha.2014.01.021
11. Holló G. Vessel density calculated from OCT angiography in 3 peripapillary sectors in normal, ocular hypertensive, and glaucoma eyes. Eur J Ophthalmol. 2016;26(3):42–45. doi:10.5301/ejo.5000717
12. Yarmohammadi A, Zangwill LM, Diniz-Filho A, et al. Optical coherence tomography angiography vessel density in healthy, glaucoma suspect, and glaucoma eyes. Invest Ophthalmol Vis Sci. 2016;57(9):451–459. doi:10.1167/iovs.15-18944
13. Kumar RS, Anegondi N, Chandapura RS, et al. Discriminant function of optical coherence tomography angiography to determine disease severity in glaucoma. Invest Opthalmol Vis Sci. 2016;57(14):6079–6088. doi:10.1167/iovs.16-19984
14. Mammo Z, Heisler M, Balaratnasingam C, et al. Optical coherence tomography angiography of radial peripapillary capillaries in glaucoma, glaucoma suspect, and normal eyes. Am J Ophthalmol. 2016;170:41–49. doi:10.1016/j.ajo.2016.07.015
15. Rao HL, Pradhan ZS, Weinreb RN, et al. A comparison of the diagnostic ability of vessel density and structural measurements of optical coherence tomography in primary open angle glaucoma. PLoS One. 2017;12(3):e0173930. doi:10.1371/journal.pone.0173930
16. Chihara E, Dimitrova G, Amano H, Chihara T. Discriminatory power of superficial vessel density and prelaminar vascular flow index in eyes with glaucoma and ocular hypertension and normal eyes. Invest Ophthalmol Vis Sci. 2017;58(1):690–697. doi:10.1167/iovs.16-20709
17. Chen CL, Zhang A, Bojikian KD, et al. Peripapillary retinal nerve fiber layer vascular microcirculation in glaucoma using optical coherence tomography-based microangiography. Invest Ophthalmol Vis Sci. 2016;57(9):475–485. doi:10.1167/iovs.15-18909
18. Rao HL, Pradhan ZS, Weinreb RN, et al. Regional comparisons of optical coherence tomography angiography vessel density in primary open-angle glaucoma. Am J Ophthalmol. 2016;171:75–83. doi:10.1016/j.ajo.2016.08.030
19. Akil H, Huang AS, Francis BA, et al. Retinal vessel density from optical coherence tomography angiography to differentiate early glaucoma, pre-perimetric glaucoma and normal eyes. PLoS One. 2017;12(2):0170476. doi:10.1371/journal.pone.0170476
20. Yarmohammadi A, Zangwill LM, Diniz-Filho A, et al. Relationship between optical coherence tomography angiography vessel density and severity of visual field loss in glaucoma. Ophthalmology. 2016;123(12):2498–2508. doi:10.1016/j.ophtha.2016.08.041
21. Shin JW, Lee J, Kwon CJ, Kook MS. Regional vascular density-visual field sensitivity relationship in glaucoma according to disease severity. Br J Ophthalmol. 2017;101(12):1666–1672. doi:10.1136/bjophthalmol-2017-310180
22. Triolo G, Rabiolo A, Shemonski ND, et al. Optical coherence tomography angiography macular and peripapillary vessel perfusion density in healthy subjects, glaucoma suspects, and glaucoma patients. Invest Ophthalmol Vis Sci. 2017;58(13):5713–5722. doi:10.1167/iovs.17-22865
23. Richter GM, Sylvester B, Chu Z, et al. Peripapillary microvasculature in the retinal nerve fiber layer in glaucoma by optical coherence tomography angiography: focal structural and functional correlations and diagnostic performance. Clin Ophthalmol. 2018;12:2285–2296. doi:10.2147/OPTH.S179816
24. Lee EJ, Kim S, Hwang S, Han JC, Kee C. Microvascular compromise develops following nerve fiber layer damage in normal-tension glaucoma without choroidal vasculature involvement. J Glaucoma. 2017;26(3):216–222. doi:10.1097/IJG.0000000000000587
25. Rao HL, Pradhan ZS, Weinreb RN, et al. Relationship of optic nerve structure and function to peripapillary vessel density measurements of optical coherence tomography angiography in glaucoma. J Glaucoma. 2017;26(6):548–554. doi:10.1097/IJG.0000000000000670
26. Chung JK, Hwang YH, Wi JM, Kim M, Jung JJ. Glaucoma diagnostic ability of the optical coherence tomography angiography vessel density parameters. Curr Eye Res. 2017;42(11):1458–1467. doi:10.1080/02713683.2017.1337157
27. Rolle T, Dallorto L, Tavassoli M, Nuzzi R. Diagnostic ability and discriminant values of OCT-angiography parameters in early glaucoma diagnosis. Ophthalmic Res. 2019;61(3):143–152. doi:10.1159/000489457
28. Chen CL, Bojikian KD, Wen JC, et al. Peripapillary retinal nerve fiber layer vascular microcirculation in eyes with glaucoma and single-hemifield visual field loss. JAMA Ophthalmol. 2017;135(5):461–468. doi:10.1001/jamaophthalmol.2017.0261
29. Yarmohammadi A, Zangwill LM, Manalastas PIC, et al. Peripapillary and macular vessel density in patients with primary open-angle glaucoma and unilateral visual field loss. Ophthalmology. 2018;125(4):578–587. doi:10.1016/j.ophtha.2017.10.029
30. Cennamo G, Montorio D, Velotti N, et al. Optical coherence tomography angiography in pre-perimetric open-angle glaucoma. Graefes Arch Clin Exp Ophthalmol. 2017;255(9):1787–1793. doi:10.1007/s00417-017-3709-7
31. Kim SB, Lee EJ, Han JC, Kee C. Comparison of peripapillary vessel density between preperimetric and perimetric glaucoma evaluated by OCT-angiography. PLoS One. 2017;12(8):e0184297. doi:10.1371/journal.pone.0184297
32. Rao HL, Zangwill LM, Weinreb RN, Sample PA, Alencar LM, Medeiros FA. Comparison of different spectral domain optical coherence tomography scanning areas for glaucoma diagnosis. Ophthalmology. 2010;117(9):1692–1699. doi:10.1016/j.ophtha.2010.01.031
33. Garway-Heath DF, Poinoosawmy D, Fitzke FW, Hitchings RA. Mapping the visual field to the optic disc in normal tension glaucoma eyes. Ophthalmology. 2000;107(10):1809–1815. doi:10.1016/S0161-6420(00)00284-0
34. Tan O, Liu L, Liu L, Huang D. Nerve fiber flux analysis using wide-field swept-source optical coherence tomography. Transl Vis Sci Technol. 2018;7(1):16. doi:10.1167/tvst.7.1.16
35. Sharma P, Sample PA, Zangwill LM, Schuman JS. Diagnostic tools for glaucoma detection and management. Surv Ophthalmol. 2008;53(Suppl1):17–32. doi:10.1016/j.survophthal.2008.08.003
36. Kim KE, Park KH. Macular imaging by optical coherence tomography in the diagnosis and management of glaucoma. Br J Ophthalmol. 2018;102(6):718–724. doi:10.1136/bjophthalmol-2017-310869
37. Hou H, Moghimi S, Zangwill LM, et al. Inter-eye asymmetry of optical coherence tomography angiography vessel density in bilateral glaucoma, glaucoma suspect, and healthy eyes. Am J Ophthalmol. 2018;190:69–77. doi:10.1016/j.ajo.2018.03.026
38. Aizawa N, Kunikata H, Shiga Y, et al. Preperimetric glaucoma prospective observational study (PPGPS): design, baseline characteristics, and therapeutic effect of tafluprost in preperimetric glaucoma eye. PLoS One. 2017;12(12):e0188692. doi:10.1371/journal.pone.0188692
39. Shiga Y, Kunikata H, Aizawa N, Kiyota N. Optic nerve head blood flow, as measured by laser speckle flowgraphy, is significantly reduced in preperimetric glaucoma. Curr Eye Res. 2016;41(11):1447–1453. doi:10.3109/02713683.2015.1127974
40. Weinreb RN, Khaw PT. Primary open-angle glaucoma. Lancet. 2004;363(9422):1711–1720. doi:10.1016/S0140-6736(04)16257-0
41. Munguba GC, Galeb S, Liu Y, et al. Nerve fiber layer thinning lags retinal ganglion cell density following crush axonopathy. Invest Ophthalmol Vis Sci. 2014;55(10):6505–6513. doi:10.1167/iovs.14-14525
42. Rovere G, Nadal-Nicolas FM, Agudo-Barriuso M, et al. Comparison of retinal nerve fiber layer thinning and retinal ganglion cell loss after optic nerve transection in adult albino rats. Invest Ophthalmol Vis Sci. 2015;56(8):4487–4498. doi:10.1167/iovs.15-17145
43. Sayed MS, Margolis M, Lee RK. Green disease in optical coherence tomography diagnosis of glaucoma. Curr Opin Ophthalmol. 2017;28(2):139–153. doi:10.1097/ICU.0000000000000353
44. Weinreb RN, Friedman DS, Fechtner RD, et al. Risk assessment in the management of patients with ocular hypertension. Am J Ophthalmol. 2004;138(3):458–467. doi:10.1016/j.ajo.2004.04.054
45. Akagi T, Zangwill LM, Shoji T, et al. Optic disc microvasculature dropout in primary open- angle glaucoma measured with optical coherence tomography angiography. PLoS One. 2018;13(8):e0201729. doi:10.1371/journal.pone.0201729
46. Hayreh SS. Blood supply of the optic nerve head and the role in optic atrophy, glaucoma and edema of the optic disc. Br J Ophthalmol. 1969;53(11):721–748. doi:10.1136/bjo.53.11.721
47. Levine RA, Demirel S, Fan J, Keltner JL, Johnson CA, Kass MA, Ocular Hypertension Treatment Study Group. Asymmetries and visual field summaries as predictors of glaucoma in the ocular hypertension treatment study. Invest Ophthalmol Vis Sci. 2006;47(9):3896–3903. doi:10.1167/iovs.05-0469
48. Kuang TM, Zhang C, Zangwill LM, Weinreb RN, Medeiros FA. Estimating lead time gained by optical coherence tomography in detecting glaucoma before development of visual field defects. Ophthalmology. 2015;122(10):2002–2009. doi:10.1016/j.ophtha.2015.06.015
49. Medeiros FA, Lisboa R, Weinreb RN, Girkin CA, Liebmann JM, Zangwill LM. A combined index of structure and function for staging glaucomatous damage. Arch Ophthalmol. 2012;130(9):1107–1116. doi:10.1001/archophthalmol.2012.827
50. Kerrigan-Baumrind LA, Quigley HA, Pease ME, Kerrigan DF, Mitchell RS. Number of ganglion cells in glaucoma eyes compared with threshold visual field tests in the same persons. Invest Ophthalmol Vis Sci. 2000;41(3):741–748.
51. Bussel II, Wollstein G, Schuman JS. OCT for glaucoma diagnosis, screening and detection of glaucoma progression. Br J Ophthalmol. 2014;98(Suppl 2):15–19. doi:10.1136/bjophthalmol-2013-304326
52. Chong GT, Lee RK. Glaucoma versus red disease: imaging and glaucoma diagnosis. Curr Opin Ophthalmol. 2012;23(2):79–88. doi:10.1097/ICU.0b013e32834ff431
53. Kim KE, Jeoung JW, Kim DM, Ahn SJ, Park KH, Kim SH. Long-term follow-up in preperimetric open-angle glaucoma: progression rates and associated factors. Am J Ophthalmol. 2015;159(1):160–168. doi:10.1016/j.ajo.2014.10.010
54. Daga FB, Gracitelli CPB, Diniz-Filho A, Medeiros FA. Is vision-related quality of life impaired in patients with preperimetric glaucoma? Br J Ophthalmol. 2019;103(7):955–959. doi:10.1136/bjophthalmol-2018-312357
 © 2019 The Author(s). This work is published and licensed by Dove Medical Press Limited. The full terms of this license are available at https://www.dovepress.com/terms.php and incorporate the Creative Commons Attribution - Non Commercial (unported, v3.0) License.
By accessing the work you hereby accept the Terms. Non-commercial uses of the work are permitted without any further permission from Dove Medical Press Limited, provided the work is properly attributed. For permission for commercial use of this work, please see paragraphs 4.2 and 5 of our Terms.
© 2019 The Author(s). This work is published and licensed by Dove Medical Press Limited. The full terms of this license are available at https://www.dovepress.com/terms.php and incorporate the Creative Commons Attribution - Non Commercial (unported, v3.0) License.
By accessing the work you hereby accept the Terms. Non-commercial uses of the work are permitted without any further permission from Dove Medical Press Limited, provided the work is properly attributed. For permission for commercial use of this work, please see paragraphs 4.2 and 5 of our Terms.