")
Back to Journals » Journal of Multidisciplinary Healthcare » Volume 13
Perceived Effect of Calorie Count Display on Customers’ Eating Behaviors in Food Facilities of Eastern Province, Saudi Arabia: A Mixed Method Study
Authors AlAmer NA , AlOmar RS , AlKaltham SM , AlYami RS, AlRashidi FN, AlJrri MM, Abdel Wahab MM
Received 25 September 2020
Accepted for publication 13 November 2020
Published 3 December 2020 Volume 2020:13 Pages 1849—1861
DOI https://doi.org/10.2147/JMDH.S283568
Checked for plagiarism Yes
Review by Single anonymous peer review
Peer reviewer comments 2
Editor who approved publication: Dr Scott Fraser
Naheel A AlAmer,1 Reem S AlOmar,1 Shikha M AlKaltham,2 Rawan S AlYami,2 Fatimah N AlRashidi,2 Mai M AlJrri,2 Moataza M Abdel Wahab1
1Department of Family and Community Medicine, Imam Abdulrahman Bin Faisal University, Dammam, Saudi Arabia; 2College of Medicine, Imam Abdulrahman Bin Faisal University, Dammam, Saudi Arabia
Correspondence: Naheel A AlAmer
Department of Family and Community Medicine, Imam Abdulrahman Bin Faisal University, Dammam, Saudi Arabia
Email [email protected]
Background: As the Saudi Food and Drug Authority (SFDA) has recently requested all food facilities to display the calorie count on their menus, this study aimed to identify the perceived changes in costumers’ eating behaviours in response to the calorie count display (CCD) policy in the Eastern Province.
Methods: This was a mixed methods study. The first being quantitative, using a cross-sectional questionnaire which included 400 customers of both genders, aged 10 years and older, and was collected at food facilities from three cities in the Eastern Province. Customers completed a self-administered questionnaire and handed their registered receipts. Collected receipts were used to calculate the total calories ordered per customer. The second method is a qualitative in-depth interview with food facility managers.
Results: Customers who reported checking the CCD were 30.5% of the total sample, and 58.2% of them changed their order accordingly. The mean calories ordered were 36 kcal less in customers checking the CCD than those who do not (P=0.674). Customers who exhibit healthy lifestyle habits calculate their daily consumed calories, knowledgeable of the recommended daily caloric intake (RDCI), dining in a dine-in restaurant, and have an educational level of above high school were more likely to check the CCD. This study found that customers who cared to check the CCD were more likely to change their eating behavior. It has been found that only a small percentage (12% to 18%) of customers were knowledgeable regarding the RDCI. After the implementation of the policy, restaurant managers reported a positive change in customers eating behavior, which was more profound in females and athletes.
Conclusion: There is a significant association between checking the CCD and positive behavioral changes in customers’ eating behaviors. The results of this study suggest that further enforcement and awareness raising are crucial to increase the number of customers checking and using the CCD.
Keywords: calories, energy intake, restaurants, Saudi Arabia, behavior, nutritional
Background
Saudi Arabia is currently ranked as the 15th country worldwide in obesity with a prevalence of 33.7%, and this percentage may increase in the upcoming years, since studies predict that by the year 2030 the majority of the worldwide adult population will be overweight or obese. Furthermore, these rising numbers are mostly related to behavioral and environmental factors, rather than biological factors.1 The cultural, social, and economic changes in the gulf region since the 1970s were associated with an increase in the obesity rate. One possible reason for the rapid increase in obesity numbers could be the shift towards a more Western style diet. Moreover, the Saudi population were recently found to increase their use of meats and animal products, and in return having scarce amounts of fruits and vegetables.2 A study conducted by Bhutani et al found that eating once per week from a fast-food restaurant increases the body mass index (BMI) yearly by 0.8 kg/m2, whereas eating in dine-in restaurants increases it by 0.6 kg/m2.3 These numbers are especially alarming for Saudi Arabia, since a study conducted by Mandoura et al in Jeddah showed that the majority of Saudi adults (86.5%) reported regular consumption of junk food, where 35.6% and 36.2% of the males and females, respectively, consume junk food from two to five times per week.4 In 2016, Saudi Arabia launched the Kingdom’s 2030 vision as a road map for economic growth and national development of the country. The vision consists of eight themes, and 96 strategic objectives which will be achieved by 2030 through both governmental, and non-governmental bodies in the country. Under the first theme in the 2030 vision entitled “Transformation of Healthcare”, the SDFA was one of the main entities involved in fulfilling this theme.5 Currently, the burden and cost of noncommunicable diseases on governments are rising, where almost 23% of the Saudi health expenditure is used for the treatment of diabetes alone.6 One of the first initiatives done by the SFDA to meet one of the theme’s objectives titled “Promoting Prevention Against Health Risks” was implementing the mandatory CCD in all food facilities’ menus, including dine-in and fast-food restaurants, ice cream and coffee shops, fresh fruit juice shops, bakeries, and all cafeterias in governmental and educational institutions.7 Food facilities are also required to display the RDCI for different age groups and for both genders, and to declare that these numbers may differ from one individual to another on every page of the menu.8 The policy was implemented on 1 January 2019, with a fine ranging from 500 to 1000 Saudi Riyals if any facility failed to display the calorie count on their products.9 In a recent study done in central Saudi Arabia, Alassaf et al, to assess the knowledge and attitude of adults regarding the new CCD policy, found that 83% of the participants find that displaying the calorie count on menus is important and 88% of them were in favor of the new CCD policy.10 To date, many studies in different countries explored the effect of this policy on the choices and purchases of customers.11–18 For example, in New York, it was found that customers who check the calorie count in menus ordered 52 calories less than customers who did not.11 Another study also showed that 65% of the customers choose their orders according to the CCD.12 The need to assess the effects of the CCD policy from a Saudi perspective arises, especially since it remains in its infancy and is only minimally explored.7,10 This paper aims to study the changes in customers’ behavior after the implementation of this policy as well as the customers’ knowledge with regards to the concept of calories and the effect of different demographic factors on the use of the CCD. Moreover, it will discuss the overall eating behavior changes of customers from the perspective of restaurant managers.
Methods
Study Design and Setting
A mixed method design was used in this study, the first being a quantitative cross-sectional design using a self-administered questionnaire for food facilities’ customers, and the other was a qualitative in-depth interview with restaurants’ managers.
The study methodology was approved by the Institutional Review Board committee at Imam Abdulrahman bin Faisal University (IRB-2019-01-283) on October 20, 2019.
Data collection began from January 2020 to March 2020 in 32 food facilities that display the calorie count on their menus. The study was conducted in the Eastern Province of Saudi Arabia which is the largest province by area and the third most populous after the Riyadh and Makkah. Among the cities of the Eastern Province, Dammam, Al Khobar, and Dhahran were selected since they are the most populous cities in the province.
The Food facilities were located in the three main mall in the centers of the three cities. The malls are not limited to clothing stores but include essential services such as supermarkets, pharmacies, restaurants, beauty salons and play areas.
Participants and Recruitment
Customers aged 10 years and older were approached with the questionnaire. Written consent was obtained from customers themselves or from their guardians in the case of minors (<18 years old). Illiterate customers were excluded from the study. Restaurant managers were engaged in an in-depth interview.
Sample Size and Sampling Technique
For the quantitative part: The minimum required sample size was calculated to be 384 using Epi Info® version 7.0 with the following input: a change of behavior and caloric intake assumed to be in 50% of customers (since there have been no similar previous studies in Saudi Arabia to use as a reference at the commencement of this study), at a confidence level of 95% with a precision of 5.19
For the in-depth interview: due to the lack of concrete guidelines for estimating the sample size in qualitative studies, a review of qualitative interviews has recommended a minimum number of interviews ranging from 6 to 50.20 In this study, we aimed to interview the managers until theoretical saturation is reached. Saturation was early attained with the first four interviews, yet in order to follow the recommendations of the previously mentioned review, we continued and obtained six in-depth interviews. The researchers were aiming to interview more managers; however, we had to stop due to the COVID-19 lockdown in Saudi Arabia.
The restaurants were stratified according to the type of restaurants (12 dine-in, 18 fast-food and two institutional caterings). A sample of 400 customers was then obtained with proportional allocation by simple random sampling of tables. All branch managers of the same facilities were invited to an in-depth interview until theoretical saturation was achieved.
Data Collection and Study Instruments
For the quantitative part of the study, the data collection was carried out by nine recruited trained medical students. This took place during weekdays and weekends at the time of lunch and dinner.
The data collectors distributed 480 questionnaires among food facilities’ customers, 400 of them completed the questionnaire with a response rate of 83.3%. Data were collected by approaching costumers as they were waiting for their orders.
Customers were asked individually to fill up a self-administered questionnaire and provide the registered receipts of their orders. All items listed in the customers’ receipts were revised manually by the data collectors; using the restaurant menu to obtain and calculate the total calories ordered per customer.
The self-administered questionnaire was developed by the investigators mainly from two studies after a thorough literature review.11,12 The questionnaire was assessed ahead for its validity by conducting a pilot study on 25 participants of different age categories, and they approximately spent 7–10 minutes to fill up the questionnaire. Those 25 participants were not included in the final analysis. Face validity was performed by three experts in public health, and accordingly, changes were made to the questionnaire which included revising response options and rewording some of the questions. Reliability was assessed by internal consistency (Cronbach’s alpha = 0.889).
The final questionnaire was composed of three main sections: sociodemographic data, knowledge and health awareness, and the effect of the calorie display policy on customers’ eating behaviours. The sociodemographic data included age, gender, nationality, marital status, educational level, occupational status, monthly income, chronic diseases, and a self-reported height and weight by the customers. Customers’ knowledge was assessed by asking whether they know the RDCI for each gender. As well as knowing their ideal body weight (IBW) range. Regarding customers’ health-related habits, they were asked if they calculate their daily caloric intake, and whether they are following a diet or an exercise regimen. With regards to checking the CCD, customers were asked “Do you check the calorie count display before ordering?” and as for the effect of the CCD on customers’ behaviour, 15 statements describing behavioural changes were displayed and answered using a four-point Likert scale (always, usually, rarely, never) and whether certain behaviours were present before the policy or not.
Regarding the qualitative part of the study, branch managers from different food facilities were invited to an in-depth interview. They were informed that the interview and their answers are required to be recorded, and all information provided including the restaurant’s name will be kept confidential and data will only be used for the purpose of the study.
Restaurants’ manager’s interviews included the following open-ended questions: “In your opinion, what are the changes you noticed after the calorie count display policy was implemented in general?, “What are the changes you noticed on your bestselling orders?”, “What are the changes you noticed on customers’ behaviours?”.
While interviewing the first four managers, their answers began to sound similar without adding any new information and theoretical saturation was achieved, we interviewed two more managers to reach a total of six interviews. The interview approximately took 10–15 minutes on average.
Measures
Total calories ordered were manually calculated for each receipt per participant by summing the calories across all items purchased, regardless of the actual calories consumed.
Customers’ knowledge about the correct daily energetic requirements was assessed according to their answers to the RDCI for moderately active men and women; the answers were classified into correct (women from 1500 to 2000 and men 2000 to 2500 kcal), overestimated, underestimated, or do not know.
The third outcome is the BMI of customers, it was calculated using their reported heights and weights by using the BMI formula = weight in kg/height in m2, and they were divided into four categories; underweight (BMI <18.5 kg/m2) normal weight (BMI 18.5–24.9 kg/m2), overweight (BMI 25–29.9 kg/m2) and obese (BMI ≥30 kg/m2) according to Centres for Disease Control and Prevention.
For each of the 15 behavioural statements, a positive change was recorded if the participant answered “always” or “usually” and was not adapting that certain behaviour before implementing the policy. However, if the participant answered “rarely” or “never”, no change was recorded.
Statistical Analysis
The data were analysed using the Statistical Package for the Social Sciences (SPSS, version 26.0). Statistical significance was set at a p value of <0.05. Descriptive statistics of the numerical variables were presented as mean, median, and standard deviation. Frequencies and percentages were used to display categorical data. Total calories were tested for normal distribution and were found to be skewed. Kruskal–Wallis test was used to determine the relation between the restaurant category and the average calories ordered by customers. Mann–Whitney test was used to compare the average calories ordered between customers who check the CCD and those who did not. Total calories were transformed using log transformation then entered into multiple linear regression models with age, gender, checking the CCD, and restaurants categories as potential-associated factors. Further, logistic regression models were performed for each statement mentioned in the customers behavioural change section; considering customers’ reported change as a dependent variable, while the following factors –checking CCD, age, gender, educational level, monthly personal/household income and restaurant category – were entered as independent variables.
Qualitative analysis of the data was done by transcription of the recorded interviews, familiarization, coding using colors, categorization, and finally identifying a thematic framework under which the results were presented.
Results
Sample Characteristics
The present study is comprised of 400 customers, 69% of them were dining in a fast-food restaurant, 27% in dine-in restaurants and 4% in institutional caterings. Their demographic characters and BMI are displayed in Table 1.
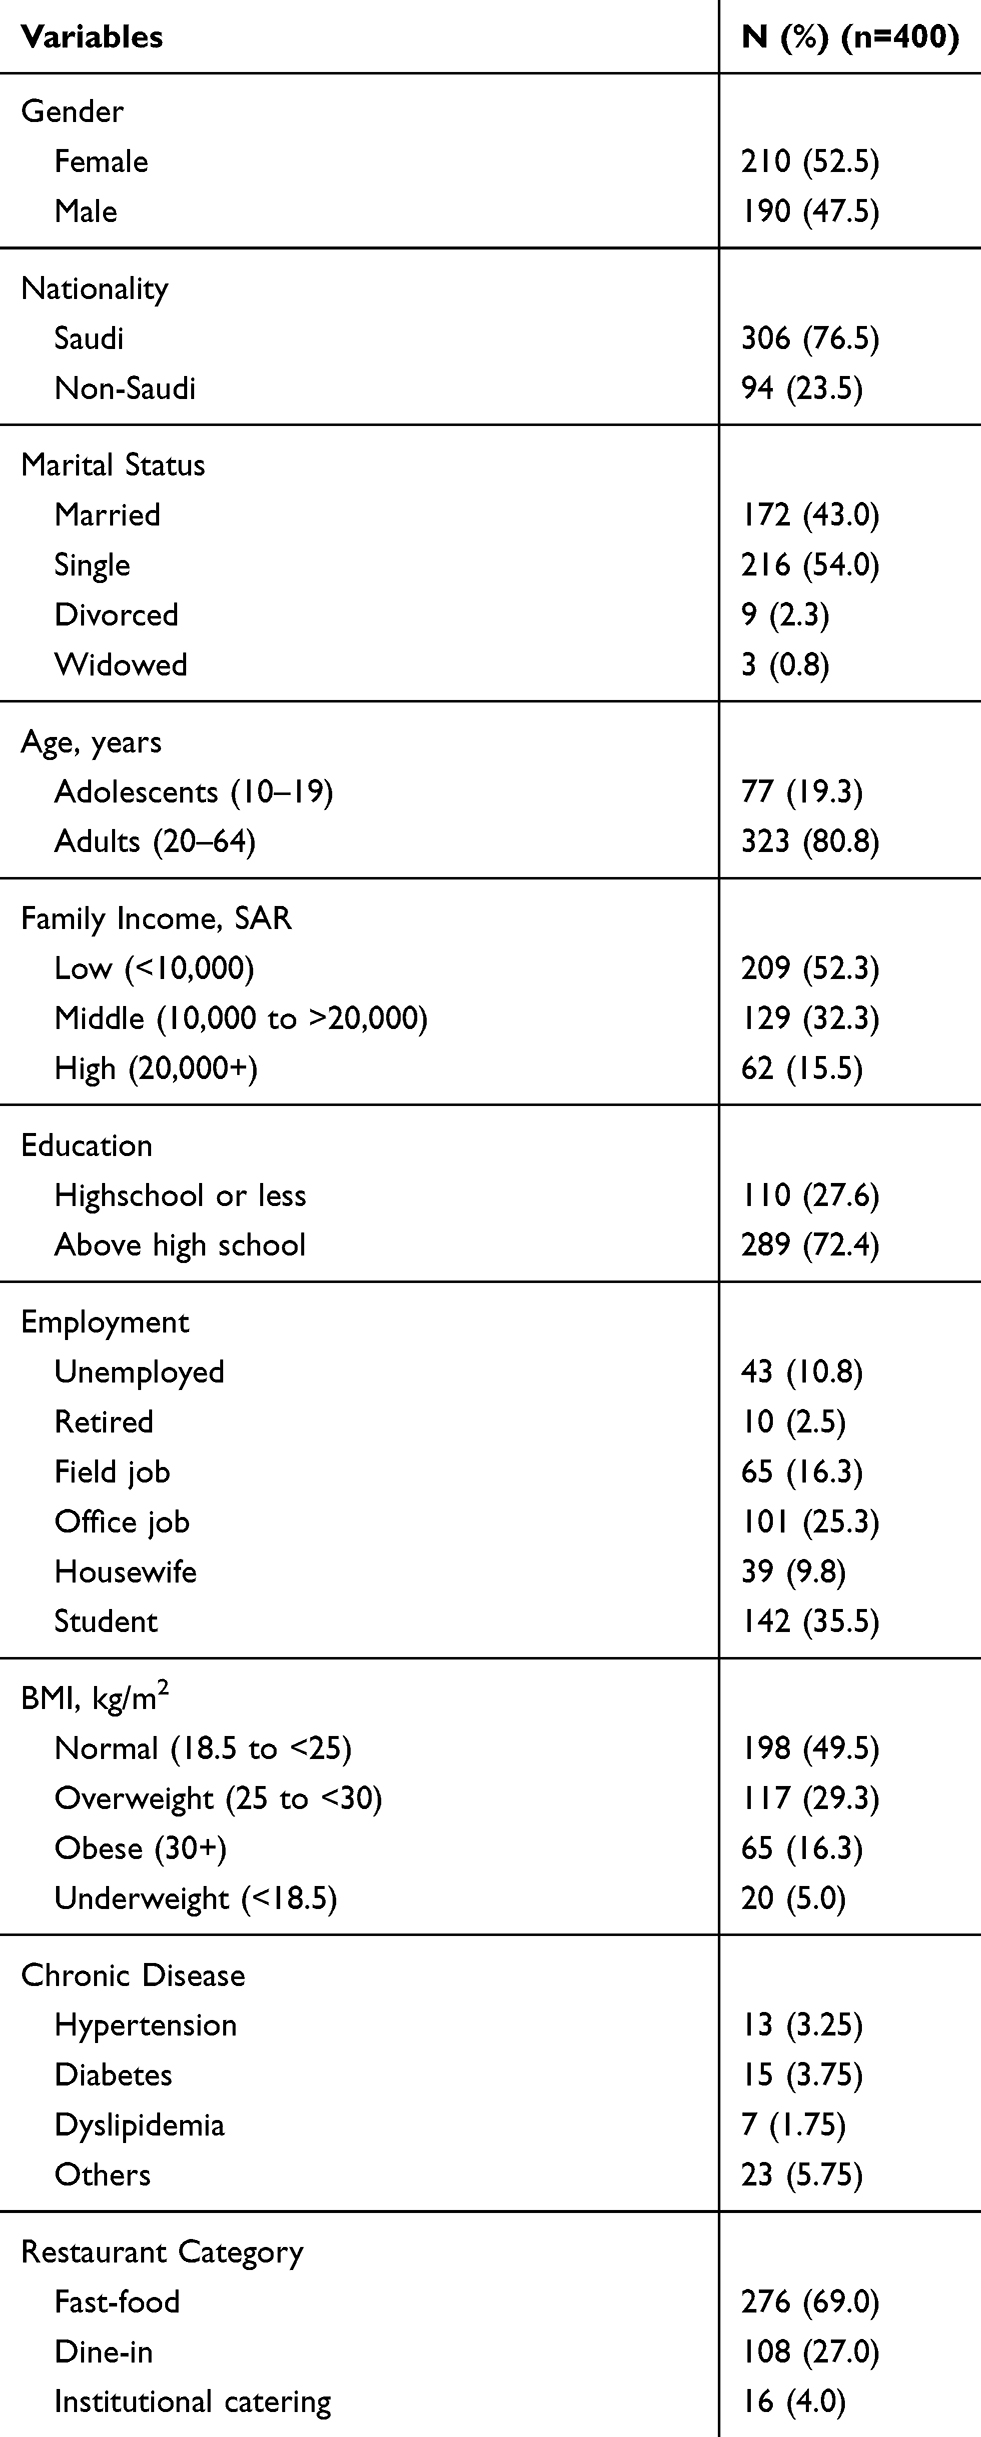 |
Table 1 Customers Sociodemographic and Health Status |
Reported Use of Calorie Count Display
Almost one-third (30.5%) of customers answered that they checked the CCD before ordering. Those with an educational level above high school comprised 79.3% of the customers checking the CCD compared to 69.4% of those who do not check the CCD (P=0.042). There was no significant difference in the other studied demographic characteristics.
Almost half of the customers who check the CCD (58.2%) said that the displayed calories affected their order. Where they chose the meal with the fewer calories, avoided high caloric meals, or changed their portion size. One customer reported choosing the meal with calories within his RDCI.
Health and Eating Habits
Checking the CCD before ordering was associated with customers who visited dine-in restaurants, as well as with those following diet regimens. Additionally, checking the CCD was associated with those who exercised regularly, specifically, those who reported more frequent weekly exercise (P >0.01). (Detailed distributions are shown in Table 2).
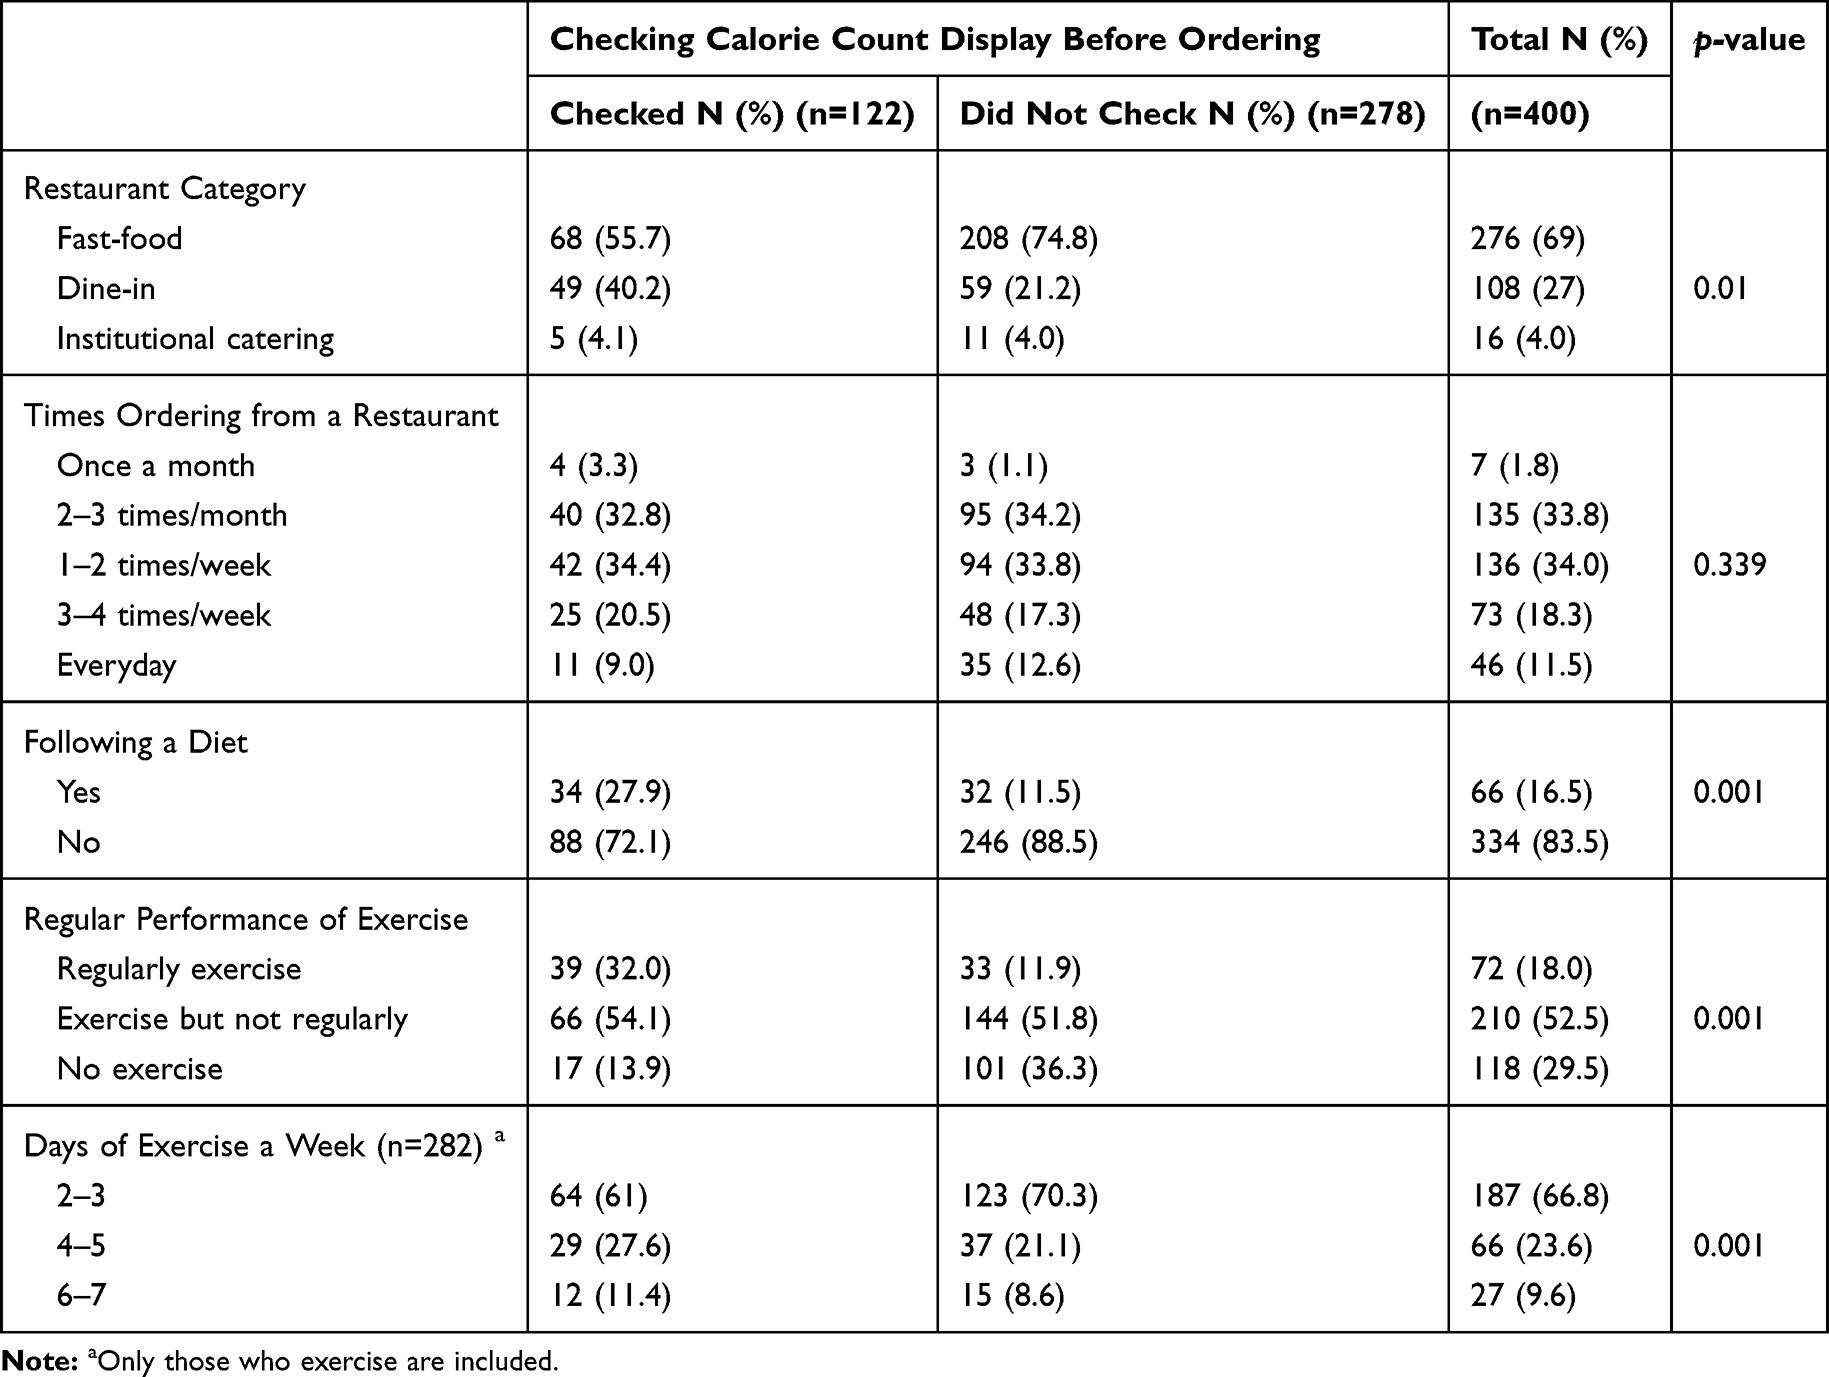 |
Table 2 Relation Between Customers Health and Eating Habits with the Usage of Calorie Count Display |
Knowledge of Caloric Requirements and Ideal Body Weight
Checking the CCD was associated with customers who were knowledgeable in regards to the RDCI and the ideal body weight. It was also associated with customers who calculate their daily consumed calories. However, only 13.8% reported calculating their daily caloric intake. (Details are shown in Table 3).
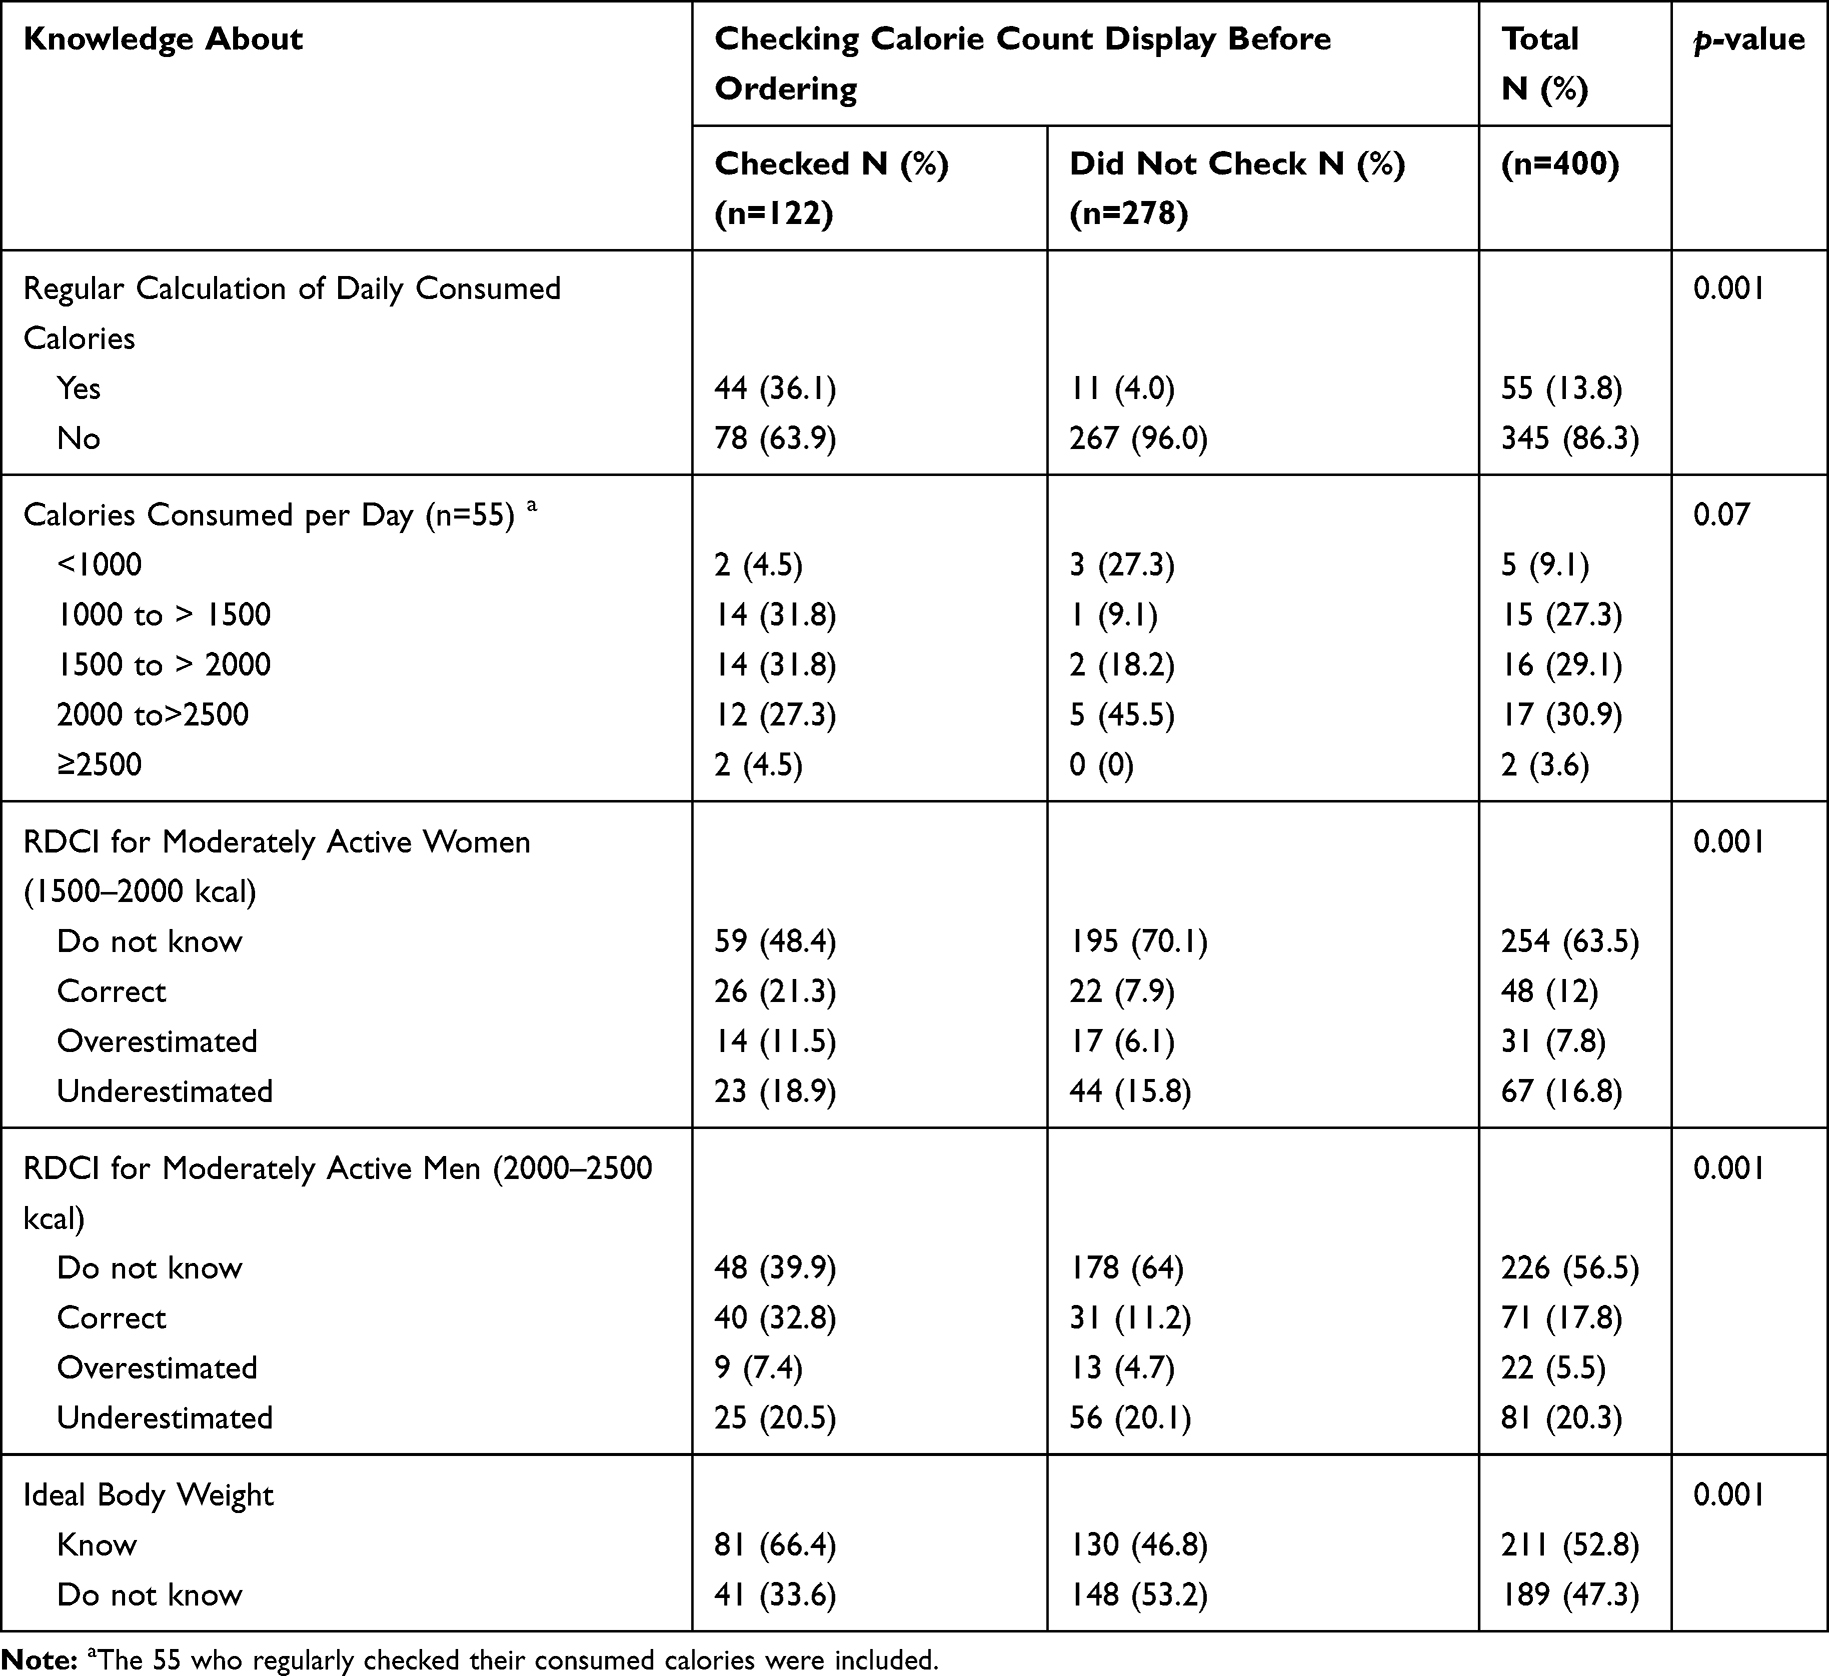 |
Table 3 Relationtship Between Checking Calorie Count Display with Calculating the Daily Consumed Calories and Customers’ Knowledge of the Recommended Daily Caloric Intake and Their Ideal Body Weight |
Behavioral Change After Displaying Caloric Information
After the implementation of the CCD policy, 60% of the customers minimized the times they order from outside, and almost half of them changed their eating behavior in the means of ordering meals and beverages with a lower caloric count, replacing sugar with low-calorie sweeteners, or ordering grilled instead of fried meals to minimize the total calories ordered. However, only 17% of the customers started calculating the total calories they order after the policy.
Multiple logistic regression analysis for each behavior item revealed that customers who cared to check the CCD were more likely to adapt one of the stated behaviors in Table 4, except for the statement “When I exceeded my daily caloric intake, I increase the intensity of my physical activity for that day”.
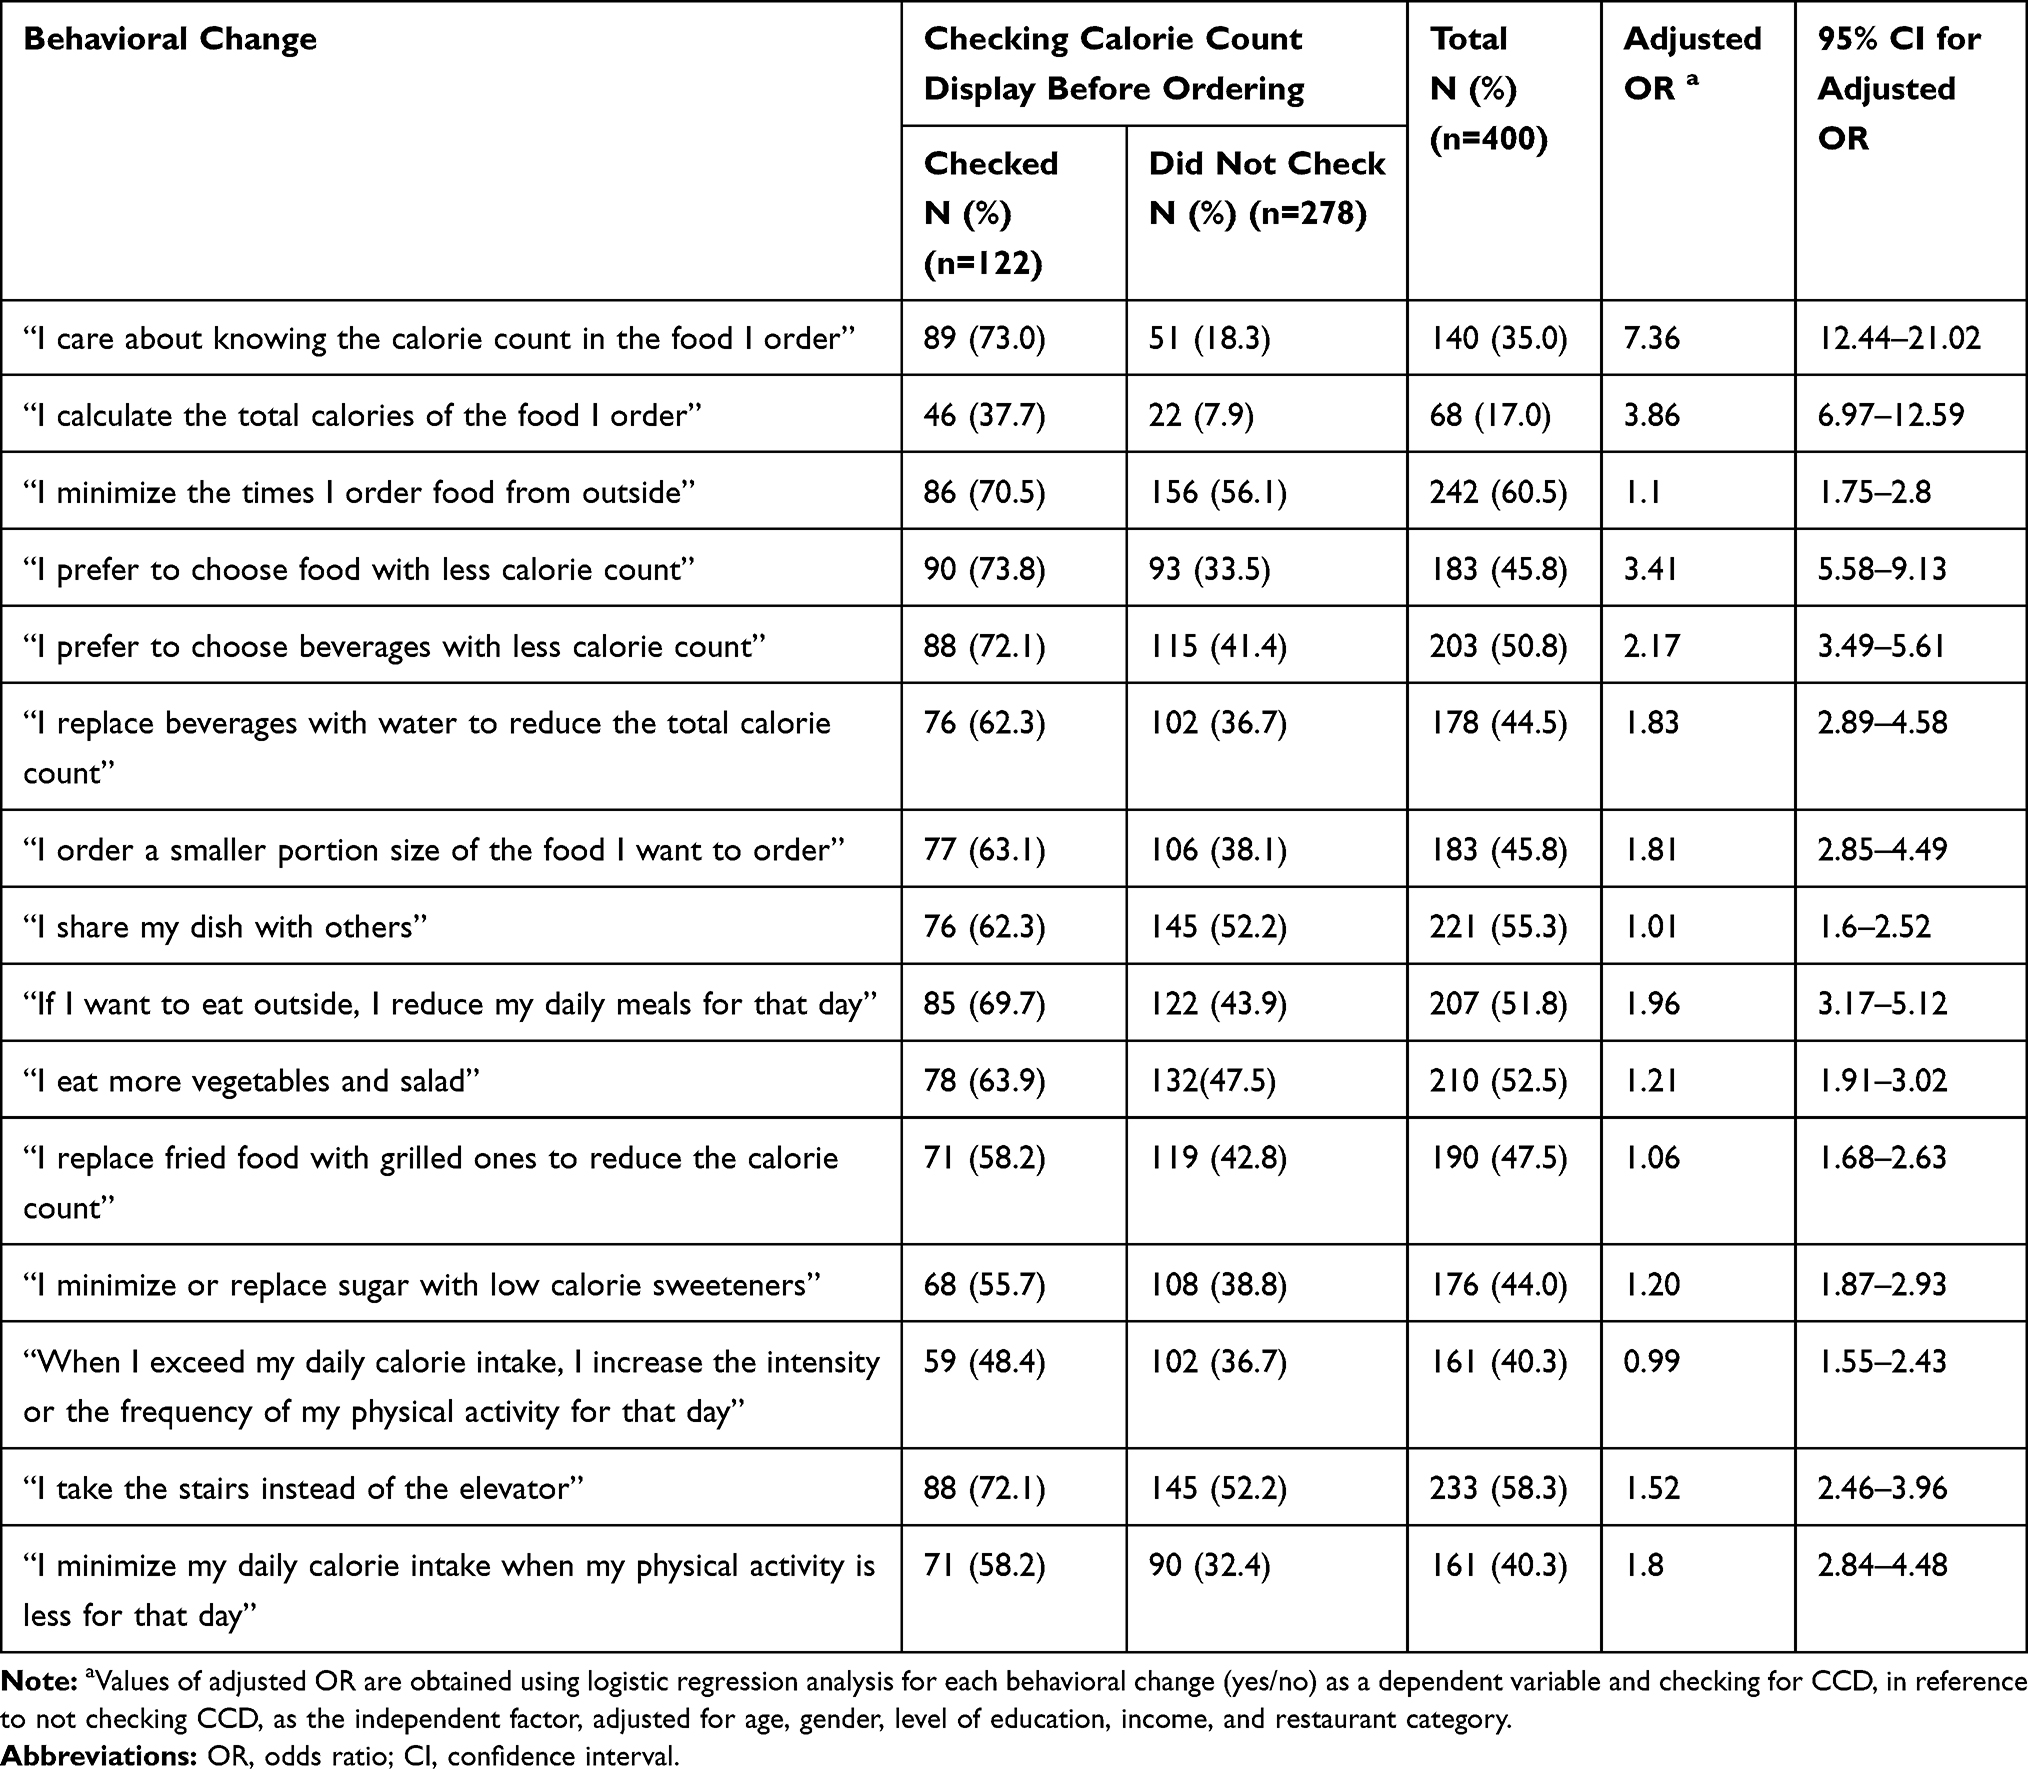 |
Table 4 Multiple Logistic Regression Analysis for Customers’ Behavioral Changes in Association with Their Reported Checking of CCD |
In addition, being a female customer was a significant factor in adapting the following behaviors: meal sharing (OR: 2.1, 95% CI: 1.3–3.2), increasing their physical activity when they exceed their RDCI (OR: 2.1, 95% CI: 1.3–3.3), and eating more vegetables (OR: 1.9, 95% CI: 1.2–2.9). Customers of dine-in restaurants are more likely to reduce or replace the regular sugar with low-calorie sweeteners (OR: 1.7, 95% CI: 1.1–2.8). Concerning adapting the behavior of replacing fried meals with grilled ones, eating at a dine-in restaurant was higher compared to fast food (OR: 2.1, 95% CI: 1.3–3.5), while having a high income was less compared to low income (OR: 0.5, 95% CI: 0.2–0.9). A positive association was identified between customers with high income and adapting the following statements: “When I exceeded my daily caloric intake, I increase the intensity of my physical activity for that day” (OR: 2.1, 95% CI: 1.2–3.9), “I take the stairs instead of the elevator” (OR: 2.4, 95% CI: 1.2–4.7), and “I minimize my daily calorie intake when I am not physically active that day” (OR: 2.0, 95% CI: 1.1–3.7). Female gender (OR: 2.1, 95% CI: 1.3–3.3) and lower-class income compared to middle income (OR: 1.5, 95% CI: 1.2–1.70) were significant predictors of the following statement “When I exceeded my daily caloric intake, I increase the intensity of my physical activity for that day” (not shown in the tables).
Customers’ Suggestions for Restaurants Menus
Only 50 customers shared their suggestions in regards to restaurant menus, where the most commonly reported suggestion being: wanting to see healthier options in restaurant menus, for both food and beverages (40%) (Figure 1).
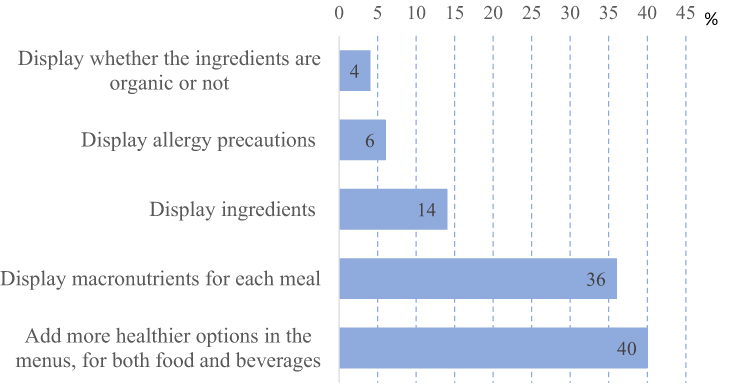 |
Figure 1 Customers’ suggestions for restaurants menu improvement. |
The Ordered Calories by Customers
Customers ordered between 144 and 3598 calories, and the average ordered calories of customers checking the CCD was 1156 kcal, while that of customers who did not check the CCD was 1192 kcal, the difference was not statistically significant (Mann Whitney test P=0.674). The average calories ordered from dine-in restaurants was 1298.23 kcal, where in fast-food restaurants it was 1145.43 kcal, and 997.69 kcal in institutional caterings (P=0.032) [Figure 2].
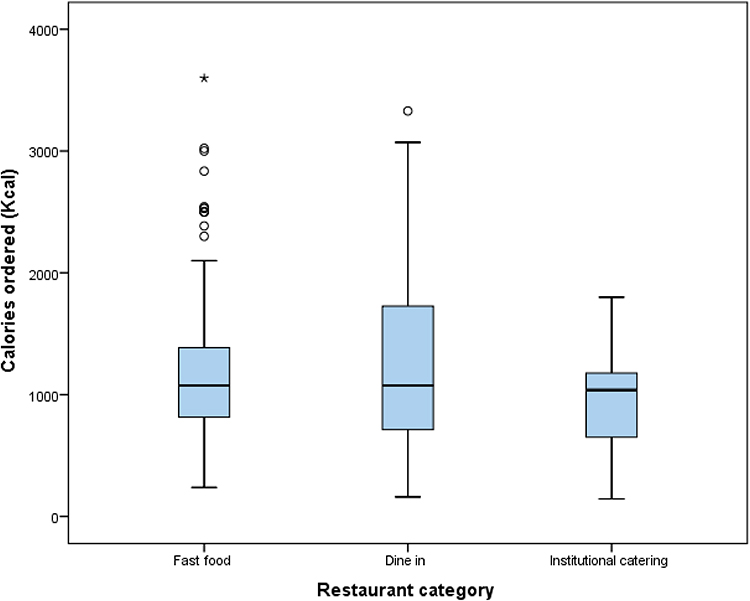 |
Figure 2 Total ordered calories by restaurant category. (Kruskal–Wallis test, P=0.032). |
Restaurants Manager’s Interviews
Customers’ Behavior
All six managers have noticed a positive change in customers’ behavior after the policy implementation. According to them, customers started to ask more about the calorie count of the menu items and asking for healthy options offered by the restaurants. One of the managers said, “in the beginning, the customers did not ask about the calorie count, but now they have changed, a lot of them are asking about it”. Another restaurant manager said, “20–25% of the customers started choosing healthy options, which is a larger percentage than before”. While one fast food restaurant manager said, “customers started asking more about the calorie count of the meals, but many of them do not change their choice after knowing the calorie count”. Half of the managers reported changes in their bestselling meal, one mentioned “with time the best seller changed to a healthier meal”, another one said “the bestselling meal became one of our salads”, and the third mentioned that “customers switched to the smaller portion size of the bestselling meal instead of the regular size”.
Gender Differences
Half of the restaurant managers reported that female customers were more interested in knowing the calorie count of the meals they ordered, and that they tend to choose healthier options with a lower caloric count. The same observations were noticed in Athletes.
Effect on the Restaurant
The managers reported that they needed to send their dishes to laboratories to calculate their exact calorie count, and they printed new menus accordingly. One manager said, “before displaying the calorie count, we had a laboratory test for every dish in the menu, and we launched new healthier items, but we did not remove anything”. The same was reported from the other managers.
Effect of CCD on Restaurant Staff
All restaurants trained their staff to be knowledgeable regarding the new menus and to be familiar with the CCD. This training was to ensure that the staff were ready to answer customers’ questions regarding the calorie count of each dish, and to be able to offer healthier alternatives if asked. For most of the restaurants, staff training was easy, took only a few days, and required minimum effort. However, one restaurant manager reported an opposite opinio, and said, “it has been difficult for the restaurant and the staff and it took a long time to train the staff according to the new policy of CCD”.
Discussion
Despite calorie count display being fairly new to the Kingdom of Saudi Arabia since it was implemented in January 2019. This study found that almost one-third of the customers check the CCD, and more than half of them change their order accordingly. These results are consistent with a cross-sectional study done by Chen et al in Washington City, where they studied the effect of CCD before and after the mandatory enforcement of CCD in 2009. In 2008, before the enforcement, only 8% checked the CCD, whereas in 2010, a year after the enforcement, the percentage almost tripled to 24.8%.13 In another cross-sectional study conducted by Dumanovsky et al that discussed the publics’ knowledge and interest in the CCD both before and after the enforcement of the CCD. Twenty-five percent of customers checked the CCD before the enforcement, and the number jumped to 65% after the enforcement. Nonetheless, only 27% of them changed their order accordingly, which is almost half of the percentage of those who change their order according to the CCD in the present study (58.2%).14 Moreover, a study conducted by Alassaf et al in Saudi Arabia showed similar results to our study, where half of the participants changed their order according to the CCD.10 However, the increase in the percentage of the Dumanovsky et al’s study after the enforcement is almost double the percentage in the present study. There are two probable causes for this difference, the first being the fact that the customers there were already using the CCD and were familiar with the concept of CCD in menus before the enforcement, unlike the customers in our study, where they were not familiar with the concept of CCD in restaurants before the implementation in January 2019. The second would be the substantial publicity the topic gained in New York City during their efforts to enforce the CCD in food facilities, which in turn increased the public’s awareness regarding this topic.14
A significant association was found between customers having an educational level of above high school and checking the CCD. This was consistent with by Chen et al’s study (2015) where the use of the CCD was more frequently reported among customers with an educational level of above high school.13 However, unlike the mentioned study, there was no significant difference between other customer characteristics. This might be due to the fact that CCD is a relatively new concept to the region.
In this study, there was no significant difference in the average ordered calories between customers who checked the CCD and those who did not. In contrary to Basset et al’s (2008) study, where they had a significant difference of 52 calories less in customers who check the CCD.11 In this study, there was a difference of 36 calories less in those customers who checked the CCD. However, there was a significant difference between the average ordered calories between fast-food restaurants, dine-in restaurants, and institutional caterings, where customers who dined in a dine-in restaurant ordered 153 calories more than customers dining in fast-food restaurants, and 300 calories more than customers dining in institutional caterings. This might be due to the multiple courses that dine-in restaurants offer, between an appetizer, main course and dessert.
In the present study, a significant association was found between customers who are following a diet, and regularly exercise with checking the CCD. Moreover, there was a significant association between customers who do not exercise and those who did not check the CCD. However, a cross-sectional study conducted by Levine (2015) found no significant difference between customers who exercise, and those who do not with regards to checking the CCD.15
According to our study, customers who answered correctly to the RDCI and those who did not know differed significantly in their interest in checking the CCD. Moreover, there was a significant association between knowing the RDCI and checking the CCD, and vice versa. However, an obvious lack of knowledge was found, where only a minority of customers knew the RDCI for both men (17.8%) and women (12%). This was inconsistent with Radwan et al’s (2017) study, where they found that 60% of the customers knew the RDCI for moderately active men, and 59% knew the RDCI for moderately active women.16 Another study conducted by Elbel (2011) in New York City found that 28% of the sample correctly estimated the RDCI for adults to maintain a healthy weight.21 These results could easily spot the big lack of nutritional awareness among the customers in the Eastern Province, and how the RDCI needs to be incorporated in the educational programs. Moreover, only 13.8% of the customers calculate their daily caloric intake, and there was a significant association between calculating the daily caloric intake and checking the CCD before ordering compared to those who do not. This result is expected since customers who are interested in calculating their daily caloric intake, are more likely to check the CCD before ordering, to choose the order with the calorie count suitable to their desired daily caloric intake.
A significant association was found between 14 out of the 15 behavioural change statements and customers who are checking the CCD. The behavioural statement “when I exceed my daily caloric intake, I increase the intensity of physical activity for that day” was the only statement to be found not significant in relation to checking the CCD. This result could be associated with the absence of the physical activity calorie expenditure label (PACE) in the menus, making it difficult for the customers to estimate the needed physical activity to burn the extra calories they have consumed. A cohort study conducted by Deery et al compared between customers using a menu having both the CCD and PACE label, with a group having the CCD alone in their menus. The PACE label group increased their physical activity by 13–26% compared to the other group.22
After the implementation of the policy, almost 74% of the customers checking the CCD, reported that they prefer to choose food with less caloric count. This result corresponds to the findings of Roberto et al, where they found that customers who check the CCD were more likely to choose orders with lower calories.17 In contrast, a study conducted by Pulos et al, to assess the effect of caloric information on customers’ orders, showed that only 20% of them chose a meal with low-calorie count based on the displayed calorie count.23 Another cross-sectional study by Dumanovsky et al, assessing the knowledge and interest in the CCD, reported that less than one-third of customers who are checking the CCD, are using it to choose meals with lower calories.14
Regarding the choice of beverages, 72.1% of customers checking the CCD, ordered beverages with less calorie count, and 62.3% of them substituted beverages with water. Our results are consistent with a cross-sectional study conducted by Rizkallah et al, to study the effect of CCD on customers’ behaviour, where they found that after checking the CCD, almost half of the customers changed their beverage choice to a one with less calorie count, while 24% of them replaced their beverages with water. Furthermore, in the mentioned study, more than half of the customers checking the CCD, shared their dish with others, and 59.6% of them ordered a smaller portion size. Both changes were significantly associated with the female gender.12 These results are consistent with our study, where 63.1% of the customers checking the CCD ordered a smaller portion size. Additionally, 62.3% of the customers checking the CCD, shared their dish with others. Similar to Rizkallah et al’s study, females were more likely to adapt this behaviour than their counterparts.
Additionally, almost two-thirds of customers checking the CCD, reduce the number of their daily meals when they decide to eat from outside. This is similar to the findings of an experimental study conducted by Howlett et al, where they reported that participants who were informed of the total calories they consumed after they have finished their lunch, ordered snacks with less calories than those who were not informed.24
In this study, after the CCD policy implementation, more than half of the customers checking the CCD started to eat more vegetables, and females were more likely to adapt this behaviour than their counterparts. Customers dining in dine-in restaurants were more likely to replace fried with grilled food and reduce the amount or replace sugar with low-calorie sweeteners. A possible reason for this association, is the availability of multiple options offered by dine-in restaurants. Unlike fast-food restaurants, where customers cannot customize the order according to their desire.18
From managers' perspectives, female customers and athletes were more likely to ask about the CCD. The gender difference reported by the managers is inconsistent with the quantitative results of our study, where there was no significant difference between females and males in checking the CCD before ordering. However, there was a significant association between customers who exercise regularly and checking the CCD, which is consistent with the managers’ opinion. Moreover, they reported that some customers have started avoiding meals with high caloric count, while others have changed the portion size to reduce the total calories ordered. This is similar to the findings of the quantitative part in our study, as well as another study conducted in Saudi Arabia by Alkhaldy et al, where restaurant owners reported a decline in the sales of meals with higher calorie counts.8 After the CCD policy was implemented, restaurant managers reported adding healthier options to their menus. These changes are similar to some international changes in restaurants after adding the CCD in their menus, where an article by Miles (2020) stated that, fast-food restaurants like McDonalds and Burger King added healthier options like salads, and apple fries as a healthier alternative to French fries.25
For future research, we recommend a follow-up study on the effect of CCD in the Eastern Province to compare the changes in customers use of CCD, as well as their knowledge regarding the topic. Additionally, we recommend conducting studies to measure the effect of the CCD policy for all regions of Saudi Arabia. For the authorities and the public, based on this study’s findings, we advise introducing the concept of calories and RDCI in elementary school curriculums to make the public more knowledgeable since childhood, adding the physical activity calorie expenditure label (PACE) to restaurant menus, training restaurants’ staff to offer healthier options to customers and suggesting changes to reduce the calorie count for dishes in the menu, and lastly making sure that all institutional caterings follow the CCD policy.
Strengths of the Study
To our knowledge, this study is the first to address the topic of CCD in the Middle East using a mixed method approach, aiming to know its effect on customers eating behaviors, and the effect of customers sociodemographics, health status, knowledge, and health habits on checking the CCD. Although the topic has been explored very briefly,8,10 we have uniquely explored the calories ordered by each customer using the customers' receipts. Thus, ensuring the accuracy of comparisons made in this study. Another unique aspect of this study is that the effect of the CCD on the eating behaviors of the customers, instead of merely knowing whether they check and use the CCD or not was explored, which in turn gives the true effect of applying a new policy like CCD to improve the overall health of the community. Furthermore, this study took the point of view of restaurant managers into consideration since they directly oversaw the change in the customers and their orders after the CCD policy was implemented.
Limitations
As stated in the results, we were able to collect only 16 questionnaires from institutional caterings, this was due to the lack of caterings providing menus to their customers, and them not showing the number of calories in each dish. The second limitation was not being able to know whether the customers consumed all the calories they ordered or only a portion of it. Lastly, due to the COVID-19 quarantine in March 2020, the investigators were aiming to interview more than six restaurant managers to gain more insight regarding the effect of calorie count labeling; however, customers were no longer allowed to enter restaurants, hence not being able to get more interviews with the managers. However, this did not affect the results since theoretical saturation was met after interviewing the six restaurant managers.
Conclusion
Our study showed that almost one-third of the population check the CCD before ordering, and more than half of them change their order accordingly. These numbers are especially promising when considering that the policy was implemented in a duration of 1 year. A key finding was that customers who were knowledgeable about the RDCI were more likely to check the CCD before ordering. This highlights the importance of awareness and education of the general population regarding the RDCI and healthy eating habits, so this policy can be more effective and useful for the public. Hopefully, this initiative will produce valuable results and help in achieving Saudi Arabia’s 2030 Vision in reducing the rates of obesity and unhealthy eating habits in the region.
Abbreviations
SFDA, Saudi Food and Drug Authority; CCD, calorie count display; RDCI, recommended daily caloric intake; BMI, body mass index; IBW, ideal body weight; SPSS, Statistical Package for the Social Sciences; SAR, Saudi Arabian Riyal; kcal, kilocalorie; SD, standard deviation; PACE, Physical Activity Calorie Expenditure label; COVID-19, coronavirus disease 2019.
Data Sharing Statement
The datasets used and/or analyzed during the current study are available from the corresponding author on reasonable request.
Ethics Approval and Consent to Participate
Before filling the questionnaire, written consent was obtained from either customer themselves or their guardians in case of minors. Customers and guardians have been told that confidentiality will be maintained by collecting the data anonymously, where the names or national ID will not be asked. For the restaurants’ managers, they were informed that the interview and their answers are required to be recorded, and all information provided including restaurant’s name will be kept confidential and will only be used for the purpose of study. The aim of this study and type of consent has been approved by the IRB of Imam Abdulrahman Bin Faisal University as an unbudgeted project (IRB-2019-01-283). This study was conducted in accordance with the Declaration of Helsinki.
Acknowledgment
We would like to acknowledge the following medical students for their great efforts in the data collection process, Fahad AlBassam, Ammar Binammar, Ahmed AlKhalifah, Nawal Jalalah, Amal AlSalman, Sara AlAli, Ali AlHabrti, Mohammed AlHashim and Dina AlHatlani.
Author Contributions
All authors contributed to data analysis, drafting or revising the article, have agreed on the journal to which the article will be submitted, gave final approval of the version to be published, and agree to be accountable for all aspects of the work.
Funding
The manuscript was non-funded.
Disclosure
The authors declare that they have no conflicts of interest.
References
1. Alqarni MS. A review of prevalence of obesity in Saudi Arabia. 2016 [cited September 20, 2019]. Available from: https://www.sfda.gov.sa/en/food/news/Pages/f11-92018a1.aspx.
2. Al-Rethaiaa A, Fahmy A, Al-Shwaiyat N. Obesity and eating habits among college students in Saudi Arabia: a cross sectional study. Nutr J. 2010;9(1). doi:10.1186/1475-2891-9-39
3. Bhutani S, Schoeller D, Walsh M, McWilliams C. Frequency of eating out at both fast-food and sit-down restaurants was associated with high body mass index in non-large metropolitan communities in Midwest. Am J Health Promot. 2016;32(1):75–83. doi:10.1177/0890117116660772
4. Mandoura N, Al-Raddadi R, Abdulrashid O, et al. Factors associated with consuming junk food among Saudi Adults in Jeddah City. Cureus. 2017. doi:10.7759/cureus.2008
5. Saudi Vision 2030 National transformation program. Vision2030.gov.sa. 2016 [cited October 27, 2020]. Available from: https://vision2030.gov.sa/en/programs/NTP.
6. Garawi F, Ploubidis G, Devries K, Al-Hamdan N, Uauy R. Do routinely measured risk factors for obesity explain the sex gap in its prevalence? Observations from Saudi Arabia. BMC Public Health. 2015;15(1). doi:10.1186/s12889-015-1608-6
7. Saudi Food and Drug Authority. The Saudi food and drug authority mandates restaurants and cafes to display calorie counts [Internet]. Sfda.gov.sa. 2018. [cited October 28, 2020]. Available from: https://www.sfda.gov.sa/en/node/1828.
8. Alkhaldy AA, Taha DS, Alsahafi SE, Naaman RK, Alkhalaf MM. Response of the public and restaurant owners to the mandatory menu energy-labelling implementation in restaurants in Saudi Arabia. Public Health Nutr. 2020;1–13. doi:10.1017/S1368980020000245
9. Classification of violations and penalties prescribed for the food and feed systems and their regulations [Internet]. Old.sfda.gov.sa. [cited October 28, 2020]. Available from: https://old.sfda.gov.sa/ar/food/about/regulations/Pages/FoodViolationsPenalties.aspx.
10. Alassaf HI, Alaskar YA, Alqulaysh BF, et al. Assessment of knowledge, attitudes and practices of Saudi adults about calorie labeling in central Saudi Arabia. Saudi Med J. 2020;41(3):296–303. doi:10.15537/smj.2020.3.24916
11. Bassett M, Dumanovsky T, Huang C, et al. Purchasing behavior and calorie information at fast-food chains in New York City, 2007. Am J Public Health. 2008;98(8):1457–1459.
12. Rizkallah E, Feiler K. The effects of calorie count display on consumer eating behavior: would it solve the obesity problem? An empirical perspective. Am J Health Sci. 2013;4(2):79–88.
13. Chen R, Smyser M, Chan N, Ta M, Saelens B, Krieger J. Changes in awareness and use of calorie information after mandatory menu labeling in restaurants in King County, Washington. Am J Public Health. 2015;105(3):546–553.
14. Dumanovsky T, Huang C, Bassett M, Silver L. Consumer awareness of fast-food calorie information in New York City after implementation of a menu labeling regulation. Am J Public Health. 2010;100(12):2520–2525. doi:10.2105/AJPH.2010.191908
15. Levine K. A consumer survey of use of calorie-posting in a restaurant: an analysis of consumer characteristics. ProQuest Dissertations & Theses Global. 2015 [cited April 2, 2020];. Available from: https://search-proquest-com.library.iau.edu.sa/docview/1724803194?pq-origsite=summon.
16. Radwan H, Faroukh E, Obaid R. Menu labeling implementation in dine-in restaurants: the public’s knowledge, attitude and practices. Arch Public Health. 2017;75(1). doi:10.1186/s13690-017-0177-9
17. Roberto C, Larsen P, Agnew H, Baik J, Brownell K. Evaluating the impact of menu labeling on food choices and intake. Am J Public Health. 2010;100(2):312–318.
18. Krieger J, Chan N, Saelens B, Ta M, Solet D, Fleming D. Menu labeling regulations and calories purchased at chain restaurants. Am J Prev Med. 2013;44(6):595–604.
19. Dean AG, Arner TG, Sunki GG, et al. Epi Info™, a Database and Statistics Program for Public Health Professionals. Atlanta, GA, USA: CDC; 2011.
20. Marshall B, Cardon P, Poddar A, Fontenot R. Does sample size matter in qualitative research?: a review of qualitative interviews in is research. J Comput Inf Syst. 2013;54(1):11–22. doi:10.1080/08874417.2013.1sixteen45667
21. Elbel B. Consumer estimation of recommended and actual calories at fast food restaurants. Obesity. 2011;19(10):1971–1978. doi:10.1038/oby.2011.214
22. Deery C, Hales D, Viera L, et al. Physical activity calorie expenditure (PACE) labels in worksite cafeterias: effects on physical activity. BMC Public Health. 2019;19(1). doi:10.1186/s12889-019-7960-1
23. Pulos E, Leng K. Evaluation of a voluntary menu-labeling program in full-service restaurants. Am J Public Health. 2010;100(6):1035–1039. doi:10.2105/AJPH.2009.174839
24. Howlett E, Burton S, Bates K, Huggins K. Coming to a restaurant near you? Potential consumer responses to nutrition information disclosure on menus. J Consum Res. 2009;36:494–503. doi:10.1086/598799
25. Miles B. Marketing health conscious | QSR magazine [internet]. QSR magazine. 2020 [cited April 3, 2020]. Available from: https://www.qsrmagazine.com/promotions/marketing-health-conscious.
 © 2020 The Author(s). This work is published and licensed by Dove Medical Press Limited. The full terms of this license are available at https://www.dovepress.com/terms.php and incorporate the Creative Commons Attribution - Non Commercial (unported, v3.0) License.
By accessing the work you hereby accept the Terms. Non-commercial uses of the work are permitted without any further permission from Dove Medical Press Limited, provided the work is properly attributed. For permission for commercial use of this work, please see paragraphs 4.2 and 5 of our Terms.
© 2020 The Author(s). This work is published and licensed by Dove Medical Press Limited. The full terms of this license are available at https://www.dovepress.com/terms.php and incorporate the Creative Commons Attribution - Non Commercial (unported, v3.0) License.
By accessing the work you hereby accept the Terms. Non-commercial uses of the work are permitted without any further permission from Dove Medical Press Limited, provided the work is properly attributed. For permission for commercial use of this work, please see paragraphs 4.2 and 5 of our Terms.