")
Back to Journals » OncoTargets and Therapy » Volume 11
Peptide SA12 inhibits proliferation of breast cancer cell lines MCF-7 and MDA-MB-231 through G0/G1 phase cell-cycle arrest
Authors Yang LF, Liu HR, Long M, Wang X, Lin F, Gao ZW , Zhang HZ
Received 30 October 2017
Accepted for publication 17 January 2018
Published 30 April 2018 Volume 2018:11 Pages 2409—2417
DOI https://doi.org/10.2147/OTT.S154337
Checked for plagiarism Yes
Review by Single anonymous peer review
Peer reviewer comments 3
Editor who approved publication: Dr Samir Farghaly
Longfei Yang,1,* Huanran Liu,2,* Min Long,1 Xi Wang,1 Fang Lin,1 Zhaowei Gao,1 Huizhong Zhang1
1Department of Medical Laboratory and Research Center, Tangdu Hospital, Fourth Military Medical University, Xi’an, China; 2Department of General Surgery, First Affiliated Hospital of Dalian Medical University, Dalian, China
*These authors contributed equally to this work
Background: Targeted therapies have been proven as promising in the treatment of breast cancer and have improved survival and quality of life in advanced breast cancer. We previously identified a novel peptide SA12 which showed significant activity in the inhibition of proliferation and induction of apoptosis in SKBr-3 cells.
Methods: The present study investigated the potential antitumor role of SA12 in breast cancer cell lines MDA-MB-231 and MCF-7 through Cell Counting Kit-8 assay and colony formation assay, and examined the cell cycle distribution using flow cytometry analysis. Furthermore, the expression of cell cycle-related genes cyclin D1, CDK4, and tumor suppressor gene p16 were examined by real-time polymerase chain reaction and Western blot to explore the molecular mechanism.
Results: We determined that peptide SA12 suppressed the proliferation of MDA-MB-231 and MCF-7 cell lines through the G0/G1 phase cell cycle arrest. Moreover, the expressions of cell cycle-associated genes cyclin D1 and CDK4 were downregulated and the expression of tumor suppressor gene p16 was upregulated after treatment with SA12. MECP2 was required for the enhanced expression of p16 gene induced by SA12, which further inhibits CDK4/CDK6 activation and arrests the cell cycle progression from G0/G1 to S phase.
Conclusion: We concluded that SA-12 inhibits the proliferation of MCF-7 and MDA-MB-231 cells through G0/G1 cell cycle arrest. Cell cycle related genes cyclin D1, CDK4, and p16 participate in the process, and MECP2 is essential for the enhanced expression of p16 gene induced by SA-12.
Keywords: SA12, breast cancer, G0/G1 arrest, cyclin D1, CDK4, p16
Introduction
Despite promising therapies against the most concerned cancer having been presented and significant advances in anticancer therapy having been achieved in the past decades, cancer is still a serious threat to human health. Treatment of cancer is considered to be complicated, which is attributed to the resistance to chemotherapeutics, alteration of interaction, and abnormity in the process of cell cycle or apoptosis.1 Breast cancer is termed as one of the most common malignancies and the most frequent cause of cancer death among women in the world.2 Currently, treatment of breast cancer primarily focuses on surgical operation, chemotherapy, and endocrine therapy. However, the prognosis of breast cancer treatment is unsatisfactory, which is mainly due to the progression and metastasis after the conventional treatment.3
The novel strategies in the cancer treatment based on bioactive peptide have been confirmed to be effective. Peptides from natural source and artificial synthesis have been extensively studied and several promising peptides have been used successfully in the treatment of various cancers.4 Anticancer peptides have a series of excellent properties, such as high specificity, reduced side effects, and desired tumor penetration, thus considered to have great potential in cancer treatment.5,6 In the previous study,7 we have established mRNA–peptide display technology and identified a novel peptide SA12, which showed significant activity in the inhibition of proliferation and induction of apoptosis in SKBr-3 breast cancer cells. Further studies have revealed that SA12 interacted with tumor-associated protein MECP2 and induced apoptosis of SKBr-3 cells via the mitochondrial pathway.7 Reasonably, a better understanding of the antitumor activity of SA12 on the progression of breast cancer and the underlying molecular mechanisms is needed. The accurate control of cell cycle transition from G1 phase to S phase is crucial for the proliferation of eukaryotic cell and misregulation of which frequently promotes oncogenesis.8 The cyclin D1–CDK4/6–p16 pathway, disrupted in most human malignancies including breast cancer, participates in the regulation of cellular processes at the transition of G1/S phases of the cell cycle.9 In this study, the potential antitumor role of SA12 was investigated in breast cancer cell lines MDA-MB-231 and MCF-7, and the influence of SA12 on the cell cycle transition and expression of cyclin D1, CDK4, and p16 was further examined to explore the molecular mechanism.
Materials and methods
Cell lines and culture
Human breast cancer cell lines MDA-MB-231 and MCF-7 were obtained from the American Tissue Culture Collection (Rockville, MD, USA). The cells were cultured in high-glucose Dulbecco’s Modified Eagle’s Medium (DMEM) (Thermo Fisher Scientific, Waltham, MA, USA) supplemented with 10% fetal bovine serum (Hyclone, Logan, UT, USA) and 1% glutamine (Thermo Fisher Scientific) at 37°C in an atmosphere of 5% CO2.
Peptide synthesis and preparation
The peptides used in the experiment were chemically synthesized and purified by GL Biochem Ltd. (Shanghai, China). The amino acid sequence of SA12 is Ser-Val-Pro-Leu-Phe-Asn-Phe-Ser-Val-Tyr-Leu-Ala. Then the peptides were handled as previously described,7 in short, dissolved in dimethyl sulfoxide under ultrasound irradiation and vortexed, and then diluted to the required concentrations in DMEM.
Cell Counting Kit-8 (CCK-8) assay
Cell proliferation after treatment with SA12 was measured with the CCK-8 (Sigma-Aldrich Co, St Louis, MO, USA) assays. Cells were seeded in 96-well plates at a total of 5×10³ cells/well and then treated with SA12 at the concentration of 100 μM for 24, 36, 48, 72, and 96 hours, respectively. SKBr-3 cells were used as positive control and human umbilical vein endothelial cells (HUVEC) were used as negative control. Then, 10 μL aliquot of CCK-8 solution was added into the medium in each well and incubated at 37°C for 4 hours. The absorbance was detected in a microplate reader (Bio-Rad, Hercules, CA, USA) at the wavelength of 450 nm. The percentage of cell viability was calculated as (Atreated/Acontrol) ×100%. The cell proliferation curve was plotted using the percentage of cell viability at each time point. All experiments were performed at least in triplicate and the mean value was used.
Colony formation assay
Cells were digested into single-cell suspension with 0.25% trypsin and resuspended in DMEM containing 100 μM SA12, and then, the cell suspension was seeded onto six-well plates at a total of 100 cells per well. The cells were cultured in the medium containing 100 μM SA12 at 37°C for about 15 days until the most colonies contained more than 50 cells. Cells seeded in the medium without SA12 were set as control. The final cells on the plates were washed twice with PBS solution, and incubated for 30 minutes with 1 mL 4% paraformaldehyde for fixation. Then, the cells were washed twice with PBS solution and stained with 500 μL Giemsa dye for 15 minutes. After washing with flowing water, the plates were air dried and imaged. Colonies containing more than 50 cells were counted and statistically analyzed. The clone formation rate was calculated with the formula: clone formation rate (%) = (clone number/plated cell number) ×100%.
Cell cycle analysis
Cells were seeded on six-well plates at a density of 1×10⁶ per well and cultured overnight for adhesion. Then the cells were treated with 100 μM SA12 for 24, 36, and 48 hours, respectively. Untreated cells served as control. Then, the cells were collected and fixed with cold 70% ethanol at 4°C overnight. The obtained cells were then washed and resuspended in PBS solution and incubated at 37°C for 30 minutes with 10 mg/mL RNase and 1 mg/mL propidium iodide (PI; BD Biosciences, San Jose, CA, USA). DNA content analysis was performed by flow cytometry (BD Biosciences, San Diego, CA, USA). The distribution of cells in different cell cycle phases was analyzed with WinMDI software (Scripps Institute, La Jolla, CA, USA) on a FACSCalibur™ system (BD Biosciences).
Transfection with MECP2-SiRNA
Cells were plated on six-well plates at a density of 5×10⁵ cells per well and incubated overnight. Then the cell culture medium was replaced with serum-free Opti-MEM cell culture medium, and cells were transfected with MECP2-SiRNA (Sangon, Shanghai, China) using Lipofectamine 2000 (Invitrogen, Carlsbad, CA, USA) according to the manufacturer’s instructions. The sequences for MECP2-SiRNA were 5′-GGACUGAAGACCUGUAAGATT-3′ (sense) and 5′-UCUUACAGGUCUUCAGUCCTT-3′ (antisense). Nontransfected cells were used as control groups. After transfection for 6 hours, the Opti-MEM medium was replaced with complete DMEM containing 10% fetal bovine serum and cultured at 37°C for 24 hours. The transfected cells were then treated with 100 μM SA12 for 48 hours for further experiments.
Real-time polymerase chain reaction (PCR)
Total mRNA from the cells transfected by MECP2-SiRNA and treated with or without 100 μM SA12 for 48 hours was extracted using RNAiso plus reagent (TaKaRa, Dalian, China), and then reverse transcribed to cDNA using PrimeScript RT Master Mix (TaKaRa). The obtained cDNA was presented to the Real-time Thermal Cyclers (Bio-Rad, Hercules, CA, USA) with SYBR Premix Ex Taq™II kit (TaKaRa) and 10 mM primers in the reaction system. The primers for MECP2, cyclin D1, CDK4, p16, and β-actin are listed in Table 1. All samples were normalized to the internal control β-actin.
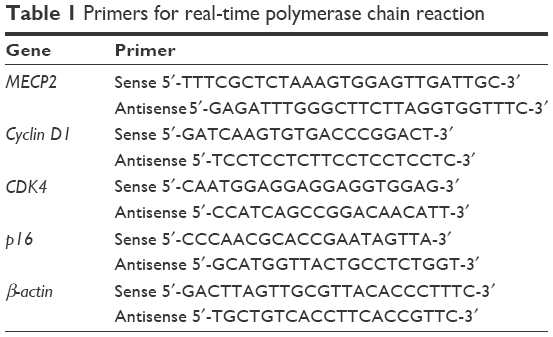 | Table 1 Primers for real-time polymerase chain reaction |
Western blot analysis
Cells were treated with 100 μM SA12 for 48 hours and then lysed with RIPA lysis buffer (Sangon). Untreated cells served as control. The obtained proteins were subjected to 12% sodium dodecyl sulfate polyacrylamide gel electrophoresis and transferred onto nitrocellulose membranes (Millipore Corp, Billerica, MA, USA). After blocking with 5% nonfat milk in Tris-buffered saline solution containing 0.05% Tween-20, the membranes were incubated with primary antibodies at 4°C overnight. And then, the membranes were incubated with secondary antibodies conjugated to horseradish peroxidase at room temperature for 2 hours. Signals were visualized by electrochemiluminescence detection, and the density of the blots was analyzed and quantified by Gel-Pro Analyzer 4.0 software. The primary antibodies used for Western blot analysis were rabbit antihuman MECP2, rabbit antihuman cyclin D1, rabbit antihuman CDK4, rabbit antihuman p16 (Abcam, Cambridge, MA, USA), and mouse antihuman β-actin (Cell Signaling, Danvers, MA, USA). The secondary antibodies were horseradish peroxidase-conjugated goat anti-rabbit immunoglobulin G (IgG) and goat anti-mouse IgG (Zhongshanjinqiao, Beijing, China).
Statistical analysis
The data were presented as mean ± standard deviation. Comparisons were performed using one-sample or paired-samples Student’s t-test, and P<0.05 was considered to indicate a significant difference.
Results
SA12 showed significant antitumor effect on MDA-MB-231 and MCF-7 cell lines
To investigate whether the proliferation of breast cancer cell lines MDA-MB-231 and MCF-7 was influenced by SA12, CCK-8 assays were performed. Compared with control groups, the proliferation of MDA-MB-231 and MCF-7 cells was significantly inhibited by 22.48% and 27.52% at 72 hours, and 26.66% and 31.02% at 96 hours, respectively, after treatment with 100 μM SA12 (P<0.05, Figure 1). However, there was no observed difference in the growth inhibition of HUVEC after the same treatment. These data indicated that SA12 effectively inhibited the growth of MDA-MB-231 and MCF-7 cells.
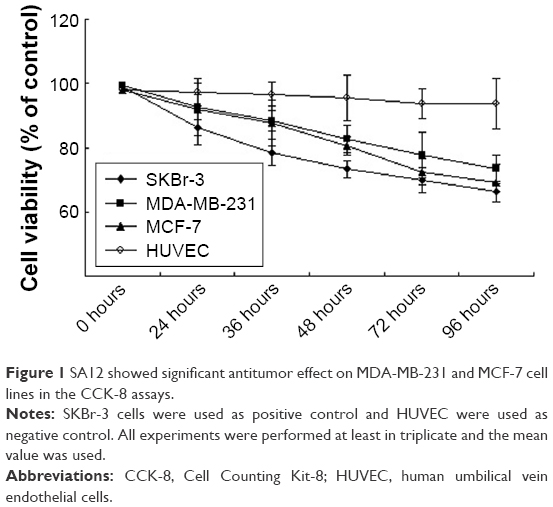 | Figure 1 SA12 showed significant antitumor effect on MDA-MB-231 and MCF-7 cell lines in the CCK-8 assays. |
For the further evidence that SA12 inhibited the proliferation of MDA-MB-231 and MCF-7 cells, colony formation assay was performed. As shown in Figure 2A, the relative number of colonies in SA12-treated groups was lower than those of control groups. The colony-forming ability of MDA-MB-231 and MCF-7 cells was significantly inhibited by 17% and 22%, respectively, in the presence of 100 μM SA12 for 15 days (P<0.05, Figure 2B). Results also supported the finding that SA12 significantly affects the proliferation of MDA-MB-231 and MCF-7 cells.
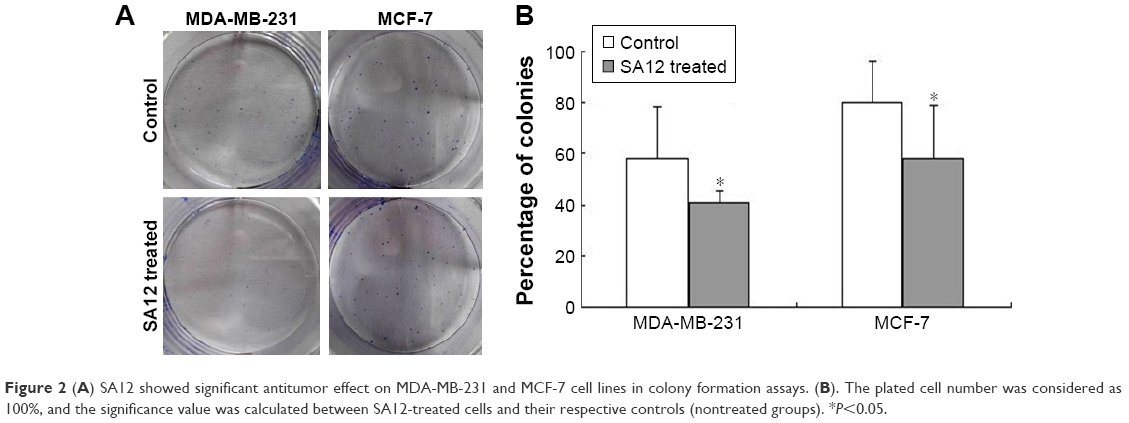 | Figure 2 (A) SA12 showed significant antitumor effect on MDA-MB-231 and MCF-7 cell lines in colony formation assays. (B). The plated cell number was considered as 100%, and the significance value was calculated between SA12-treated cells and their respective controls (nontreated groups). *P<0.05. |
SA12 enhanced antitumor effect through the G0/G1 phase cell cycle arrest
To determine whether proliferation inhibition of SA12 on MDA-MB-231 and MCF-7 cells was attributed to the cell cycle arrest, PI staining and flow cytometric analysis were carried out. As shown in Figure 3A and C, a significant change in the population of cell cycle distribution was observed after treatment with 100 μM SA12 for 24 and 48 hours. Compared with control groups, the G0/G1 fraction of MDA-MB-231 and MCF-7 cells treated with 100 μM SA12 for 48 hours increased by 15.24% and 10.93%, respectively (P<0.05, Figure 3B and D). The percentages of S phase and G2 phase cells were decreased correspondingly. The results showed that the proportion of MDA-MB-231 and MCF-7 cells in G0/G1 phase was significantly increased, while cells in S phase and G2/M phase were decreased, which suggests a G0/G1 phase arrest induced by SA12.
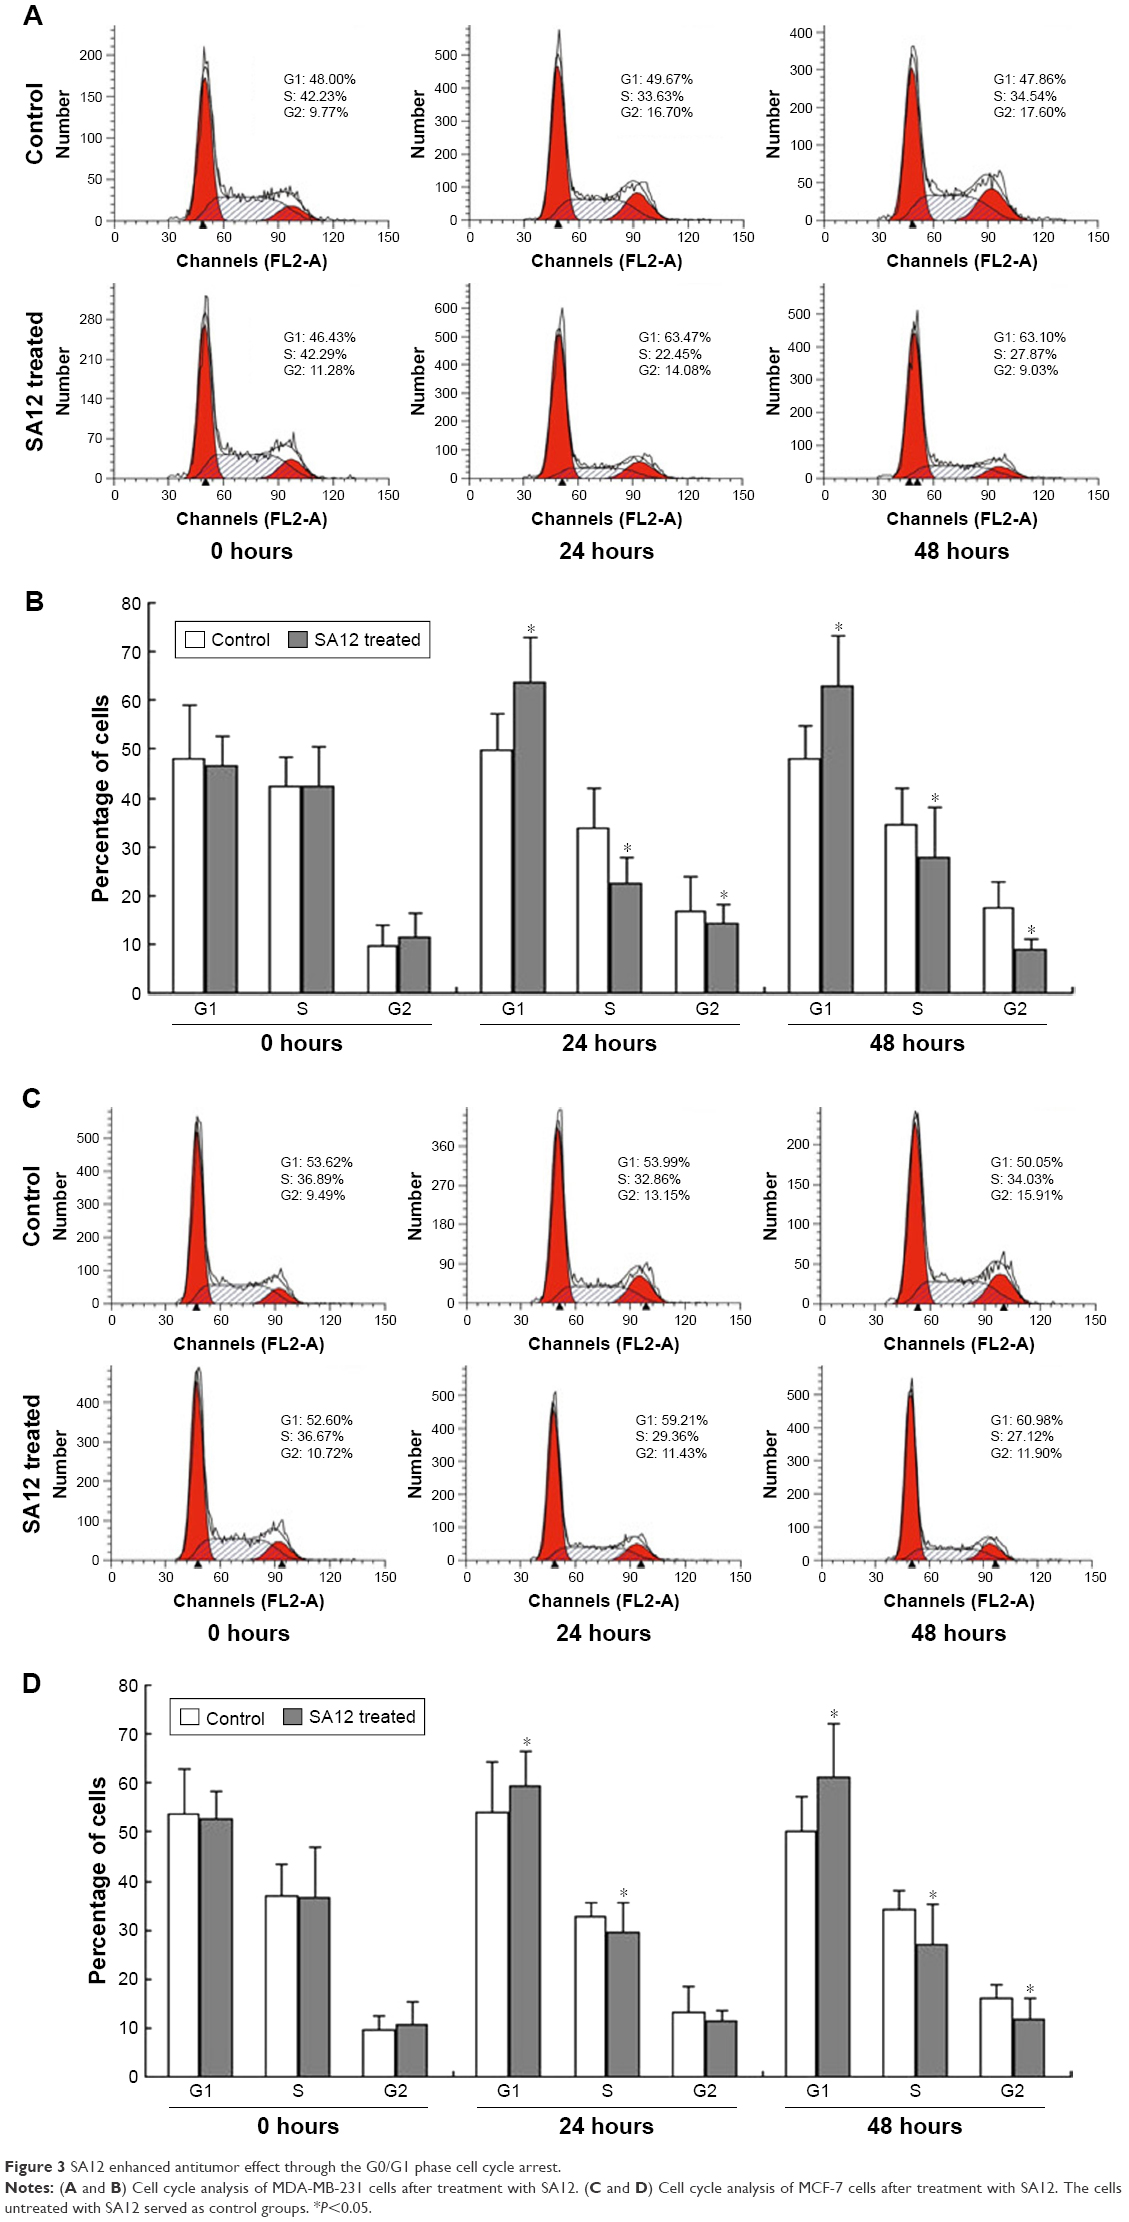 | Figure 3 SA12 enhanced antitumor effect through the G0/G1 phase cell cycle arrest. |
The expressions of cell cycle-related genes cyclin D1, CDK4, and p16 were changed after treatment with SA12
To investigate the possible mechanism underlying the cell cycle arrest effect of SA12 on MDA-MB-231 and MCF-7 cells, the expression levels of cell cycle-related genes were detected by real-time PCR. Treatment with SA12 resulted in significant reduction in the expression level of cyclin D1 and CDK4, and an increase in the expression level of p16 in MDA-MB-231 and MCF-7 cells. As compared to the control groups, treatment with 100 μM SA12 for 48 hours reduced the mRNA expression levels of cyclin D1 to 67.2% and CDK4 to 53.2% and increased p16 to 145.5% in MDA-MB-231 cells, while reduced the mRNA expression levels of cyclin D1 to 44.9% and CDK4 to 71.4% and increased p16 to 172.3% in MCF-7 cells (P<0.05, Figure 4A). The results demonstrated that treatment with SA12 caused a marked reduction in the mRNA expression levels of cyclin D1 and CDK4 and an increase in the mRNA expression levels of p16 in MDA-MB-231 and MCF-7 cells.
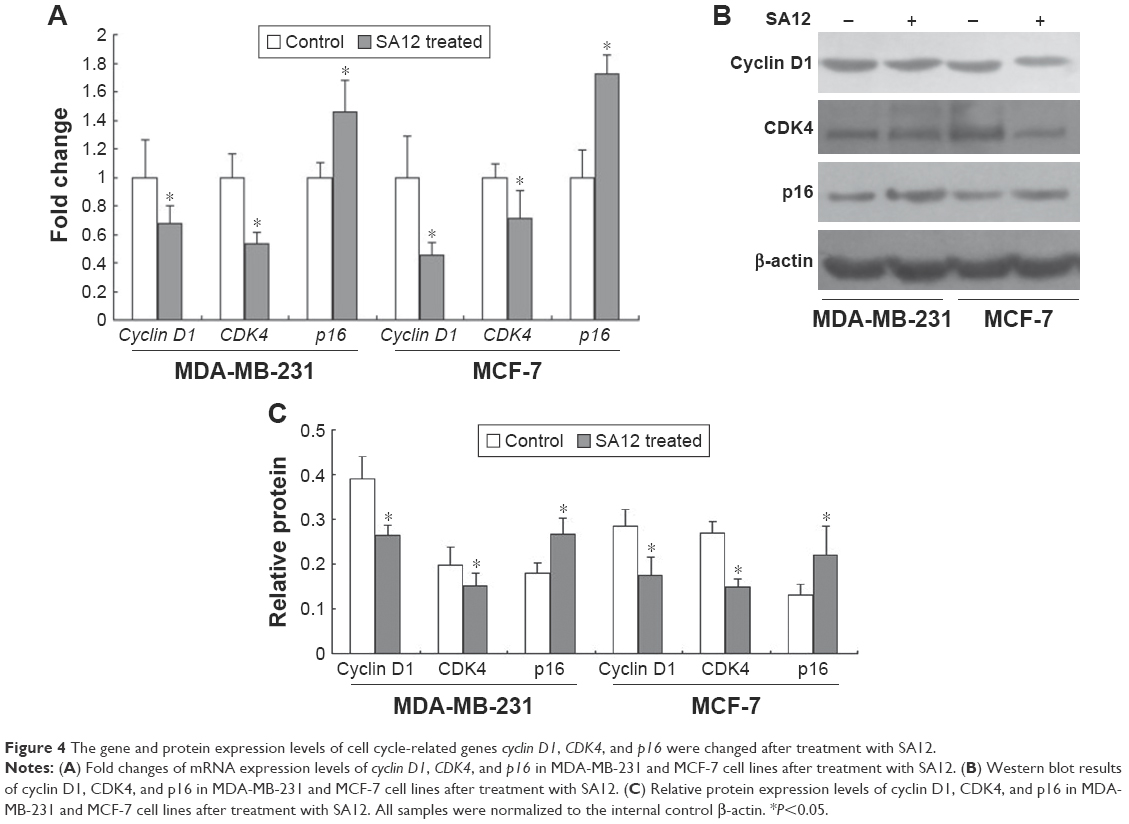 | Figure 4 The gene and protein expression levels of cell cycle-related genes cyclin D1, CDK4, and p16 were changed after treatment with SA12. |
The protein levels of cyclin D1, CDK4, and p16 were changed accordingly after treatment with SA12
To consolidate the aforementioned conclusions, Western blot analysis was carried out. The effects of SA12 on the protein expression levels of cyclin D1, CDK4, and p16 in MDA-MB-231 and MCF-7 cells were determined. Treatment with 100 μM SA12 resulted in the downregulation of cyclin D1 and CDK4 and upregulation of p16, which may be partially responsible for the cell cycle arrest of MDA-MB-231 and MCF-7 cells. The protein expression levels of cyclin D1 and CDK4 were downregulated to 32.9% and 75.7%, respectively, and p16 was upregulated to 149.2% in MDA-MB-231 cells, while protein expression levels of cyclin D1 and CDK4 were downregulated to 31.3% and 37.6%, respectively, and p16 was upregulated to 167.6% in MCF-7 cells (P<0.05, Figure 4B and C). The results showed that protein levels of cell cycle-related genes cyclin D1, CDK4, respectively, and p16 were significantly changed after treatment with SA12, which was consistent with the findings from real-time PCR.
MECP2 was required for the enhanced expression of tumor suppressor gene p16 induced by SA12
To address whether MECP2 was involved in the expression regulation of tumor suppressor gene p16 when treated by SA12, we examined the gene and protein expression levels of p16 in these two cell lines in which MECP2 has been silenced by RNA interference before treatment with 100 μM SA12 for 48 hours. The results showed that MECP2 mRNA levels reduced to 25.5% and 29% in MDA-MB-231 and MCF-7 cell lines interfered by MECP2-SiRNA, respectively. After treatment with 100 μM SA12 for 48 hours, mRNA level of p16 did not change in both cell lines interfered by MECP2-SiRNA compared with the control groups (Figure 5A, P>0.05), whereas a significant increase was observed in the groups that had not been interfered with MECP2-SiRNA (P<0.05). Western blot was also employed and results revealed that the amount of MECP2 protein was reduced to 32.2% and 51.7% in MDA-MB-231 and MCF-7 cell lines interfered by MECP2-SiRNA, respectively. Moreover, after treatment with 100 μM SA12 for 48 hours, expression levels of p16 protein in both cell lines transfected with MECP2-SiRNA were not influenced in comparison with the control groups (P>0.05, Figure 5B and C), while increased in the groups that had not been interfered with MECP2-SiRNA (P<0.05). These results indicated that MECP2 was required for the enhanced expression of tumor suppressor gene p16 induced by SA12. The enhanced expression of p16 further suppressed the proliferation of breast cancer cell lines MDA-MB-231 and MCF-7 indirectly.
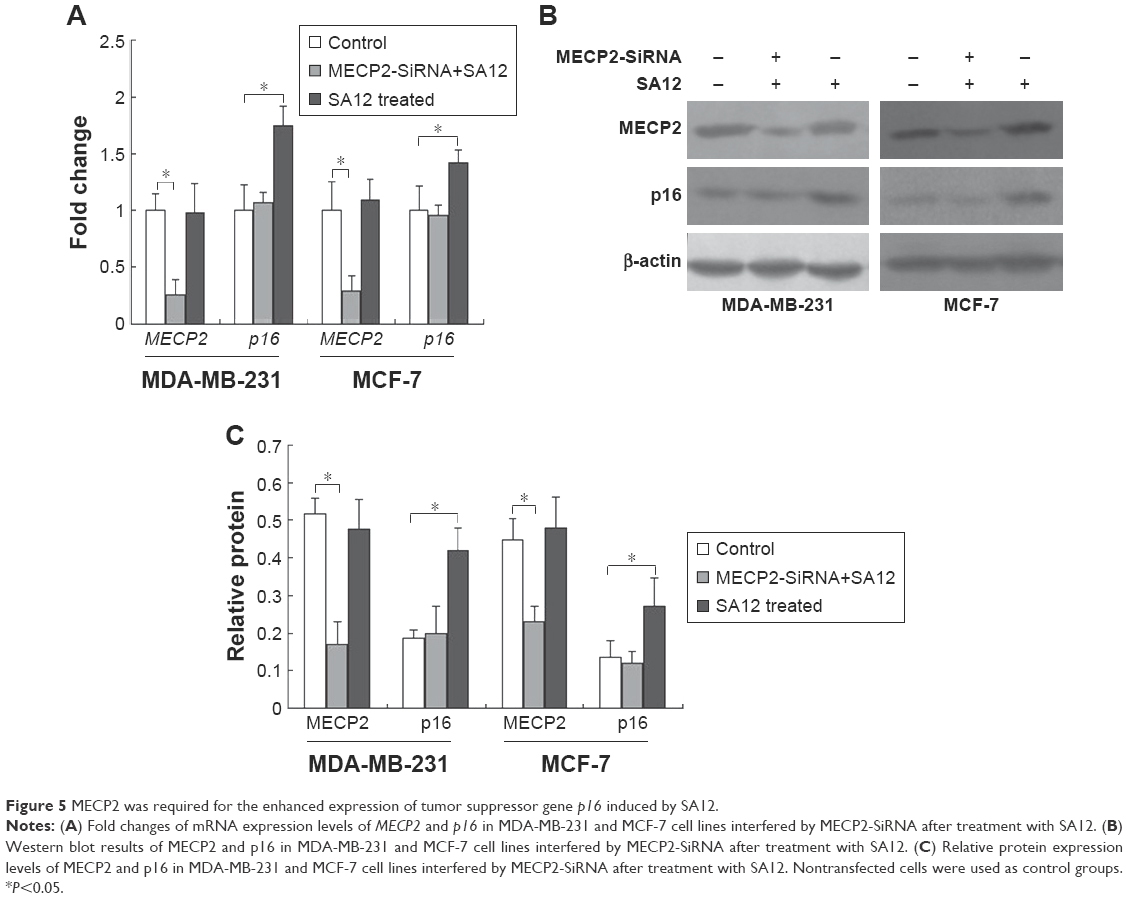 | Figure 5 MECP2 was required for the enhanced expression of tumor suppressor gene p16 induced by SA12. |
Discussion
Cancer is a leading cause of death in human beings in the world.10 Recently, molecular targeted therapy of cancer mainly focuses on disturbing of the specific molecular targets that is crucial in the development, progression, and metastasis of neoplasm. The proteins identified as biologic molecular targets involved in cellular processes include receptor proteins, signal transduction proteins, cell cycle control proteins, and functional and structural proteins. The targets for drug treatment of breast cancer have dramatically increased with deeper understanding of the molecular pathology.11 Targeted therapies have been proved promising in the treatment of breast cancer, which improved survival and quality of life in advanced breast cancer.12,13 In the previous report, we identified a novel peptide SA12, which showed significant activity in the inhibition of proliferation and induction of apoptosis in SKBr-3 cells. Additional evidence demonstrated that SA12 induced apoptosis of SKBr-3 cells via the mitochondrial pathway involving the Bcl-2 family and related caspases.7 In the current study, the potential antitumor role of SA12 was investigated in breast cancer cell lines MDA-MB-231 and MCF-7. Results showed that SA12 suppressed the proliferation of both cell lines through the G0/G1 phase cell cycle arrest. Moreover, the cell cycle-related genes cyclin D1 and CDK4 were downregulated and the tumor suppressor gene p16 was upregulated after treatment with SA12. MECP2 was required for the enhanced expression of tumor suppressor gene p16 induced by SA12, which plays an important role in the regulation of cell cycle. The enhanced expression of p16 further suppressed the proliferation of breast cancer cell lines MDA-MB-231 and MCF-7 indirectly.
MECP2 is an essential transcriptional repressor that mediates gene silencing through binding to methylated DNA, which depends on hydrophobic interactions between cytosine methyl groups and a hydrophobic patch within the methyl-CpG-binding domain.14,15 Recently, MECP2 has been identified as a frequently amplified oncogene, which is overexpressed in a number of human tumors and cell lines derived from human tumors including breast cancer.16–20 The carcinogenesis of MECP2 is dependent on its DNA-binding ability, which may result in activation of oncogenes and inactivation of tumor suppressor genes. Furthermore, tumor suppressor gene silence is frequently involved in carcinogenesis, drug resistance, and recurrence as reported.16 In this study, we found that MECP2 was required for the enhanced expression of tumor suppressor gene p16 induced by SA12. The commonly known tumor suppressor p16, which has been proven to be associated with breast cancer and other tumors, can form complexes with CDK4/CDK6 and further arrest the cell cycle progression from G1 to S phase.21 Additional investigations have also shown that p16 is suppressed by aberrant promoter hypermethylation in malignant tumors including breast cancer.22 More evidences revealed that p16 promoter methylation colocalized with overexpressed cyclin D1 in premalignant lesions and in situ carcinoma, and thus, p16 promoter methylation and overexpression of cyclin D1 simultaneously were believed to be essential in the progression of malignancy.23 Previously, cyclin D1 is considered as an important oncogene that has been extensively examined in cancer tissues and there is significant evidence of cyclin D1 involvement in breast cancer.24,25 The cyclin D1–CDK4/6–p16 pathway is considered to be involved in the regulation of the cellular processes at the transition of G1/S phases of the cell cycle.9,26,27 Particularly, cyclin D1 is verified to activate CDK4, which then phosphorylates the Rb protein leading to cell cycle progression, while p16 inhibits CDK4/CDK6 activation keeping Rb hypophosphorylated and preventing cell cycle progression.9 In the G1/S phase transition of the cell cycle, CDK4/6 in complex with cyclin D1 phosphorylates the pRb family, releasing E2F transcription factors and activating the genes responsible for S-phase progression.9,27
Conclusion
In conclusion, we determined that the peptide SA12 suppressed the proliferation of MDA-MB-231 and MCF-7 cell lines through the G0/G1 phase cell cycle arrest. Moreover, the cell cycle-associated genes cyclin D1 and CDK4 were downregulated and the tumor suppressor gene p16 was upregulated after treatment with SA12. MECP2 was required for the enhanced expression of p16 gene induced by SA12, which further inhibits CDK4/CDK6 activation and arrests the cell cycle progression from G0/G1 to S phase.
Acknowledgment
This work was supported by the Natural Science Foundation of China (grant number 81502671).
Disclosure
The authors report no conflicts of interest in this work.
References
Wu D, Gao Y, Qi Y, Chen L, Ma Y, Li Y. Peptide-based cancer therapy: opportunity and challenge. Cancer Lett. 2014;351(1):13–22. | ||
Redig AJ, McAllister SS. Breast cancer as a systemic disease: a view of metastasis. J Intern Med. 2013;274(2):113–126. | ||
Nagini S. Breast cancer: current molecular therapeutic targets and new players. Anticancer Agents Med Chem. 2016;17(2):152–163. | ||
Mine Y, Munir H, Nakanishi Y, Sugiyama D. Biomimetic peptides for the treatment of cancer. Anticancer Res. 2016;36(7):3565–3570. | ||
Craik DJ, Fairlie DP, Spiros L, David P. The future of peptide-based drugs. Chem Biol Drug Des. 2013;81(1):136–147. | ||
Marqus S, Pirogova E, Piva TJ. Evaluation of the use of therapeutic peptides for cancer treatment. J Biomed Sci. 2017;24(1):21. | ||
Yang L, Ying C, Shen J, et al. Antitumor activity of SA12, a novel peptide, on SKBr-3 breast cancer cells via the mitochondrial apoptosis pathway. Drug Des Devel Ther. 2015;9:1319–1330. | ||
Bertoli C, Skotheim JM, de Bruin RA. Control of cell cycle transcription during G1 and S phases. Nat Rev Mol Cell Biol. 2013;14(8):518–528. | ||
Emmi P, Peppi K, Kirsi-Maria H, Risto B, Arja JV. The prognostic significance and value of cyclin D1, CDK4 and p16 in human breast cancer. Breast Cancer Res. 2013;15(1):R5. | ||
Zugazagoitia J, Guedes C, Ponce S, Ferrer I, Molina-Pinelo S, Paz-Ares L. Current challenges in cancer treatment. Clin Ther. 2016;38(7):1551–1566. | ||
Ciavarella S, Milano A, Dammacco F, Silvestris F. Targeted therapies in cancer. Biodrugs. 2010;24(2):77–88. | ||
Wicki A, Rochlitz C. Targeted therapies in breast cancer. Swiss Med Weekly. 2012;142(17):w13550. | ||
Tripathy D. Targeted therapies in breast cancer. Breast J. 2015;11(Suppl 1):S30–S35. | ||
Meehan RR, Lewis JD, Bird AP. Characterization of MeCP2, a vertebrate DNA binding protein with affinity for methylated DNA. Nucleic Acids Res. 1992;20(19):5085–5092. | ||
Ho KL, McNae IW, Schmiedeberg L, Klose RJ, Bird AP, Walkinshaw MD. MeCP2 binding to DNA depends upon hydration at methyl-CpG. Mol Cell. 2008;29(4):525–531. | ||
Neupane M, Clark AP, Landini S, et al. MECP2 is a frequently amplified oncogene with a novel epigenetic mechanism that mimics the role of activated RAS in malignancy. Cancer Discov. 2016;6(1):45–58. | ||
Bernard D, Gil J, Dumont P, et al. The methyl-CpG-binding protein MECP2 is required for prostate cancer cell growth. Oncogene. 2006;25(9):1358–1366. | ||
Tong D, Zhao L, He K, et al. MECP2 promotes the growth of gastric cancer cells by suppressing miR-338-mediated antiproliferative effect. Oncotarget. 2016;7(23):34845–34859. | ||
Zhao L, Liu Y, Tong D, et al. MeCP2 promotes gastric cancer progression through regulating FOXF1/Wnt5a/β-catenin and MYOD1/caspase-3 signaling pathways. EBioMedicine. 2017;16:87–100. | ||
Koch C, Strätling WH. DNA binding of methyl-CpG-binding protein MeCP2 in human MCF7 cells. Biochemistry. 2004;43(17):5011–5021. | ||
Kotake Y, Naemura M, Murasaki C, Inoue Y, Okamoto H. Transcriptional regulation of the p16 tumor suppressor gene. Anticancer Res. 2015;35(8):4397–4401. | ||
Wang L, Tang L, Xie R, Nie W, Chen L, Guan X. p16 promoter hypermethylation is associated with increased breast cancer risk. Mol Med Rep. 2012;6(4):904–908. | ||
Liu T, Niu Y, Feng Y, et al. Methylation of CpG islands of p16(INK4a) and cyclinD1 overexpression associated with progression of intraductal proliferative lesions of the breast. Hum Pathol. 2008;39(11):1637–1646. | ||
Hochhauser D, Schnieders B, Ercikanabali E, et al. Effect of cyclin D1 overexpression on drug sensitivity in a human fibrosarcoma cell line. J Natl Cancer Inst. 1996;88(18):1269–1275. | ||
Li Z, Cui J, Yu Q, Wu X, Pan A, Li L. Evaluation of CCND1 amplification and CyclinD1 expression: diffuse and strong staining of CyclinD1 could have same predictive roles as CCND1 amplification in ER positive breast cancers. Am J Transl Res. 2016;8(1):142–153. | ||
Milde-Langosch K, Riethdorf S. Role of cell cycle regulatory proteins in gynecological cancer. J Cell Physiol. 2003;196(2):224–244. | ||
Semczuk A, Jakowicki JA. Alterations of pRb1-cyclin D1-cdk4/6-p16(INK4A) pathway in endometrial carcinogenesis. Cancer Lett. 2004;203(1):1–12. |
 © 2018 The Author(s). This work is published and licensed by Dove Medical Press Limited. The full terms of this license are available at https://www.dovepress.com/terms.php and incorporate the Creative Commons Attribution - Non Commercial (unported, v3.0) License.
By accessing the work you hereby accept the Terms. Non-commercial uses of the work are permitted without any further permission from Dove Medical Press Limited, provided the work is properly attributed. For permission for commercial use of this work, please see paragraphs 4.2 and 5 of our Terms.
© 2018 The Author(s). This work is published and licensed by Dove Medical Press Limited. The full terms of this license are available at https://www.dovepress.com/terms.php and incorporate the Creative Commons Attribution - Non Commercial (unported, v3.0) License.
By accessing the work you hereby accept the Terms. Non-commercial uses of the work are permitted without any further permission from Dove Medical Press Limited, provided the work is properly attributed. For permission for commercial use of this work, please see paragraphs 4.2 and 5 of our Terms.