")
Back to Journals » Cancer Management and Research » Volume 12
PD-L1 in Lung Adenocarcinoma: Insights into the Role of 18F-FDG PET/CT
Authors Cui Y, Li X, Du B, Diao Y, Li Y
Received 4 April 2020
Accepted for publication 20 June 2020
Published 27 July 2020 Volume 2020:12 Pages 6385—6395
DOI https://doi.org/10.2147/CMAR.S256871
Checked for plagiarism Yes
Review by Single anonymous peer review
Peer reviewer comments 3
Editor who approved publication: Dr Eileen O'Reilly
Yan Cui, Xuena Li, Bulin Du, Yao Diao, Yaming Li
Department of Nuclear Medicine, The First Hospital of China Medical University, Shenyang, Liaoning, People’s Republic of China
Correspondence: Yaming Li
Department of Nuclear Medicine, The First Hospital of China Medical University, North Nanjing Street 155, Shenyang, Liaoning 110001, People’s Republic of China
Tel +86-24-83282142
Fax +86-24-83282671
Email [email protected]
Purpose: This study aimed to evaluate the role of 18F-fluorodeoxyglucose (18F-FDG) positron emission tomography (PET)/computed tomography (CT) in expression of tumor programmed death ligand-1 (PD-L1) expression and prognostic significance of 18F-FDG PET/CT at different PD-L1 status in patients with lung adenocarcinoma.
Patients and Methods: Seventy-three patients with primary lung adenocarcinoma who received 18F-FDG PET/CT before treatment were retrospectively included in this study. Expression of tumor PD-L1, programmed death-1 (PD-1) and glucose metabolic parameters were evaluated.
Results: Tumor PD-L1 expression was positively correlated with maximum standardized uptake value (SUVmax), total lesion glycolysis (TLG), hexokinase II (HK-II) and glucose transporter 1 (GLUT-1) (P< 0.0001 for all). SUVmax was a unique independent predictor of tumor PD-L1 expression, with an optimal cut-off value of 9.5. For all the patients, tumor stage (P< 0.001) and SUVmax (P=0.009) were independent prognostic indicators of disease-free survival (DFS)/progression-free survival (PFS) while carcino-embryonic antigen (CEA) (P=0.003), Ki67 (P=0.042), PD-L1 (P=0.048) and TLG (P=0.004) were independent prognostic indicators of overall survival (OS). Tumor stage (P=0.004) and SUVmax (P=0.022) were independent prognostic indicators of DFS/PFS while TLG (P=0.012) and CEA (P=0.045) were independent prognostic indicators of OS in the PD-L1-positive group. In the PD-L1-negative group, tumor stage (P=0.002) and CEA (P=0.006) were unique independent prognostic indicators of DFS/PFS and OS, respectively.
Conclusion: 18F-FDG PET/CT may potentially predict tumor PD-L1 expression and play a role in predicting prognosis of PD-L1/PD-1 immunotherapy in lung adenocarcinoma.
Keywords: 18F-fluorodeoxyglucose, positron emission tomography, programmed death ligand-1, lung adenocarcinoma, prognosis
Introduction
Lung cancer is a malignancy associated with high morbidity and mortality.1 Lung adenocarcinoma is the most prevalent type of lung cancer.2 Current treatment options for lung adenocarcinoma include surgery, chemoradiotherapy and molecular targeted therapy. However, due to delayed diagnosis, there is an overall low survival rate among patients with lung adenocarcinoma.3
In recent years, immunotherapy, represented by the use of programmed death ligand-1 (PD-L1)/programmed death-1 (PD-1) inhibitors, has emerged as a promising treatment approach in the management of lung adenocarcinoma. Using such immune-based therapy, improved prognosis has been reported among patients with advanced-stage non-small cell lung cancer (NSCLC).4,5 However, the success of the therapy is not always guaranteed with some authors reporting discrepant outcomes regarding the response rate and prognosis.6,7 Complex mechanisms underlying response to immune checkpoint inhibitors and prognosis remain subjects of ongoing research and discussion around this field.
18F-fluorodeoxyglucose (18F-FDG) positron emission tomography (PET)/computed tomography (CT) has been extensively utilized to diagnose, stage and monitor treatment response in lung cancer. The technique is based on the assessment of tumor glucose metabolism which is closely related to glucose transporter 1 (GLUT-1) and hexokinase II (HK-II) enzyme. Previously, PD-L1 has been associated with glucose transporter and glycolysis-related enzymes;8 Furthermore, it has been shown that PD-L1 inhibitor antibody corrected the glucose metabolic imbalance in the tumor microenvironment. Therefore, tumor glycolysis has been implicated as a probable mechanism for immune evasion.8
The aim of this study, therefore, was to investigate the role of 18F-FDG PET/CT in the expression of tumor PD-L1 expression and prognostic significance of 18F-FDG PET/CT at different PD-L1 status in patients with lung adenocarcinoma.
Patients and Methods
Patients
A total of 73 patients suspected to be suffering from lung malignancy between July 2015 to February 2017, and received 18F-FDG PET/CT before treatment in the first hospital of China Medical University, were retrospectively included in this study. The inclusion criteria were a histopathological confirmation of primary lung adenocarcinoma and the patient undergoing 18F-FDG PET/CT before treatment. A patient was excluded from the study if they had any concurrent malignancy or had received any cancer-related treatments prior to the 18F-FDG PET/CT procedure. The clinicopathological characteristics of patients, such as age, gender, TNM stage (8th edition lung cancer TNM classification), tumor size, tumor differentiation, carcino-embryonic antigen (CEA) and Ki67 were documented. Information on the timepoints of patients’ events such as diagnosis, treatment, tumor progression or death was acquired from medical records. The study was approved by the ethics committee of the first hospital of China Medical University (approval number: AF-SOP-07-1.0–01). The study was conducted in accordance with the principles of patient data confidentiality and the Declaration of Helsinki. Patient consent was waived because of the retrospective nature of the study.
18F-FDG PET/CT Imaging and Data Analysis
Patients were requested to fast for at least 6 hrs before the procedure. Blood glucose levels were checked in the peripheral blood (<11mmol/L) before 18F-FDG administration. PET/CT images were acquired by PET/CT scanner (Biograph mCT, Siemens, Germany) at approximately 1hr after intravenous injection of 18F-FDG (3.7MBq/kg). CT scanning was performed from the top of the head to the middle of the thigh with 120kV, 40–210 (automatic) mA. The obtained CT images were reconstructed using I30f medium smooth algorithm. PET scan was carried out in the same position and range using the 3D imaging mode by 2 min acquisition per bed position. PET images were corrected by CT imaging and reconstructed using True X+TOF (ultra HD-PET) algorithm (2 iterations, 21sub-sets) into 400×400 matrices.
All the images were reviewed on the workstation (Syngo multimodality workplace, Siemens, Germany) by two experienced nuclear medicine physicians. Maximum standardized uptake value (SUVmax) of the primary tumor was obtained by placing volume of interest (VOI) over the lesion. Average standardized uptake value (SUVmean) and metabolic tumor volume (MTV) were acquired by VOI bordered in a threshold of 50% of SUVmax. Total lesion glycolysis (TLG) was calculated as MTV multiplied by SUVmean of the tumor.
Immunohistochemistry
Immunohistochemistry (IHC) staining was performed on 5-μm thick formalin-fixed, paraffin-embedded slides obtained from lung adenocarcinoma tissue. Antigen retrieval was performed using EDTA buffer (pH 9.0) for 20 mins after slides were deparaffinized and rehydrated. In all cases, Ultrasensitive™ SP IHC kit (Maixin Biotechnology, Fuzhou, China) was used for immunohistochemistry according to the manufacturer’s instructions. Each reagent was incubated for 30 mins. Anti-PD-L1 antibody (1:200 dilution; E1L3N; Cell Signaling Technology; USA), anti-PD-1 antibody (1:200 dilution; D4W2J; Cell Signaling Technology; USA), anti-glucose transporter 1 antibody (1:500 dilution; EPR3915; Abcam; UK), Anti-hexokinase II antibody (1:500 dilution; EPR20839; Abcam; UK) were used as primary antibodies and incubated overnight at 4°C. DAB kit (Maixin Biotechnology, Fuzhou, China) was performed for chromogen reaction according to the manufacturer’s protocol. Finally, the slides were counterstained using haematoxylin and then mounted.
All the tissue slides were evaluated in a blinded manner. Tumor proportion scores (TPS) were adopted for PD-L1 IHC staining assessment. Therefore, ≥ 25% of tumor membrane staining was considered PD-L1-positive regardless of stain intensity.9 IHC evaluation of PD-1, GLUT-1, HK-II was calculated by multiplying the percentage of positive cells by the staining intensity. The percentage of positive cells was classified as 0 (0%), 1(<10%), 2 (10–50%), 3 (50–80%) and 4 (>80%). Staining intensity was categorized as 0 (negative), 1 (weak), 2 (moderate) and 3 (strong). The IHC scores of PD-1, GLUT-1, HK-II were entered and treated as continuous variables for statistical analyses.
Statistical Analysis
The association between two continuous variables was analyzed by Mann–Whitney U-test or t-test. The association between two categorical variables was evaluated by chi-square test. The Spearman correlation analysis was performed between PD-L1 and SUVmax, TLG, MTV, GLUT-1 and HK-II expression. Logistic regression analysis was utilized to evaluate independent predictors of tumor PD-L1 expression. The optimal cut-off value to predict tumor PD-L1 expression was obtained using the receiver operating characteristic (ROC) curve. Disease-free survival (DFS)/progression-free survival (PFS) was defined as the time from the day of surgery and first-line chemotherapy/molecular targeted therapy to recurrence and progression or the latest observation, respectively. Overall survival (OS) was defined as the time from the date of surgery and first-line chemotherapy/molecular targeted therapy to death or the latest observation. In univariate and multivariate analyses, the Kaplan-Meier analysis with log-rank test and Cox proportional-hazards regression model were used to evaluate DFS/PFS and OS. Statistical significance was indicated by P<0.1 for univariate analysis of Cox proportional-hazards regression model in PD-L1 expression subgroups considering the small sample size and to allow more variables to be included in the multivariate analysis. For other analyses, statistical significance was indicated by P<0.05. Statistical analyses were performed using SPSS 21.0 software.
Results
Patient Clinicopathological Characteristics
The study enrolled 73 patients with primary lung adenocarcinoma who received 18F-FDG PET/CT before treatment. Patient clinicopathological characteristics are listed in Table 1. There were 42 women and 31 men with average age of 61.5±8.6 years among all the patients. There were 49 (67.1%) patients diagnosed as stage I/stage II and 24 (32.9%) categorized as stage III /stage IV with an average tumor size of 27.6±13.2mm. 43 (58.9%) of the tumors were well/moderately differentiated with the rest being poorly differentiated. The median CEA and Ki67 were 3.1 (2.2, 6.4) and 10.0 (5.0, 25.0), respectively, and the mean SUVmax, median MTV, and TLG of primary tumors were 8.2±5.2, 3.8 (1.9, 5.8) and 14.0 (5.8, 36.6), respectively.
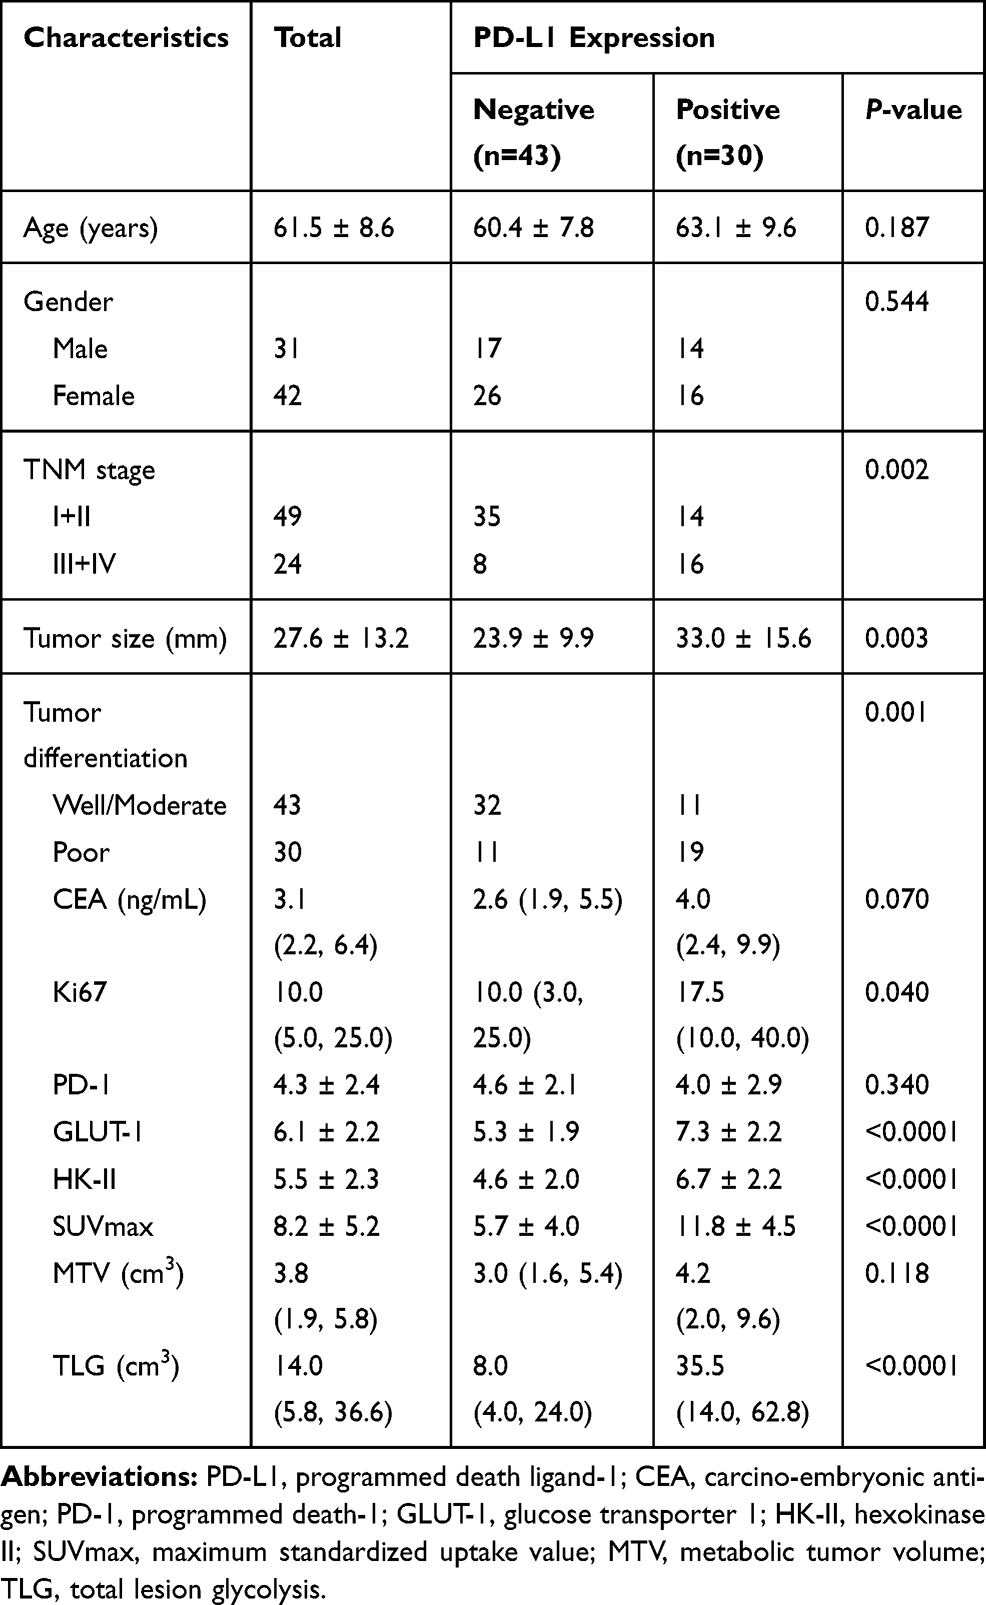 |
Table 1 Association Between PD-L1 Expression with Clinicopathological and Glycolytic Characteristics in Primary Lung Adenocarcinoma |
Association Between PD-L1 Expression with Clinicopathological Characteristics in Primary Lung Adenocarcinoma
Patients were classified according to their PD-L1 IHC expression profile as either PD-L1-positive (TPS ≥ 25, n=30) or PD-L1-negative (TPS < 25, n=43). Representative 18F-FDG PET/CT with SUVmax 23.5 and IHC staining images of HK-II, GLUT-1, PD-1 and PD-L1 of patient with PD-L1-positive expression are displayed in Figure 1A–E while representative 18F-FDG PET/CT with SUVmax 5.1 and IHC staining images of HK-II, GLUT-1, PD-1 and PD-L1 of patient with PD-L1-negative expression are displayed in Figure 2A–E. In all cases, larger tumors, higher Ki67, advanced tumor staging and poor tumor differentiation were observed in the PD-L1-positive group (P<0.05 for all). There were no significant differences with regards to age, gender, CEA and PD-1 between the groups (Table 1).
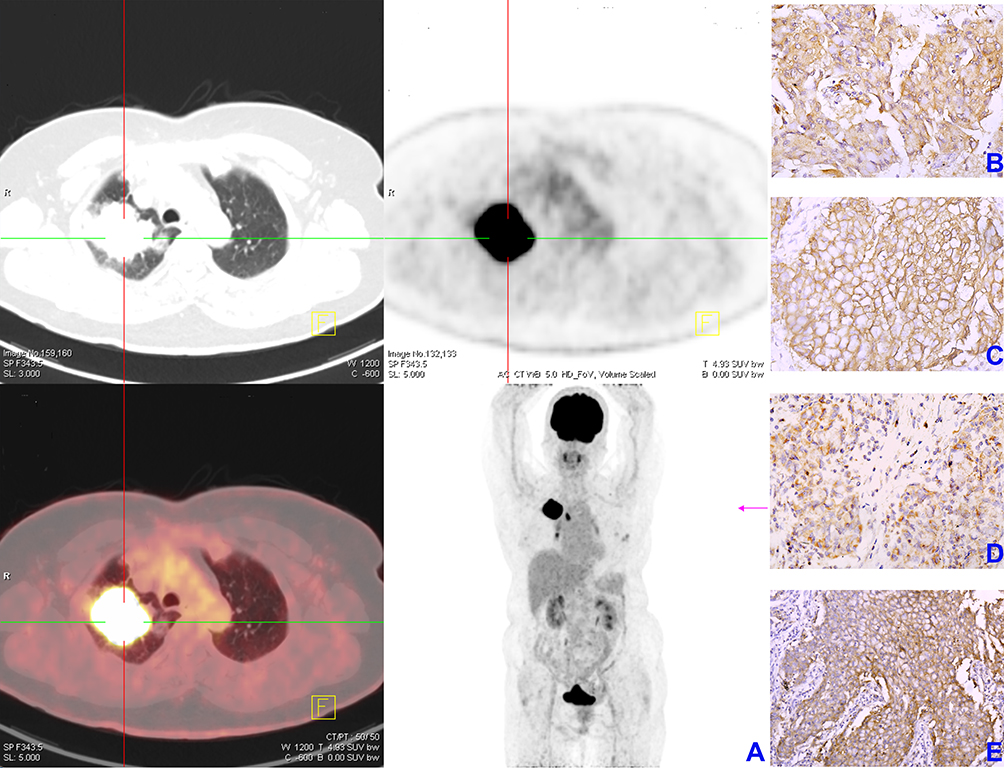 |
Figure 1 Representative images of 18F-FDG PET/CT and immunohistochemical staining of HK-II, GLUT-1, PD-1 and PD-L1 in lung adenocarcinoma patient with PD-L1-positive expression. (A) 18F-FDG PET/CT imaging, SUVmax of primary lung adenocarcinoma was 23.5; (B) HK-II; (C) GLUT-1; (D) PD-1; (E) PD-L1 (magnification×400). Abbreviations: 18F-FDG PET/CT, 18F-fluorodeoxyglucose (18F-FDG) positron emission tomography (PET)/computed tomography (CT); HK-II, hexokinase II; GLUT-1, glucose transporter 1; PD-1, programmed death-1; PD-L1, programmed death ligand-1; SUVmax, maximum standardized uptake value. |
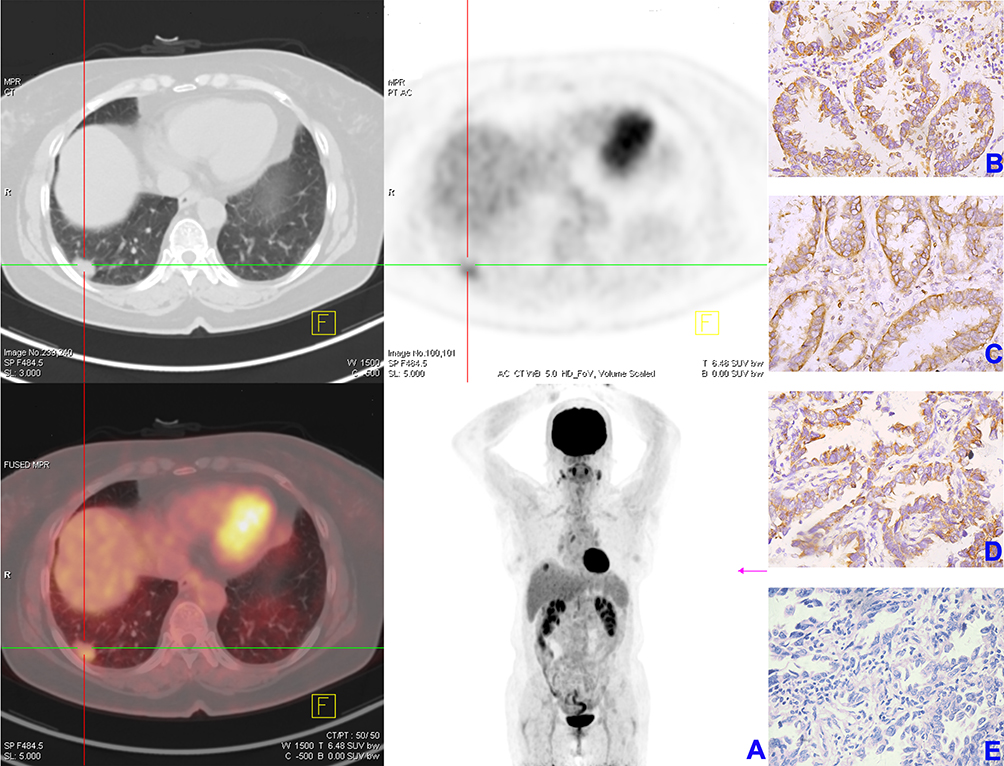 |
Figure 2 Representative images of 18F-FDG PET/CT and immunohistochemical staining of HK-II, GLUT-1, PD-1 and PD-L1 in lung adenocarcinoma patient with PD-L1-negative expression. (A) 18F-FDG PET/CT imaging, SUVmax of primary lung adenocarcinoma was 5.1; (B) HK-II; (C) GLUT-1; (D) PD-1; (E) PD-L1 (magnification×400). Abbreviations: 18F-FDG PET/CT, 18F-fluorodeoxyglucose (18F-FDG) positron emission tomography (PET)/computed tomography (CT); HK-II, hexokinase II; GLUT-1, glucose transporter 1; PD-1, programmed death-1; PD-L1, programmed death ligand-1; SUVmax, maximum standardized uptake value. |
Correlation Between Tumor PD-L1 Expression and Glucose Metabolic Parameters
While there were no significant differences in MTV between the groups, SUVmax, TLG, GLUT-1 and HK-II were significantly higher among PD-L1-positive patients (P<0.0001 for all) (Table 1, Figure 3).
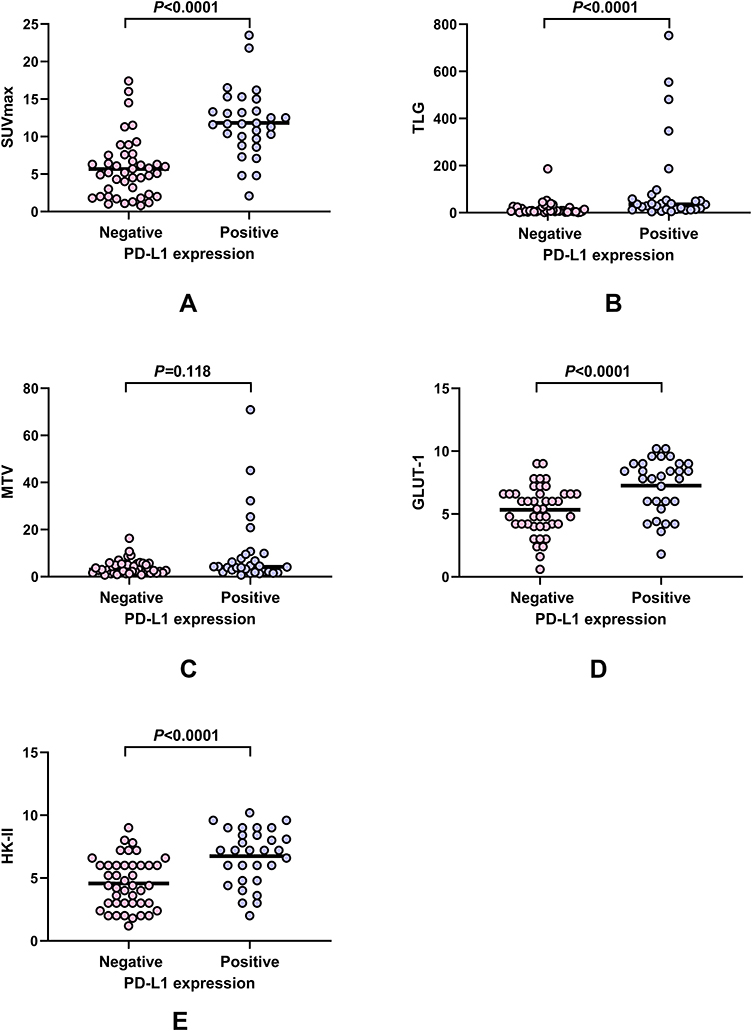 |
Figure 3 Association between PD-L1 expression with glycolytic characteristics in primary lung adenocarcinoma. SUVmax and TLG were higher in PD-L1-positive group than PD-L1-negative group (both of P<0.0001) (A and B) and no statistically significant difference for MTV between PD-L1-positive group and PD-L1-negative group (P=0.118) (C); GLUT-1 and HK-II expression were higher in PD-L1-positive group than PD-L1-negative group (both of P<0.0001) (D and E). Abbreviations: 18F-FDG PET/CT, 18F-fluorodeoxyglucose (18F-FDG) positron emission tomography (PET)/computed tomography (CT); SUVmax, maximum standardized uptake value; MTV, metabolic tumor volume; TLG, total lesion glycolysis; HK-II, hexokinase II; GLUT-1, glucose transporter 1. |
Statistically significant positive correlations were observed between PD-L1 expression and SUVmax (rho=0.606; P<0.0001), TLG (rho=0.522; P<0.0001), HK-II (rho=0.458; P<0.0001) and GLUT-1 (rho=0.426; P<0.0001). There was no statistically significant correlation between PD-1 expression and SUVmax, PD-1 expression and MTV, PD-1 expression and TLG, PD-1 expression and HK-II expression, PD-1 expression and GLUT-1 expression.
Clinicopathological and Glycolytic Characteristics Associated with PD-L1 Expression in Primary Lung Adenocarcinoma
Based on univariate analysis, the tumor stage, tumor differentiation, tumor size, GLUT-1, HK-II, SUVmax and TLG were significantly associated with PD-L1 expression (P<0.05). Upon multivariate analysis, SUVmax was identified as the unique independent factor predictive of tumor PD-L1 expression (OR: 1.328, 95% CI: 1.066–1.655) with P = 0.012 (Table 2).
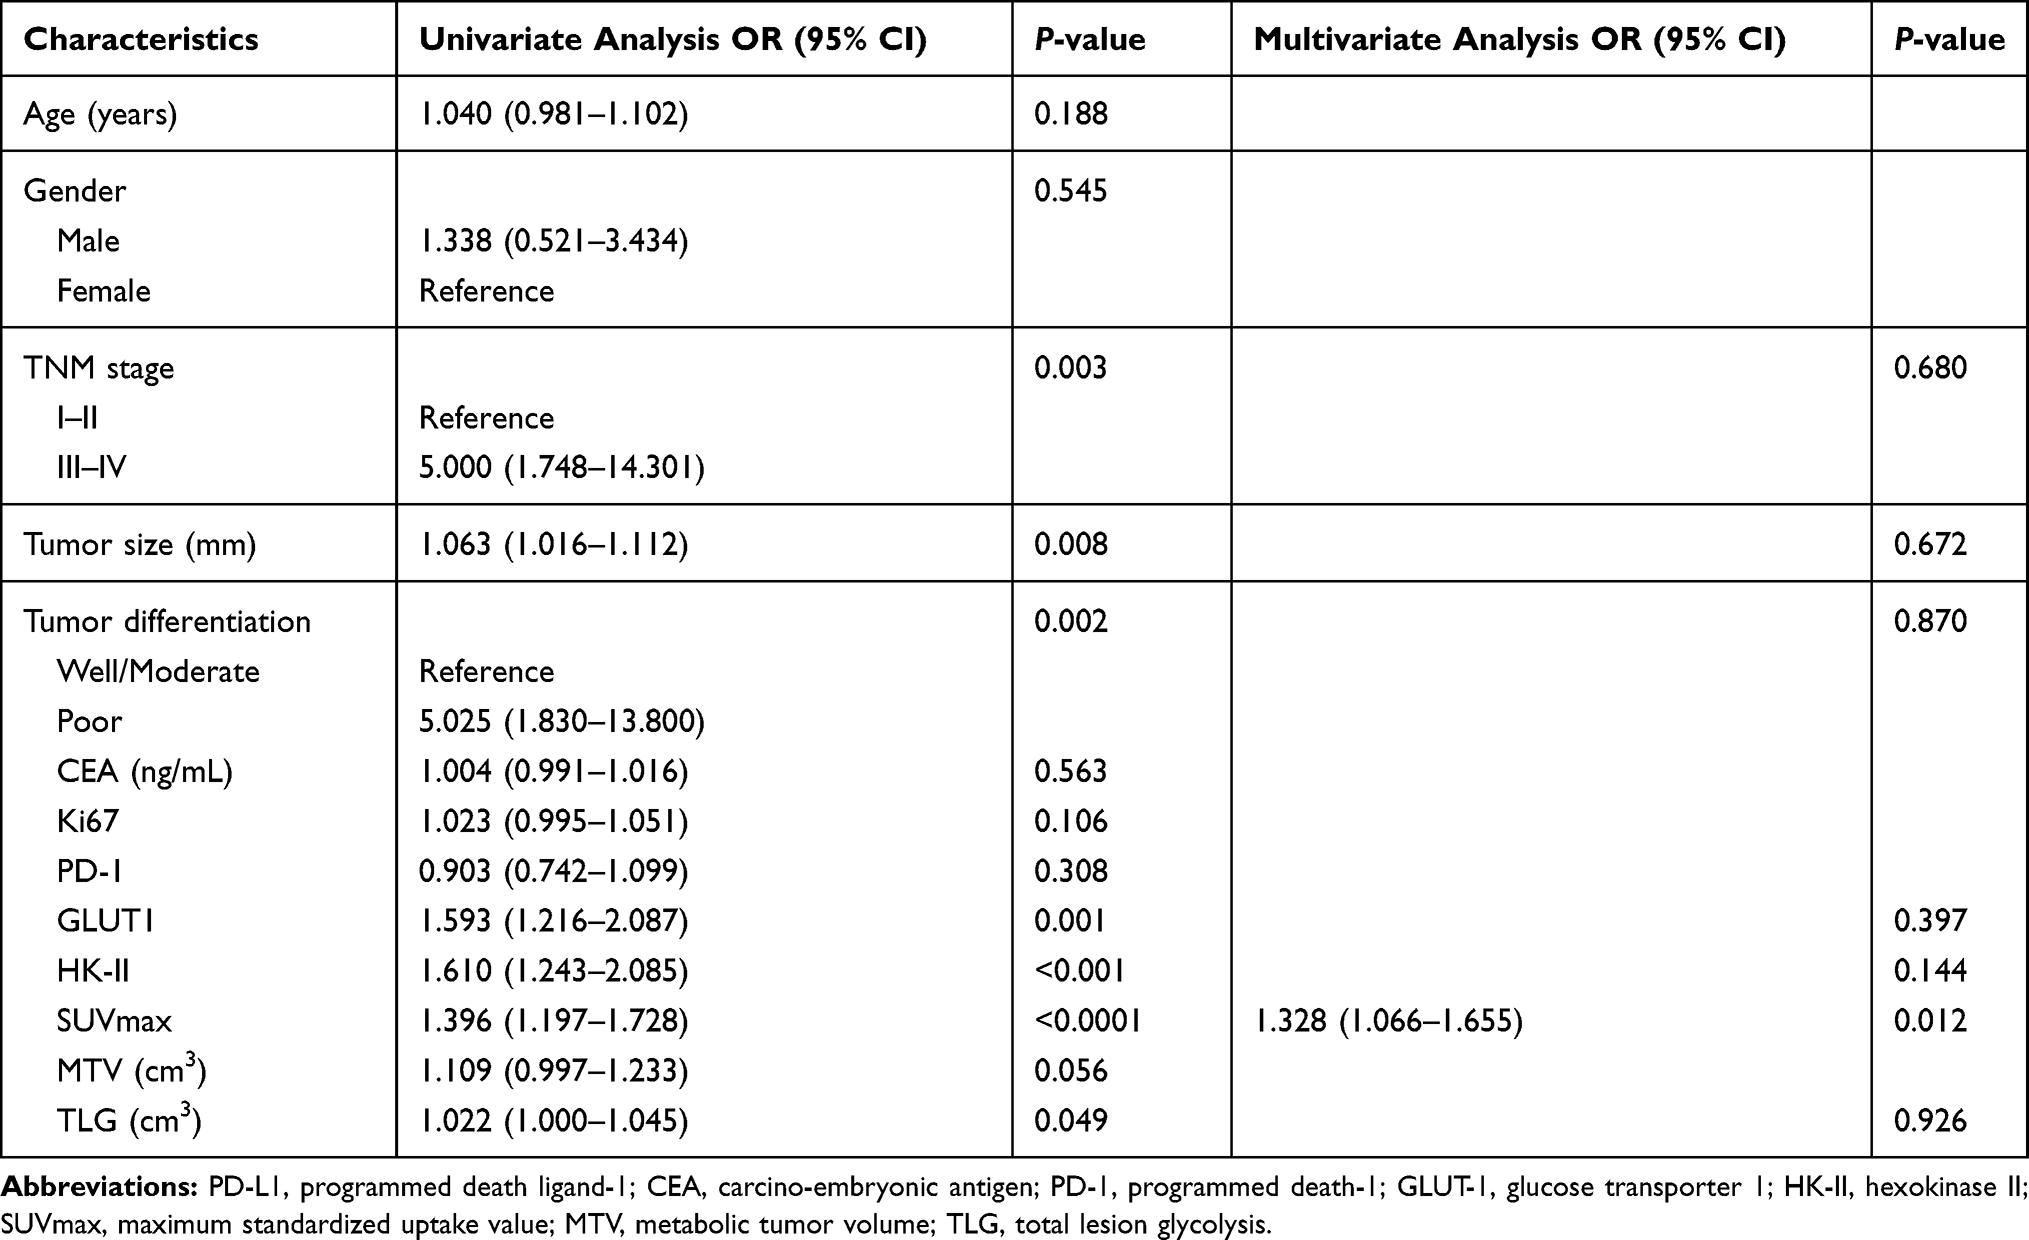 |
Table 2 Clinicopathological and Glycolytic Characteristics Associated with PD-L1 Expression in Primary Lung Adenocarcinoma |
ROC curve analysis was applied to assess the ability of SUVmax to distinguish tumor PD-L1 expression in primary lung adenocarcinoma. The area under the curve (AUC) was 0.855 (95% CI, 0.764–0.947) with P<0.0001, indicating that SUVmax has the potential to predict PD-L1 expression. The optimal cut-off value of SUVmax in predicting tumor PD-L1 expression was 9.5 with 76.7% sensitivity and 88.4% specificity (Figure 4).
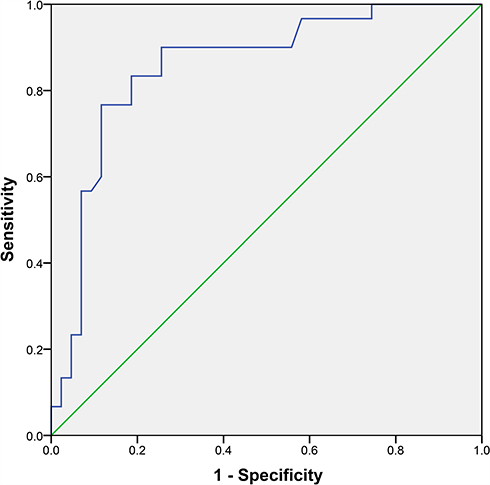 |
Figure 4 ROC curve analysis assessing the potentially of SUVmax to predict tumor PD-L1 expression in primary lung adenocarcinoma. AUC was 0.855 (95% CI, 0.764–0.947, P<0.0001); The optimal cut-off value of SUVmax for predicting tumor PD-L1 expression was 9.5 with 76.7% sensitivity and 88.4% specificity. Abbreviations: ROC, receiver operating characteristic; AUC, area under the curve; SUVmax, maximum standardized uptake value; PD-L1, programmed death ligand-1. |
Univariate and Multivariate Survival Analysis
Based on the three-year DFS/PFS and OS outcome of the 73 patients, 24 patients suffered recurrent disease and 11 patients died of causes related to lung adenocarcinoma.
First, univariate and multivariate analyses were performed in all patients. For univariate analysis, tumor stage, tumor size, CEA, Ki67, PD-L1 expression, GLUT-1 expression, HK-II expression, SUVmax, MTV and TLG were identified as significant prognostic predictors for DFS/PFS. Tumor stage, tumor size, tumor differentiation, CEA, Ki67, PD-L1 expression, GLUT-1 expression, HK-II expression, SUVmax, MTV and TLG were significantly associated with the OS (Table 3). Based on the results of univariate analysis, we screened variables with P<0.05. For multivariate analysis, higher SUVmax (P=0.009) and advanced tumor stage (P<0.001) were independent prognostic indicators of worse DFS/PFS. Positive PD-L1 expression (P=0.048), higher TLG (P=0.004), higher CEA (P=0.003) and higher Ki67 (P=0.042) were independent prognostic indicators of worse OS (Table 3).
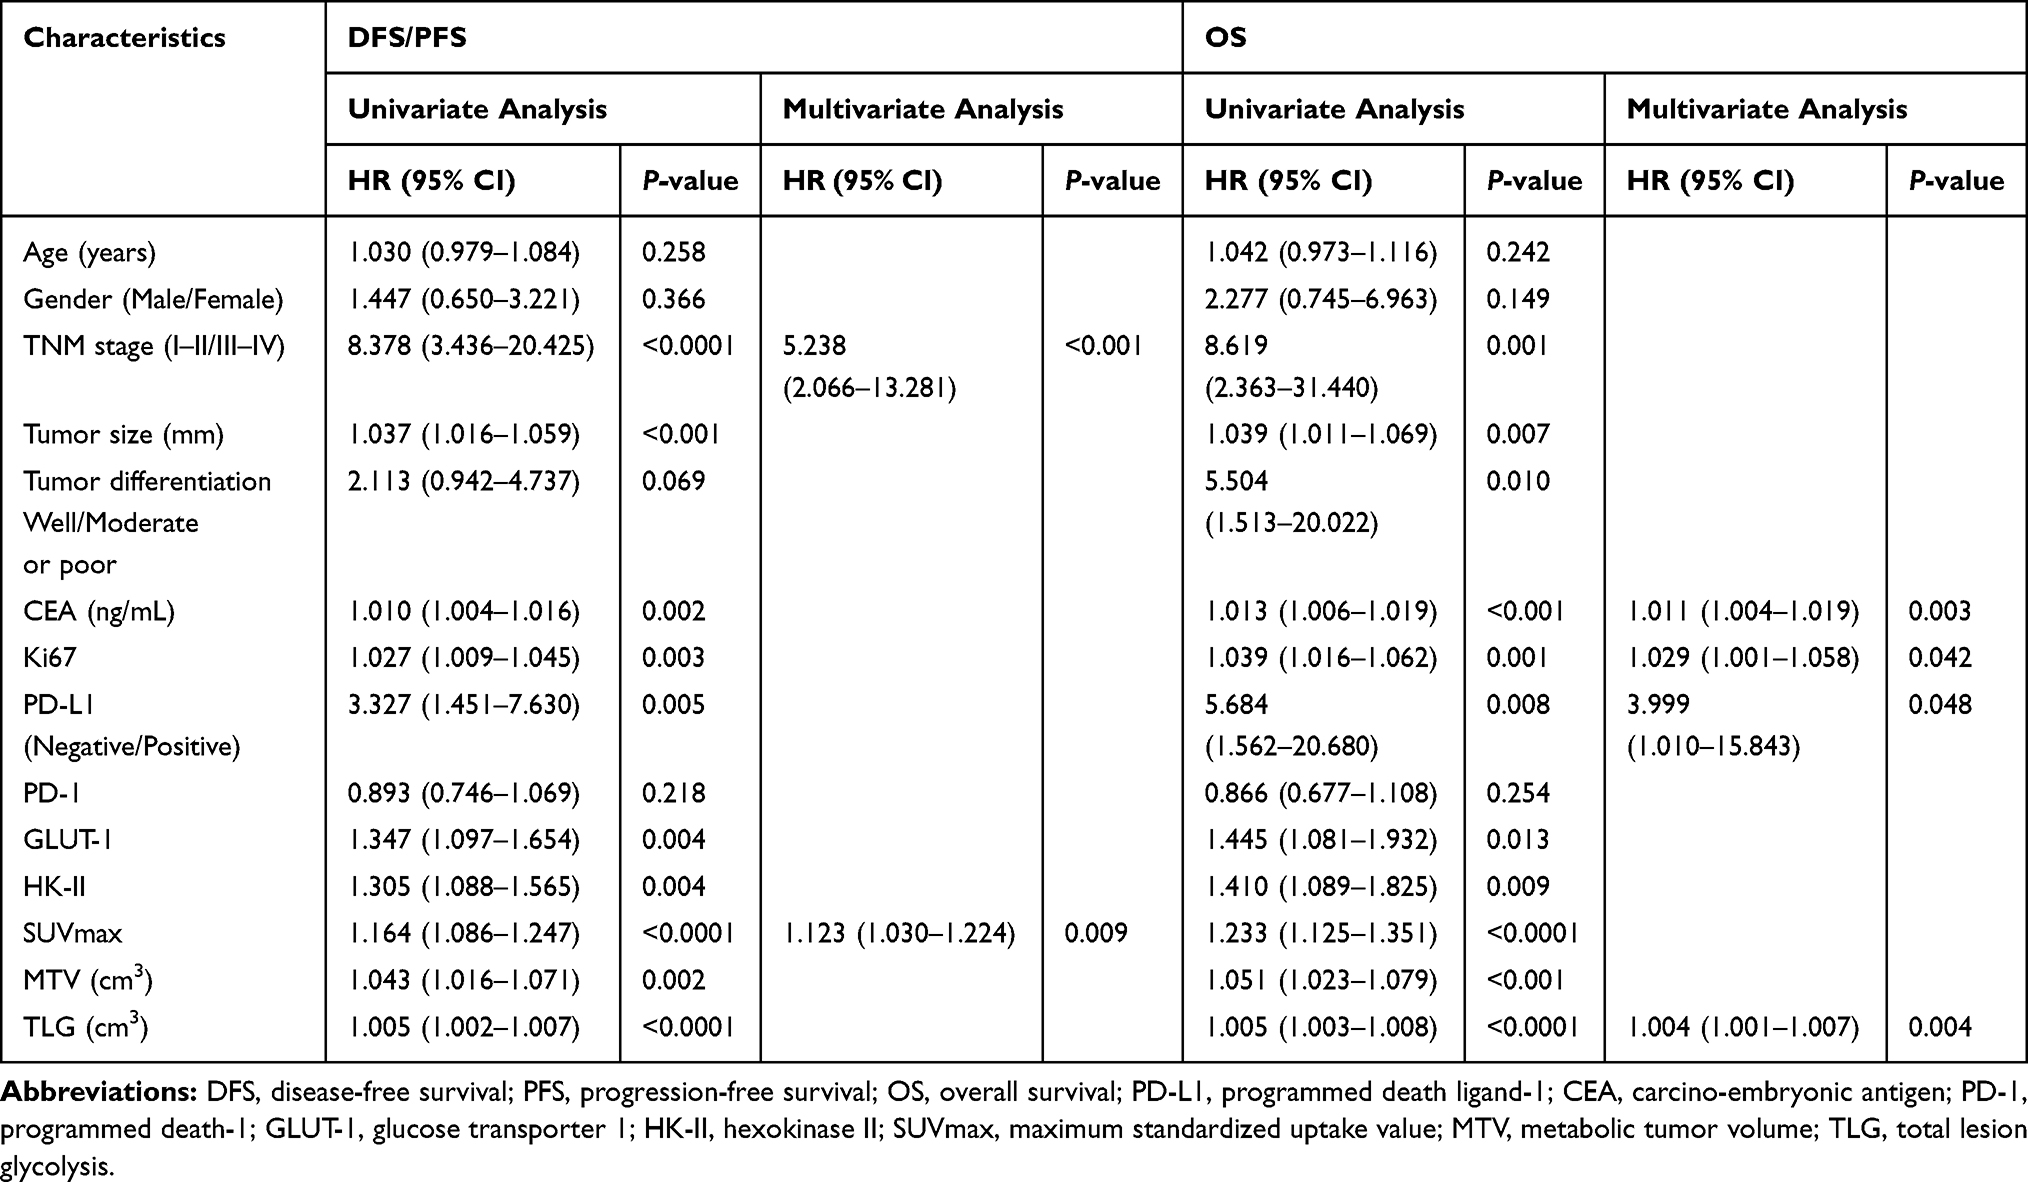 |
Table 3 Prognostic Factors for DFS/PFS and OS for All the Patients |
Next, univariate and multivariate analyses were performed among patients in the PD-L1-positive group. For univariate analysis, tumor stage, tumor size, CEA, HK-II expression, SUVmax, MTV and TLG were identified as significant prognostic predictors for DFS/PFS. Tumor stage, tumor size, CEA, Ki67, SUVmax, MTV and TLG were significantly associated with the OS (Table 4). Based on the results of univariate analysis, we screened variables with P<0.1. For multivariate analysis, higher SUVmax (P=0.022) and advanced tumor stage (P=0.004) were independent prognostic indicators of worse DFS/PFS. Higher TLG (P=0.012) and higher CEA (P=0.045) were independent prognostic indicators of worse OS (Table 4).
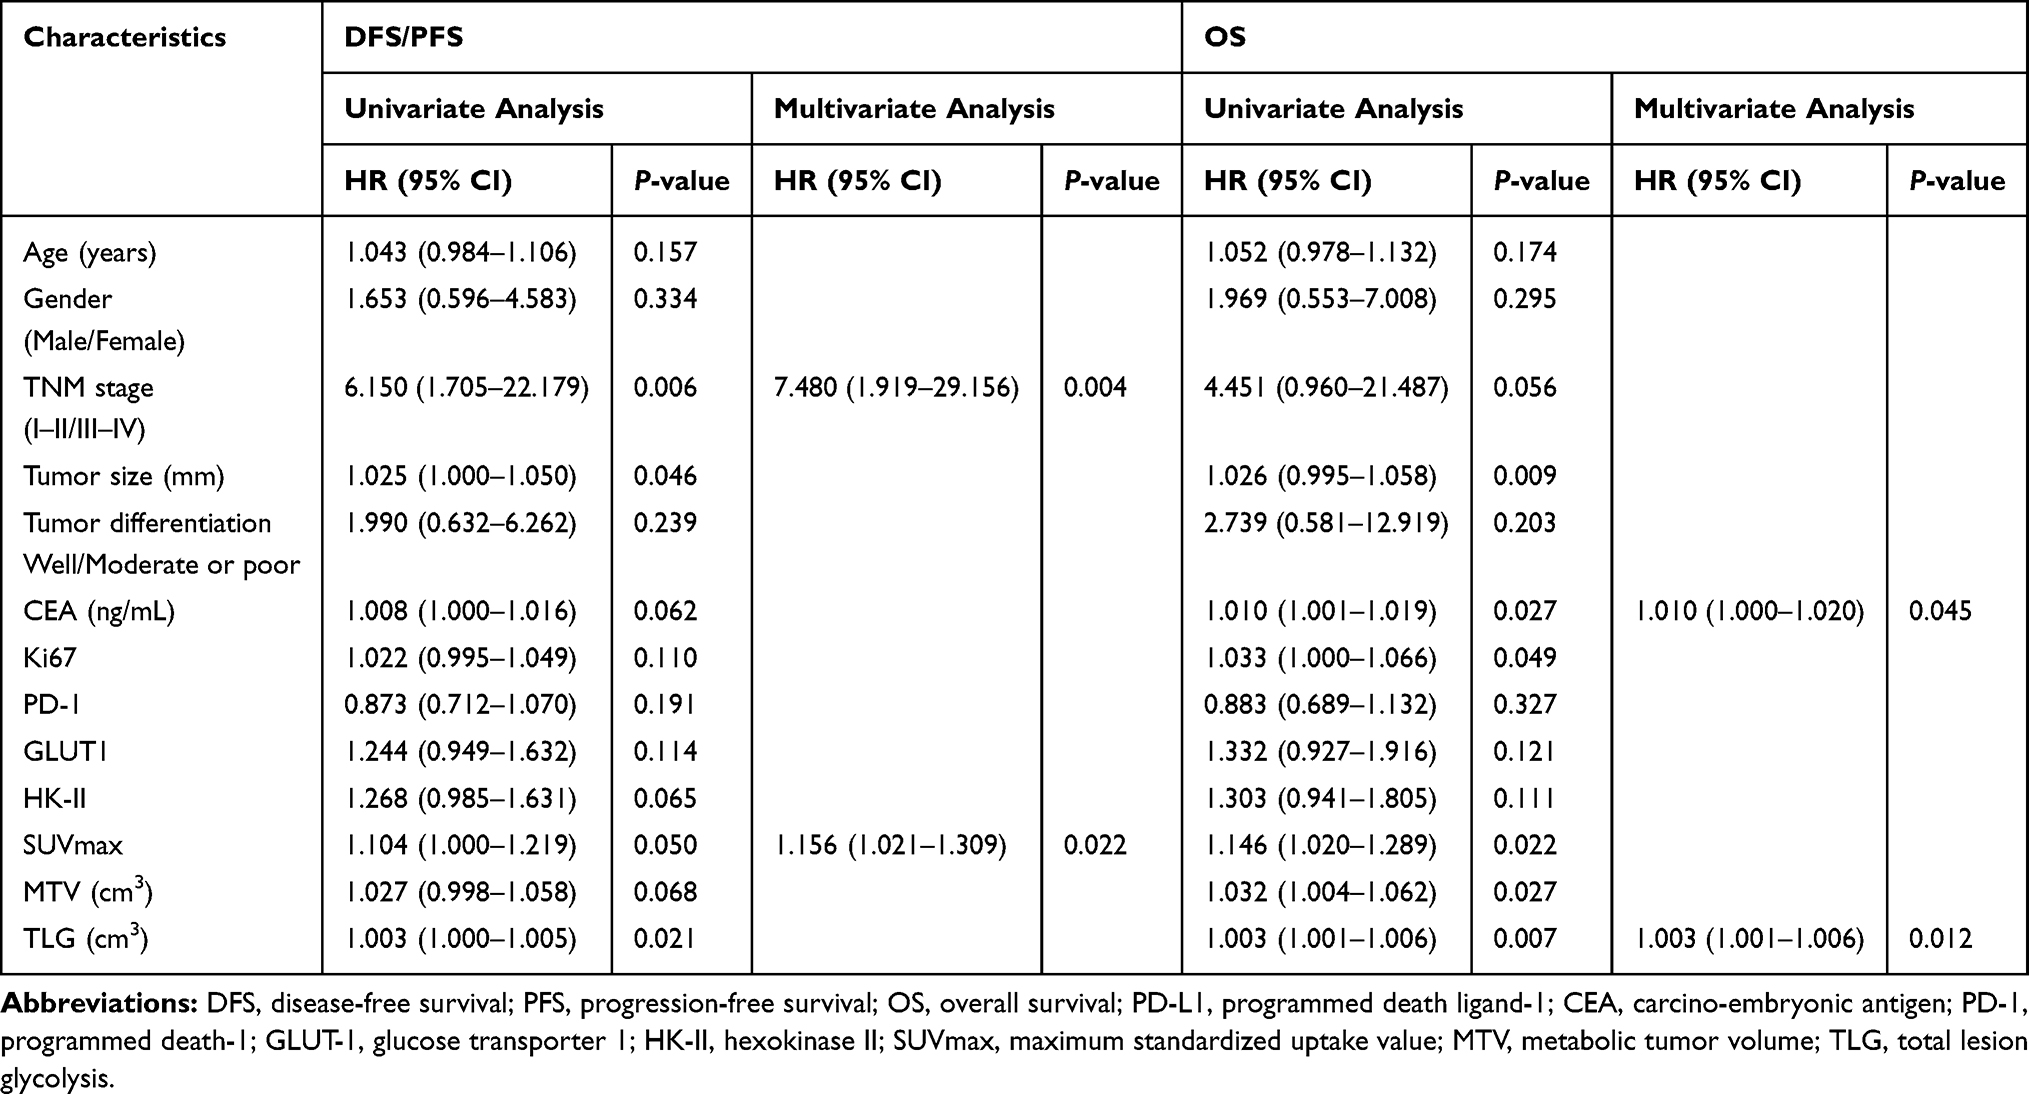 |
Table 4 Prognostic Factors for DFS/PFS and OS for the Patients in PD-L1-Positive Group |
Next, univariate and multivariate analyses were performed among patients in the PD-L1-negative group. For univariate analysis, tumor stage, CEA, Ki67, SUVmax and TLG were identified as significant prognostic predictors of DFS/PFS. Tumor stage, CEA, Ki67, SUVmax, MTV and TLG were significantly associated with the OS (Table 5). Based on the results of univariate analysis, we screened variables with P<0.1. Upon multivariate analysis, advanced tumor stage (P=0.002) and higher CEA (P=0.006) were independent prognostic indicators of worse DFS/PFS and OS, respectively (Table 5).
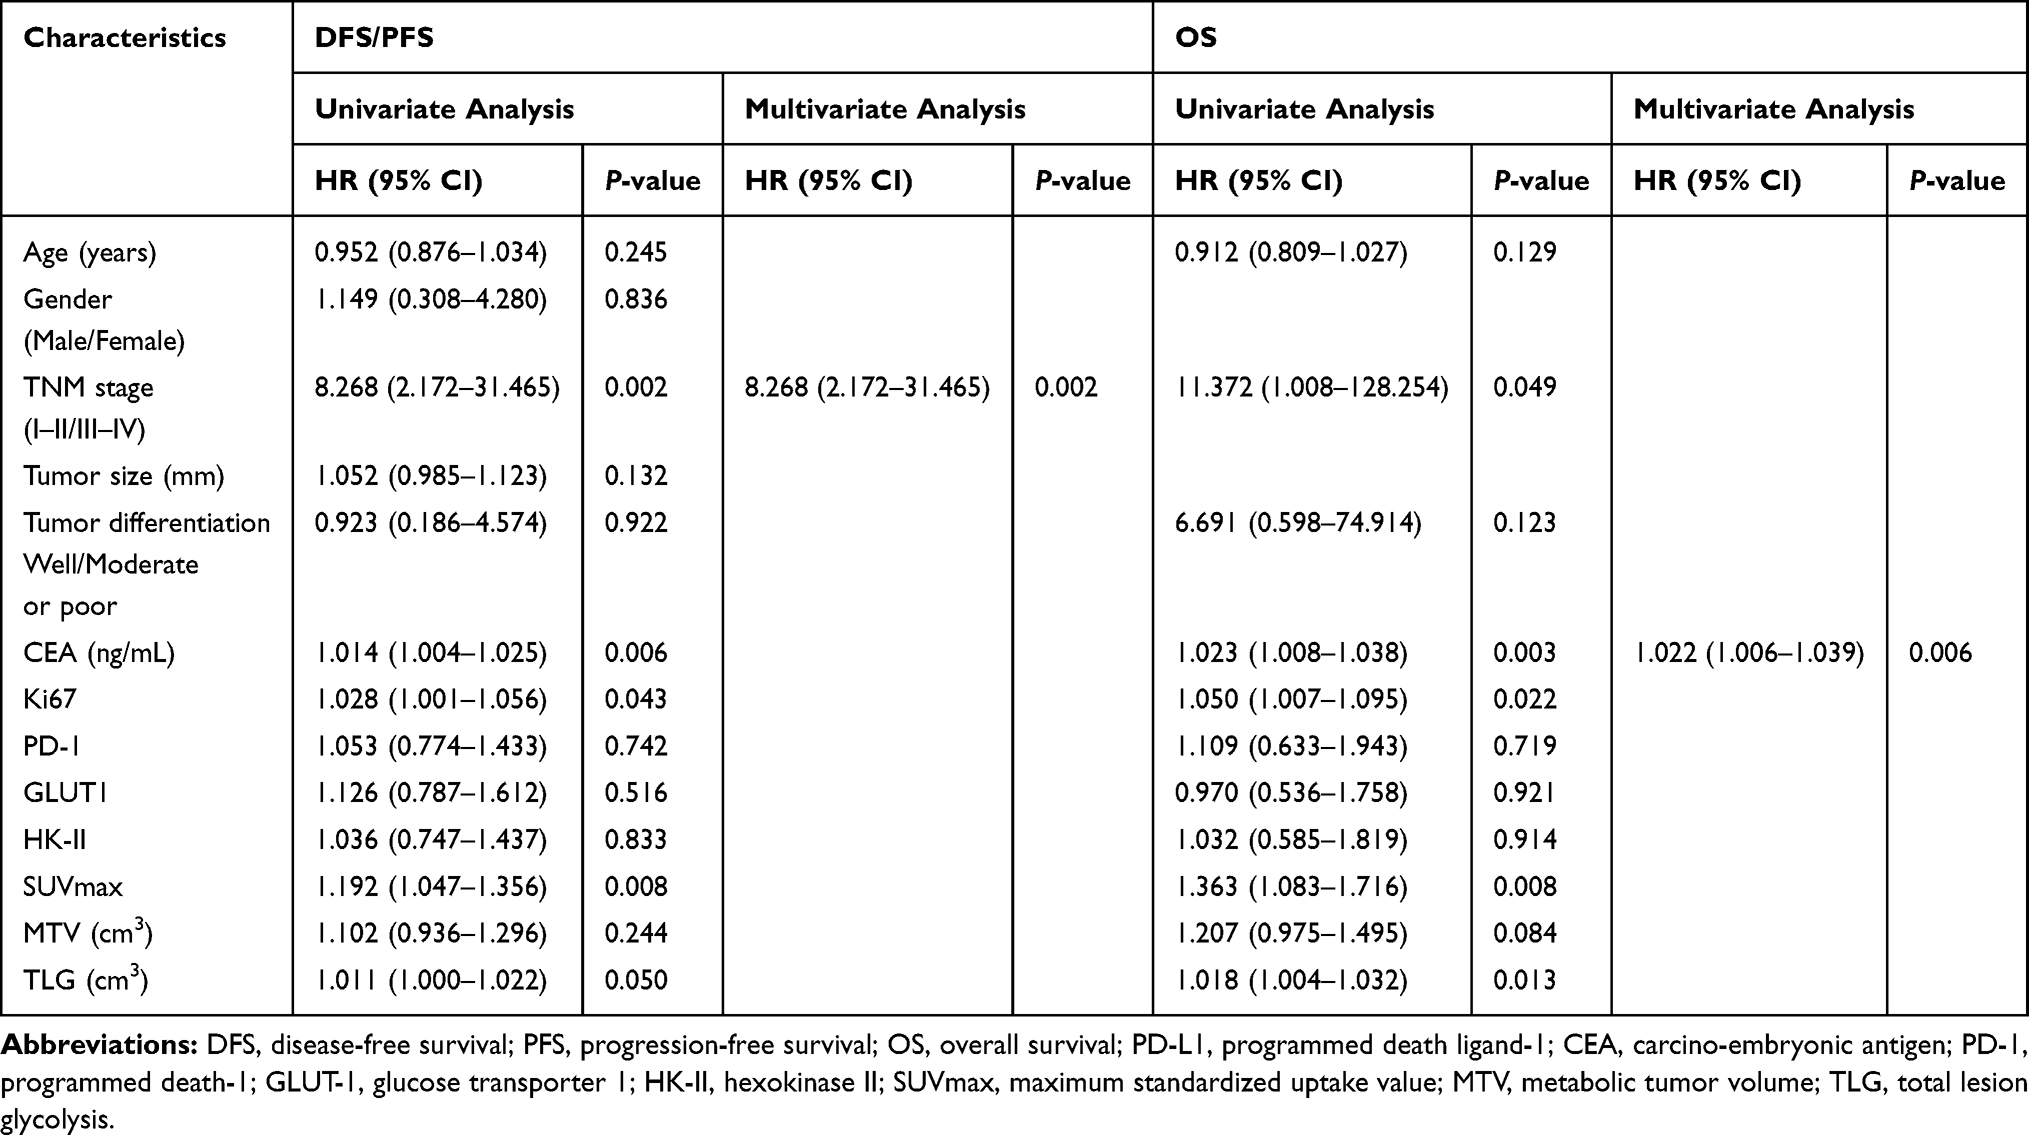 |
Table 5 Prognostic Factors for DFS/PFS and OS for the Patients in PD-L1-Negative Group |
Discussion
In the present study, the correlation of tumor PD-L1 expression and 18F-FDG PET/CT metabolic information in patients with lung adenocarcinoma were investigated. We found that tumor PD-L1 expression was positively correlated with 18F-FDG PET/CT metabolic information and tumor GLUT-1/HK-II expression. Compared to the PD-L1-negative group, SUVmax, TLG, tumor GLUT-1 and HK-II expression were significantly higher in the PD-L1-positive group. Larger tumor size, higher Ki67, advanced tumor stage and worse tumor differentiation were observed in the PD-L1-positive group. Additionally, SUVmax was identified as a unique independent predictor of tumor PD-L1 expression. The study found the optimal cut-off SUVmax in predicting tumor PD-L1 expression in primary lung adenocarcinoma to be 9.5.
Currently, IHC is the main approach used to evaluate PD-L1. However, there are varied methods and criteria used to define PD-L1 expression; this can confound the diagnostic accuracy, emphasizing the requirement for standardization of diagnostic methodology.10,11 Moreover, in view of possible heterogeneity of PD-L1 expression by a tumor mass, sufficient quality and quantity of biopsy tissue for PD-L1 IHC evaluation should be guaranteed.12 It has been reported previously that inflammatory processes have led to initially PD-L1-negative tumors at baseline to be eventually assessed as actually being positive.13 As with other studies,14,15 the results of our study indicated that 18F-FDG PET/CT could potentially predict tumor PD-L1 expression, non-invasively.
Further investigation of the study results suggested that higher SUVmax and advanced tumor stage were independent prognostic indices of worse DFS/PFS. Positive PD-L1 expression, higher TLG, higher CEA and higher Ki67 were independent prognostic predictors of worse OS. Currently, the prognostic significance of PD-L1 expression in lung carcinoma is still controversial.16,17 A meta-analysis of PD-L1 expression and prognosis of NSCLC patients suggested that PD-L1 expression was a prognostic factor related to poor survival.18 However, in their study, Aguiar et al reported that PD-L1 expression was related to better progression-free survival (HR: 0.69, 95% CI: 0.57–0.85) and better overall survival (HR: 0.77, 95% CI: 0.67–0.89).19 Possible explanations for these indeterminate observations may be discrepancy in study design such as biomarker requirements (cut-off value, tumor heterogeneity, the inclusion of tumor stromal cells), length of the follow-up period and sample size. Considering these factors, results from the present study indicated that the prognostic significance of tumor PD-L1 expression should be concerned and evaluated.
In particular, we found that higher glucose metabolic parameters of 18F-FDG PET/CT (SUVmax/TLG) could be a significant marker for predicting a worse outcome in PD-L1-positive but not PD-L1-negative patients. Although some patients could achieve a long-lasting response to PD-L1/PD-1 inhibitor therapies with better survival,20 the mechanisms leading to differential response rates and outcomes of PD-L1/PD-1 inhibitor therapies are currently poorly understood and are the subject of ongoing investigations. PD-L1 expression may not be the unique factor that predicts efficacy and prognosis of PD-L1/PD-1 inhibitors. Complex anti-tumor immune response within the tumor microenvironment may not be fully represented by a single biomarker. Identifying the characteristics involved in anti-tumor immune response is important and warranted. It has been found that tumor immune evasion was closely related to tumor metabolic reprogramming within the tumor microenviroment.21–23 On one hand, tumor metabolic reprogramming empowers tumor cells to compete for glucose in the tumor microenvironment over immune cells, a scenario that causes the infiltrated immune cells to lose their anti-tumor function due to glucose deprivation. On the other hand, tumor metabolic reprogramming reduces the tumor microenvironment pH by up-regulating glycolysis. This impairs the maturation and activation of antigen-presenting cells and primary cytotoxic T cells. Indeed, Chang and colleagues found that T cells activities were curtailed by tumor glycolysis. This led to their dampened mTOR activity, glycolytic capacity and IFN-γ production, thereby allowing tumor progression.8 On their part, Shukuya and co-workers found that IFN-γ expression presented the highest correlation with response to PD-1/PD-L1 immune checkpoint inhibitors in NSCLC; the RR was 33% (14 of 43) and 8% (6 of 79) in IFN-γ-positive and IFN-γ-negative patients, respectively. Moreover, combined IFN-γ-positive and PD-L1-positive patients displayed the highest RR (46%; 10 of 22).24 Therefore, other variables, such as tumor-infiltrating cells, mutational gene and inflammatory gene signatures,25,26 some of which are related to tumor glycolysis,27,28 may be meaningful for the prognosis analysis of PD-L1/PD-1 inhibitor therapies. Consequently, 18F-FDG PET/CT may play a role in predicting the prognosis of PD-L1/PD-1 immunotherapy in lung adenocarcinoma.
There were several limitations in this study. Firstly, this study was retrospectively performed in a single institution with a small sample size. Consequently, a multicenter and large sample size research on 18F-FDG PET/CT and other prognostic predictors of lung adenocarcinoma patients treated with PD-L1/PD-1 inhibitors in lung adenocarcinoma should be considered. Secondly, PD-L1 IHC was accomplished using only one PD-L1 antibody with one cut-off value. Previous study has found that different PD-L1 antibody and different cut-off values generated discordant PD-L1 IHC evaluation;29 Hence, different PD-L1 antibody and cut-off values should be utilized and compared in future studies. Thirdly, a 3-year follow-up time period was relatively short with much censored data for most stage I–II patients who presented with stable and healthy statuses. A longer follow-up period is recommended to further evaluate the prognostic significance of PD-L1. Lastly, we did not consider patients’ therapeutic schedule (Table S1) when conducting the prognosis analysis, this is, therefore, suggested for future studies, to factor-in the effect of treatment on the prognosis.
Conclusion
Tumor PD-L1 expression was significantly positively associated with 18F-FDG uptake and glucose metabolism. Higher metabolic parameters of 18F-FDG PET/CT (SUVmax and TLG) could be significant predictors of worse outcomes among PD-L1-positive but not PD-L1-negative patients. Therefore, 18F-FDG PET/CT may potentially predict tumor PD-L1 expression and play a role in predicting the efficacy of PD-L1/PD-1 immunotherapy in patients with lung adenocarcinoma.
Acknowledgments
We would like to thank the teachers and staff in our department who provided us with valuable guidance and help in study implementation and data acquisition.
Disclosure
The authors report no conflicts of interest in this work.
References
1. Siegel RL, Miller KD, Jemal A. Cancer statistics, 2019. CA Cancer J Clin. 2019;69(1):7–34. doi:10.3322/caac.21551
2. Travis WD, Brambilla E, Burke AP, Marx A, Nicholson AG. Introduction to the 2015 world health organization classification of tumors of the lung, pleura, thymus, and heart. J Thorac Oncol. 2015;10(9):1240–1242. doi:10.1097/JTO.0000000000000663
3. Yoon SM, Shaikh T, Hallman M. Therapeutic management options for stage III non-small cell lung cancer. World J Clin Oncol. 2017;8(1):1–20. doi:10.5306/wjco.v8.i1.1
4. Rittmeyer A, Barlesi F, Waterkamp D, et al. Atezolizumab versus docetaxel in patients with previously treated non-small-cell lung cancer (OAK): a phase 3, open-label, multicentre randomised controlled trial. Lancet. 2017;389(10066):255–265. doi:10.1016/S0140-6736(16)32517-X
5. Ellis PM, Vella ET, Ung YC. Immune checkpoint inhibitors for patients with advanced non-small-cell lung cancer: a systematic review. Clin Lung Cancer. 2017;18(5):444–U475. doi:10.1016/j.cllc.2017.02.001
6. O’Donnell JS, Long GV, Scolyer RA, Teng MWL, Smyth MJ. Resistance to PD1/PDL1 checkpoint inhibition. Cancer Treat Rev. 2017;52:71–81. doi:10.1016/j.ctrv.2016.11.007
7. Duma N, Santana-Davila R, Molina JR. Non–small cell lung cancer: epidemiology, screening, diagnosis, and treatment. Mayo Clin Proc. 2019;94(8):1623–1640. doi:10.1016/j.mayocp.2019.01.013
8. Chang C-H, Qiu J, O’Sullivan D, et al. Metabolic competition in the tumor microenvironment is a driver of cancer progression. Cell. 2015;162(6):1229–1241. doi:10.1016/j.cell.2015.08.016
9. Rebelatto MC, Midha A, Mistry A, et al. Development of a programmed cell death ligand-1 immunohistochemical assay validated for analysis of non-small cell lung cancer and head and neck squamous cell carcinoma. Diagn Pathol. 2016;11(1):95. doi:10.1186/s13000-016-0545-8
10. Meng X, Huang Z, Teng F, Xing L, Yu J. Predictive biomarkers in PD-1/PD-L1 checkpoint blockade immunotherapy. Cancer Treat Rev. 2015;41(10):868–876. doi:10.1016/j.ctrv.2015.11.001
11. Brody R, Zhang Y, Ballas M, et al. PD-L1 expression in advanced NSCLC: insights into risk stratification and treatment selection from a systematic literature review. Lung Cancer. 2017;112:200–215. doi:10.1016/j.lungcan.2017.08.005
12. McLaughlin J, Han G, Schalper KA, et al. Quantitative assessment of the heterogeneity of PD-L1 expression in non–small-cell lung cancer. JAMA Oncol. 2016;2(1):46–54. doi:10.1001/jamaoncol.2015.3638
13. Manson G, Norwood J, Marabelle A, Kohrt H, Houot R. Biomarkers associated with checkpoint inhibitors. Ann Oncol. 2016;27(7):1199–1206. doi:10.1093/annonc/mdw181
14. Takada K, Toyokawa G, Okamoto T, et al. Metabolic characteristics of programmed cell death-ligand 1-expressing lung cancer on 18F-fluorodeoxyglucose positron emission tomography/computed tomography. Cancer Med. 2017;6(11):2552–2561. doi:10.1002/cam4.1215
15. Kaira K, Shimizu K, Kitahara S, et al. 2-Deoxy-2-[fluorine-18] fluoro-d-glucose uptake on positron emission tomography is associated with programmed death ligand-1 expression in patients with pulmonary adenocarcinoma. Eur J Cancer. 2018;101:181–190. doi:10.1016/j.ejca.2018.06.022
16. Mino-Kenudson M. Programmed cell death ligand-1 (PD-L1) expression by immunohistochemistry: could it be predictive and/or prognostic in non-small cell lung cancer? Cancer Biol Med. 2016;13(2):157–170. doi:10.20892/j.issn.2095-3941.2016.0009
17. Thunnissen E, de Langen AJ, Smit EF. PD-L1 IHC in NSCLC with a global and methodological perspective. Lung Cancer. 2017;113:102–105. doi:10.1016/j.lungcan.2017.09.010
18. Ma G, Deng Y, Jiang H, Li W, Wu Q, Zhou Q. The prognostic role of programmed cell death-ligand 1 expression in non-small cell lung cancer patients: an updated meta-analysis. Clin Chim Acta. 2018;482:101–107. doi:10.1016/j.cca.2018.03.038
19. Aguiar PN, De Mello RA, Hall P, Tadokoro H, Lima Lopes G. PD-L1 expression as a predictive biomarker in advanced non-small-cell lung cancer: updated survival data. Immunotherapy. 2017;9(6):499–506. doi:10.2217/imt-2016-0150
20. Bylicki O, Barazzutti H, Paleiron N, Margery J, Assié J-B, Chouaïd C. First-line treatment of non-small-cell lung cancer (NSCLC) with immune checkpoint inhibitors. BioDrugs. 2019;33(2):159–171. doi:10.1007/s40259-019-00339-4
21. Kareva I, Hahnfeldt P. The emerging “hallmarks” of metabolic reprogramming and immune eEvasion: distinct or linked? Cancer Res. 2013;73(9):2737. doi:10.1158/0008-5472.CAN-12-3696
22. Wu AA, Drake V, Huang H-S, Chiu S, Zheng L. Reprogramming the tumor microenvironment: tumor-induced immunosuppressive factors paralyze T cells. Oncoimmunology. 2015;4(7):e1016700–e1016700. doi:10.1080/2162402X.2015.1016700
23. Sukumar M, Roychoudhuri R, Restifo NP. Nutrient competition: a new axis of tumor immunosuppression. Cell. 2015;162(6):1206–1208. doi:10.1016/j.cell.2015.08.064
24. Shukuya T, Carbone DP. Predictive markers for the efficacy of anti–PD-1/PD-L1 antibodies in lung cancer. J Thorac Oncol. 2016;11(7):976–988. doi:10.1016/j.jtho.2016.02.015
25. McDermott DF, Huseni MA, Atkins MB, et al. Clinical activity and molecular correlates of response to atezolizumab alone or in combination with bevacizumab versus sunitinib in renal cell carcinoma. Nat Med. 2018;24(6):749–757. doi:10.1038/s41591-018-0053-3
26. Gainor JF, Shaw AT, Sequist LV, et al. EGFR mutations and ALK rearrangements are associated with low response rates to PD-1 pathway blockade in non-small cell lung cancer: a retrospective analysis. Clin Cancer Res. 2016;22(18):4585–4593. doi:10.1158/1078-0432.CCR-15-3101
27. Deng Y, Yang J, Luo F, et al. mTOR-mediated glycolysis contributes to the enhanced suppressive function of murine tumor-infiltrating monocytic myeloid-derived suppressor cells. Cancer Immunol Immunother. 2018;67(9):1355–1364. doi:10.1007/s00262-018-2177-1
28. Jeong H, Kim S, Hong B-J, et al. Tumor-associated macrophages enhance tumor hypoxia and aerobic glycolysis. Cancer Res. 2019;79(4):795.
29. Takada K, Toyokawa G, Okamoto T, et al. An immunohistochemical analysis of PD-L1 protein expression in surgically resected small cell lung cancer using different antibodies and criteria. Anticancer Res. 2016;36(7):3409–3412.
 © 2020 The Author(s). This work is published and licensed by Dove Medical Press Limited. The full terms of this license are available at https://www.dovepress.com/terms.php and incorporate the Creative Commons Attribution - Non Commercial (unported, v3.0) License.
By accessing the work you hereby accept the Terms. Non-commercial uses of the work are permitted without any further permission from Dove Medical Press Limited, provided the work is properly attributed. For permission for commercial use of this work, please see paragraphs 4.2 and 5 of our Terms.
© 2020 The Author(s). This work is published and licensed by Dove Medical Press Limited. The full terms of this license are available at https://www.dovepress.com/terms.php and incorporate the Creative Commons Attribution - Non Commercial (unported, v3.0) License.
By accessing the work you hereby accept the Terms. Non-commercial uses of the work are permitted without any further permission from Dove Medical Press Limited, provided the work is properly attributed. For permission for commercial use of this work, please see paragraphs 4.2 and 5 of our Terms.