")
Back to Journals » OncoTargets and Therapy » Volume 13
PCK1 Regulates Glycolysis and Tumor Progression in Clear Cell Renal Cell Carcinoma Through LDHA
Authors Shi L, An S , Liu Y, Liu J, Wang F
Received 10 December 2019
Accepted for publication 7 March 2020
Published 30 March 2020 Volume 2020:13 Pages 2613—2627
DOI https://doi.org/10.2147/OTT.S241717
Checked for plagiarism Yes
Review by Single anonymous peer review
Peer reviewer comments 2
Editor who approved publication: Prof. Dr. Nicola Silvestris
Liang Shi,1,2,* Shuxian An,2,* Ying Liu,3 Jianjun Liu,2 Feng Wang1
1Department of Nuclear Medicine, Nanjing First Hospital, Nanjing Medical University, Nanjing 210001, Jiangsu, People’s Republic of China; 2Department of Nuclear Medicine, Ren Ji Hospital, School of Medicine, Shanghai Jiao Tong University, Shanghai 200127, People’s Republic of China; 3Department of Nuclear Medicine, Shanghai Tenth People’s Hospital, Tongji University School of Medicine Shanghai, Shanghai 200072, People’s Republic of China
*These authors contributed equally to this work
Correspondence: Feng Wang
Department of Nuclear Medicine, Nanjing First Hospital, Nanjing Medical University, 68 Changle Road, Nanjing 210006, Jiangsu, People’s Republic of China
Tel +86-25-52271491
Email [email protected]
Jianjun Liu
Department of Nuclear Medicine, Ren Ji Hospital, School of Medicine, Shanghai Jiao Tong University, 1630 Dongfang Road, Shanghai 200127, People’s Republic of China
Tel +86-21-68383963
Email [email protected]
Background: Suppressed gluconeogenesis and increased glycolysis are common in clear cell renal cell carcinoma (ccRCC). Phosphoenolpyruvate carboxykinase 1 (PCK1) is a rate-limiting gluconeogenesis enzyme. However, the role of PCK1 in tumor metabolism and progression remains unclear.
Methods: Artificial modulation of PCK1 (down- and upregulation) in two ccRCC cell lines was performed to explore the role of PCK1 in the glycolytic phenotype and in tumor growth and metastasis in vitro and in vivo. Sixty-two patients with ccRCC underwent 18F-fluorodeoxyglucose (18F-FDG) positron emission tomography. The levels of PCK1 and lactate dehydrogenase A (LDHA) in ccRCC tissues and peritumor tissues were investigated with immunohistochemistry. The relationships between 18F-FDG accumulation and the expression of PCK1 and LDHA were analyzed. The mechanisms underlying the regulation of LDHA by PCK1 were analyzed using in vitro molecular techniques.
Results: PCK1 suppressed ccRCC cell growth and metastasis in vitro and inhibited tumorigenesis in nude mice by blocking the aerobic glycolysis pathway. Clinically, low levels of PCK1 expression were associated with poor prognosis in patients with ccRCC. The expression level of PCK1 was negatively correlated with tumor progression, the LDHA expression level and 18F-FDG accumulation in primary ccRCC tissue. We also demonstrated that PCK1 reduces the stability of LDHA through posttranslational regulation. Finally, we showed that the effects of PCK1 on glucose metabolism, cell proliferation and metastasis are mediated via the inhibition of LDHA.
Conclusion: Our study identified a novel molecular mechanism underlying the Warburg effect. PCK1 may serve as a candidate prognostic biomarker, and targeting the PCK1/LDHA pathway might be a new strategy to selectively inhibit tumor metabolism in human ccRCC.
Keywords: clear cell renal cell carcinoma, PCK1, glycolysis, LDHA
Introduction
Clear cell renal cell carcinoma (ccRCC) is the primary histological subtype of renal cell carcinoma, and its incidence rate increases annually.1 ccRCC is characterized by a lack of early symptoms and diverse clinical manifestations, and 25–30% of the patients with this cancer are found with metastases to other organs at the time of diagnosis.2 Unfortunately, the overall 5-year survival rate of patients with metastatic RCC is 5–10%.2 Recent studies have drawn significant attention to the metabolic changes in malignant tumor cells, including ccRCC cells. A number of reports have shown that dysregulated glucose metabolism associated with increased glycolysis is associated with ccRCC. Cancer cells preferentially rely on aerobic glycolysis to generate energy, even in an oxygen-rich environment; this behavior is termed the Warburg effect.3 Metabolic reprogramming of primary tumor cells has a significant impact on tumorigenesis and the development of cancer metastasis.4 However, the molecular mechanisms underlying glucose metabolism during tumor progression and metastasis in ccRCC remain unclear.
Phosphoenolpyruvate carboxykinase (PCK) is the first rate-limiting enzyme of gluconeogenesis in the liver and kidney.5 PCK catalyzes the GTP-dependent decarboxylation of oxaloacetate (OAA) to form phosphoenolpyruvate (PEP). In mammals, two isoforms of PCK proteins have been identified.6 The cytoplasmic (PCK1) isozyme is produced from the PCK1 gene, whereas the PCK2 gene encodes the mitochondrial (PCK2) isozyme.7 PCK1 is the isozyme predominantly responsible for gluconeogenesis in the cytoplasm. PCK1 deficiency is an inherited metabolic disorder of impaired gluconeogenesis.8 Transgenic mice overexpressing PCK1 have been shown to be hyperglycemic and exhibit high serum insulin concentrations.9 In addition to its primary function in gluconeogenesis, the conversion of OAA to PEP catalyzed by PCK1 maintains metabolic flux through the tricarboxylic acid (TCA) cycle by removing excess oxaloacetate (cataplerosis) and replenishing required TCA intermediates (anaplerosis).10 Because of its role in endogenous glucose production, PCK1 may be involved in the metabolic reprogramming of cancer cells. In fact, PCK1 is strongly expressed in colon cancer and promotes glucose and glutamine utilization, which supports the anabolic pathway and cell proliferation.11 In contrast to the oncogenic function of PCK1 during the development of tumors in colon cancer, the expression of PCK1 is downregulated in hepatocellular carcinoma (HCC).12 Furthermore, low levels of PCK1 expression are associated with poor prognosis in patients with HCC.13 PCK1 suppresses glycolysis and induces the gluconeogenesis pathways in HCC cell lines, which decreases cancer cell viability, induces apoptosis, and inhibits migration.14 PCK1 has been considered a potential target for cancer treatment.12,15,16 Although a few studies have analyzed a small number of ccRCC samples to determine the expression level of PCK1,17,18 the role of PCK1 in ccRCC is essentially unknown.
Lactate dehydrogenase A (LDHA) catalyzes the conversion of pyruvate, the reduced form of nicotinamide adenine dinucleotide (NADH) and H+ to lactate and the oxidized form of nicotinamide adenine dinucleotide (NAD+).19 LDHA plays an important role in controlling cancer cell glycolysis due to its relatively high level of enzymatic activity.20 The dysregulation of LDHA is found in many types of cancer, including gastric cancer, ccRCC, colorectal cancer, non-small-cell lung cancer, and breast cancer.21–25 The expression of LDHA is positively correlated with tumor size, histological grade and tumor-node-metastasis (TNM) stage.26,27 Genetic and pharmacological inhibition of LDHA has been shown to cause cancer cell death and significantly suppress tumor metastasis.28,29 The expression of LDHA is stimulated by many factors. MYC, hypoxia-inducible factor 1 alpha (HIF1α), forkhead box protein M1 (FOXM1), and Krüppel-like factor 4 (KLF4) can regulate the expression levels of cellular LDHA.30–33 In addition, SIRT2 regulates the stability of LDHA through a chaperone-mediated autophagy (CMA)-dependent degradation pathway by deacetylating LDHA at lysine 5.34
In this study, we show that PCK1 suppresses aerobic glycolysis in ccRCC cells, resulting in the inhibition of cancer cell proliferation and metastasis in vivo and in vitro. The expression level of PCK1 in tumors is negatively correlated with tumor progression, LDHA expression and 18F-fluorodeoxyglucose (18F-FDG) accumulation in patients with ccRCC. Mechanistically, PCK1 interacts directly with LDHA and affects the CMA-mediated degradation of the LDHA protein. By directly targeting LDHA, the overexpression of PCK1 inhibits ccRCC cell glycolysis, growth, and progression. Our data indicate that PCK1 is detrimental to ccRCC cells and suggest that activating PCK1 expression is a potential treatment strategy for patients with ccRCC.
Materials and Methods
Cell Culture, Reagents and Antibody
The 769-P and Caki-1 cell lines (Chinese Academy of Science, China) were maintained in RPMI-1640 (Gibco, USA) with 10% fetal bovine serum (FBS) (Gibco, USA). The following inhibitors were used: 2-deoxy-D-glucose (2-DG) (Sigma-Aldrich, USA) and leupeptin (Sigma-Aldrich, USA). The following antibodies were used: Flag (Sigma-Aldrich, USA), PCK1 (Proteintech, USA), β-Tubulin (Proteintech), lysosomal-associated membrane protein A (LAMP2A) (Abcam), LDHA (Proteintech), and horseradish peroxidase (HRP)-conjugated IgG (Cell Signaling Technology, USA).
Lentiviral Knockdown
The shRNA-mediated knockdown of PCK1, LDHA and LAMP2A in ccRCC cells was accomplished using the targeted sequences provided in Supplementary Table 1. Annealing and connection of the shRNAs were performed before their insertion into the viral skeleton plasmid pLV-U6-EGFP-Puro. Then, the plasmids were transformed into HEK293T cells using lentivirus packaging reagents (GenePharma, China) according to the manufacturer’s instructions. In addition, 769-P and Caki-1 cells were infected with the lentiviruses and selected against puromycin.
Quantitative Real-Time PCR (qRT-PCR)
Total RNA was isolated from the cultured cells with RNAeasy columns (Qiagen, Germany). Reverse transcription was performed using a cDNA synthesis kit (Takara, Japan). qRT-PCR analysis was performed with gene-specific primers using the SYBR Green PCR Master Mix (Takara, Japan). The StepOnePlus Real-Time PCR System (Applied Biosystems, USA) was used to perform the quantitative PCR. The primers for assessing LDHA were as follows: 5ʹ-ATCTTGACCTACGTGGCTTGGA-3ʹ (sense) and 5ʹ-CCATACAGGCACACTGGAATCTC −3ʹ (antisense). The primers for assessing PCK1 were as follows: 5ʹ-GCTGGTGTCCCTCTAGTCTATG −3ʹ (sense) and 5ʹ-GGTATTTGCCGAAGTTGTAG-3ʹ (antisense).
Immunoprecipitation (IP)
To analyze endogenous protein–protein interactions, whole lysates were incubated with antibodies against PCK1 or LDHA and 15 μL of protein A/G agarose (Pierce, USA) overnight at 4°C. Then, the resulting samples were washed with IP buffer three times and analyzed by Western blotting.
Immunoblotting
Cells were lysed with mammalian cell lysis buffer consisting of 50 mM Tris-HCL, 150 mM NaCl, 1% NP-40, 5 mM EDTA, 1 mM phenylmethylsulfonyl fluoride, and a protease inhibitor cocktail. The lysed products were collected by centrifugation and then resolved by SDS-PAGE. The separated proteins were transferred to polyvinylidene difluoride (PVDF) membranes. The membranes were probed with the indicated primary antibodies and then detected with secondary antibodies followed by exposure to ECL reagents (Pierce, USA).
Cell Growth, Colony Formation, Wound Healing and Invasion Assays
In total, 2×10⁴ cells were seeded in 6-well plates, and live cells were counted every 24 h using a hemocytometer after trypan blue exclusion. Cell viability was assessed using a CCK-8 Kit (Dojindo, Japan) according to the manufacturer’s instructions. For the soft agar colony formation assay, 100 cells were plated onto a 24-well plate. The cells were suspended in culture medium containing 0.4% agarose (Sigma, USA) and placed on top of solidified 0.6% agarose in RPMI-1640 medium. For the plate colony formation assay, 100 cells per well were seeded onto a 6-well plate. The medium was changed regularly. After culturing for 14 days, the plate and soft agar colonies were stained with crystal violet and counted. Cell migration was examined by wound healing assays. A monolayer of cells was wounded with a sterile plastic tip and then cultured in RPMI-1640 medium with 1% FBS. Cell migration was observed by microscopy 24 h later. Cell invasion assays were performed with Matrigel Invasion Chambers (BD Biosciences, USA). In total, 1×10⁵ cells were suspended in 200 µL of RPMI-1640 medium with 1% FBS and then placed in the upper Transwell chamber with a Matrigel-coated membrane. After 24 h, the invading cells were fixed with 4% paraformaldehyde and stained with 0.1% crystal violet. The number of invading cells was counted in at least five random fields using a microscope and photographed.
In vitro Glucose Uptake, Lactate Production, LDH Activity, and NAD+/NADH Ratio Assays
Cells were collected and washed twice with cold phosphate-buffered saline (PBS). Then, the collected cells were incubated in 1 mL of RPMI-1640 medium containing 18F-FDG (148 kBq [4 μCi/mL]) for 1 h at 37°C. The cells were washed twice with cold PBS. One milliliter of 0.1 M NaOH was used to produce lysates. The radioactivity of the lysates was detected by a well γ-counter. The data were normalized to cell number. For the lactate production measurements, the cells were washed with PBS and cultured in serum-free RPMI-1640 medium for 12 h. The cells or tissues were lysed and centrifuged at 4°C for 30 min. Then, the clear supernatants were collected to measure the lactate levels according to the instructions of the Lactate Assay Kit (CMA, Sweden). The data were normalized to the total protein level. LDH activity was determined using an LDH Activity Assay Kit according to the manufacturer’s instructions (Njjcbio, China). The data were normalized to cell number. The NAD+/NADH ratio was quantified in cell lysates using the NAD+/NADH Quantitation Kit according to the manufacturer’s instructions (Njjcbio, China).
XF24 Extracellular Flux Analysis
We used an XF24 extracellular flux analyzer to evaluate the extracellular acidification rate (ECAR) and oxygen consumption rate (OCR). In total, 2×10⁴ cells were plated in XF24 cell culture plates (Seahorse Bioscience, USA) and incubated at 37°C overnight. Then, the cells were incubated in bicarbonate-free RPMI-1640 medium in a 37°C non-CO2 incubator for 1 h, and the XF assay was performed at the designated time points. The values are presented as the means ± standard error of the mean.
6-14C-Glucose CO2 Release Assay
Cells were incubated in glucose-free RPMI-1640 medium containing 1 μCi/mL of 6-14C-glucose for 1 h at 37°C. Then, 150 μL of 3M perchloric acid was added, and the released radiolabeled CO2 was absorbed by phenylethylamine. The released CO2 captured on the filter paper was measured with a scintillation counter.
Tumor Samples and Immunohistochemistry
ccRCC samples were obtained from surgical patients who provided signed informed consent at Ren Ji Hospital, Shanghai, China. The experiment was approved by the Ethics Committee of Ren Ji Hospital. The inclusion criteria were as follows: the patients underwent 18F-FDG positron emission tomography (PET) and computed tomography (CT) (hereafter, PET/CT) before tumor resection; the newly diagnosed ccRCC was confirmed by pathologic examination of surgical specimens; complete records, including age, sex, tumor size, tumor stage, and histological grade were available; and tissue specimens were available for immunohistochemical (IHC) staining. Only 62 of the 70 patients with ccRCC were eligible for this study (Supplementary Figure 1). The follow-up period ranged from 3 to 78 months, with a median of 35 months.
For the IHC analyses, tumor tissue samples were dewaxed, hydrated and washed. Antigens were retrieved with 10 mM sodium citrate buffer; then, the slides were treated with 2% H2O2 in methanol to block endogenous peroxide, after which the primary antibody was added and incubated at room temperature for 2 h. HRP-conjugated secondary antibody and 3,30-diaminobenzidine solution (Dako, Japan) were used, and counterstaining was performed with hematoxylin. IHC analysis was conducted independently by two board-certified pathologists. They reached a consensus when discrepancies occurred. The signal intensity was divided into the following categories: 0=negative, 1=weak, 2=moderate and 3=strong. The staining frequency was categorized as follows: 0=no staining, 1<25%, 2=25–50%, and 3>50%. The final scores for PCK1 or LDHA in those ccRCC tissues were on a scale from 0 to 9, in which a score ≤3 was defined as representing a low expression level and a score >3 represented a high expression level.
Xenograft Tumor Studies
All animal experiments were reviewed and approved by the Animal Ethics Committee of Nanjing First Hospital. This study was carried out in accordance with the Guidelines for the Care and Use of Laboratory Animals (Ministry of Science and Technology of China, 2006). Caki-1 cells (1×10⁷) stably expressing shcon or shPCK1 with or without PCK1 re-expression were subcutaneously inoculated into 4-week-old male BALB/c severe combined immunodeficiency mice (Shanghai Laboratory Animal Center, China). Mice were subjected to 18F-FDG PET scans and sacrificed 28 days after injection. All the subcutaneous tumors were removed and weighed. The tumor tissues were collected for weight measurements and IHC analysis.
18F-FDG microPET Imaging
Mice were fasted for 6 h and then administered 18F-FDG (250 μCi for each mouse) by tail vein injection. Forty-five minutes later, the animals were placed on a warm pad, and a 10-min emission scan was acquired using a MicroPET (Inveon, Siemens) with 2.5% isoflurane anesthesia. The regions of interest were drawn around the tumors on scan slices, and the maximal standard uptake values (SUVmax) were calculated to assess the 18F-FDG ability of tumors.
Statistical Analysis
All data were statistically analyzed using GraphPad Prism 5 (GraphPad Software, San Diego, CA, USA) or SPSS 18.0 software (SPSS, Chicago, Ill, USA). Statistical significance for the association between the binary representation of PCK1 or LDHA expression with the paired tumor versus peritumor specimens, age, sex, tumor size, histological grade, status of lymph node metastasis and tumor stage was assessed using the χ2 test or Fisher’s exact test, when appropriate. Spearman’s rank correlation was used to determine the relationship between PCK1 and LDHA protein expression levels. Overall survival curves were calculated using the Kaplan–Meier method with the Log rank test. The data were normalized to the control and were presented as the means±SEM. For the in vitro and in vivo studies, unpaired two-tailed t-tests were used to analyze the differences between the two groups. P<0.05 was considered statistically significant.
Results
PCK1 Inhibits ccRCC Cell Proliferation
To investigate the functional significance of PCK1 in ccRCC progression, we stably knocked down PCK1 in two ccRCC cell lines, 769-P and Caki-1 (Figure 1A). Compared with the shRNA-control, PCK1 knockdown by shPCK1 RNA significantly promoted the growth of ccRCC cells (Figure 1B). Moreover, we established stable cell lines expressing the vector control and PCK1 (Supplementary Figure 2A) and found that overexpression of PCK1 inhibited cell growth (Supplementary Figure 2B). Furthermore, plate and soft agar colony formation assays showed similar results (Figure 1C–E). Overexpression of PCK1 also resulted in decreased migration and invasion abilities in 769-P (Figure 1F and G) and Caki-1 cells (Supplementary Figure 2C and D). These results demonstrate that PCK1 inhibits the proliferation, migration and invasion of ccRCC cells.
|
Figure 1 PCK1 inhibits ccRCC cell growth, colony formation, migration and invasion in vitro. Notes: (A) 769-P and Caki-1 cells were infected with lentiviruses carrying shRNA against PCK1 (shPCK1) or negative control shRNA (shcon). PCK1 and β-tubulin levels were determined by Western blotting. (B) Cell viability was assessed by CCK-8 assays in 769-P and Caki-1 cells with stably knocked down PCK1 or the negative control. The bars represent the means±SEM (n=3). (C–E) Representative images of cell growth in soft agar colony forming assays (C, top and middle and D) and plate colony forming assays (C, bottom, and E). The bars represent the means±SEM (n=3). (F) Wound healing assay for 769-P cells stably expressing Flag-PCK1 or the control vector. The bars represent the means±SEM (n=3). (G) Transwell invasion assay for 769-P cells stably expressing Flag-PCK1 or the control vector. The bars represent the means±SEM (n=3). (*P<0.05, **P<0.01, Student’s t-test). |
PCK1 Regulates Glucose Metabolism
Because aerobic glycolysis plays an essential role in cancer development and progression and because PCK1 functions as a tumor suppressor, we determined whether aerobic glycolysis plays an important role in PCK1-mediated inhibition of ccRCC cell proliferation. The glycolytic inhibitor 2-deoxy-D-glucose (2-DG) completely blocked the growth promotion effect of shPCK1 in control cells (Figure 2A), suggesting that aerobic glycolysis might be involved in the regulation of cell proliferation by PCK1. To further explore the effects of PCK1 on the glycolytic phenotype in ccRCC, we performed 18F-FDG uptake assays in vitro. We observed that glucose uptake was apparently upregulated in the absence of PCK1 but significantly downregulated when PCK1 was overexpressed in 769-P and Caki-1 cells (Figure 2B). Lactate, a dead-end product in cellular glycolytic metabolism, is of great physiologic significance in tumor cells because it can drive cell proliferation and migration and might even function as a potential nutrient for tumors. We found that lactate production was increased by the stable knockdown of PCK1 in both ccRCC cell lines. In addition, these findings were further supported by the results of the overexpression experiments in cancer cells (Figure 2C). To further demonstrate the significance of PCK1 in glucose metabolism, extracellular flux analysis was performed. Compared with the control ccRCC cells, the shPCK1 cells demonstrated an increased ECAR and decreased OCR, and these findings were supported by the results of overexpressing PCK1 (Supplementary Figure 3 and Figure 2D–F). In addition, activation of oxidative phosphorylation by PCK1 was also demonstrated by analyzing the flux of [6-14C] glucose in cancer cells. 14CO2 from 6-14C-glucose can be released only by the TCA cycle, which indicates the flux of glucose metabolism in the mitochondrial pathway. The proportion of 6-14CO2 in the total CO2 released was reduced in 769-P and Caki-1 cells with stably silenced PCK1 but increased in the ccRCC cells overexpressing PCK1 (Figure 2G). Altogether, these results provide evidence that PCK1 shunts glucose from glycolysis to oxidative phosphorylation metabolism, which is the opposite of what occurs in the Warburg effect.
|
Figure 2 PCK1 regulates glycolysis in cultured ccRCC cells. Notes: (A) 769-P and Caki-1 cells with stably knocked down PCK1 or the negative control were or were not treated with 2-DG (2.5 mM). The numbers of cells were counted every 24 h. The bars represent the means±SEM (n=3). (B–G) PCK1 regulates glucose uptake (B), lactate production (C), extracellular acidification rate (ECAR) (D), oxygen consumption rate (OCR) (E, F), and 6-14CO2 production from 6-14C- glucose (G) in 769-P and Caki-1 cells. The bars represent the means±SEM (n=3). (*P<0.05, **P<0.01, Student’s t-test). |
Reduction of PCK1 Promotes Glucose Uptake and Tumor Growth in vivo
To investigate whether PCK1 affects the ccRCC glucose metabolic phenotype in vivo, we performed xenograft studies. We infected Caki-1 shcon/shPCK1 cells with Flag-vector or Flag-PCK1 to generate stable cell lines (Figure 3A). Compared with tumors derived from the control cells, tumors derived from subcutaneously implanted Caki-1 shPCK1 cells in nude mice had increased glucose uptake as shown by 18F-FDG microPET imaging (Figure 3B). However, PCK1 re-expression mitigated this upregulation (Figure 3B). Because increased glucose metabolism in vivo is often related to tumor cell proliferation, we further tested the effect of PCK1 on xenograft tumor growth. As expected, compared with the tumors in the shRNA-control group, tumors in mice injected with cells with stably silenced PCK1 were larger and heavier. However, when PCK1 was re-expressed in shPCK1 Caki-1 cells, the growth advantage was eliminated (Figure 3C–E). Lactate production analysis of the tumor masses further confirmed that PCK1 knockdown increased lactate production (Figure 3F). This effect was reversed by PCK1 re-expression in Caki-1 shPCK1 cells (Figure 3F). Furthermore, Ki-67 staining showed that the tumors derived from the shPCK1 cells were more proliferative than those derived from control cells, whereas re-expressing PCK1 completely eliminated the growth advantage (Figure 3G). Together, these results indicate that silencing PCK1 in ccRCC cell lines promotes glycolysis and tumor growth both in vivo and in vitro.
|
Figure 3 PCK1 inhibits glycolysis and xenograft tumor growth in vivo. Notes: (A) Exogenous PCK1 (Flag-PCK1) was stably re-expressed in shPCK1 Caki-1 cells, and the protein levels were confirmed by Western blotting. Flag-vector was used as a control. (B) Nude mice were injected with 1×10⁷ Caki-1 cells stably expressing shcon+ Flag-Vector, shPCK1+Flag-Vector, and shPCK1+Flag-PCK1 (n=5/group). Representative images of the in vivo glucose uptake assay by 18F-FDG microPET scan (top). Maximal standard uptake values (SUVmax) fold-changes for xenografts examined by FDG PET are presented in the graph (bottom). (C–E) At the end of the experiment, the mice were sacrificed. Representative image of mice with xenograft tumors (C), image of tumors isolated from nude mice (D), and the weights of the tumors (E). The bars represent the means±SEM (n=5). (F) Lactate production in tumor lysates derived from xenografts was measured. The bars represent the means±SEM (n=5). (G) Hematoxylin and eosin (H&E) staining and Ki67 staining of tumor samples (scale bar, 20 mm). (*P<0.05, **P<0.01, Student’s t-test). |
Correlation Between PCK1 and Tumor Prognosis, LDHA and Glucose Uptake in Patients with ccRCC
IHC analyses were performed on 62 paraffin-embedded ccRCC tissues and matched peritumoral tissues. The PCK1 protein levels in malignant cells were significantly lower than those in benign cells (Figure 4A and B). High PCK1 expression was observed in 70.0% of peritumoral tissues. However, only 20 (32.3%) of the tumor tissues exhibited high PCK1 expression (Supplementary Figure 4A). Univariate statistical analysis found that PCK1 levels were negatively associated with tumor size (P=0.039), lymph node metastasis (P=0.034), and TNM stage (P=0.027, Table 1). Kaplan–Meier analysis showed that patients with relatively low PCK1 expression levels achieved a lower overall survival rate than patients with high PCK1 expression levels (P=0.003, Figure 4C).
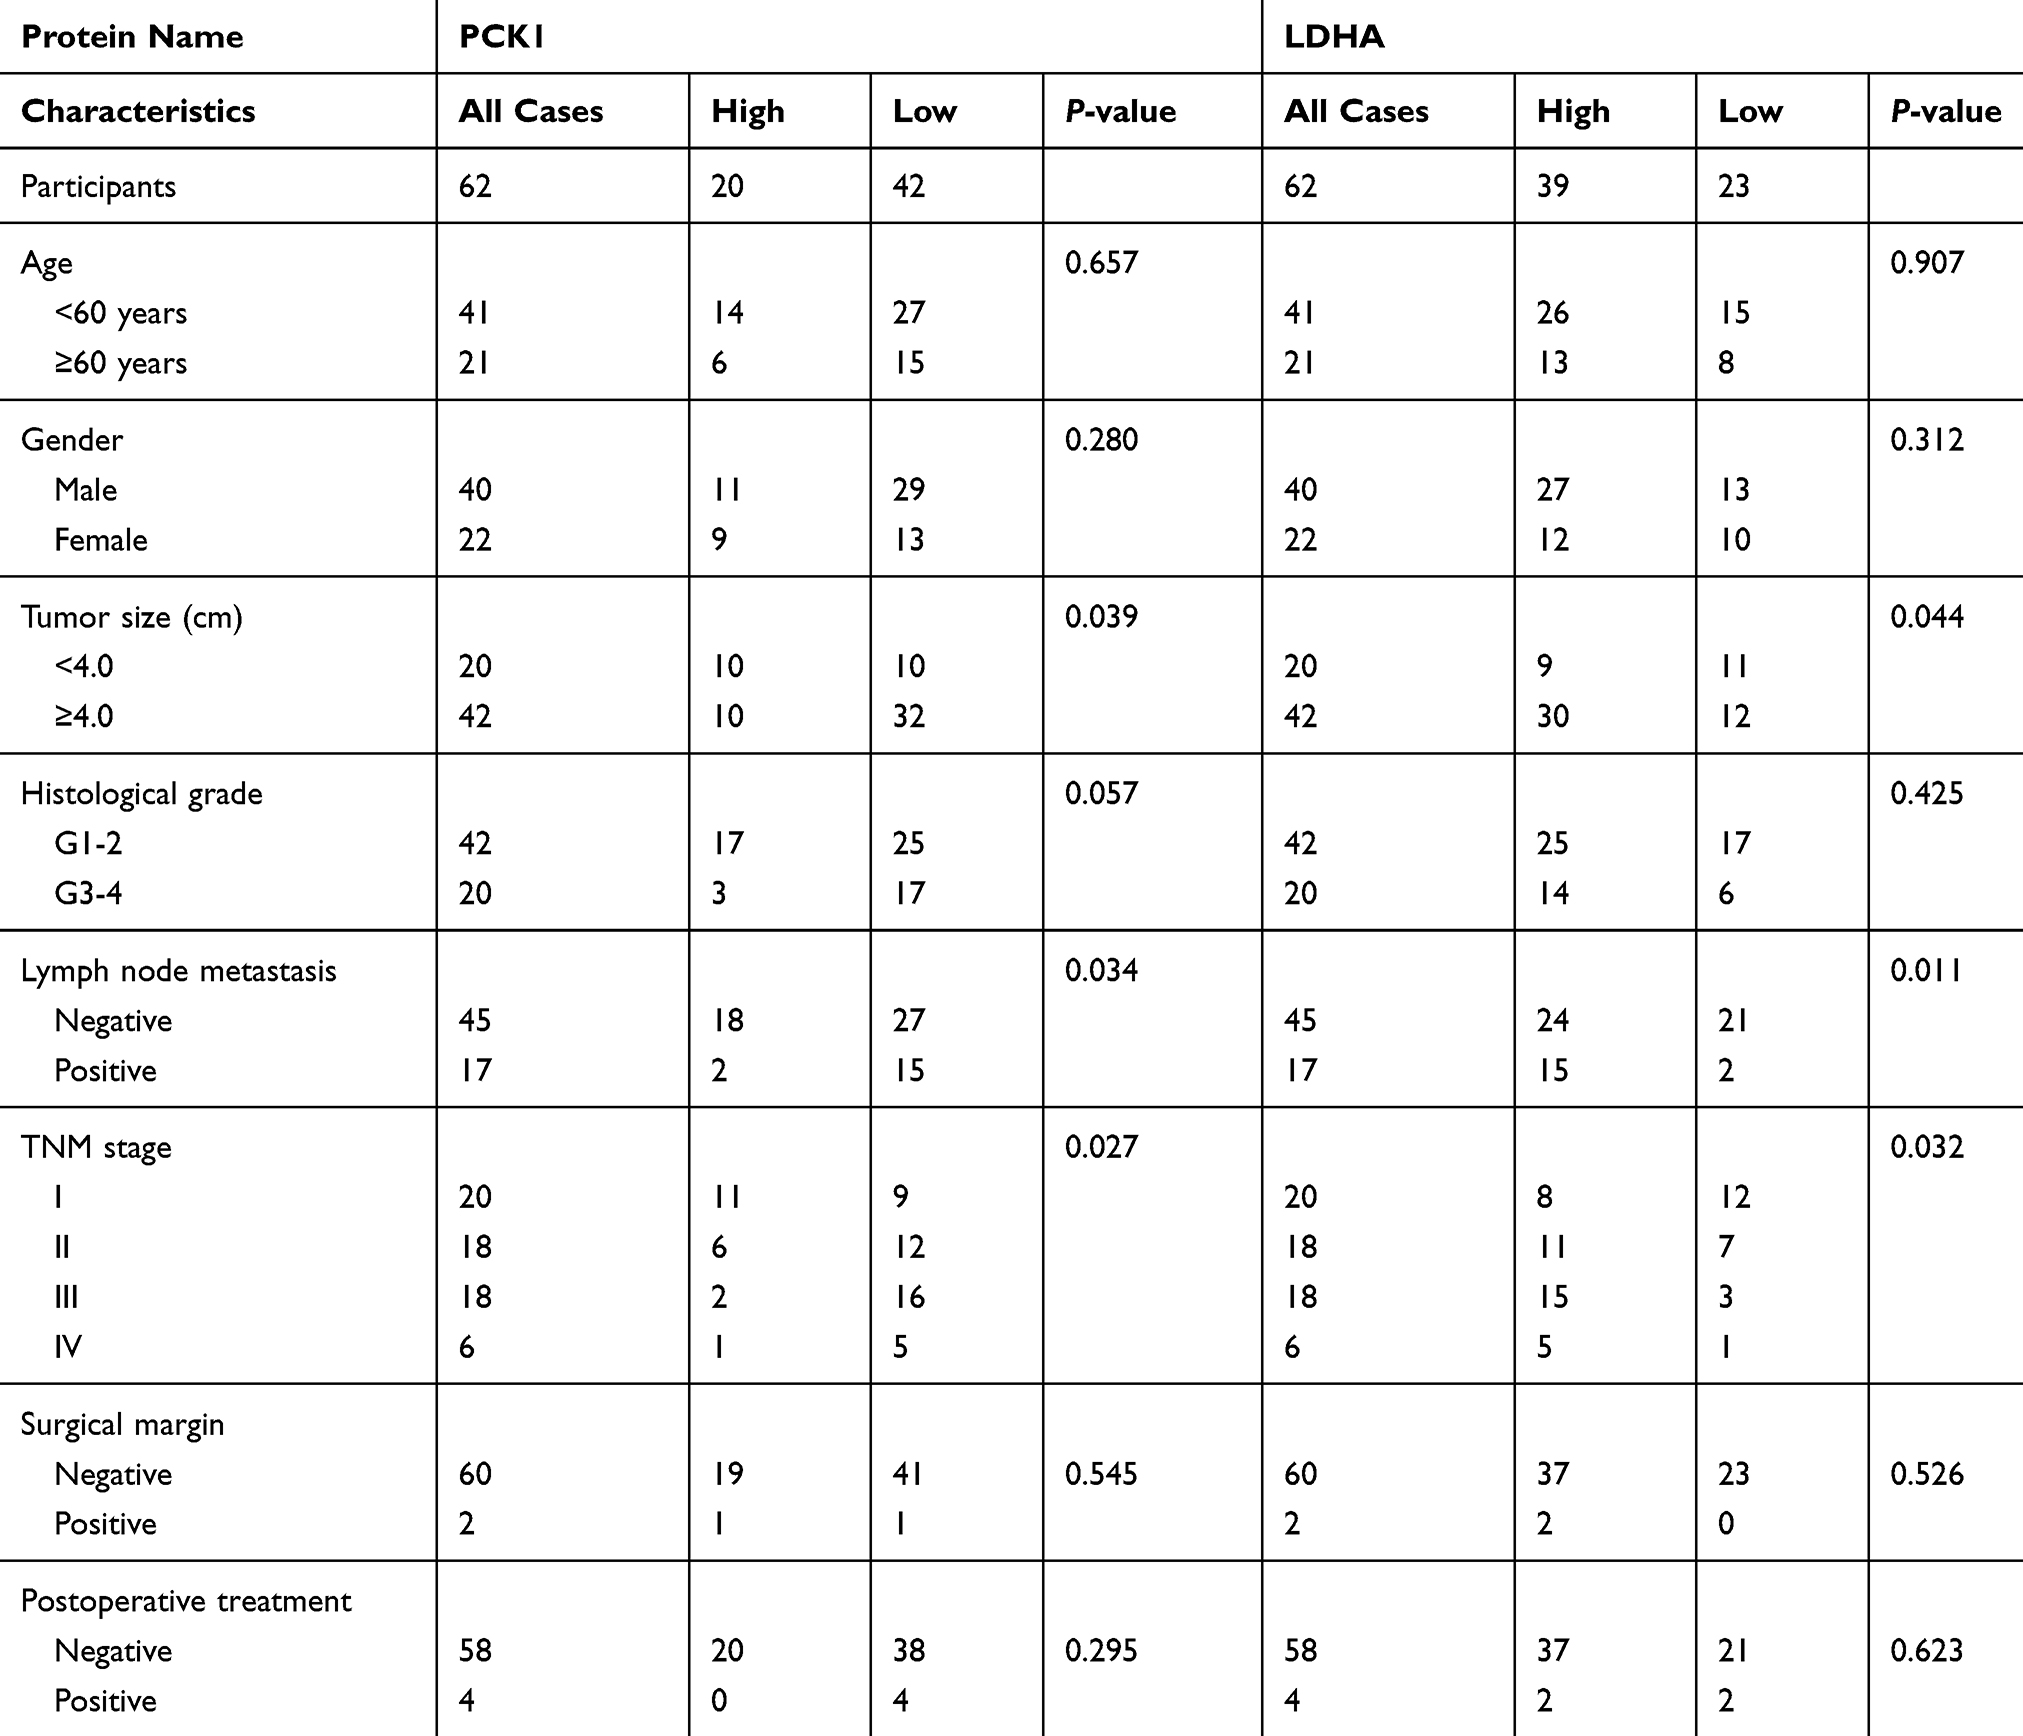 |
Table 1 Correlation Between PCK1 and LDHA Protein Levels and Clinicopathological Parameters of Patients with ccRCC |
|
Figure 4 The relationship between PCK1 and tumor prognosis, LDHA and glucose uptake in patients with ccRCC. Notes: (A) Representative images of PCK1 and LDHA expression in sixty-two paired normal peritumor and pancreatic tumor specimens. Patient 1: A 45-year-old man had left ccRCC with high PCK1 expression. 18F-FDG PET/CT scans showed low accumulation of 18F-FDG in tumors (SUVmax, 1.4; histological grade, G1). Patient 2: A 59-year-old man had left ccRCC with low PCK1 expression. 18F-FDG PET/CT scans showed intense accumulation of 18F-FDG in tumors (SUVmax, 14.8; histological grade, G4). (B) The mean PCK1 immunohistochemical staining scores in ccRCC tissues and normal peritumoral tissues. (C) Kaplan–Meier survival analysis of patients with ccRCC separated into two groups by PCK1 expression level. P values were calculated by a log-rank (Mantel–Cox) test. (D) The mean LDHA immunohistochemical staining scores in ccRCC tissues and normal peritumor tissues. (E) Kaplan–Meier survival analysis of patients with ccRCC separated into two groups by LDHA expression level. P values were calculated by a log-rank (Mantel–Cox) test. (F) Correlation between 18F-FDG accumulation and PCK1 expression. (G) Correlation between 18F-FDG accumulation and LDHA expression. |
Human ccRCC tissues displayed high LDHA expression levels compared with the adjacent normal tissues (Figure 4A and D). Thirty-nine (63%) tumor tissues exhibited high LDHA expression (Supplementary Figure 4B). The tumor size, presence of lymph node metastasis, and TNM stage were positively correlated with tumor LDHA expression (P=0.044, P=0.011, and P=0.032; Table 1). Compared with patients with low levels of LDHA, patients with high levels of LDHA had a worse prognosis (P=0.014, Figure 4E).
Furthermore, we detected a negative correlation between the staining scores of PCK1 and LDHA in ccRCC tissues (Pearson r= −0.467, P<0.001, Supplementary Table 2). More importantly, compared with patients without increased glucose uptake, patients with primary ccRCC tumors with increased glucose uptake as assessed by 18F-FDG PET/CT scans showed decreased PCK1 expression and increased LDHA expression (Figure 4A, F, and G). This finding suggests that the association of PCK1 with LDHA mainly affects glycolysis in ccRCC.
PCK1 Regulates LDHA Stability
As has been previously shown, ccRCC cancer tissues with low levels of expression of PCK1 have increased levels of LDHA expression. PCK1 knockdown stably increased LDHA protein levels (Figure 5A). Although the abundance of LDHA proteins can be regulated by multiple mechanisms, including transcriptional and posttranslational modifications, the effect of PCK1 overexpression on LDHA levels likely occurred through a posttranscriptional mechanism because there was no increase in LDHA mRNA level after PCK1 knockdown (Figure 5B). Furthermore, the LDHA protein level is significantly decreased in cells stably transfected with EGFP‐3Flag‐PCK1 or transiently transfected with Flag-PCK1. However, PCK1 had no effect on the mRNA levels of LDHA (Figure 5C and D, and Supplementary Figure 5A and B). The PCK1-LDHA interaction was confirmed by endogenous IP in Caki-1 cells (Figure 5E and F). Then, we analyzed whether the accumulation of LDHA proteins was due to changes in protein stability. LDHA has been shown to be degraded by the CMA pathway. We treated cells with leupeptin, a lysosomal protease inhibitor that can block lysosome-dependent protein degradation,35 and found that leupeptin caused a significant accumulation of LDH-A proteins, confirming the involvement of lysosomes in LDHA degradation in Caki-1 cells (Figure 5G). During CMA, LAMP2A translocates the target proteins into lysosomes for degradation.36 We found that silencing LAMP2A significantly increased the LDHA protein level (Figure 5H). Moreover, silencing LAMP2A also blocked the reduction in the LDHA protein level caused by PCK1 overexpression (Figure 5H). These data support a model in which PCK1 promotes CMA-dependent degradation of LDHA.
|
Figure 5 PCK1 regulates LDHA protein stability. Notes: (A) Cell lysates were prepared from 769-P and Caki-1 cells stably expressing shPCK1 or the negative control and analyzed by immunoblotting using the indicated antibodies. (B) qPCR analysis of the LDHA gene in 769-P and Caki-1 cells stably expressing shPCK1 or the negative control. The bars represent the means±SEM (n=3). (C) Cell lysates were prepared from 769-P and Caki-1 cells stably expressing Flag-PCK1 or the empty vector and analyzed by immunoblotting using the indicated antibodies. (D) qPCR analysis for LDHA genes in 769-P and Caki-1 cells transiently expressing Flag-PCK1 or the empty vector. The bars represent the means±SEM (n=3).(E, F) Lysates of Caki-1 cells were immunoprecipitated with the antibody against LDHA or PCK1. The presence of PCK1 or LDHA proteins in immunoprecipitates and whole-cell extracts were analyzed by immunoblotting using anti-PCK1 or anti-LDHA antibodies. (G) Caki-1 cells were either treated or not with leupeptin for 48 hr. LDHA protein was analyzed by Western blotting. β-Tubulin was used as a loading control for Western blotting. (H) LAMP2A was stably knocked down in Caki-1 cells stably overexpressing PCK1 or the empty vector control. LDHA and β-Tubulin levels were determined by Western blotting. (**P<0.01, Student’s t-test). |
PCK1 Suppresses the Warburg Effect and Tumor Progression via LDHA
Next, we investigated whether downregulation of PCK1 promotes glycolysis and tumorigenesis in an LDHA-dependent manner. We initially tested the effect of PCK1 on the regulation of LDH enzyme activity. As shown in Supplementary Figure 6A and B, PCK1 overexpression reduced the LDH enzyme activity in Caki-1 cells, and overexpression of LDHA rescued the LDH activity. LDHA activity is essential to maintaining a high glycolysis rate by regenerating NAD+, which is required in the early steps of glycolysis.37 Consistent with this scenario, the Caki-1 cells overexpressing PCK1 exhibited a lower NAD+/NADH ratio than the control cells (Supplementary Figure 6C). Conversely, the NAD+/NADH ratio was dramatically increased upon LDHA overexpression (Supplementary Figure 6C). Moreover, overexpression of LDHA completely rescued the PCK1-induced inhibition of glucose uptake and lactate production in Caki-1 cells (Supplementary Figure 6D and E). Overexpression of PCK1 decreased overall glycolytic flux and increased mitochondrial respiration (Supplementary Figure 6F and G). Again, overexpression of LDHA in the PCK1-overexpressing cells rescued these effects (Supplementary Figure 6F and G). We previously showed that PCK1 inhibits ccRCC cell proliferation, migration and invasion. As expected, all these effects were reversed by LDHA overexpression in the PCK1-overexpressing cells (Supplementary Figure 6H–K). Moreover, overexpression of PCK1 in LDHA knockdown Caki-1 cells had no effect on the glycolytic phenotype (Figure 6A–G). Furthermore, LDHA knockdown abolished the ability of PCK1 to regulate cancer cell proliferation, migration, and invasion (Figure 6H–K). These data collectively suggest that PCK1 is involved in glycolysis via LDHA and that the PCK1/LDHA axis may play a role in cancer cell proliferation and metastasis.
|
Figure 6 PCK1 suppresses the Warburg effect and tumor progression via LDHA. Notes: (A–G) Caki-1 cells with stable expression of PCK1 (or empty vector as a control) were infected with lentiviruses carrying shRNA against LDHA (shLDHA) or negative control shRNA (shcon). (A) Protein levels of LDHA were analyzed by Western blotting, and β-tubulin was used as a loading control. The bars represent the means±SEM (n=3). (B–G) Metabolic phenotypes related to the Warburg effect, including LDH activity, NAD+/NADH ratio, glucose uptake, lactate production, extracellular acidification rate (ECAR), and oxygen consumption rate (OCR), were determined. The bars represent the means±SEM (n=3). (H–K) Then, the cell proliferation assay (H), soft agar colony formation assay (I), wound healing assay (J) and invasion assay (K) were analyzed. The bars represent the means±SEM (n=3). (*P<0.05, **P<0.01, Student’s t-test). |
Discussion
Cancer cells use glucose-fueled anaerobic glycolysis to convert the majority of glucose to lactate, and relatively little pyruvate is dispatched to the oxygen-consuming mitochondria, irrespective of whether there is sufficient oxygen present.38 This so-called Warburg effect is the predominant type of metabolic reprogramming in tumors.39 Increased glycolysis facilitates the diversion of glycolytic intermediates into various biosynthetic pathways, including those generating amino acids and nucleosides; this promotes the biosynthesis of the macromolecules and organelles that are required for active cell proliferation.1 Targeting the glycolysis pathway has been proven to be an effective way to prevent or intervene in tumor growth and metastasis.40,41 Therefore, more attention is being paid to strategies that can attenuate oncogenic metabolic enzymes to block the glycolytic phenotype or initiate a shift from glycolysis to mitochondrial respiration. In addition, on the basis of this characteristic of glucose metabolism in cancer cells, 18F-FDG PET/CT has been routinely used in tumor analyses.42
Gluconeogenesis is a reverse glycolysis pathway. PCK1 catalyzes the first rate-limiting reaction of gluconeogenesis in the cytoplasm. PCK1 is dysregulated in many types of cancer and is involved in various biological processes, such as metabolism, apoptosis, oxidative stress, cell death and tumorigenesis.11,13,14 PCK1 is upregulated in colon cancer tissues as well as tumor-repopulating cells of hepatocarcinoma, melanoma and lymphoma. PCK1 promotes cancer cell growth and tumorigenesis in these types of cancer.11,43 Surprisingly, our results showed a significantly lower level of PCK1 expression in ccRCC tissues than in matching normal kidney tissues. This decreased expression level is in line with previously published transcriptomic data and proteomic profiling data obtained from small numbers of ccRCC patients.17,18 Significantly, our data showed that PCK1 downregulation is closely associated with poor prognosis in patients with ccRCC. These results are consistent with the results previously observed in HCC,13 suggesting that the function of PCK1 is partly tissue specific, resulting in different phenotypes in various types of tumors. In the liver and kidney, PCK1 performs its well-known function of controlling gluconeogenesis via small carbohydrate substrates. Glucose homeostasis is reciprocally controlled by the catabolic glycolysis and anabolic gluconeogenesis pathways in these two specific organs, which are responsible for endogenous glucose production.44 Numerous studies indicate that altered or impaired gluconeogenesis is associated with the development of neoplasms in livers or kidneys.45,46 Inhibition of mTOR2 or dexamethasone inhibited proliferation and survival in cancer cells by inducing PCK1 and glucose-6-phosphatase, which prevented the initiation of the shuttling of glycolytic products to gluconeogenesis.12,16 It seems that PCK1 might function as a tumor suppressor in certain types of tumors. Our results indicate that PCK1 inhibits ccRCC cell growth and metastasis in vitro and blocks tumorigenesis in vivo. Furthermore, we demonstrated that PCK1 attenuates the Warburg effect in ccRCC cells by preventing glucose from being shunted to glycolysis pathways.
To understand the molecular mechanism underlying the regulation of glycolysis by PCK1, we determined that human ccRCC samples that exhibited low PCK1 expression showed high LDHA levels as well as increased tumor 18F-FDG uptake. LDHA is one of the key glycolytic enzymes, catalyzing pyruvate to lactate, coupled with the oxidation of NADH to NAD+. LDHA plays an essential role in the uncontrolled proliferation of cancer cells by accelerating the rate of glycolysis. LDHA activity can maintain a high glycolysis rate under limiting levels of oxygen by regenerating NAD+ to the reaction in the early steps in glycolysis catalyzed by glyceraldehyde-phosphate dehydrogenase, a classic key glycolysis enzyme.47 This is thought to be the major contribution of the enzyme to tumorigenesis. A high level of LDHA activity also drives the production of lactate, which inhibits the innate immune response against developing tumors.48 Furthermore, LDHA enhances glucose uptake by increasing the expression of glucose transporter 1, a key glycolysis enzyme in transporting glucose into the tumor cell, via the phosphorylated AKT pathway.49 The expression of LDHA can be affected by many factors, such as Myc, HIF1α, FOXM 1, and KLF4.30–33 In this study, we found that PCK1 knockdown or overexpression did not change the mRNA levels of LDHA. Our study adds further evidence that PCK1 downregulates the abundance of LDHA proteins by directly interacting with LDHA. CMA is responsible for LDHA degradation.34 In this study, our data show that PCK1 initiates LDHA degradation via the CMA-dependent pathway. Importantly, we demonstrated that in ccRCC cells, PCK1 inhibits glucose uptake and lactate production and initiates a switch from glycolysis to mitochondrial oxygen respiration in an LDHA-dependent manner. PCK1 dampens ccRCC tumor growth and metastasis through downregulation of the LDHA-mediated Warburg effect. There is growing evidence that, in addition to the traditional metabolic network, metabolic enzymes affect cell phenotypes in a nonmetabolic way.50 The main mechanisms underlying nonmetabolic regulation involve the formation of protein complexes, altered subcellular localization, and noncanonical catalytic functions. It has been proposed that the gluconeogenic enzyme fructose 1,6-bisphosphatase 1 binds directly to HIF1α to inhibit the function of HIF1α.45 Our current study provides evidence that PCK1 may play a similar role in regulating ccRCC growth and progression with its function of dampening glycolysis by interacting with LDHA.
Conclusion
In conclusion, our study demonstrated that PCK1 controls ccRCC clinical tumor progression and inhibits cell proliferation and metastasis. Mechanistically, PCK1 regulates LDHA expression, and the LDHA-mediated glycolysis pathway is involved in the role of PCK1 in the tumorigenesis and metastasis of ccRCC. Our study identified a novel molecular mechanism of the Warburg effect, and intervention in the PCK1/LDHA pathway might be a feasible and effective strategy in the metabolic treatment of ccRCC.
Abbreviations
PCK1, phosphoenolpyruvate carboxykinase 1; ccRCC, clear cell renal cell carcinoma; 18F-FDG, 18F-fluorodeoxyglucose; LDHA, lactate dehydrogenase A; OAA, oxaloacetate; PEP, phosphoenolpyruvate; TCA, tricarboxylic acid; HCC, hepatocellular carcinoma; NAD, nicotinamide adenine dinucleotide; TNM, tumor-node-metastasis; HIF1α, hypoxia-inducible factor 1 alpha; FOXM1, forkhead box protein M1; KLF4, Kruppel-like factor 4; CMA, chaperone-mediated autophagy; PVDF, polyvinylidene difluoride; OCR, oxygen consumption rate; ECAR, extracellular acidification rate; PET, positron emission tomography; CT, computed tomography; IHC, immunohistochemical; SUVmax, maximal standard uptake values; LAMP2A, lysosomal-associated membrane protein A.
Acknowledgments
Support for this work was provided by National Natural Science Foundation of China (Nos. 81771858, 81271604). We would also like to thank Xiaoxiao Yang (Zhongshan Hospital) for her great suggestions in figure construction.
Author Contributions
All authors made substantial contributions to conception and design, acquisition of data, or analysis and interpretation of data; took part in drafting the article or revising it critically for important intellectual content; gave final approval of the version to be published; and agree to be accountable for all aspects of the work.
Disclosure
The authors report no conflicts of interest in this work.
References
1. Yoshida GJ. Metabolic reprogramming: the emerging concept and associated therapeutic strategies. J Exp Clin Cancer Res. 2015;34(1):111. doi:10.1186/s13046-015-0221-y
2. Rini BI, Campbell SC, Escudier B. Renal cell carcinoma. Lancet. 2009;373(9669):1119–1132. doi:10.1016/s0140-6736(09)60229-4
3. Gupta K, Miller JD, Li JZ, Russell MW, Charbonneau C. Epidemiologic and socioeconomic burden of metastatic renal cell carcinoma (mRCC): a literature review. Cancer Treat Rev. 2008;34(3):193–205. doi:10.1016/j.ctrv.2007.12.001
4. Vander Heiden MG, Cantley LC, Thompson CB. Understanding the warburg effect: the metabolic requirements of cell proliferation. Science. 2009;324(5930):1029–1033. doi:10.1126/science.1160809
5. Hanson RW, Garber AJ. Phosphoenolpyruvate carboxykinase. I. Its role in gluconeogenesis. Am J Clin Nutr. 1972;25(10):1010–1021. doi:10.1093/ajcn/25.10.1010
6. Nordlie RC, Lardy HA. Mammalian liver phosphoneolpyruvate carboxykinase activities. J Biol Chem. 1963;238:2259–2263.
7. Chang HC, Maruyama H, Miller RS, Lane MD. The enzymatic carboxylation of phosphoenolpyruvate. 3. Investigation of the kinetics and mechanism of the mitochondrial phosphoenolpyruvate carboxykinase-catalyzed reaction. J Biol Chem. 1966;241(10):2421–2430.
8. Vieira P, Cameron J, Rahikkala E, et al. Novel homozygous PCK1 mutation causing cytosolic phosphoenolpyruvate carboxykinase deficiency presenting as childhood hypoglycemia, an abnormal pattern of urine metabolites and liver dysfunction. Mol Genet Metab. 2017;120(4):337–341. doi:10.1016/j.ymgme.2017.02.003
9. Valera A, Pujol A, Pelegrin M, Bosch F. Transgenic mice overexpressing phosphoenolpyruvate carboxykinase develop non-insulin-dependent diabetes mellitus. Proc Natl Acad Sci U S A. 1994;91(19):9151–9154. doi:10.1073/pnas.91.19.9151
10. Owen OE, Kalhan SC, Hanson RW. The key role of anaplerosis and cataplerosis for citric acid cycle function. J Biol Chem. 2002;277(34):30409–30412. doi:10.1074/jbc.R200006200
11. Montal ED, Dewi R, Bhalla K, et al. PEPCK coordinates the regulation of central carbon metabolism to promote cancer cell growth. Mol Cell. 2015;60(4):571–583. doi:10.1016/j.molcel.2015.09.025
12. Ma R, Zhang W, Tang K, et al. Switch of glycolysis to gluconeogenesis by dexamethasone for treatment of hepatocarcinoma. Nat Commun. 2013;4(1):2508. doi:10.1038/ncomms3508
13. Liu MX, Jin L, Sun SJ, et al. Metabolic reprogramming by PCK1 promotes TCA cataplerosis, oxidative stress and apoptosis in liver cancer cells and suppresses hepatocellular carcinoma. Oncogene. 2018;37(12):1637–1653. doi:10.1038/s41388-017-0070-6
14. Tang Y, Zhang Y, Wang C, et al. Overexpression of PCK1 gene antagonizes hepatocellular carcinoma through the activation of gluconeogenesis and suppression of glycolysis pathways. Cell Physiol Biochem. 2018;47(1):344–355. doi:10.1159/000489811
15. Shi H, Fang R, Li Y, et al. The oncoprotein HBXIP suppresses gluconeogenesis through modulating PCK1 to enhance the growth of hepatoma cells. Cancer Lett. 2016;382(2):147–156. doi:10.1158/1078-0432.ccr-14-0186
16. Khan MW, Biswas D, Ghosh M, Mandloi S, Chakrabarti S, Chakrabarti P. mTORC2 controls cancer cell survival by modulating gluconeogenesis. Cell Death Discov. 2015;1(1):15016. doi:10.1038/cddiscovery.2015.16
17. Sanders E, Diehl S. Analysis and interpretation of transcriptomic data obtained from extended warburg effect genes in patients with clear cell renal cell carcinoma. Oncoscience. 2015;2(2):151–186. doi:10.18632/oncoscience.128
18. Sun X, Zhang H, Luo L, et al. Comparative proteomic profiling identifies potential prognostic factors for human clear cell renal cell carcinoma. Oncol Rep. 2016;36(6):3131–3138. doi:10.3892/or.2016.5159
19. Dawson DM, Goodfriend TL, Kaplan NO, Kaplan NO. Lactic dehydrogenases: functions of the two types rates of synthesis of the two major forms can be correlated with metabolic differentiation. Science. 1964;143(3609):929–933. doi:10.1126/science.143.3609.929
20. Pavlova NN, Thompson CB. The emerging hallmarks of cancer metabolism. Cell Metab. 2016;23(1):27–47. doi:10.1016/j.cmet.2015.12.006
21. Cai Z, Zhao JS, Li JJ, et al. A combined proteomics and metabolomics profiling of gastric cardia cancer reveals characteristic dysregulations in glucose metabolism. Mol Cell Proteomics. 2010;9(12):2617–2628. doi:10.1074/mcp.M110.000661
22. Girgis H, Masui O, White NM, et al. Lactate dehydrogenase A is a potential prognostic marker in clear cell renal cell carcinoma. Mol Cancer. 2014;13(1):101. doi:10.1186/1476-4598-13-101
23. Wang J, Wang H, Liu A, Fang C, Hao J, Wang Z. Lactate dehydrogenase A negatively regulated by miRNAs promotes aerobic glycolysis and is increased in colorectal cancer. Oncotarget. 2015;6(23):19456–19468. doi:10.18632/oncotarget.3318
24. Koukourakis MI, Giatromanolaki A, Sivridis E, et al. Lactate dehydrogenase-5 (LDH-5) overexpression in non-small-cell lung cancer tissues is linked to tumour hypoxia, angiogenic factor production and poor prognosis. Br J Cancer. 2003;89(5):877–885. doi:10.3109/09553002.2016.1162921
25. Huang X, Li X, Xie X, et al. High expressions of LDHA and AMPK as prognostic biomarkers for breast cancer. Breast. 2016;30:39–46. doi:10.1016/j.breast.2016.08.014
26. He TL, Zhang YJ, Jiang H, Li XH, Zhu H, Zheng KL. The c-Myc-LDHA axis positively regulates aerobic glycolysis and promotes tumor progression in pancreatic cancer. Med Oncol. 2015;32(7):187. doi:10.1007/s12032-015-0633-8
27. Koukourakis MI, Kakouratos C, Kalamida D, et al. Hypoxia-inducible proteins HIF1alpha and lactate dehydrogenase LDH5, key markers of anaerobic metabolism, relate with stem cell markers and poor post-radiotherapy outcome in bladder cancer. Int J Radiat Biol. 2016;92(7):353–363. doi:10.1038/sj.bjc.6601205
28. Li L, Kang L, Zhao W, et al. miR-30a-5p suppresses breast tumor growth and metastasis through inhibition of LDHA-mediated warburg effect. Cancer Lett. 2017;400:89–98. doi:10.1016/j.canlet.2017.04.034
29. Le A, Cooper CR, Gouw AM, et al. Inhibition of lactate dehydrogenase A induces oxidative stress and inhibits tumor progression. Proc Natl Acad Sci U S A. 2010;107(5):2037–2042. doi:10.1073/pnas.0914433107
30. Dang CV, Le A, Gao P. MYC-induced cancer cell energy metabolism and therapeutic opportunities. Clin Cancer Res. 2009;15(21):6479–6483. doi:10.1158/1078-0432.CCR-09-0889
31. Kaelin WG
32. Cui J, Shi M, Xie D, et al. FOXM1 promotes the warburg effect and pancreatic cancer progression via transactivation of LDHA expression. Clin Cancer Res. 2014;20(10):2595–2606. doi:10.1158/1078-0432.CCR-13-2407
33. Shi M, Cui J, Du J, et al. A novel KLF4/LDHA signaling pathway regulates aerobic glycolysis in and progression of pancreatic cancer. Clin Cancer Res. 2014;20(16):4370–4380. doi:10.1158/1078-0432.ccr-14-0186
34. Zhao D, Zou SW, Liu Y, et al. Lysine-5 acetylation negatively regulates lactate dehydrogenase A and is decreased in pancreatic cancer. Cancer Cell. 2013;23(4):464–476. doi:10.1016/j.ccr.2013.02.005
35. Jeong H, Then F, Melia TJ
36. Cuervo AM. Chaperone-mediated autophagy: selectivity pays off. Trends Endocrinol Metab. 2010;21(3):142–150. doi:10.1016/j.tem.2009.10.003
37. Augoff K, Hryniewicz-Jankowska A, Tabola R. Lactate dehydrogenase 5: an old friend and a new hope in the war on cancer. Cancer Lett. 2015;358(1):1–7. doi:10.1016/j.canlet.2014.12.035
38. Warburg O. On the origin of cancer cells. Science. 1956;123(3191):309–314. doi:10.1126/science.123.3191.309
39. Hanahan D, Weinberg RA. Hallmarks of cancer: the next generation. Cell. 2011;144(5):646–674. doi:10.1016/j.cell.2011.02.013
40. Ganapathy-Kanniappan S, Geschwind JF. Tumor glycolysis as a target for cancer therapy: progress and prospects. Mol Cancer. 2013;12:152. doi:10.1186/1476-4598-12-152
41. Lu J, Tan M, Cai Q. The warburg effect in tumor progression: mitochondrial oxidative metabolism as an anti-metastasis mechanism. Cancer Lett. 2015;356(2Pt A):156–164. doi:10.1016/j.canlet.2014.04.001
42. Noda Y, Kanematsu M, Goshima S, et al. 18-F fluorodeoxyglucose uptake in positron emission tomography as a pathological grade predictor for renal clear cell carcinomas. Eur Radiol. 2015;25(10):3009–3016. doi:10.1007/s00330-015-3687-2
43. Li Y, Luo S, Ma R, et al. Upregulation of cytosolic phosphoenolpyruvate carboxykinase is a critical metabolic event in melanoma cells that repopulate tumors. Cancer Res. 2015;75(7):1191–1196. doi:10.1158/0008-5472.CAN-14-2615
44. Beale EG, Harvey BJ, Forest C. PCK1 and PCK2 as candidate diabetes and obesity genes. Cell Biochem Biophys. 2007;48(2–3):89–95. doi:10.1007/s12013-007-0025-6
45. Li B, Qiu B, Lee DS, et al. Fructose-1,6-bisphosphatase opposes renal carcinoma progression. Nature. 2014;513(7517):251–255. doi:10.1038/nature13557
46. Goldstein I, Yizhak K, Madar S, Goldfinger N, Ruppin E, Rotter V. p53 promotes the expression of gluconeogenesis-related genes and enhances hepatic glucose production. Cancer Metab. 2013;1(1):9. doi:10.1186/2049-3002-1-9
47. Smith B, Schafer XL, Ambeskovic A, Spencer CM, Land H, Munger J. Addiction to coupling of the warburg effect with glutamine catabolism in cancer cells. Cell Rep. 2016;17(3):821–836. doi:10.1016/j.celrep.2016.09.045
48. Husain Z, Huang Y, Seth P, Sukhatme VP. Tumor-derived lactate modifies antitumor immune response: effect on myeloid-derived suppressor cells and NK cells. J Immunol. 2013;191(3):1486–1495. doi:10.4049/jimmunol.1202702
49. Zhou X, Chen R, Xie W, Ni Y, Liu J, Huang G. Relationship between 18F-FDG accumulation and lactate dehydrogenase A expression in lung adenocarcinomas. J Nucl Med. 2014;55(11):1766–1771. doi:10.2967/jnumed.114.145490
50. Erez A, DeBerardinis RJ. Metabolic dysregulation in monogenic disorders and cancer - finding method in madness. Nat Rev Cancer. 2015;15(7):440–448. doi:10.1038/nrc3949
 © 2020 The Author(s). This work is published and licensed by Dove Medical Press Limited. The full terms of this license are available at https://www.dovepress.com/terms.php and incorporate the Creative Commons Attribution - Non Commercial (unported, v3.0) License.
By accessing the work you hereby accept the Terms. Non-commercial uses of the work are permitted without any further permission from Dove Medical Press Limited, provided the work is properly attributed. For permission for commercial use of this work, please see paragraphs 4.2 and 5 of our Terms.
© 2020 The Author(s). This work is published and licensed by Dove Medical Press Limited. The full terms of this license are available at https://www.dovepress.com/terms.php and incorporate the Creative Commons Attribution - Non Commercial (unported, v3.0) License.
By accessing the work you hereby accept the Terms. Non-commercial uses of the work are permitted without any further permission from Dove Medical Press Limited, provided the work is properly attributed. For permission for commercial use of this work, please see paragraphs 4.2 and 5 of our Terms.