")
Back to Journals » International Journal of General Medicine » Volume 13
Patterns of Glucose Fluctuation are Challenging in Patients Treated for Non-Hodgkin’s Lymphoma
Authors Marić A , Miličević T , Vučak Lončar J, Galušić D, Radman M
Received 13 January 2020
Accepted for publication 25 March 2020
Published 15 April 2020 Volume 2020:13 Pages 131—140
DOI https://doi.org/10.2147/IJGM.S245779
Checked for plagiarism Yes
Review by Single anonymous peer review
Peer reviewer comments 2
Editor who approved publication: Dr Scott Fraser
Andreja Marić,1 Tanja Miličević,2 Jelena Vučak Lončar,3 Davor Galušić,2 Maja Radman2
1Department of Internal Medicine, County Hospital Čakovec, Čakovec 40000, Croatia; 2Department of Internal Medicine, University Hospital Center Split, Split 21000, Croatia; 3Department of Internal Medicine, County Hospital Zadar, Zadar 23000, Croatia
Correspondence: Tanja Miličević Email [email protected]
Purpose: This cohort study aimed to determine patterns of glycemic fluctuation and changes in metabolic parameters during and after corticosteroid administration in newly diagnosed diffuse large B-cell lymphoma (DLBCL) patients treated with R-CHOP chemotherapy.
Patients and Methods: The study was performed in 20 patients of whom 11 had diabetes and 9 were nondiabetics. Anthropometric parameters were collected, and blood samples were taken four times during the study to analyze metabolic parameters. Capillary glucose was measured seven times a day (fasting, before mean meals, postprandial, and before bedtime) to evaluate the glycemic profile.
Results: In all 20 patients, acute glucocorticoid administration resulted in the elevation of average glucose levels, dominantly postprandial in the afternoon which correlates with corticosteroid peak action. In 7 out of 11 diabetics, prandial insulin was started during corticosteroid administration and discontinued afterward. Although none of our nondiabetic patients met diabetes criteria, evident is the elevation in average glycemia levels six weeks after corticosteroid administration. Potentially, even transient corticosteroid administration reduces insulin sensitivity and contributes to later glycemic disturbances. HbA1c levels were higher at the end of the study while fructosamine levels were higher during the study.
Conclusion: Patients and health-care professionals need to be aware of corticosteroid-induced hyperglycemia. We recommend identifying risk factors, measuring glycemia before, during, and after corticosteroid administration, and starting the adequate therapy as soon as possible.
Keywords: hyperglycemia, glucocorticoids, lymphoma, glucose variability
Introduction
Non-Hodgkin´s lymphoma (NHL) comprises a diverse group of malignant neoplasms of the lymphoid tissue with diverse biological and clinical behavior.1 High-dose corticosteroids such as prednisone are generally part of initial chemotherapy for many groups of lymphoma, although the choice of the chemotherapeutic regimen depends on the lymphoma classification.2
Abnormal glucose metabolism is one of the major adverse effects in patients who receive glucocorticoids. Their use can worsen glycemic control in patients with preexisting diabetes, unmask unrecognized diabetes or potentially lead to glucocorticoid-induced diabetes mellitus (GIDM).3 More than 86% of hospitalized patients treated with corticosteroids and without a known history of diabetes will develop at least one episode of hyperglycemia and almost 50% of them will present with a mean blood glucose ≥7.8 mmol/L.4,5 Some authors found nearly 30% incidence in the rate of steroid-induced hyperglycemia following R-CHOP therapy.6 A retrospective analysis done by Lamar et al found that 47% of all patients had at least one hyperglycemic episode during the first line lymphoma treatment and hyperglycemia was associated with chemotherapy alteration mostly due to infection. However, there are no data specifically evaluating the role of glucocorticoid-induced hyperglycemia or diabetes as a complication of therapy.2 For this reason, there are no specified guidelines in whom and how to oversee or prevent glycemic disturbances during cancer treatment.
Clinical presentation of GIDM varies and newly diagnosed patients can present as an acute condition such as hyperglycemic hyperosmolar state or diabetic ketoacidosis without any warning signs. The main risk factors identified as predictors of developing GIDM are dose and duration of corticosteroid treatment, previous glucose intolerance, reduced sensitivity to insulin or impaired insulin secretion, age, high body mass index, personal history of gestational diabetes, family history of diabetes, or race.7
Pathophysiology of alterations responsible for the diabetogenic effect of corticosteroids is based on an increase in peripheral insulin resistance along with inhibition of the production and secretion of insulin by pancreatic β-cells, increased gluconeogenesis, enhanced effects of other counterregulatory hormones, the expression of the nuclear receptor peroxisome proliferator-activated receptor α, reduced peripheral glucose uptake at the level of the muscle and adipose tissue, and lipotoxicity due to increased plasma free fatty acids level.8
Patients and Methods
This was a multicentre, prospective cohort study. The primary objective was to determine patterns of glucose fluctuation and metabolic parameters in patients with newly diagnosed diffuse large B-cell lymphoma (DLBCL) depending on the personal history of diabetes mellitus. Measurements and sampling were obtained from 20 newly diagnosed patients with DLBCL who were treated with R-CHOP chemotherapy in the University Hospital Center Split, County Hospital Čakovec and County Hospital Zadar, from April to August 2018. R-CHOP protocol included rituximab (375mg/m2 IV 7 days prior to beginning CHOP regimen), cyclophosphamide (750 mg/m2 IV, day 1), doxorubicin (50 mg/m2 IV bolus, first day), vincristine (1,4 mg/m2 IV bolus, max. 2 mg, first day) and prednisone (40 mg/m2 IV, first to the fifth day).
The baseline and metabolic characteristics of the study patients are presented in Table 1. The diagnosis of diabetes mellitus was established by the current guidelines provided by the American Diabetes Association; fasting blood glucose level of ≥7.0 mmol/L, glycemia at any time ≥11.1 mmol/L, HbA1c ≥ 6.5% or blood glucose ≥11.1 mmol/L two hours after an oral glucose tolerance test. Of the total of 20 patients, 11 were diagnosed with preexisting diabetes mellitus while 9 of them were nondiabetics. HbA1c ranged from 6.1% (43 mmol/mol) to 7.5% (58 mmol/mol) and BMI from 20 to 33 kg/m2. Initial antidiabetic therapy regimens included a combination of sulfonylurea and metformin (6 patients), metformin and repaglinide (2 patients) and metformin monotherapy (3 patients). Differences between baseline and metabolic patient characteristics depending on the personal history of diabetes mellitus are shown in Table 2.
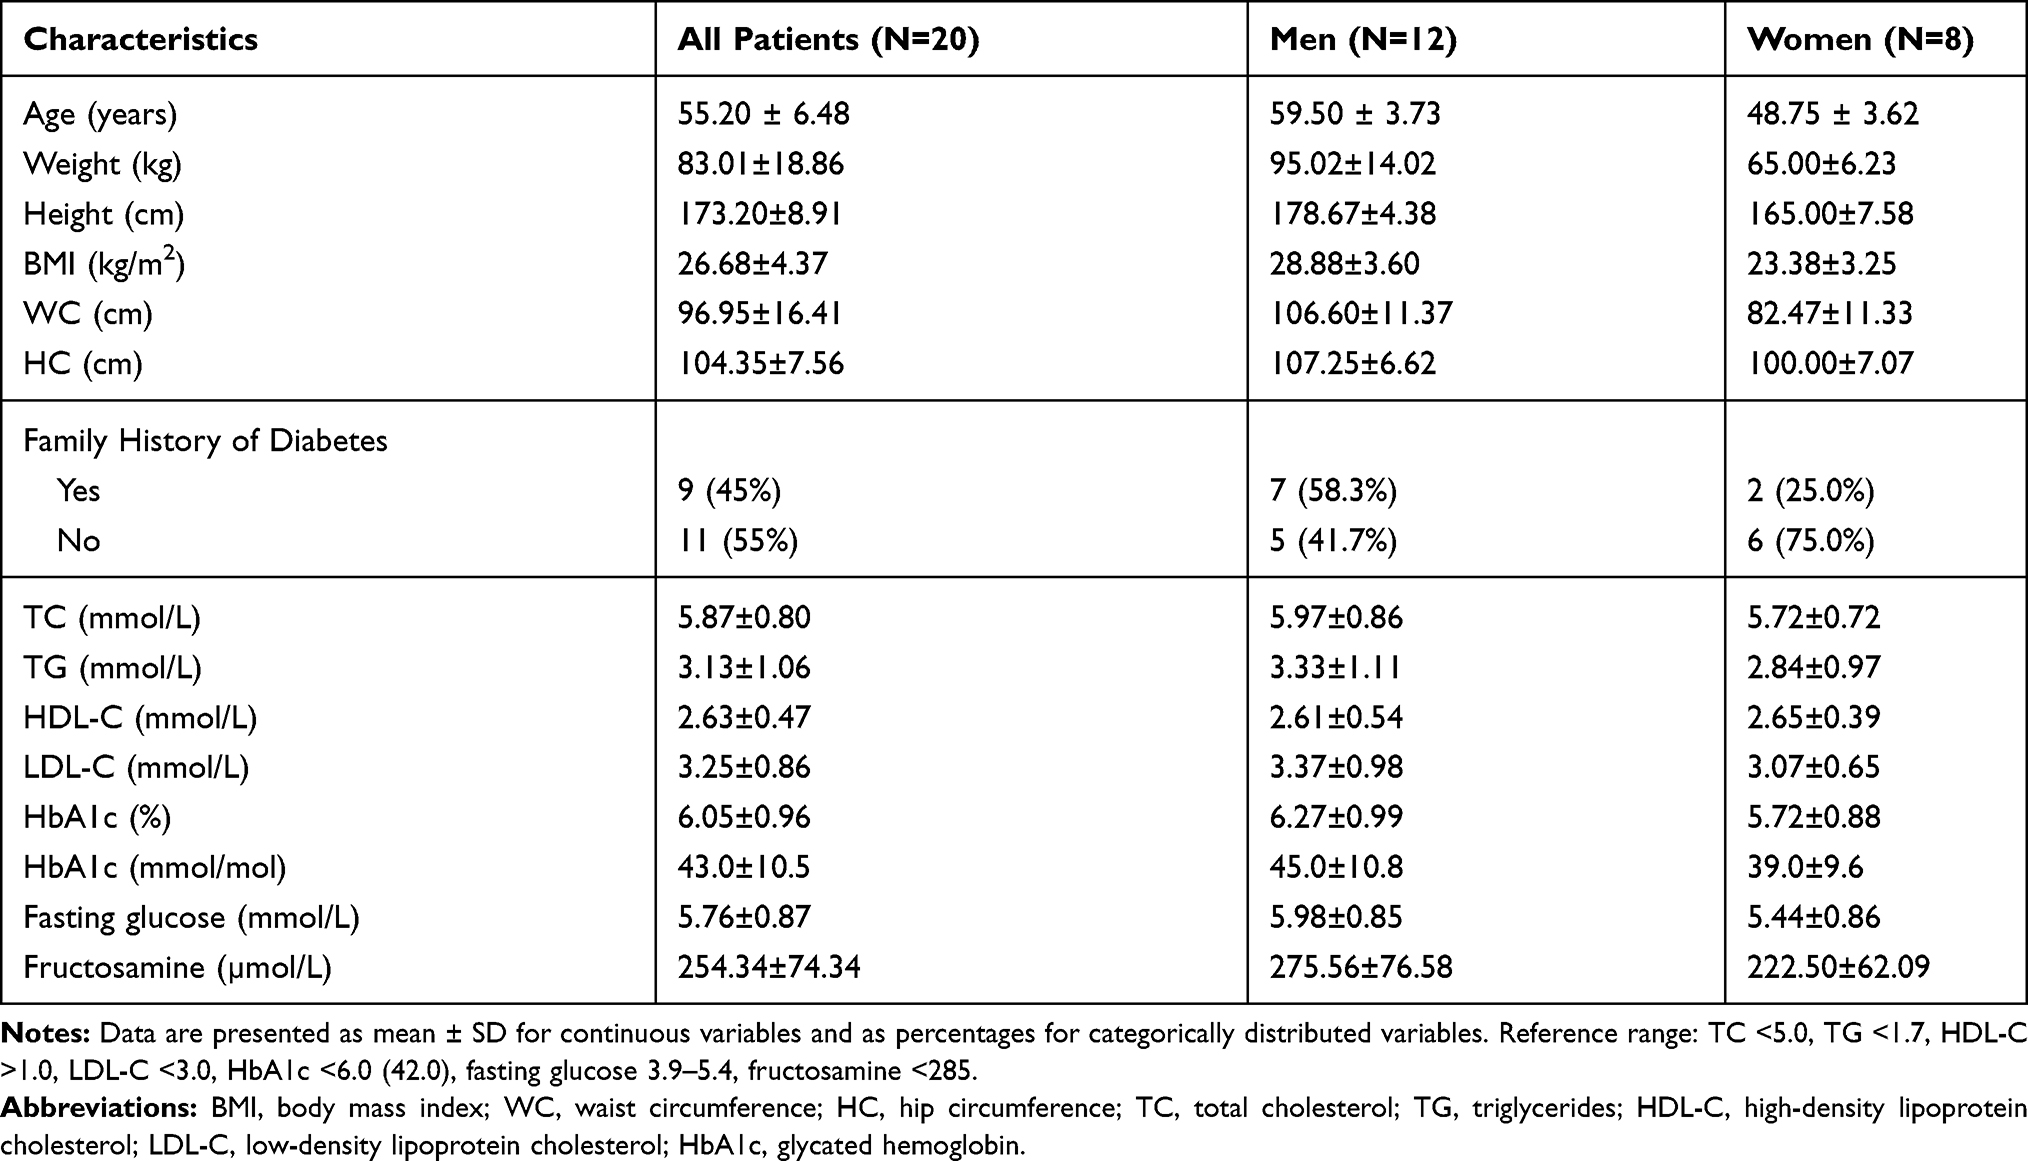 |
Table 1 Baseline and Metabolic Characteristics of the Study Patients |
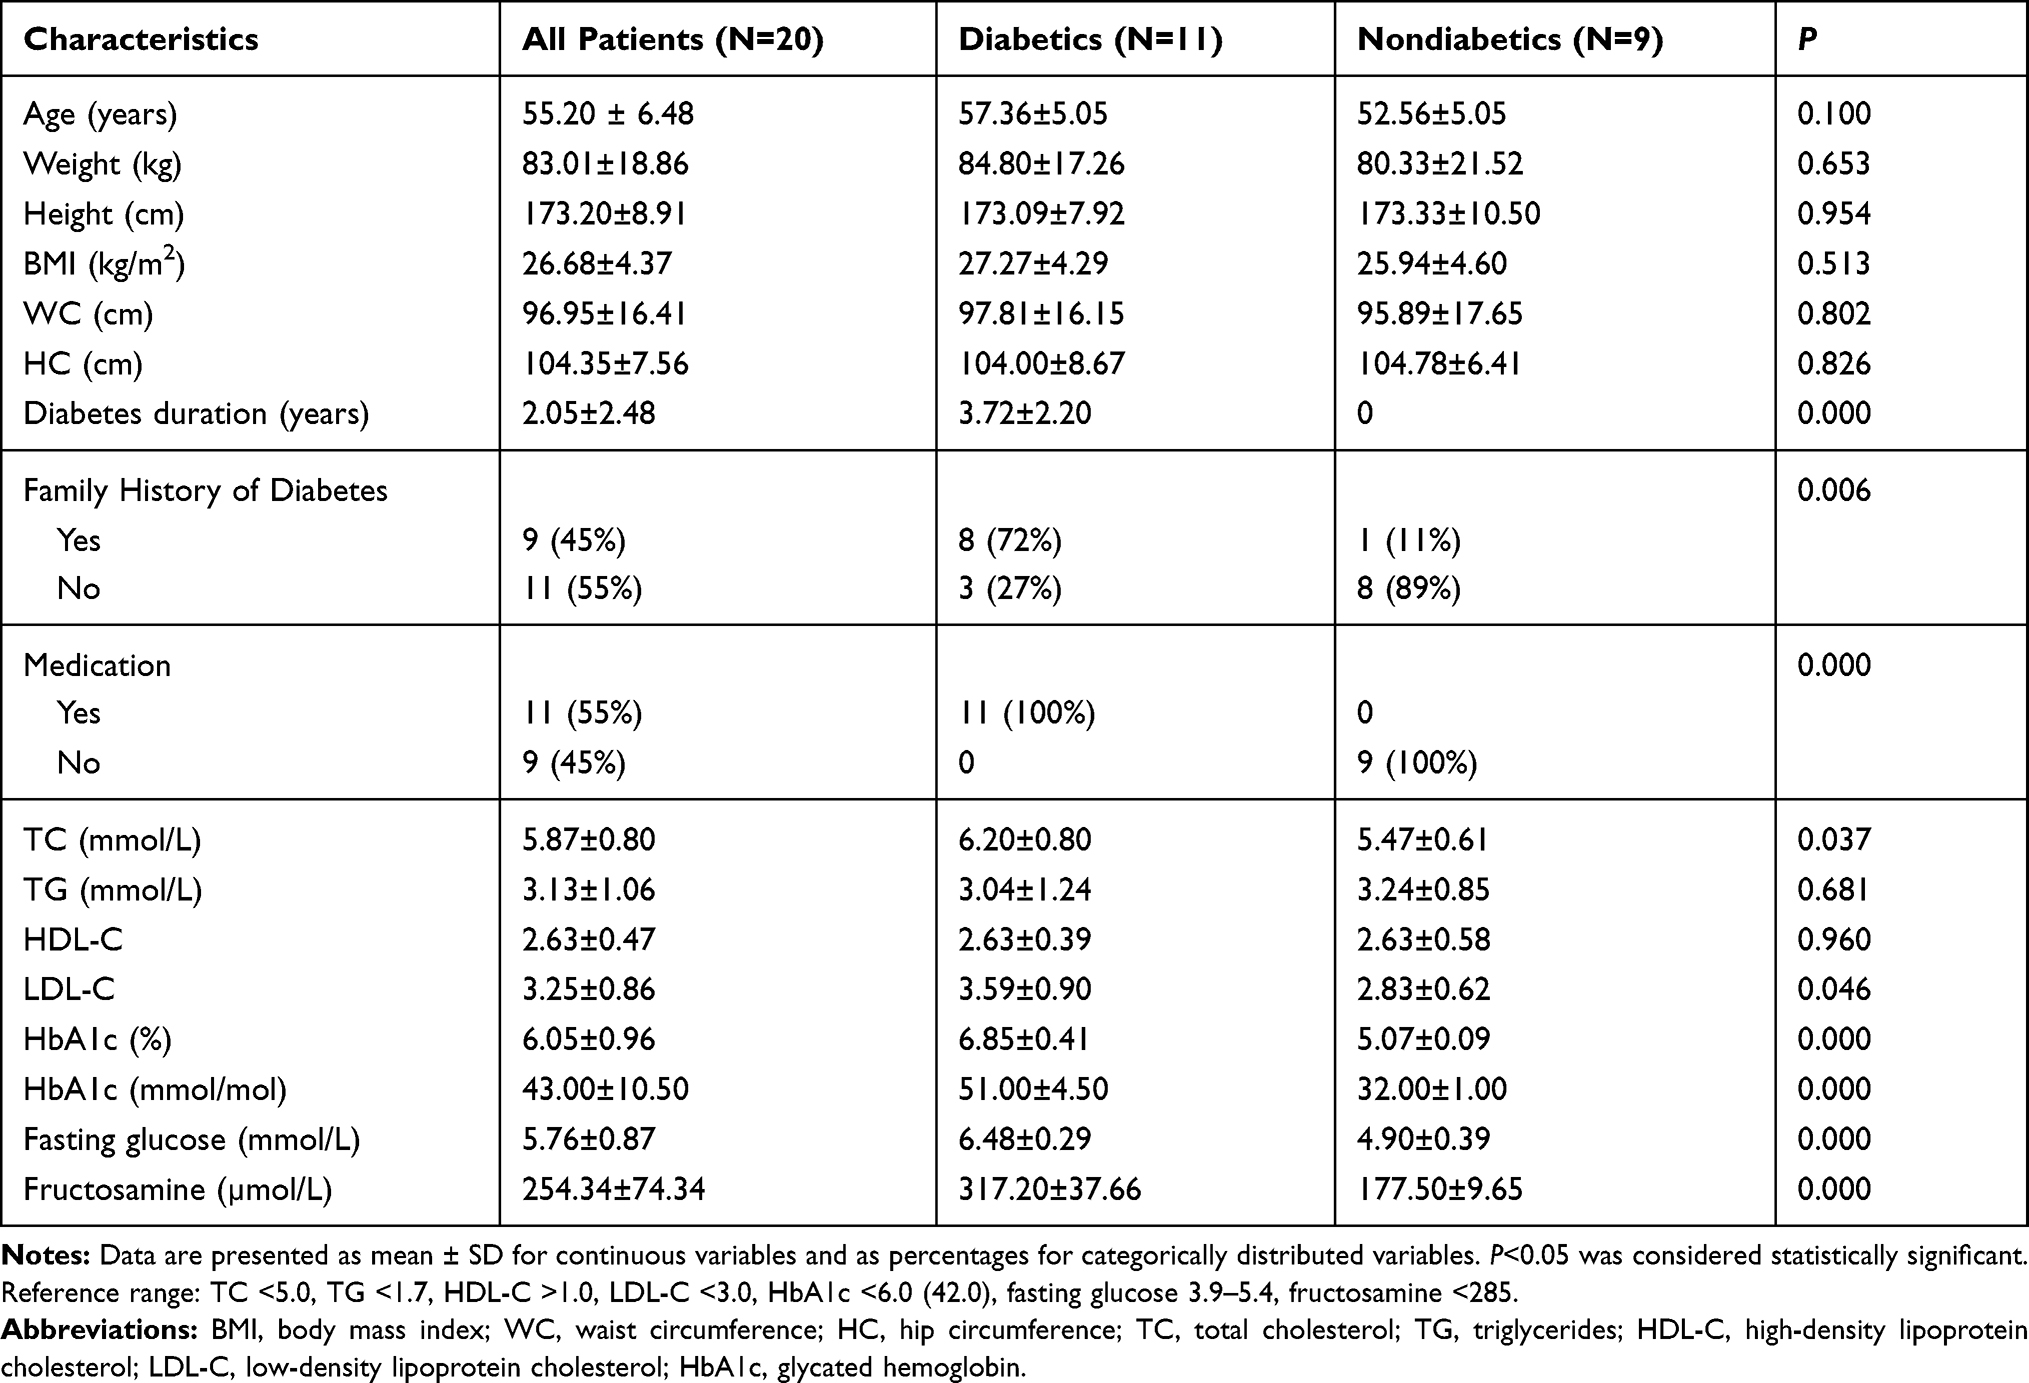 |
Table 2 Overview of Baseline and Metabolic Characteristics of Diabetic and Nondiabetic Patients |
Anthropometric measurements were performed at the beginning of the study and included body height, weight, body mass index (BMI), and body circumferences (waist, hip). Body height was measured using the stadiometer with the investigator standing behind the participant. Subjects stood with their scapula, buttocks, and heels resting against a stadiometer, the neck was held in a natural non-stretched position, the heels were touching each other, the toe tips formed a 45° angle and the head was held straight with the inferior orbital border in the same horizontal plane as the external auditive conduct (Frankfort´s plane). The horizontal arm of the stadiometer was lowered until it touched the scalp (anthropometric point vertex). Bodyweight was measured on the medical decimal scale with a sliding weight, with a ± 100 g error margin. Patients were barefoot, only wearing their underwear. The weight was rounded up to the nearest 0.5 kg. BMI was estimated by dividing weight (kg) by height2 (m2). Waist and hip circumferences were measured using a flexible non-elastic measuring tape. Individuals stood with feet together and arms resting by their sides. The hip circumference was measured from the maximum perimeter of the buttocks. The waist circumference was taken as the plane between the umbilical scar and the inferior rib border.
Blood samples were taken four times during the study; one day before chemotherapy started, on the second and sixth day of treatment, and an additional blood sample was taken six weeks after corticosteroid therapy was completed. Blood samples were taken from the antecubital vein after 12 hour period of overnight fasting. HbA1c plasma levels were measured using the immunochemistry method on the Cobas Integra device while the fructosamine level was measured using colorimetric assay on Abbot Architect ci8200 device. Plasma cholesterol, HDL and LDL cholesterol, triglycerides, and glucose levels were analyzed on Abbot Architect c16000 device. Capillary glucose was measured seven times a day during the treatment (before breakfast, lunch and dinner, two hours after breakfast, lunch and dinner and before bedtime) with self-monitoring blood glucose device (Contour, Bayer).
All continuous variables were expressed as mean ± SD and categorical variables were expressed as percentages. Normally distributed variables were presented as mean ± SD and compared using independent samples t-test. Categorical variables were compared between the groups using the χ2 test. The linear relationship between the two quantitative variables was investigated using the Pearson correlation coefficient (normally distributed variables) or Spearman’s rank correlation coefficient (non-normally distributed variables). The level of significance was set at P<0.05. Statistical analyses were performed using statistical software SPSS v.20. The study was conducted according to the Declaration of Helsinki and was approved by University Hospital Center Split, County Hospital Čakovec and County Hospital Zadar ethics committees. All patients have provided written informed consent for their details to be used in the manuscript.
Results
A detailed overview of daily plasma glucose values in consecutive measurements is shown in Table 3. In all seven-points of daily glucose monitoring there are statistically significant differences between glucose values in diabetic and nondiabetic patients whereas diabetic patients reached significantly higher glucose values in contrast to nondiabetic patients. In the first measurement (1 day before R-CHOP chemotherapy) the highest average glycemic value in diabetic patients was recorded after dinner (8.56 mmol/L), and in nondiabetic patients after lunch (6.11 mmol/L). In the second measurement (2nd day of chemotherapy), the average glycemic values in diabetics were generally higher with the highest value recorded before dinner (10.88 mmol/L) while nondiabetics had the highest glucose value after dinner (8.26 mmol/L). In the third measurement (6th day of cycle) the highest glycemic value was lower than in the second measurement for both diabetics and nondiabetics (9.36 mmol/L and 7.47 mmol/L, respectively). In the fourth measurement (6 weeks after chemotherapy) the average glycemic values in diabetics were lower and the highest value was recorded after dinner (8.66 mmol/L) while glucose profile appeared normal in nondiabetics (6.53 mmol/L) but generally higher than in the first measurement.
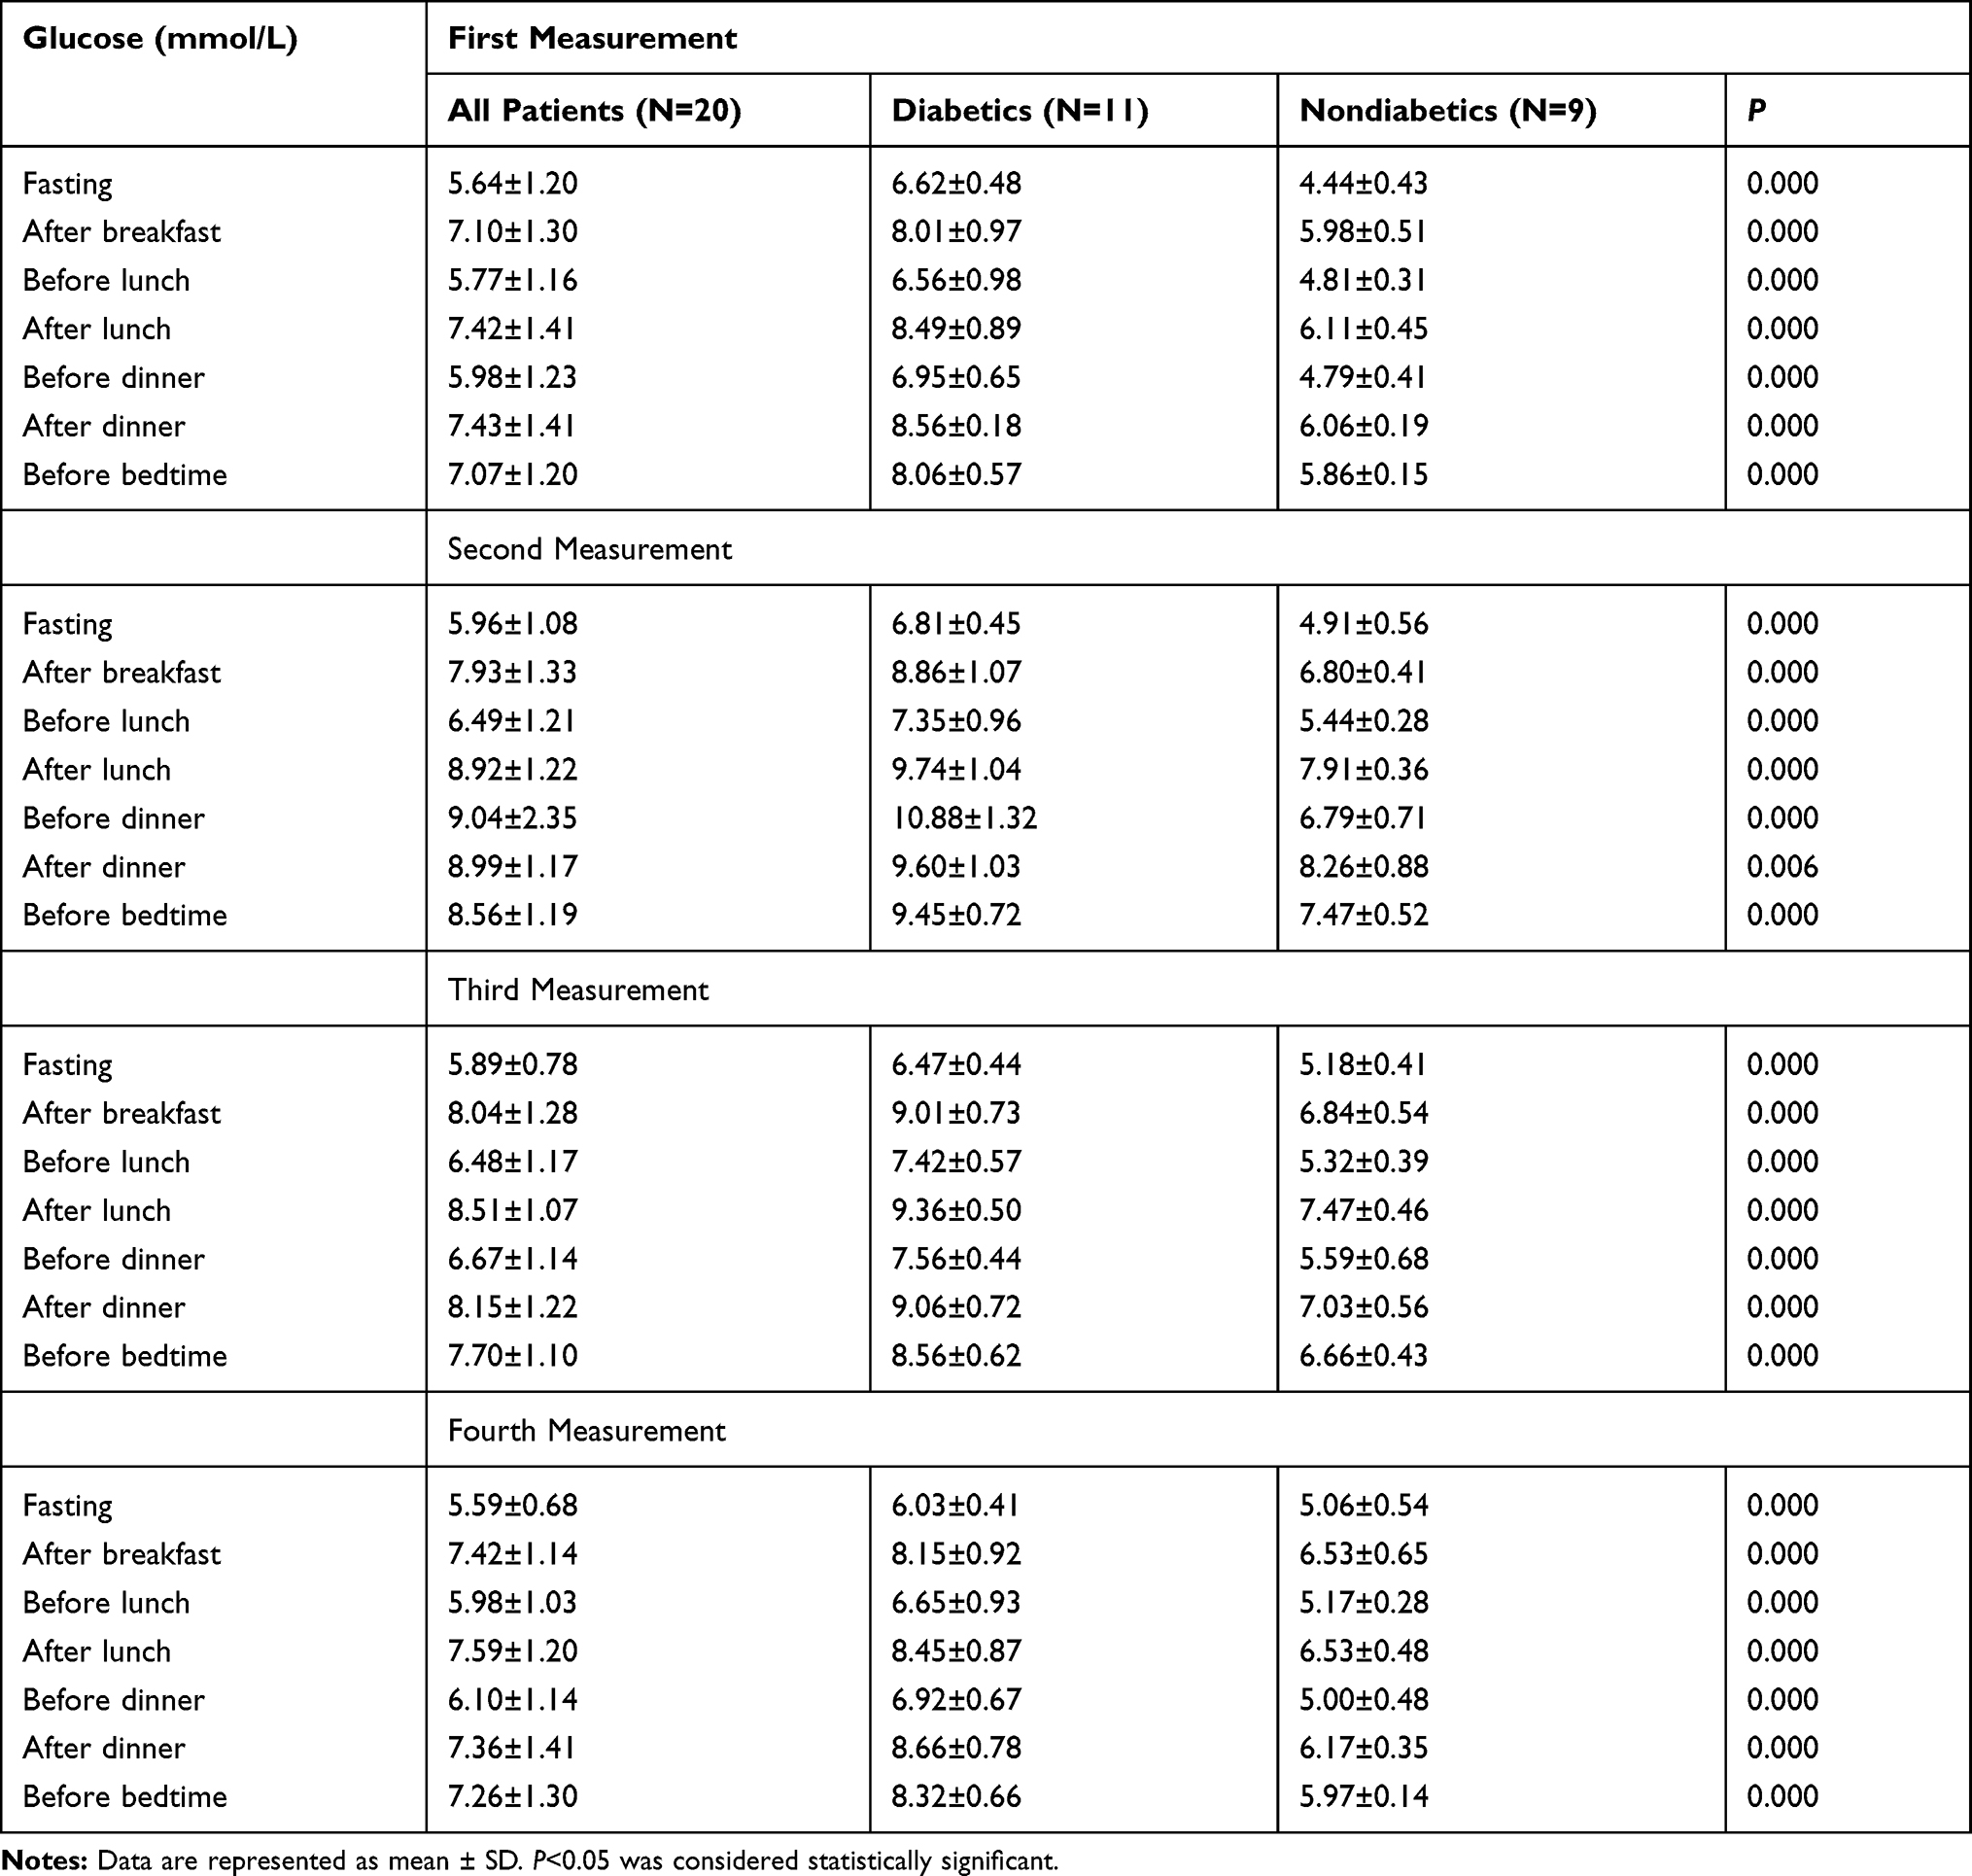 |
Table 3 Comparison of Plasma Glucose Values Between Diabetics and Nondiabetics During Consecutive Measurements |
When comparing glucose values in all seven-points in different measurements in patients with diabetes, the following statistically significant differences were observed (Table 4). The fasting glucose values showed a statistically significant difference between the fourth and third measurements, as well as between the fourth and first, wherein both cases the glucose value was lower in the fourth measurement. The glucose values measured after breakfast were higher in the second measurement than in the first and lower in the fourth compared to the third measurement. Glucose level before lunch was statistically higher in the second measurement than in the first, lower in the fourth measurement than in the third and higher in the fourth measurement than in the first. After-lunch values were statistically higher in the second measurement compared to the first and lower in the fourth compared to the third. Before dinner, glucose value was statistically higher in the second measurement than in the first, lower in the third measurement than in the second and lower in the fourth than in the third. The only statistically significant difference in the after-dinner value was found in the second measurement. The values before bedtime proved to be statistically significant between the second and first measurements where the second measurement was higher; between the second and third where the third was lower and between the fourth and the first where the fourth measurement showed higher glucose level.
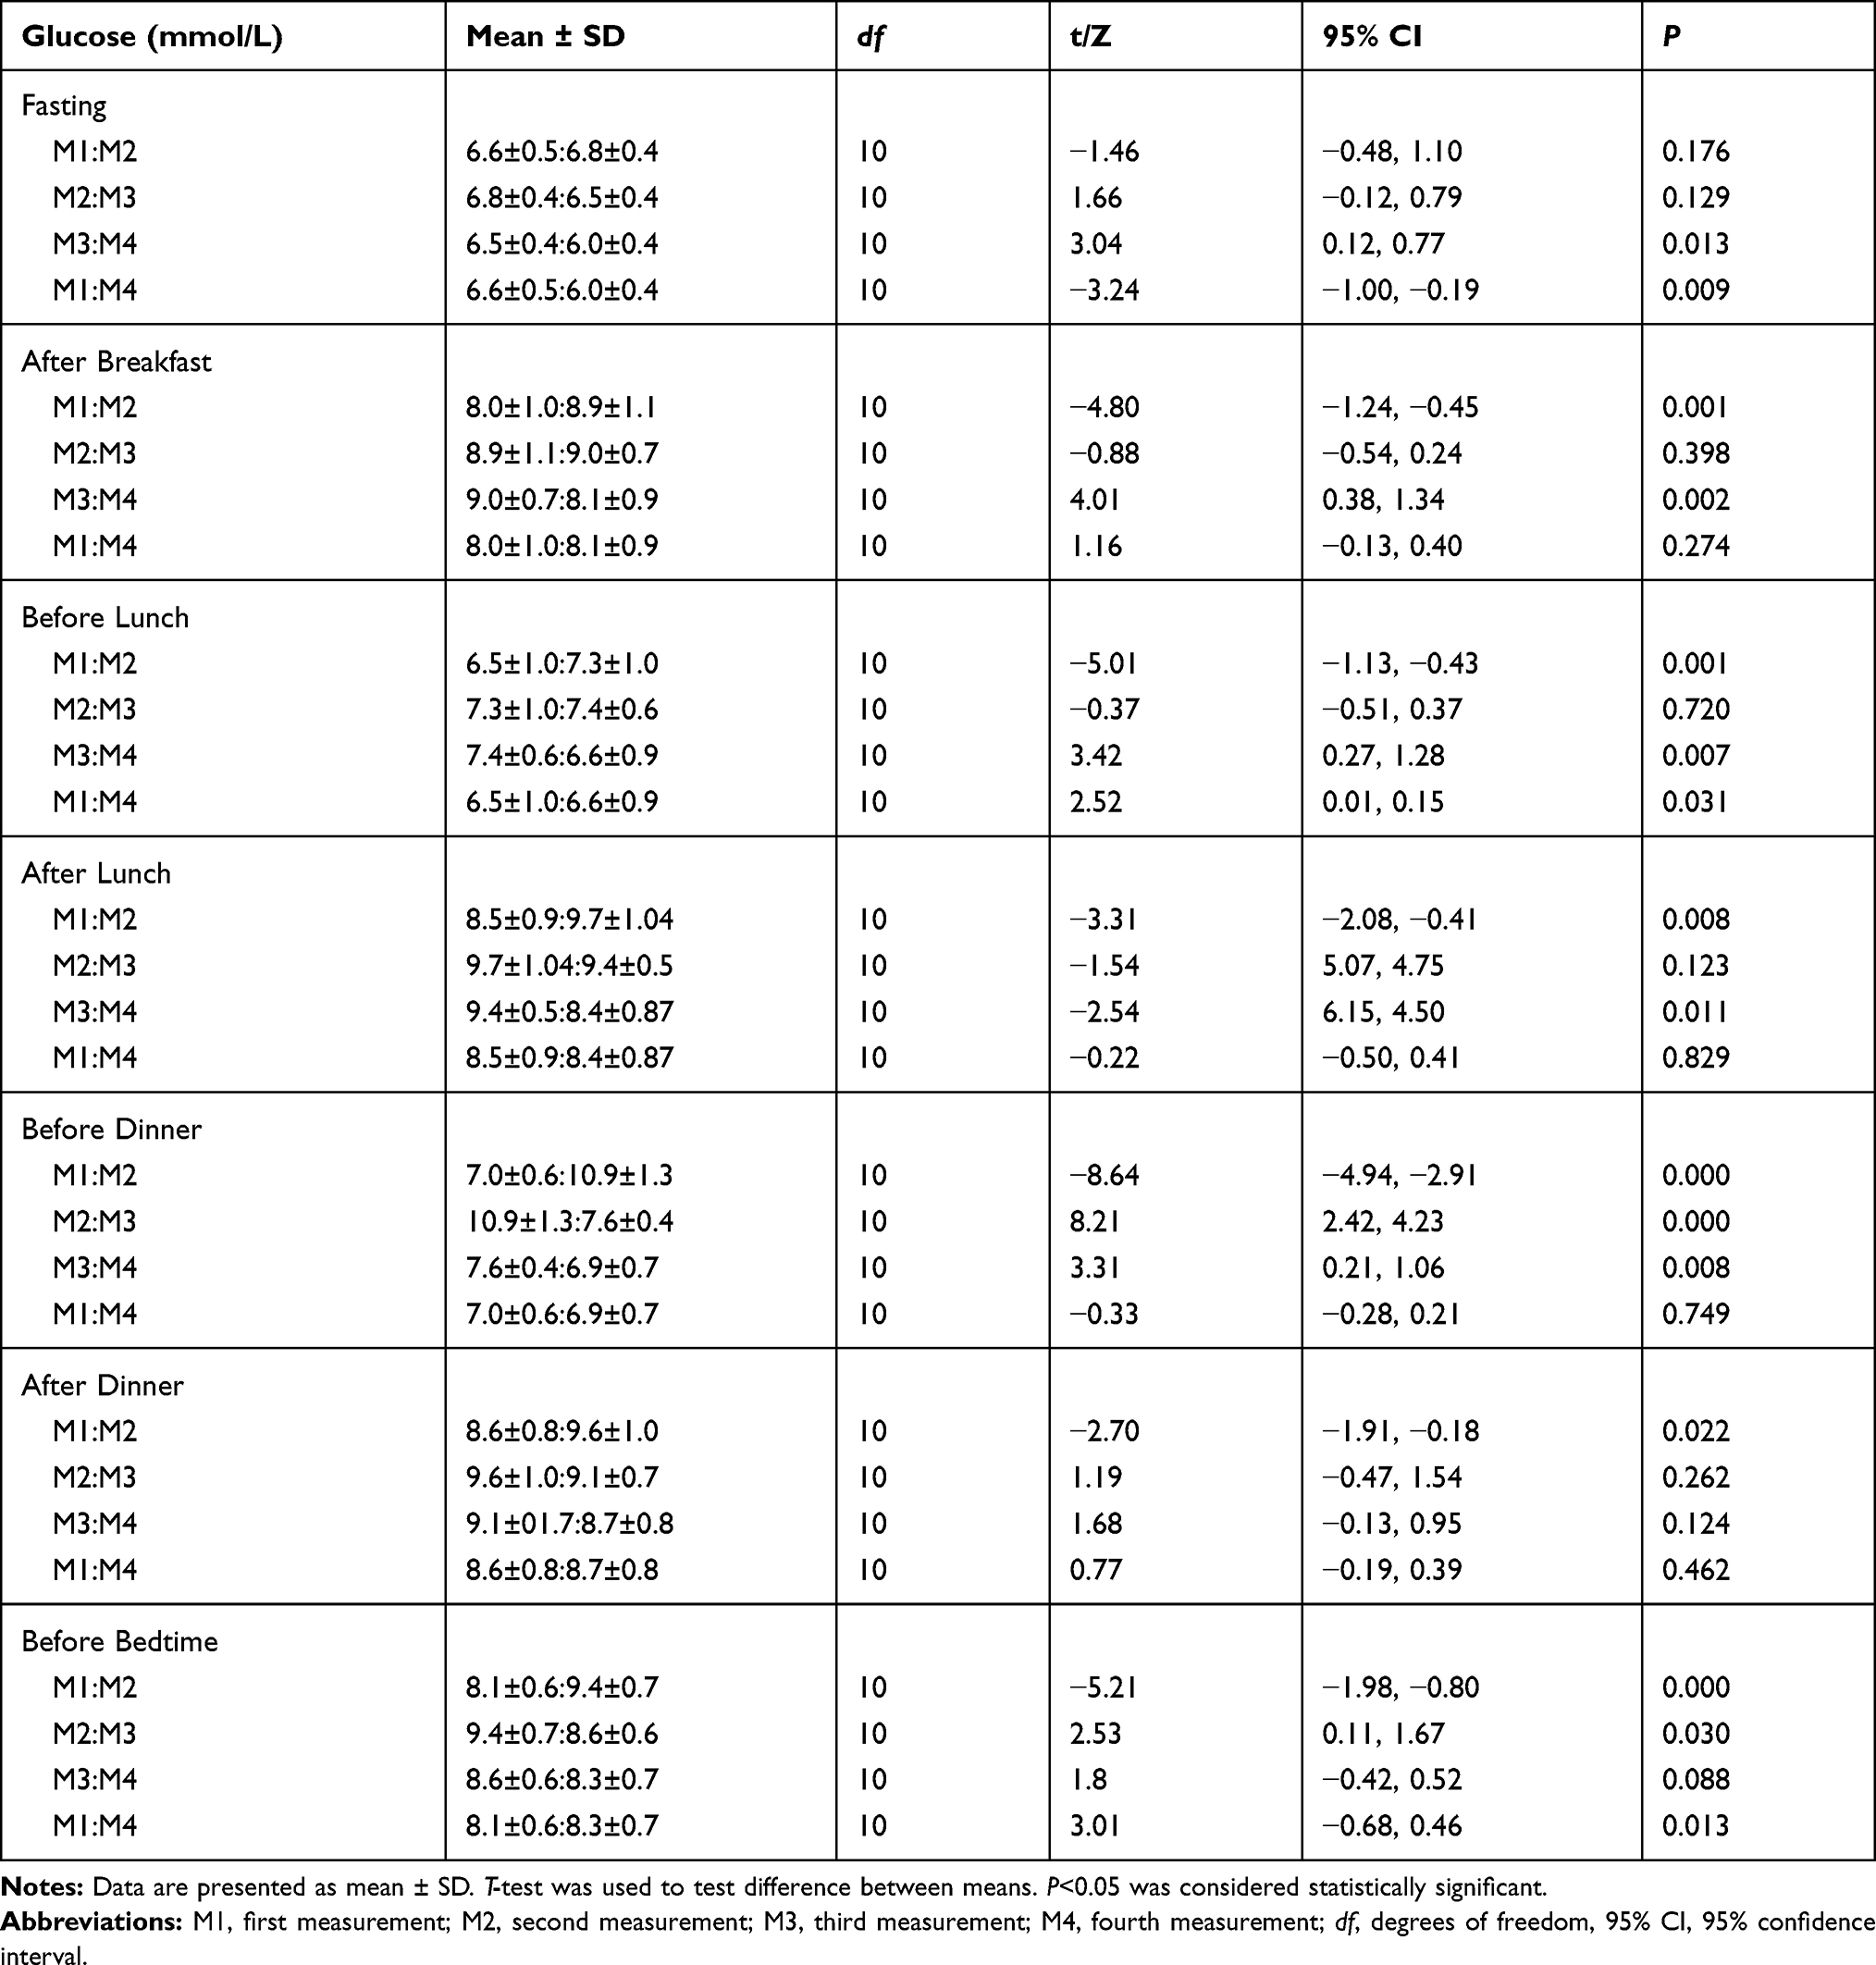 |
Table 4 Differences Between Seven-Point Glucose Values Across All Four Measurements in Diabetics |
When comparing glucose values at all seven-points in different measurements in patients without diabetes, the following statistically significant differences were observed (Table 5). The fasting glucose value was statistically higher in the second and fourth measurements than in the first measurement. Glucose levels after breakfast were statistically higher in the second measurement than in the first, lower in the fourth measurement when compared to the third, but higher than in the first. Glucose measured before lunch turned out to be statistically higher in the second measurement when compared to the first, lower in the fourth when compared to the third but higher when compared to the first measurement. Statistically significant differences were found for glucose values measured after lunch – the second measurement was higher than the first; the third was lower than the second; the fourth was lower than the third but higher than the first. The same is true for values before dinner – the second measurement showed higher glucose level than the first, the third measurement showed lower value than the second, the fourth showed lower than the third, but also higher than the first measurement. In the case of glucose values after dinner, the value in the second measurement was statistically significantly higher than in the first, the value in the third measurement was lower than in the second measurement and the value of the fourth measurement was lower than the value of the third. Glucose values measured before bedtime appeared to be higher in the second measurement than in the first and third measurements, while the value in the fourth measurement was lower than in the third but higher than in the first measurement.
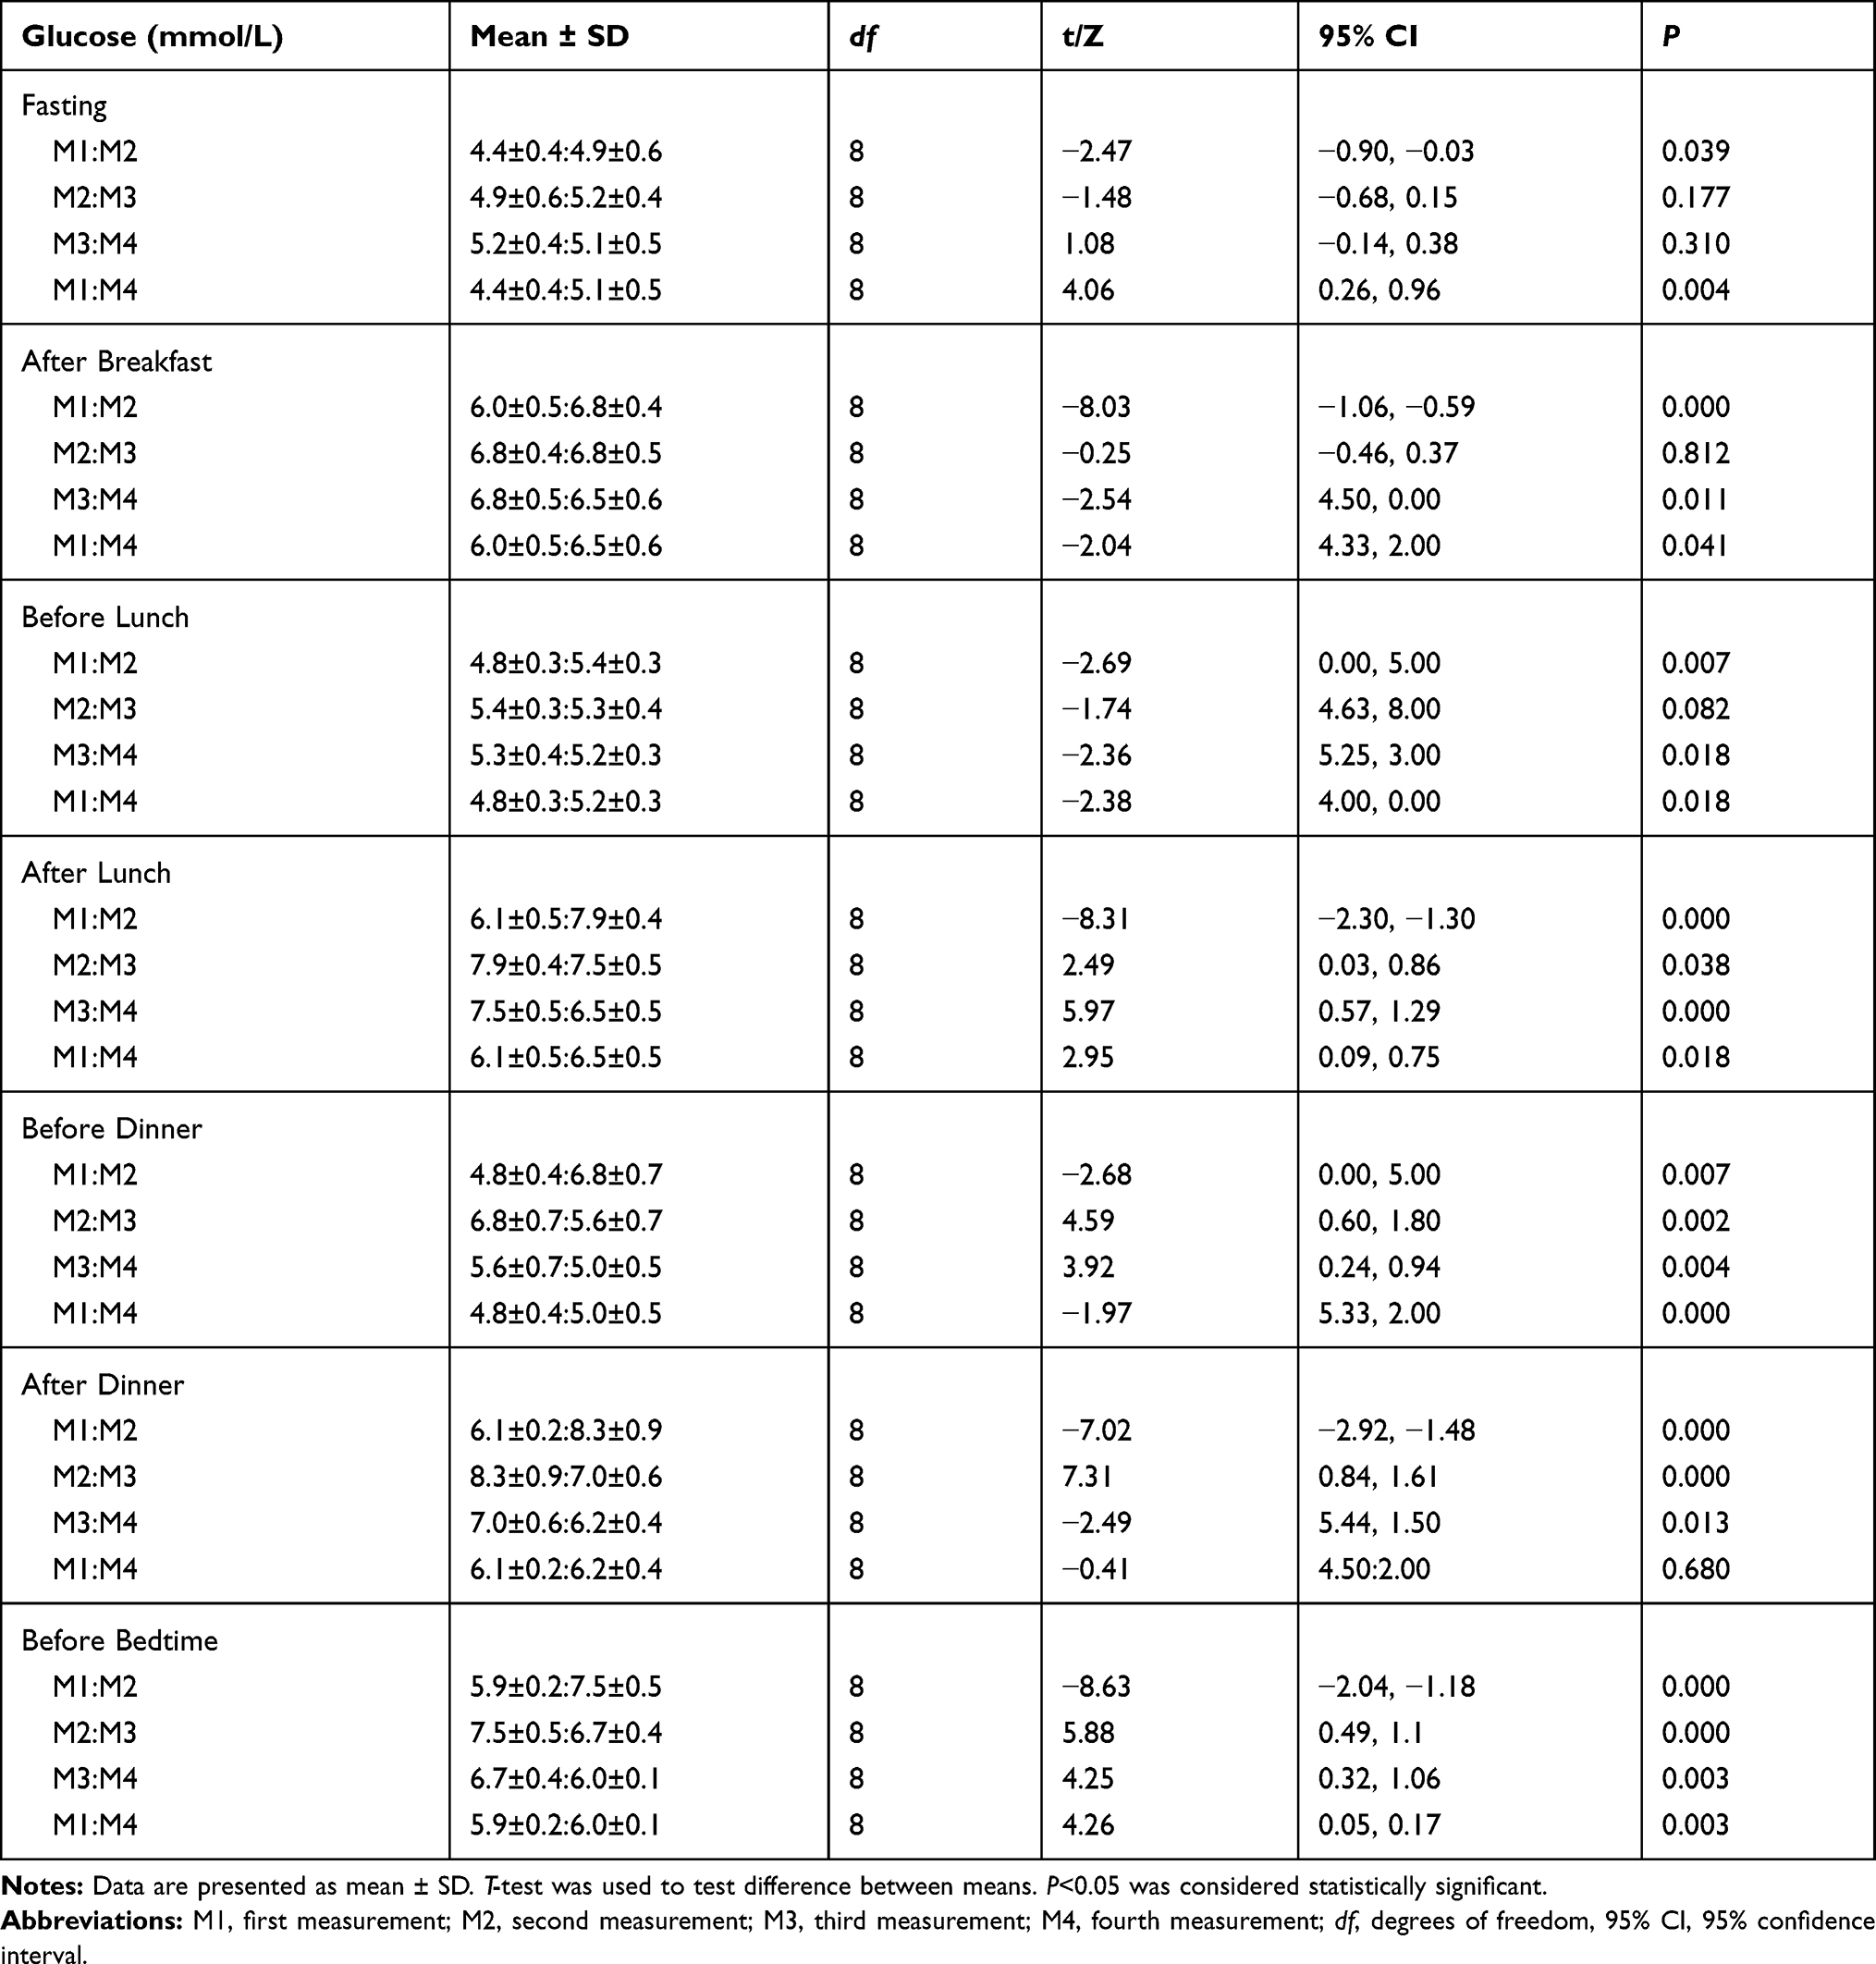 |
Table 5 Differences Between Seven-Point Glucose Values Across All Four Measurements in Nondiabetics |
Given the increase in glycemic target values, fast-acting insulin was started before dinner in 7 of 11 diabetic patients (64%) on the second day of the study (initial dose of 0.05 U/kg). One patient was administered prandial insulin before dinner from the third day, and one patient was administered basal insulin at bedtime on the second day of the study (initial dose of 0.1 U/kg). In two patients fast-acting insulin was administered twice a day, before lunch and before dinner. In one patient prandial insulin was administered before lunch on the sixth day when the corticosteroid administration finished. Other patients continued with previous therapy.
Analyzing other variables, the following significant statistical differences were found. HbA1c level was significantly higher in the fourth than in the first and third measurements. For fructosamine, the value observed in the second measurement was statistically higher than in the first measurement, but also significantly lower than the value in the third measurement. The fructosamine level was significantly lower in the fourth compared to the third measurement. Considering all four measurements, it was evident that the duration of diabetes and fasting plasma glucose strongly correlated with HbA1c values. Age, duration of diabetes, and fasting plasma glucose moderately and strongly correlated with fructosamine (Table 6).
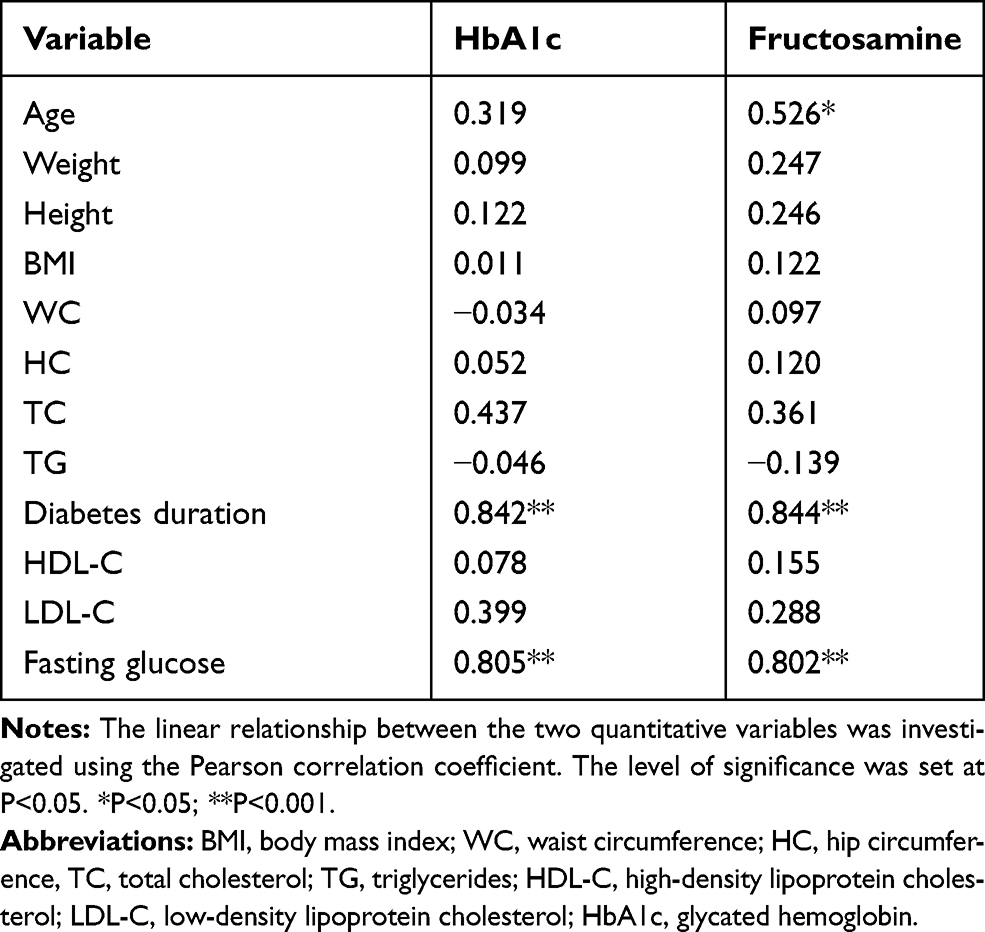 |
Table 6 Correlation of Different Variables with HbA1c and Fructosamine for All Patients |
Discussion
Patients given corticosteroids consecutively at a dose that exceeds 40 mg per day are likely to develop hyperglycemia.9 According to published data, the impact is the greatest during the first days of the administration, with a spontaneous remission later on in the majority of patients.10 The effect on glucose level depends both on the type and dose of corticosteroid given. An intermediate-acting corticosteroid such as prednisone, affects the glucose level dominantly in the afternoon and night which overlaps with its peak action. On the other hand, dexamethasone causes consecutive hyperglycemia that lasts for more than 24 hours.8 The combination of corticosteroids with acute hematologic disease in our patients contributed to the decrease in the β-cell function and an increase in peripheral insulin resistance.
Our study confirmed the fact that the highest glucose values were recorded in the afternoon (sections after lunch – before dinner – after dinner – before bedtime) which correlates with a peak of prednisone action. Despite the dysregulation of preexisting diabetes, average glycemia did not exceed 9.26 mmol/L ± 1.09 mmol/L, even during prolonged corticosteroid administration due to proper monitoring and insulin delivery. To emphasize, majority of our patients were treated with an addition of prandial insulin after a single corticosteroid dose and despite the fact that their diabetes was well regulated before the study.
Unlike the study performed by Lee et al where more than 30% nondiabetic patients treated with R-CHOP chemotherapy developed GIDM, none of our nondiabetics fulfilled diabetes criteria.11 However this could be explained by the small study sample in our case. Analyzing glycemic profiles in nondiabetic patients, the highest fasting glucose level was recorded in the third measurement, the highest glucose after breakfast was recorded in the second and third measurement, and in the afternoon in the second measurement. This can be interpreted by the fact that acute and short-term exposure to prednisolone impairs different aspects of beta-cell function, which contributes to its diabetogenic effects.12 But since glucose levels on average appeared higher in the fourth than in first measurement (in all seven-points of daily glucose profile), it is possible that acute corticosteroid administration impacts later insulin sensitivity in nondiabetic patients what was however expected with chronic corticosteroid use. This is clinically important and worthful finding and should serve as a reminder to monitor glucose levels in nondiabetics even weeks after short corticosteroid use in order to recognize glycemic disturbances.
All patients who are started on corticosteroid treatment should measure baseline glucose and be educated on daily glucose self-monitoring. Frequent daily monitoring should start when hyperglycemia ≥10 mmol/L is identified on more than one occasion.13 In nondiabetic patients who maintain glucose levels <7.8 mmol/L without insulin requirements for one to two days, glycemic monitoring during corticosteroid therapy can be discontinued.5 It could be worth retesting glucose level in nondiabetics a couple of weeks after initial corticosteroid therapy to prevent potential glycemic disturbances in this phase. The diagnosis of GIDM is similar to the current criteria for diagnosing diabetes mellitus established by expert committees.14 For most corticosteroids, measuring fasting blood glucose as the sole diagnostic criterion does not reflect the true incidence of GIDM. This refers especially to intermediate-acting glucocorticoids, such as prednisone and methylprednisolone. Unfortunately, there is no established consensus on the management of patients with GIDM. The approach should always be individualized taking into account a history of preexisting diabetes, comorbidities, the degree of hyperglycemia, type and dose of corticosteroid, as well as hypoglycemic drugs.15 Some international organizations recommend that the treatment of corticosteroid-induced hyperglycemia should be considered when the preprandial and postprandial capillary glucose levels are ≥7.8 mmol/L and ≥11.1 mmol/L, respectively.7 Insulin therapy is often unavoidable as glucocorticoid-induced hyperglycemia is the result of the combined effects of insulin resistance and inhibition of the biosynthesis and insulin release. It is the treatment of choice in patients with persistent hyperglycemia. The choice of insulin type and schedule is primarily determined by the glycemic profile. The prandial insulin scheme is used in those patients who achieve the highest glucose levels postprandially. The use of basal insulin alone or in basal-bolus regimen is usually considered in diabetics or when high doses or long-acting corticosteroids are administered. The total insulin dose must be adjusted according to the glycemic profile every couple of days, with a gradual increase or decrease of the dose. Moreover, one should consider adjusting the insulin dose based on changes in the total steroid dose in order to prevent hyper or hypoglycemia.8 In the majority of our diabetic patients glycemia was well regulated with the addition of a single dose of prandial insulin, dominantly before dinner. Those patients in whom basal insulin or multiple prandial insulin injections were applied had either higher BMI or were poorly regulated prior to entering the study. It is known that glucose fluctuation potentially interferes with planned treatment. Acute hyperglycemia results in altered neutrophil chemotaxis, phagocytosis and microbial activity that leads to reduced neutrophil activity and impaired immune response.16 It is, therefore, associated with a higher risk of infection, poor wound healing, repeated emergency room visits, higher hospital stay and higher mortality rates.4,5,17 A large proportion of patients demanding therapy alteration due to hyperglycemia are proof that practitioners more than often oversee this potential treatment complication although it thought to be ˝generally well-known˝.2
The biggest limitations of our study are small sample size and lack of novel information about corticosteroid-induced hyperglycemia which is well described and previously investigated in numerous articles and medical literature. These limited but detailed and worthful data obtained in our study could help physicians in everyday practice since limited guidelines are available for this clinical problem.
Conclusion
Screening for GIDM should be considered in all patients treated with medium to high doses of corticosteroids. Challenges in the management of GIDM arise from wide fluctuations in dominantly postprandial hyperglycemia and the lack of defined diagnostic and treatment protocols.8 The treatment should be tailored according to proposed glycemic thresholds and patient comorbidities, choosing between antidiabetic oral drugs and insulin, which is preferable among hospitalized patients.18 We strongly recommend an active approach and focus on glucose fluctuation in newly diagnosed DLBCL patients treated with corticosteroids as a part of chemotherapy protocol, irrespective of their diabetes history.
Disclosure
The authors report no conflicts of interest in this work.
References
1. Ansell SM. Non-hodgkin lymphoma: diagnosis and treatment. Mayo Clin Proc. 2015;90:1152–1163.
2. Lamar ZS, Dothard A, Kennedy L, et al. Hyperglycemia during first-line R-CHOP or dose adjusted R-EPOCH chemotherapy for non-hodgkin lymphoma is prevalent and associated with chemotherapy alteration – a retrospective study. Leuk Lymphoma. 2018;59(8):1871–1877. doi:10.1080/10428194.2017.1410889
3. Perez A, Jansen-Chaparro S, Saigi I, et al. Glucocorticoid-induced hyperglycemia. J Diabetes. 2014;6(1):9–20. doi:10.1111/1753-0407.12090
4. Donihi AC, Raval D, Saul M, et al. Prevalence and predictors of corticosteroid-related hyperglycemia in hospitalized patients. Endocr Pract. 2006;12(4):358–362. doi:10.4158/EP.12.4.358
5. Fong AC, Cheung NW. The high incidence of steroid-induced hyperglycaemia in hospital. Diabetes Res Clin Pract. 2013;99(3):277–280. doi:10.1016/j.diabres.2012.12.023
6. Brunello A, Kapoor R, Extermann M. Hyperglycemia during chemotherapy for hematologic and solid tumors is correlated with increased toxicity. Am J Clin Oncol. 2011;34:292–296. doi:10.1097/COC.0b013e3181e1d0c0
7. Suh S, Park MK. Glucocorticoid-induced diabetes mellitus: an important but overlooked problem. Endocrinol Metab (Seoul). 2017;32:180–189. doi:10.3803/EnM.2017.32.2.180
8. Tamez-Pérez HE, Quintanilla-Flores DL, Rodríguez-Gutiérrez R, et al. Steroid hyperglycemia: prevalence, early detection and therapeutic recommendations: a narrative review. World J Diabetes. 2015;6:1073–1081. doi:10.4239/wjd.v6.i8.1073
9. Kwon S, Hermayer KL, Hermayer K. Glucocorticoid-induced hyperglycemia. Am J Med Sci. 2013;345(4):274–277. doi:10.1097/MAJ.0b013e31828a6a01
10. Gonzalez-Gonzalez JG, Mireles-Zavala LG, Rodriguez-Gutierrez R, et al. Hyperglycemia related to high-dose GC use in noncritically ill patients. Diabetol Metab Syndr. 2013;5:18. doi:10.1186/1758-5996-5-18
11. Lee SY, Kurita N, Yokoyama Y, et al. Glucocorticoid-induced diabetes mellitus in patients with lymphoma treated with CHOP chemotherapy. Support Care Cancer. 2014;22:1385–1390. doi:10.1007/s00520-013-2097-8
12. van Raalte DH, Nofrate V, Bunck MC, et al. Acute and 2-week exposure to prednisolone impair different aspects of beta-cell function in healthy men. Eur J Endocrinol. 2010;162:729–735. doi:10.1530/EJE-09-1034
13. Trence DL. Management of patients on chronic glucocorticoid therapy: an endocrine perspective. Prim Care. 2003;30:593–605. doi:10.1016/S0095-4543(03)00038-1
14. American Diabetes Association 2. Classification and diagnosis of diabetes: standards of medical care in diabetes-2019. Diabetes Care. 2019;42:S13–S28. doi:10.2337/dc19-S002
15. Pichardo-Lowden AR, Fan CY, Gabbay RA. Management of hyperglycemia in the non-intensive care patient: featuring subcutaneous insulin protocols. Endocr Pract. 2011;17(2):249–260. doi:10.4158/EP10220.RA
16. Turina M, Fry DE, Polk HC
17. Umpierrez GE, Isaacs SD, Bazargan N, et al. Hyperglycemia: an independent marker of in-hospital mortality in patients with undiagnosed diabetes. J Clin Endocrinol Metab. 2002;87(3):978–982. doi:10.1210/jcem.87.3.8341
18. Bonaventura A, Montecucco F. Steroid-induced hyperglycemia: an underdiagnosed problem or clinical inertia? A narrative review. Diabetes Res Clin Pract. 2018;139:203–220. doi:10.1016/j.diabres.2018.03.006
 © 2020 The Author(s). This work is published and licensed by Dove Medical Press Limited. The full terms of this license are available at https://www.dovepress.com/terms.php and incorporate the Creative Commons Attribution - Non Commercial (unported, v3.0) License.
By accessing the work you hereby accept the Terms. Non-commercial uses of the work are permitted without any further permission from Dove Medical Press Limited, provided the work is properly attributed. For permission for commercial use of this work, please see paragraphs 4.2 and 5 of our Terms.
© 2020 The Author(s). This work is published and licensed by Dove Medical Press Limited. The full terms of this license are available at https://www.dovepress.com/terms.php and incorporate the Creative Commons Attribution - Non Commercial (unported, v3.0) License.
By accessing the work you hereby accept the Terms. Non-commercial uses of the work are permitted without any further permission from Dove Medical Press Limited, provided the work is properly attributed. For permission for commercial use of this work, please see paragraphs 4.2 and 5 of our Terms.