")
Back to Journals » Pharmacogenomics and Personalized Medicine » Volume 14
Pattern Recognition Molecules of Lectin Complement Pathway in Ischemic Stroke
Authors Tsakanova G , Stepanyan A, Steffensen R, Soghoyan A, Jensenius JC, Arakelyan A
Received 29 June 2021
Accepted for publication 15 September 2021
Published 21 October 2021 Volume 2021:14 Pages 1347—1368
DOI https://doi.org/10.2147/PGPM.S326242
Checked for plagiarism Yes
Review by Single anonymous peer review
Peer reviewer comments 2
Editor who approved publication: Dr Martin H Bluth
Gohar Tsakanova,1,2 Ani Stepanyan,1 Rudi Steffensen,3 Armine Soghoyan,4 Jens Christian Jensenius,5 Arsen Arakelyan1
1Institute of Molecular Biology NAS RA, Yerevan, Armenia; 2CANDLE Synchrotron Research Institute, Yerevan, Armenia; 3Department of Clinical Immunology, Aalborg University Hospital, Aalborg, Denmark; 4“Surb Grigor Lusavorich” Medical Center CJSC, Yerevan, Armenia; 5Department of Biomedicine, Aarhus University, Aarhus, Denmark
Correspondence: Gohar Tsakanova
Institute of Molecular Biology NAS RA, 7 Hasratyan Street, Yerevan, 0014, Armenia
Tel +374 94 123070
Fax +374 10 282061
Email [email protected]
Purpose: The current study aimed to investigate in an Armenian population the levels of pattern recognition molecules (PRMs) of lectin complement pathway (LCP), MBL (mannan-binding lectin) and M-ficolin in plasma in ischemic stroke (IS), and the possible association of 11 single nucleotide polymorphisms (SNPs) in MBL2, FCN1 and FCN2 genes.
Patients and Methods: A total of 122 patients with IS and 150 control subjects were included in this study. Immunofluorometric assays (TRIFMAs) and real-time polymerase chain reactions with TaqMan probes were conducted.
Results: According to the results, the levels of M-ficolin in IS patients are significantly higher than in control subjects, and the MBL2 rs11003125 and rs12780112 SNPs, as well as MBL2 rs12780112*T and FCN1 rs10120023*T minor alleles (MAs) are negatively associated with the risk of IS. Further, MBL2 rs11003125 and rs1800450 SNPs and the carriage of their MAs, as well as FCN1 rs2989727 SNP and the carriage of FCN1 rs10120023*T MA significantly alter plasma MBL and M-ficolin levels in IS patients, respectively. Five common haplotypes in MBL2 gene and three common haplotypes in FCN1 and FCN2 genes were revealed, among which CGTC was negatively associated with IS and decreasing MBL plasma levels in IS.
Conclusion: In conclusion, we suggest that LCP PRMs are associated with the risk of developing IS, and may also participate in pathological events leading to post-ischemic brain damage. This study emphasizes the important contribution of alterations of LCP PRMs on genomic and proteomic levels to the pathomechanisms of ischemic stroke, at least in an Armenian population.
Keywords: human ischemic stroke, humoral pattern recognition molecules, lectin complement pathway, single nucleotide polymorphisms, haplotypes
Introduction
Annually, nearly 6 million people die and another 5 million are left permanently disabled from strokes.1 The global burden of this disease, measured by disability-adjusted life years (DALYs) almost doubled during the last two decades and will reach 61 million DALYs in 2020, accounting for 6.2% of the total burden of illness in 2020.1 In the US alone, the total annual cost of stroke is estimated at $65.5 billion, including both direct and indirect costs. While stroke incidence rates either have decreased or remained the same during the last several years in developing countries,2 an increase has been recorded in low and middle income countries.3,4 In Armenia, stroke is the second leading cause of death after heart disease, accounting for 21.6% of all deaths. Thus, in the Armenian population, the prevalence and incidence of stroke was 19,572 and 5782 in 2019, resulting in rates of 828.4 and 244.7 per 100,000 population.5
One of the key pathological processes underlying tissue damage and hence the severity and outcome of ischemic stroke is the inflammatory response, including activation of the complement system. The activation products of the complement system contribute to the production of inflammatory mediators, and can therefore promote tissue injury at sites of inflammation.6,7
The lectin complement pathway (LCP) is activated in the absence of immune complexes. In humans LCP consists of: (1) five pattern recognition molecules (PRMs): the two C-type lectins, mannan-binding lectin (MBL) and CL-LK (heteromeric complex of native collectin kidney 1 (CL-K1) and collectin liver 1 (CL-L1)), M-ficolin, L-ficolin and H-ficolin; (2) three MASPs (MBL-associated serine proteases): MASP-1, MASP-2 and MASP-3; and (3) two MBL-associated non-enzymatic proteins: MAp19 (MBL-associated protein of 19 kDa) and MAp44 (MBL-associated protein of 44 kDa).8–13
In recent studies LCP was found to be involved in ischemic stroke. Particularly, the results indicated that the activities of MASP-1 and MASP-2 are elevated in the blood of ischemic stroke patients compared with control subjects.11,14 Moreover, we found that the rs3203210 and rs28945073 single nucleotide polymorphisms (SNPs) in the MASP1 gene and the rs147270785 SNP in MASP2 are strongly associated with ischemic stroke.14
Initially, the humoral PMRs were described to react with patterns on the surface of microorganisms and viruses, but later a number of studies indicated that they also react with ischemia-conditioned blood vessels and tissues.15–17 The studies on animal models of ischemia/reperfusion showed that upon restoration of blood supply PRMs become capable of reacting with damaged brain endothelial cells, thereby initiating an inflammation-like reaction, resulting in tissue destruction.18 Consistent with this, previous studies found better recovery of brain functions in ischemic stroke patients with low levels of MBL than in patients with normal MBL levels, and also that knock-out of the two MBL-genes in mice protected against post-ischemic brain damage.18
It has been shown that the alterations in the MBL, M-ficolin and L-ficolin levels are associated with variations found in their genes. Interestingly, for the MBL2 gene, which in total is composed of 7461 nucleotides, 2072 SNPs have been registered in the NCBI database, from which 265 are coding SNPs. However, a large number of studies showed that among all these SNPs only six show strong influence on the levels of MBL in serum (−550 H>L rs11003125, −221 X>Y rs7096206, +4 P>Q rs12780112, 52 A>D rs5030737, 54 A>B rs1800450 and 57 A>C rs1800451).16,19–35 Regarding the FCN1 and FCN2 genes, which are composed of 8379 and 7271 nucleotides, 4645 and 2488 SNPs have been registered in the NCBI database, from which 327 and 394 are coding SNPs (https://www.ncbi.nlm.nih.gov/gene/). Among these SNPs only a few have been found to influence the protein levels, including −542 C>T rs10120023 and −1981 C>T rs2989727 SNPs in FCN1 gene36,37 and −986 A>G rs3124952, −602 G>A rs3124953 and −4 A>G rs17514136 in FCN2 gene.38,39
The aim of the current study was to investigate the levels of two PRMs of the LCP in plasma, MBL and M-ficolin, in ischemic stroke, as well as the possible association of this pathology in an Armenian population with 11 genetic polymorphisms, i.e. (1) the six genes encoding MBL: MBL2 (−550 H>L rs11003125, −221 X>Y rs7096206, +4 P>Q rs12780112, 52 A>D rs5030737, 54 A>B rs1800450 and 57 A>C rs1800451); (2) two encoding M-ficolin: FCN1 (−542 C>T rs10120023 and −1981 C>T rs2989727) and (3) three encoding L-ficolin: FCN2 (−986 A>G rs3124952, −602 G>A rs3124953 and −4 A>G rs17514136).
Materials and Methods
Study Population
A total of 122 patients with first-episode ischemic stroke (mean age ± SD: 70.6 ± 10.4 years, females/males: 61/69) and 150 control subjects (CS; mean age ± SD: 68.7 ± 10.0 years, females/ males: 77/73) were enrolled in this study. All subjects were unrelated Caucasians of Armenian ancestry. Patients were recruited among those whose stroke occurred within the prior 12 hours, and were consecutively admitted to the Emergency Departments of Medical Centers of the Ministry of Health of the Republic of Armenia.
Diagnosis of ischemic stroke was based on neurological examination and clinical history confirmed by computer tomography imaging of the brain and standard laboratory analyses. The TOAST definitions were used to assess the stroke subtype.40 National Institutes of Health Stroke Scale (NIHSS) was applied to define the severity of neurological deficit. The exclusion criteria for patients’ group were tumor, brain trauma or cerebral hemorrhage, as well as lacunar stroke syndromes, and the inclusion criteria were cardioembolic stroke (n = 22) and large vessel atherothromboembolic stroke (n = 100), with moderate to severe impairment (NIHSS score between 15–19).
Control subjects were blood donors of the Blood Bank of Haematology Center after Prof. R. Yeolyan. The inclusion criteria for control subjects’ group were no personal or family history of myocardial infarction, ischemic stroke and/or any other cerebrovascular or cardiovascular diseases. All subjects or their legal representatives gave their informed consent to participate in the study. The study was approved by the Ethical Committee of the Institute of Molecular Biology NAS RA (IRB #00004079).
Blood Collection and Extraction of Plasma and DNA Samples
Morning fasting blood samples were collected by venipuncture in EDTA-containing tubes and kept on ice for 60 min. Next, they were centrifuged at 3000 g for 15 min at 4°C. The obtained plasma samples were stored in aliquots at −30°C until further use. To remove any precipitate, the plasma samples were thawed and centrifuged at 10,000 rpm for 5 min at 4°C immediately prior to use.
Genomic DNA was isolated from blood samples according to a standard phenol-chloroform method41 and stored at −30°C until further use.
Assessment of MBL and M-Ficolin Levels in Plasma
The levels of MBL and M-ficolin were determined by in-house time-resolved immunofluorometric assay (TRIFMA) where MBL and M-ficolin bound onto the antibody-coated surface of the wells were detected with biotinylated second antibody and europium-labelled streptavidin instead of enzyme-labeled antibody as used in conventional sandwich immune assays.42,43 In brief: for assessment of MBL levels microtiter wells were coated with 1 μg mannan in 100 μL bicarbonate, pH 9.6. The residual binding sites were blocked with human serum albumin and washed with TBS/Tween/CaCl2 buffer before incubating overnight at 4°C with 100 μL plasma samples (diluted four-fold in Tris buffer containing 1 M NaCl and 5 mM CaCl2). After washing with CaCl2-containing buffer the wells were incubated with 1 ng biotinylated anti-MBL antibody and next with 100 μL Eu-labeled-streptavidin (Perkin Elmer 1244–360; freshly diluted 1/1000 in Tris/TBS buffer with 25 μM EDTA). After washing with TBS/Tween/CaCl2 200 μL of Enhancement buffer (Perkin Elmer) was added. After 5 min on a plate shaker the fluorescence was read by time-resolved fluorometry (DELFIA-reader, Perkin Elmer). For internal control, standard plasma (3.6 μg MBL/mL) as well as three plasma samples of high, medium and low MBL concentrations were analyzed on every microtiter plate.42
The assessment of plasma M-ficolin levels was performed in the same way but using coating with mouse anti-human M-ficolin (clone 7G1) in 100 μL PBS, with TBS/Tween for all washing steps. Secondary antibody was 25 ng biotinylated 7G1 anti-M-ficolin.
Genotyping Analysis
The patients with ischemic stroke and the control subjects were genotyped for 11 SNPs: 6 SNPs within the MBL2 gene (−550 H>L rs11003125, −221 X>Y rs7096206, +4 P>Q rs12780112, 52 A>D rs5030737, 54 A>B rs1800450 and 57 A>C rs1800451), 2 SNPs in FCN1 gene (−542 C>T rs10120023 and −1981 C>T rs2989727), and 3 SNPs in FCN2 gene (−986 A>G rs3124952, −602 G>A rs3124953 and −4 A>G rs17514136). The genotyping was performed by real-time polymerase chain reaction (RT-PCR) using TaqMan genotyping system, minor-groove-binder (MGB) TaqMan probes from Applied Biosystems (ABI, Foster City, CA, USA) and Sequence Detection System (SDS) software (version 2.3) for the detection of end-point fluorescence.44–46 A non-template control (NTC) was introduced within each set of assays. The selection of SNPs (Table 1) was based on the previously described functional effect on the levels of studied molecules in the general population.16,19,20,36,47 Among the selected SNPs, 7 are in regulatory regions 5ʹ near gene. The primers were commercially labeled with 6-carboxy-fluorescein (FAM) or VIC fluorescent dyes. The sequences of the primers and probes used in the genotyping analysis are presented in Table 2.
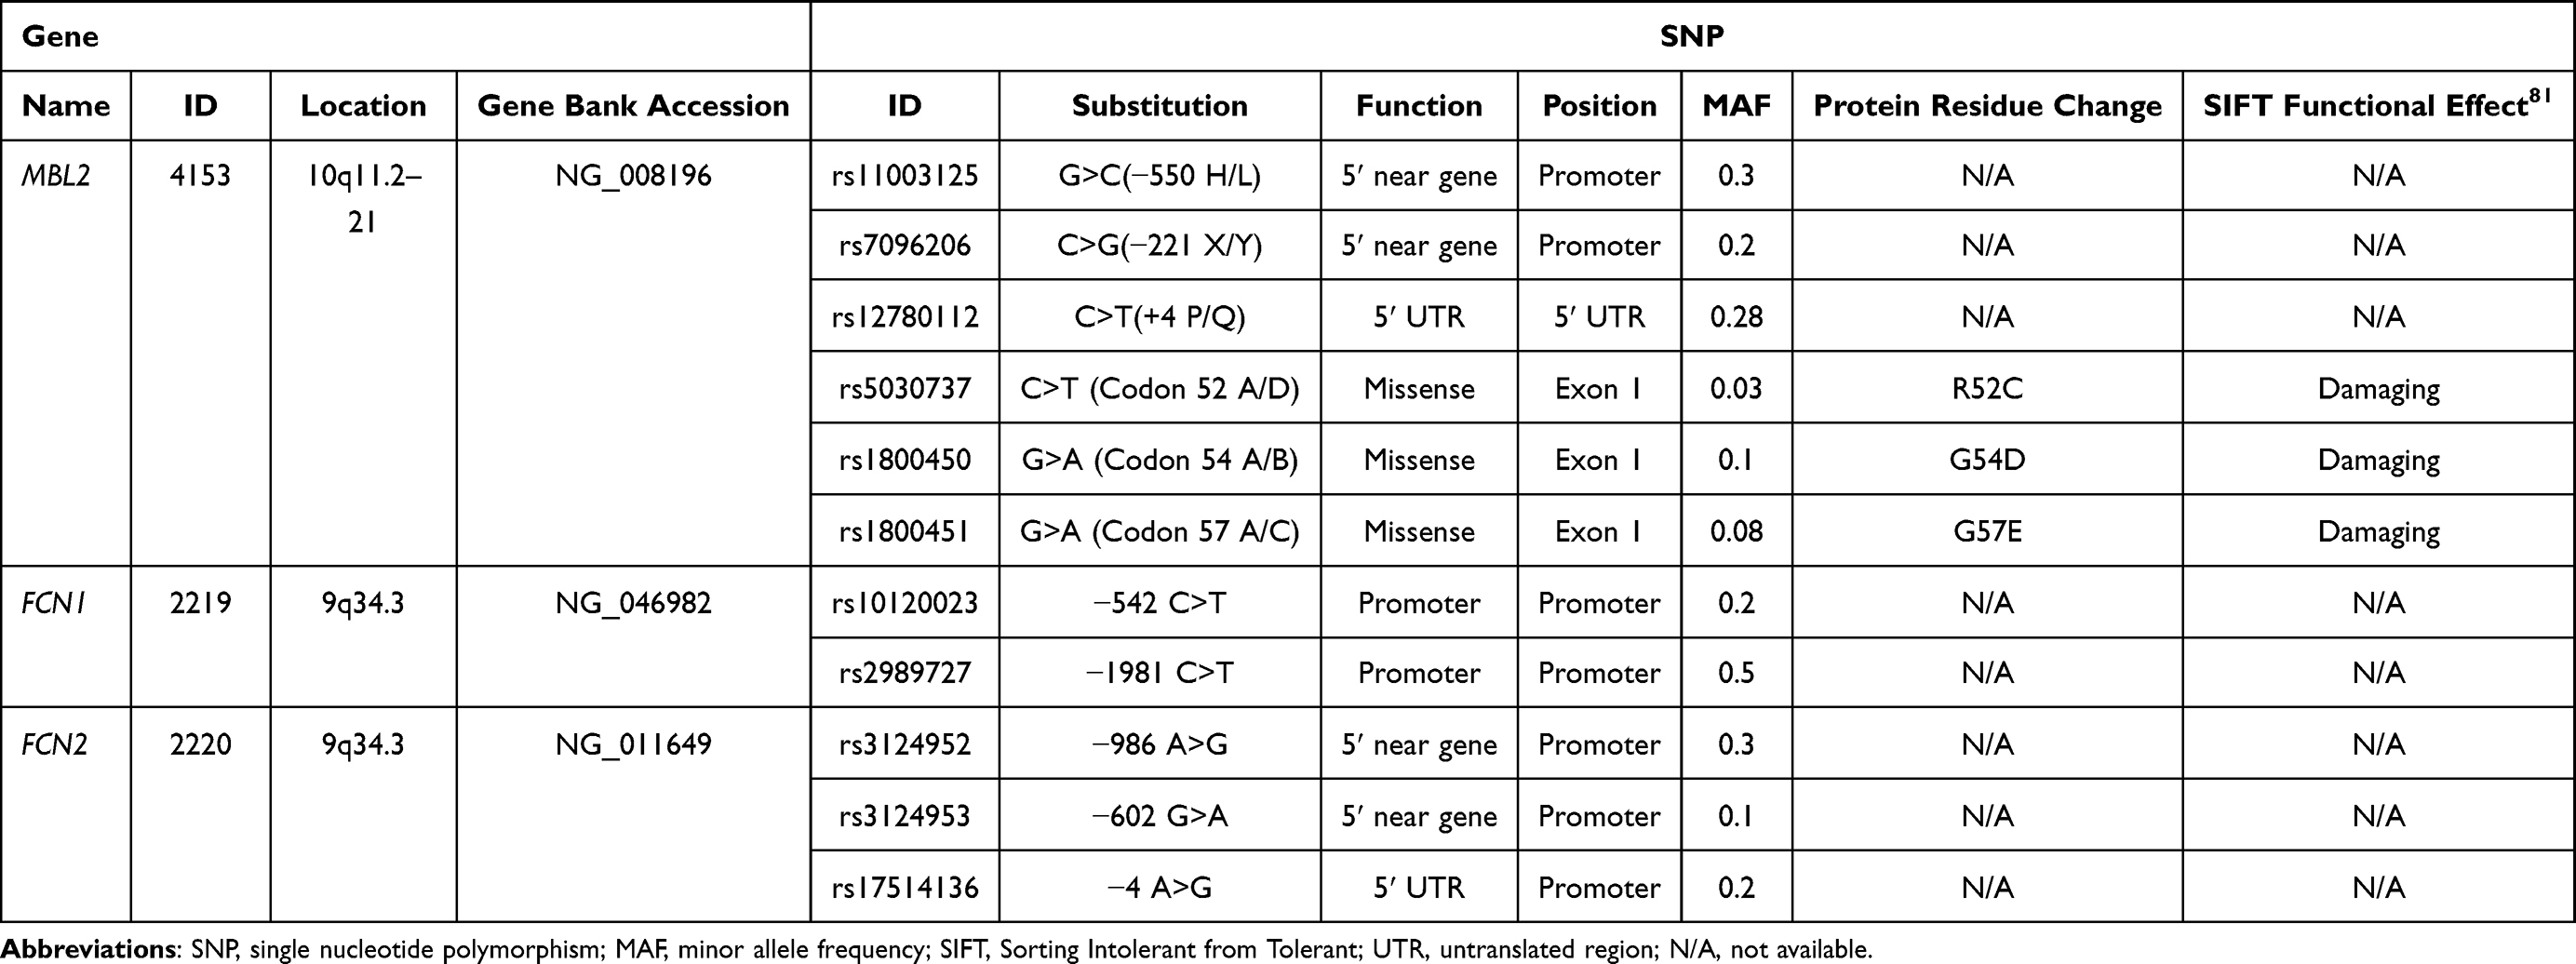 |
Table 1 Detailed Characteristics of Selected Genes and SNPs |
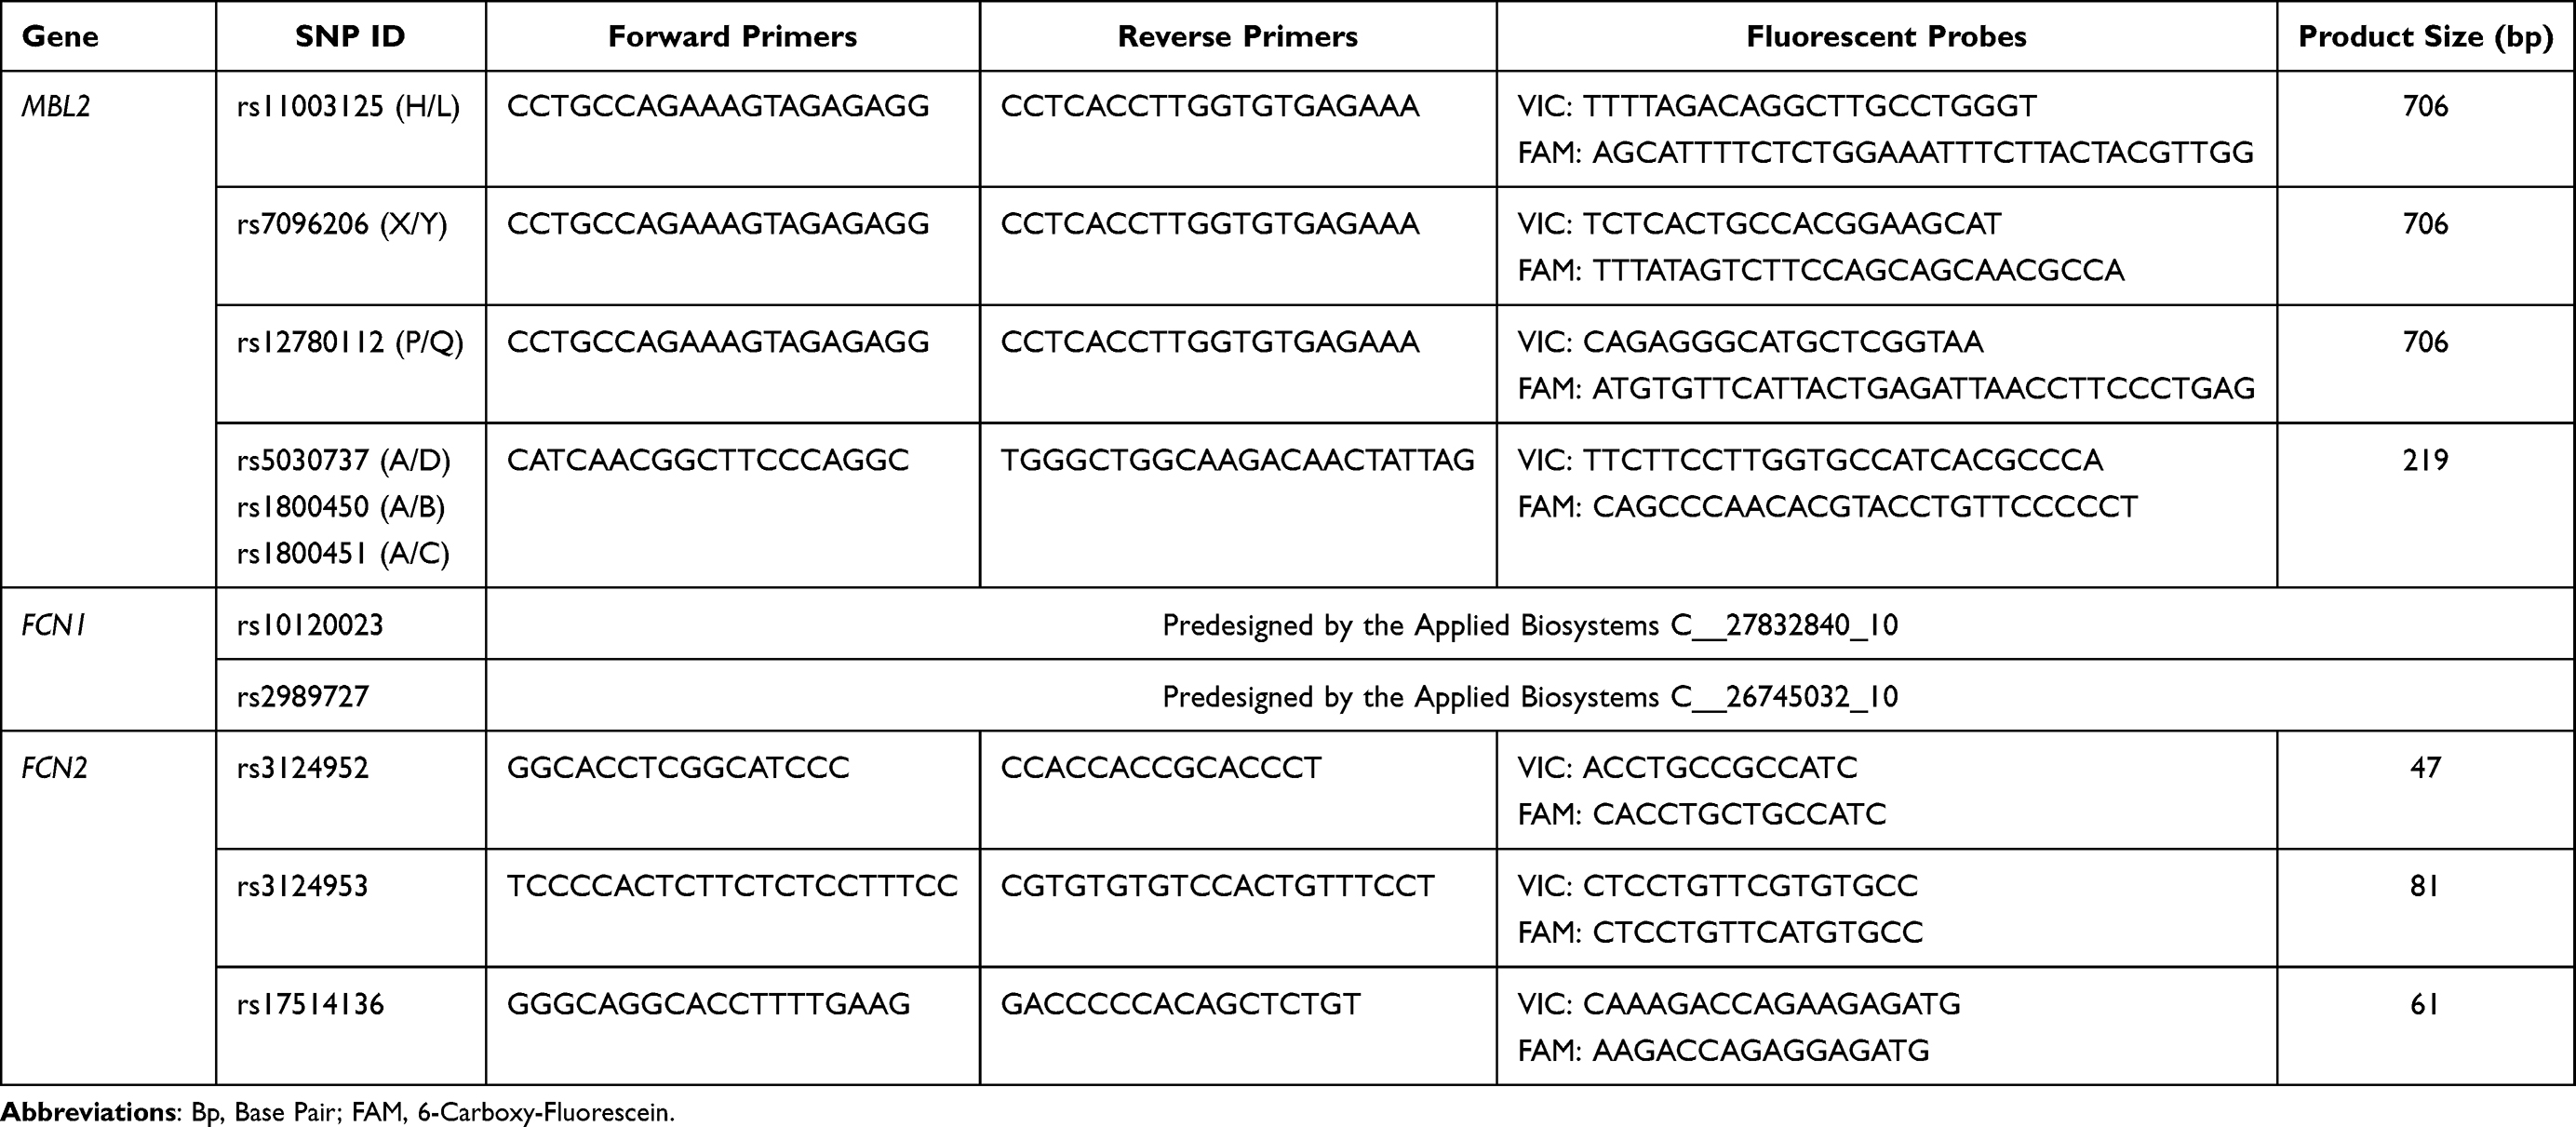 |
Table 2 Primers and Probes Sequences Used for Genotyping of Selected SNPs in MBL2, FCN1 and FCN2 Genes (5´→3´) |
For PCR reactions a GeneAmp 9700 thermal cycler (ABI, Foster City, CA, USA) was used. The PCR reaction mixes contained 20 ng DNA, 900 nM primers, and 200 nM probes, as well as TaqMan Universal PCR Master Mix (Applied Biosystems, Foster City, CA, USA) in a final volume of 5 μL in 384-well plates. The PCR profiling included 2 minat 50 °C, 10 min at 95 °C, followed by 40 cycles of 15 s at 95 °C and 1 min at an annealing temperature of 60 °C. The endpoint reading of the fluorescence generated during PCR amplification was carried out on the real-time PCR instrument ABI Prism 7900 (Applied Biosystems). Genotype assignments were obtained with the SDS software mentioned above.
The distribution of the genotypes for the selected SNPs was checked for correspondence to Hardy–Weinberg equilibrium (HWE) using the Pearson χ2 test. To reveal the potential association of the studied SNPs with ischemic stroke, genotype, phenotype and minor allele frequencies (MAFs), as well as carriage rates in patients and control subjects were compared. The significance of differences between study groups in multiplicative, dominant and recessive models was determined using the Fisher’s exact test. With regard to the additive model, the differences in genotype distribution of the polymorphisms between case and control subjects were tested by logistic regression. The odds ratio (OR), 95% confidence interval (CI), and P values were calculated. The Mann–Whitney U (quantitative variables) and Fisher’s exact tests (nominal and ordinal variables) were used to evaluate the possible differences of the clinical characteristics between minor allele carrier and non-carriers in the group of ischemic stroke patients. The data are presented as box plots indicating 25th–75th percentiles, median and minimum and maximum values. Linkage disequilibrium (LD) analysis and haplotype-based case–control study were carried out using SNPAnalyser 2.0 software48 and the expectation maximization algorithm. LD blocks were defined according to the haplotype block definition of Gabriel, which defines pairs to be in strong LD if the one-sided upper 95% confidence bound on D′ is >0.98 and the lower bound is above 0.7.49 P values less than 0.05 were considered statistically significant.
Statistical Analysis
Statistical analysis was performed using SPSS software package version 16.0 (SPSS Inc., Chicago, IL, USA). The comparisons of the levels of MBL and M-ficolin in plasma between the groups, as well as between the different genotypes of the studied SNPs in MBL2 and FCN1 genes within the groups were performed using nonparametric Mann–Whitney U and Kruskal–Wallis H-tests, respectively. Data are represented as mean ± SD.
Results
The Levels of MBL and M-Ficolin in Plasma of Patients and Controls
MBL and M-ficolin levels in blood of patients with stroke and control subjects were estimated. The results obtained for MBL (Figure 1A) showed no significant differences between the levels in ischemic stroke patients (mean ± SD: 2.10 ± 1.88 μg/mL) and control subjects (mean ± SD: 2.03 ± 1.78 μg/mL). In contrast, the levels of M-ficolin (Figure 1B) were 1.4 times higher in the ischemic stroke patients (mean ± SD: 2.60 ± 1.15 μg/mL) compared with control subjects (mean ± SD: 1.88 ± 0.63 μg/mL).
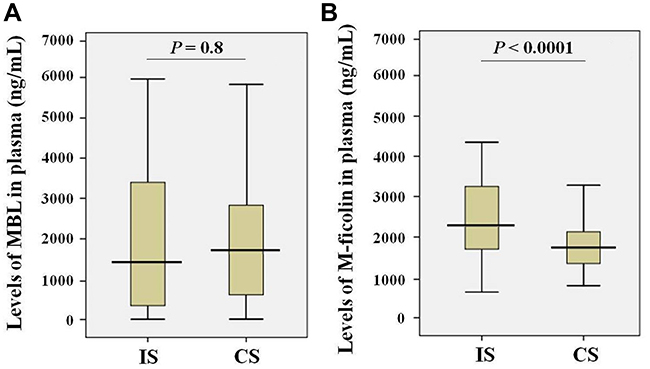 |
Figure 1 Levels of MBL (A) and M-ficolin (B) in the plasma of ischemic stroke patients (IS; n = 122) and control subjects (CS; n = 150). |
Genotyping of MBL2, FCN1 and FCN2 Genes in the Two Cohorts
The assessment of Hardy–Weinberg equilibrium of the studied 11 SNPs showed that in both the ischemic stroke patients and in the control subjects the genotype distribution of the 7 SNPs (FCN1 gene rs2989727, FCN2 gene rs3124952, rs3124953 and rs17514136, as well as MBL2 gene rs7096206 (X/Y), rs5030737 (A/D) and rs1800450 (A/B)) were concordant with the Hardy-Weinberg equilibrium (P>0.05). In contrast, the genotype distributions of 4 SNPs (FCN1 gene rs10120023 and MBL2 gene rs12780112 (P/Q)) in the group of ischemic stroke patients, and FCN1 gene rs10120023, MBL2 gene rs11003125 (H/L) and rs1800451 (A/C) in the group of control subjects do not comply with the Hardy–Weinberg equilibrium (P<0.05) (Supplementary Table 1).
According to the genotyping data for the rs11003125 (H/L) SNP in MBL2 there were statistically significant differences in the frequencies of the GG, GC and CC genotypes between ischemic stroke patients and control subjects (Table 3). In addition, the frequency of its C minor allele was 1.7 times lower in ischemic stroke patients in comparison with control subjects, when considering the multiplicative model. Further, the additive model of the effect of the rs12780112 (P/Q) SNP showed that there were statistically significant differences in the frequencies of CC, CT and TT genotypes between patients and control subjects (Table 3).
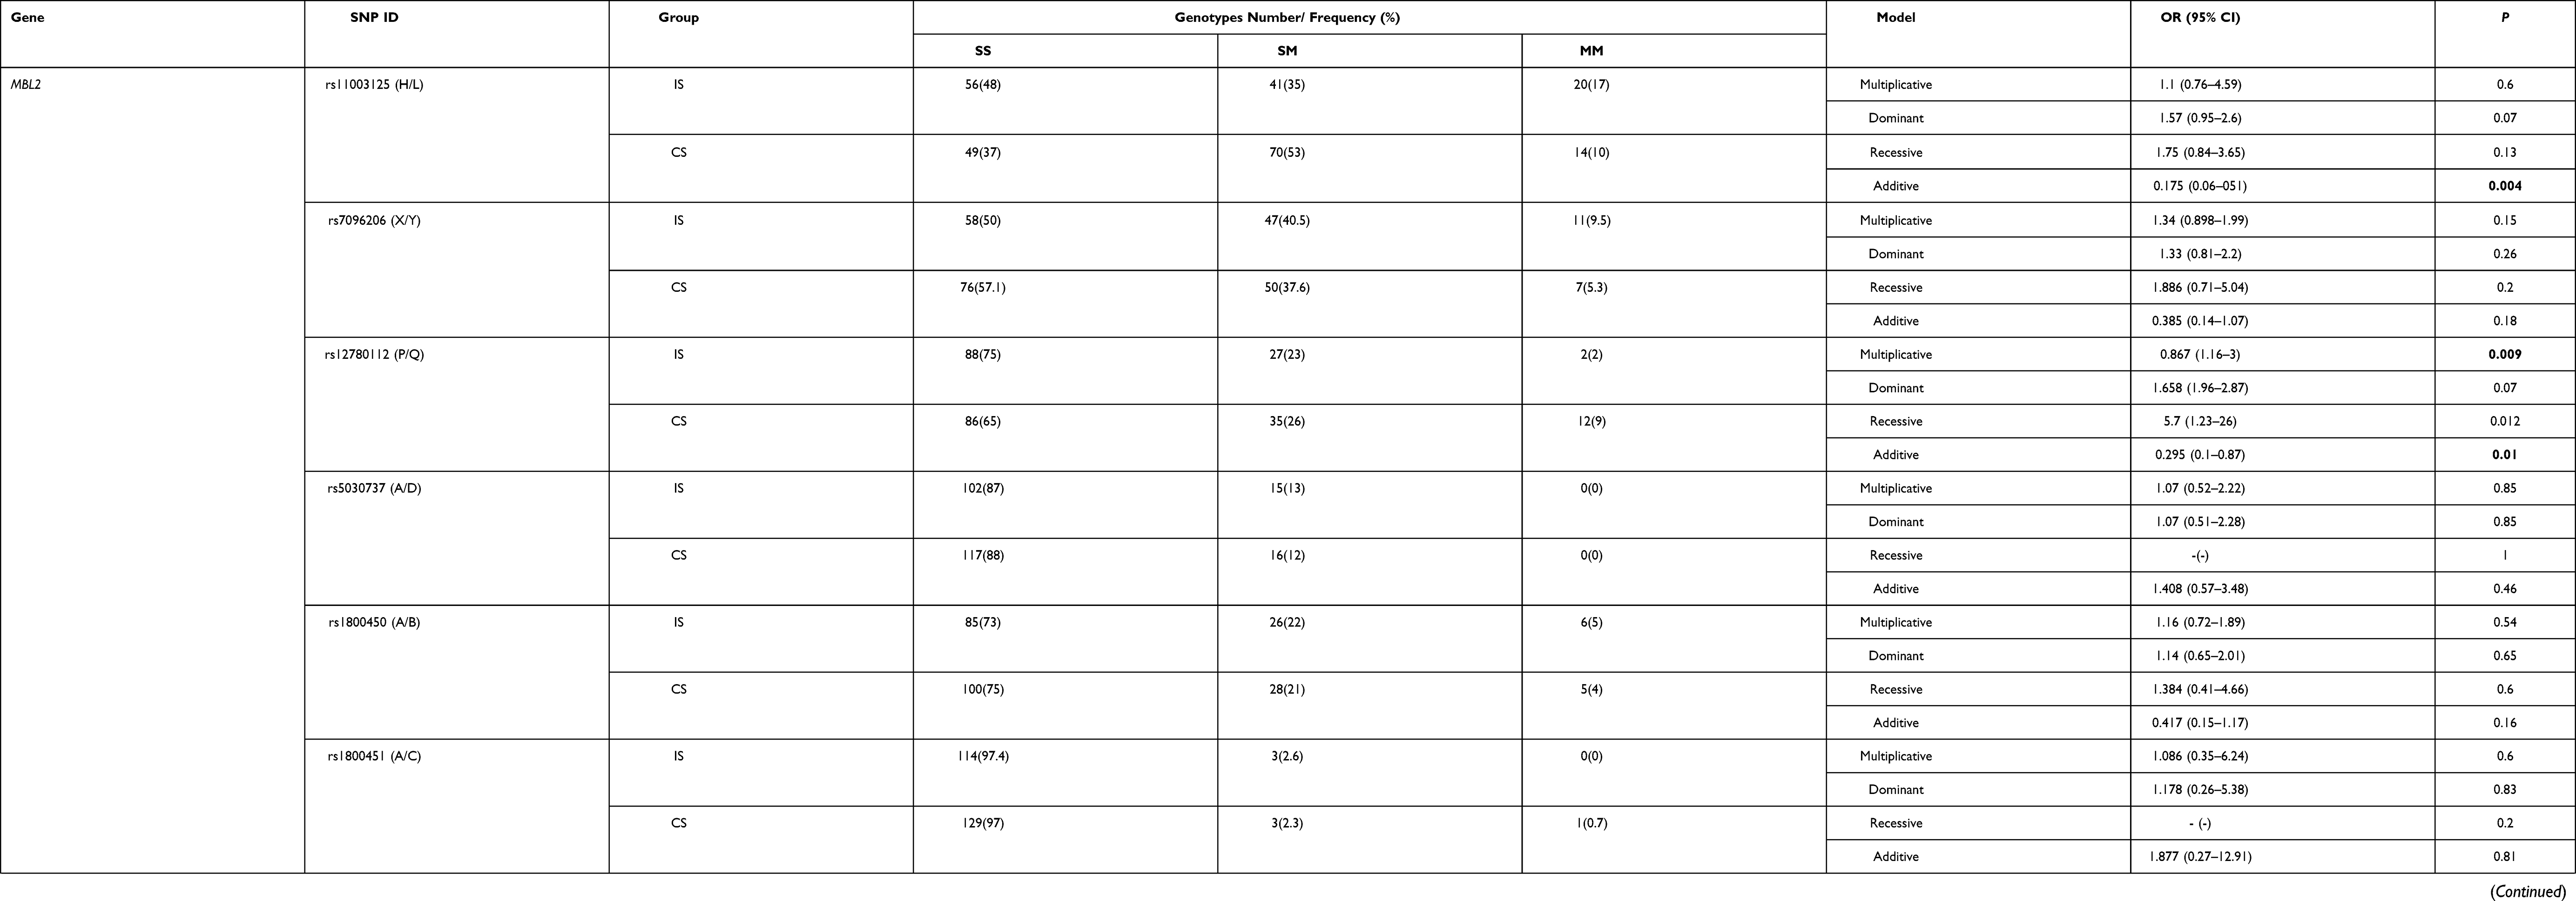 |
Table 3 The Association of the 11 SNPs in the FCN1, FCN2 and MBL2 Genes with Ischemic Stroke Under Additive, Dominant, Recessive and Multiplicative Models of the SNP Effect |
An association of FCN1 rs10120023 with ischemic stroke under the recessive model was also observed (Table 3). The TT genotype frequency in control subjects was significantly (2.33 times) increased compared with ischemic stroke patients (Table 3).
No association with the risk of ischemic stroke was observed with regard to the remaining SNPs (rs1800450 (A/B), rs1800451 (A/C), rs5030737 (A/D) and rs7096206 (X/Y) in MBL2 gene; rs2989727 in FCN1 gene; rs3124952, rs3124953 and rs17514136 in FCN2 gene).
Association Between SNPs in MBL2 and FCN1 Genes with Levels of MBL and M-Ficolin in Plasma
Kruskal–Wallis H-test was applied to assess the possible association between the genotypes of the SNPs in MBL2 and FCN1 genes and the plasma levels of MBL and M-ficolin (Figures 2 and 3).
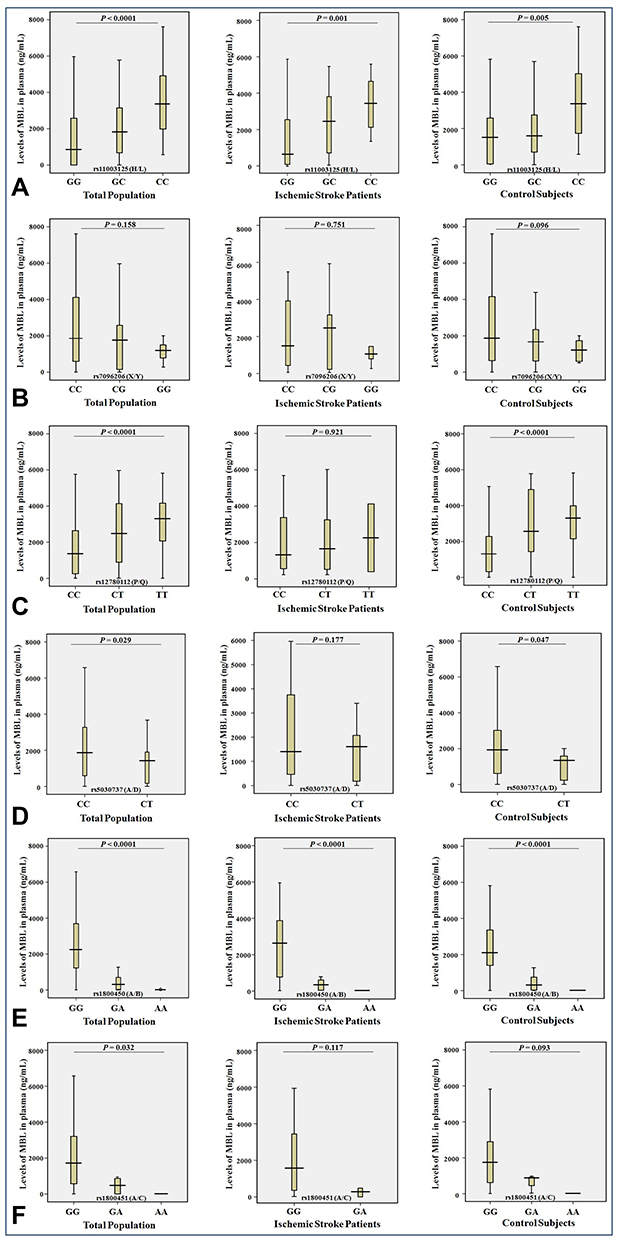 |
Figure 2 Levels (ng/mL) of MBL in plasma and the genotypes of rs11003125 H/L (A), rs7096206 X/Y (B), rs12780112 P/Q (C), rs5030737 A/D (D), rs1800450 A/B (E) and rs1800451 A/C (F) SNPs in the MBL2 gene in the entire study population (n = 272), ischemic stroke patients (n = 122) and control subjects (n = 150). |
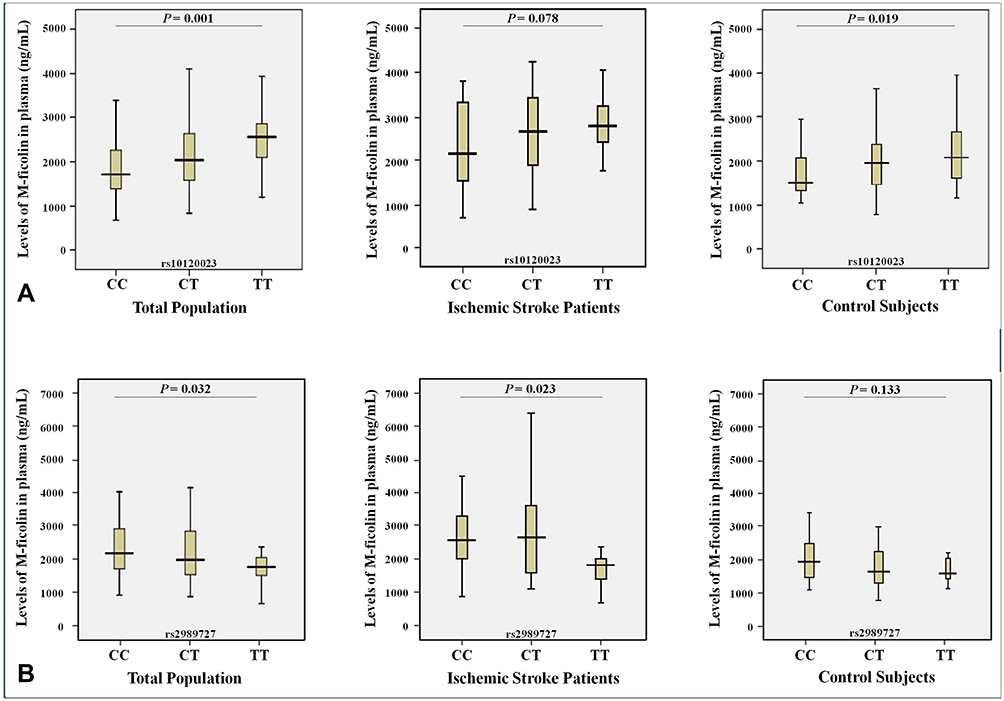 |
Figure 3 Levels (ng/mL) of M-ficolin in plasma and the genotypes of rs10120023 (A) and rs2989727 (B) SNPs in the FCN1 gene in entire study population (n = 272), ischemic stroke patients (n = 122) and control subjects (n = 150). |
Statistically significant associations of the plasma levels of MBL were found (1) in ischemic stroke patients with SNPs of the MBL2 gene (rs11003125 (H/L, P = 0.001) and rs1800450 (A/B, P <0.0001; (2) in control subjects with SNPs of the rs11003125 (H/L, P = 0.005), rs12780112 (P/Q, P <0.0001), rs5030737 (A/D, P = 0.047) and rs1800450 (A/B, P <0.0001); (3) in the whole sample between SNPs of the rs11003125 (H/L, P <0.0001), rs12780112 (P/Q, P <0.0001), rs5030737 (A/D, P = 0.029), rs1800450 (A/B, P <0.0001) and rs1800451 (A/C, P = 0.032) (Figure 2). Moreover, all these SNPs had diverse effects on the MBL plasma levels. Thus, the minor alleles of the rs11003125 (H/L) and rs12780112 (P/Q) SNPs were associated with the allelic dose-response increase of the MBL plasma levels (Figure 2A and C), and the minor alleles of the rs5030737 (A/D), rs1800450 (A/B) and rs1800451 (A/C) SNPs were associated with the allelic dose-response decrease of the MBL plasma levels (Figure 2D–F).
Regarding M-ficolin, statistically significant associations with its plasma levels were observed between the genotype of the rs2989727 SNP (P = 0.023) of the FCN1 gene in ischemic stroke patients, between the genotype of the rs10120023 SNP (P = 0.019) in control subjects, as well as between the SNPs of rs10120023 and rs2989727 (P = 0.001 and P = 0.032, respectively) in the entire study population (Figure 3). Thus, the minor allele of the rs10120023 SNP was associated with the allelic dose-response increase of the M-ficolin plasma levels (Figure 3A), and the minor allele of the rs2989727 SNP is associated with the allelic dose-response decrease of the M-ficolin plasma levels (Figure 3B).
The study of the possible association of the minor allele carriage rates of the rs11003125 (H/L), rs7096206 (X/Y), rs12780112 (P/Q), rs5030737 (A/D), rs1800450 (A/B) and rs1800451 (A/C) SNPs in the MBL2 gene and the levels of MBL in plasma in the entire study population, in ischemic stroke patients and in control subjects showed that the carriage of the minor C allele of the rs11003125 (H/L) SNP was associated with the significant increase in the MBL plasma levels (Figure 4A) in the entire study population (P<0.0001), in ischemic stroke patients (P = 0.001) and in control subjects (P = 0.022). The carriage of the minor G allele of the rs7096206 (X/Y) SNP was associated with the significant decrease in the MBL plasma levels (Figure 4B) in control subjects (P = 0.038). The carriage of the minor T allele of the rs12780112 (P/Q) SNP was associated with the significant increase in the MBL plasma levels (Figure 4C) in the entire population (P <0.0001) and control subjects (P <0.0001). The carriage of the minor T allele of the rs5030737 (A/D) SNP was associated with the significant decrease in the MBL plasma levels (Figure 4D) in the entire population (P <0.0001) and in control subjects (P <0.0001). The carriage of the minor A allele of the rs1800450 (A/B) SNP is associated with the significant decrease in the MBL plasma levels (Figure 4E) in all studied groups (P <0.0001). And the carriage of the minor A allele of the rs1800451 (A/C) SNP is associated with the significant decrease in the MBL plasma levels (Figure 4F) in the entire population (P = 0.01) and control subjects (P = 0.039). Although no statistically significant associations were found for carriage of the minor alleles of these SNPs for other groups, the profiles of their effect on the MBL plasma levels remain the same in all cases, except the reverse effect of the minor T allele of the rs5030737 (A/D) in ischemic stroke patients (Figure 4D).
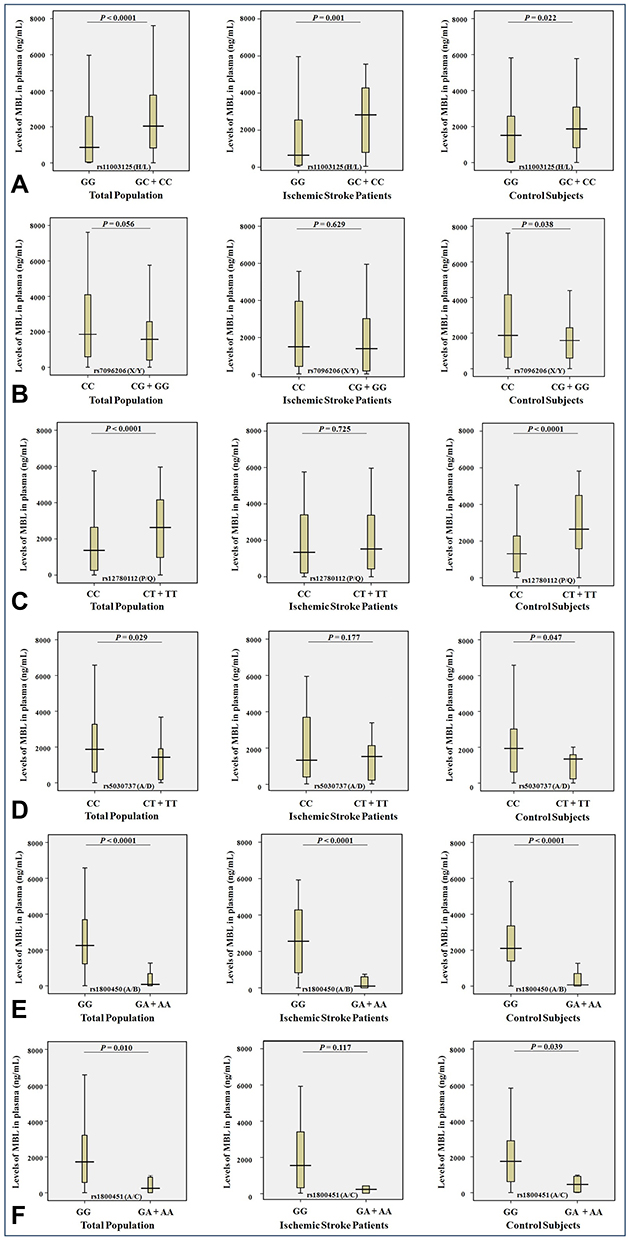 |
Figure 4 Levels (ng/mL) of MBL in plasma and the minor allele carriage rates of the rs11003125 H/L (A), rs7096206 X/Y (B), rs12780112 P/Q (C), rs5030737 A/D (D), rs1800450 A/B (E) and rs1800451 A/C (F) SNPs in the MBL2 gene in the entire study population (n = 272), ischemic stroke patients (n = 122) and control subjects (n = 150). |
The study of the possible association of the minor allele carriage rates of the rs10120023 and rs2989727 in the FCN1 gene and the plasma levels of M-ficolin in the entire study population, ischemic stroke patients and control subjects showed that the carriage of the minor T allele of the rs10120023 is associated with the significant increase in the M-ficolin plasma levels (Figure 5A) in the entire study population (P = 0.002) and in the ischemic stroke patients (P = 0.04), and the carriage of the minor T allele of the rs2989727 is associated with the significant decrease in the M-ficolin plasma levels (Figure 5B) in the entire study population (P = 0.036) and in control subjects (P = 0.045). As in case of MBL2, although no statistically significant associations were found for carriage of the minor alleles of these SNPs for other groups, the profiles of their effect on the M-ficolin plasma levels remain the same in all cases (Figure 5).
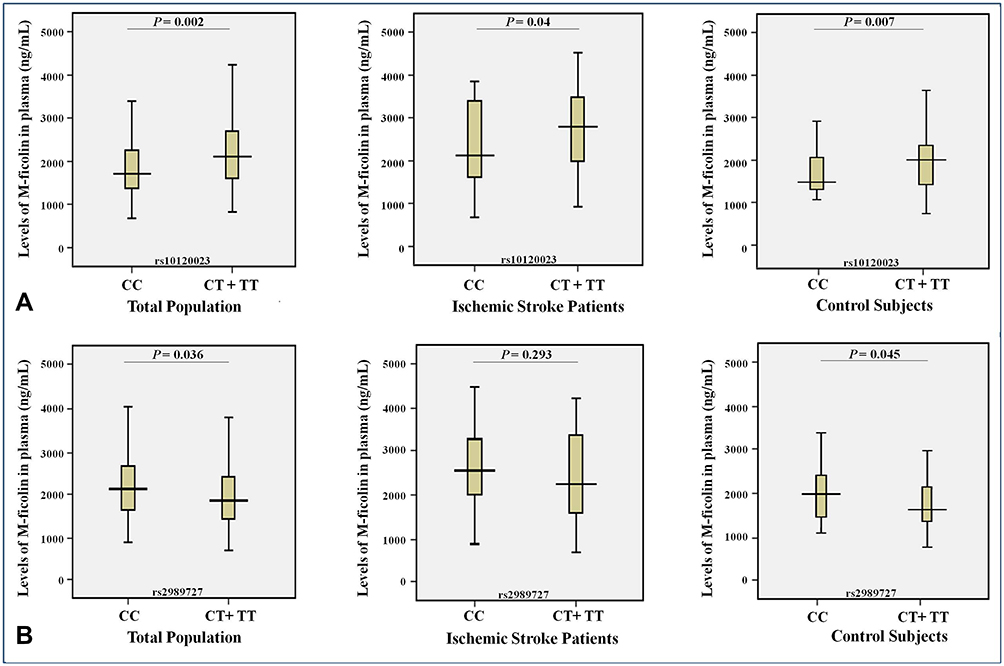 |
Figure 5 Levels (ng/mL) of M-ficolin in plasma and the minor allele carriage rates of the rs10120023 (A) and rs2989727 (B) SNPs in the FCN1 gene in the entire study population (n = 272), ischemic stroke patients (n = 122) and control subjects (n = 150). |
LD Analysis Between Studied SNPs
The patterns of LD among the selected SNPs in MBL2 gene estimated using pairwise measures of ID’I and r2 are shown in Supplementary Table 2 and Figure 6A. According to the results obtained a strong linkage was revealed between 4 SNPs of MBL2 gene, rs11003125 (H/L), rs7096206 (X/Y), rs12780112 (P/Q) and rs5030737 (A/D). Thus, the LD plots in Figure 6A indicate a common one-block structure in each group, ischemic stroke patients (IS) and control subjects (CS), by D’ for MBL2.
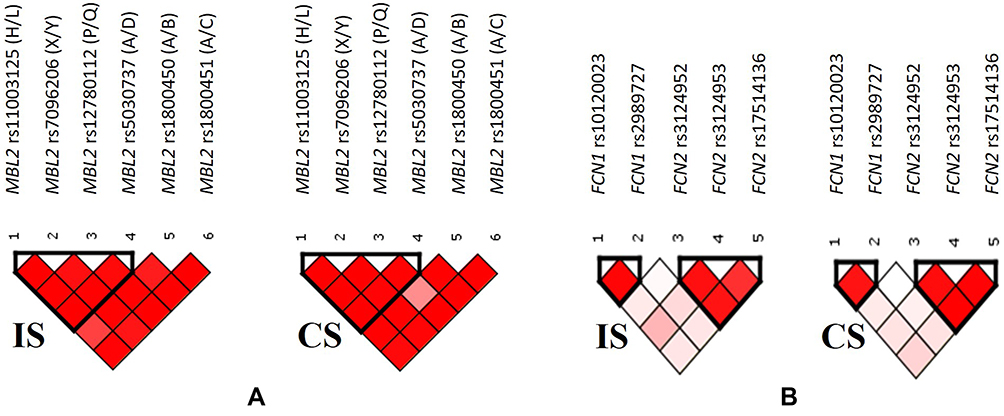 |
Figure 6 Relative position of SNPs and linkage disequilibrium map for the selected SNPs of MBL2 gene (A), as well as FCN1 and FCN2 genes (B) in ischemic stroke patients (IS) and control subjects (CS). |
The patterns of LD among the selected SNPs in FCN1 and FCN2 genes are shown in Supplementary Table 3 and Figure 6B, indicating the presence of two blocks both in patients and control subjects. One LD block is formed by the two SNPs in FCN1 gene, rs10120023 and rs2989727, and the other is formed by 3 SNPs in FCN2 gene, rs3124952, rs3124953, rs17514136 SNPs spanning, respectively.
Haplotype Analysis of SNPs in MBL2, FCN1 and FCN2 Genes with Ischemic Stroke
The haplotype analysis of the studied SNPs in MBL2 gene revealed five common haplotypes, which include rs11003125 (H/L), rs7096206 (X/Y), rs12780112 (P/Q) and rs5030737 (A/D) SNPs. The CGTC (HYPD) haplotype was negatively associated with ischemic stroke (P = 0.07, Table 4A).
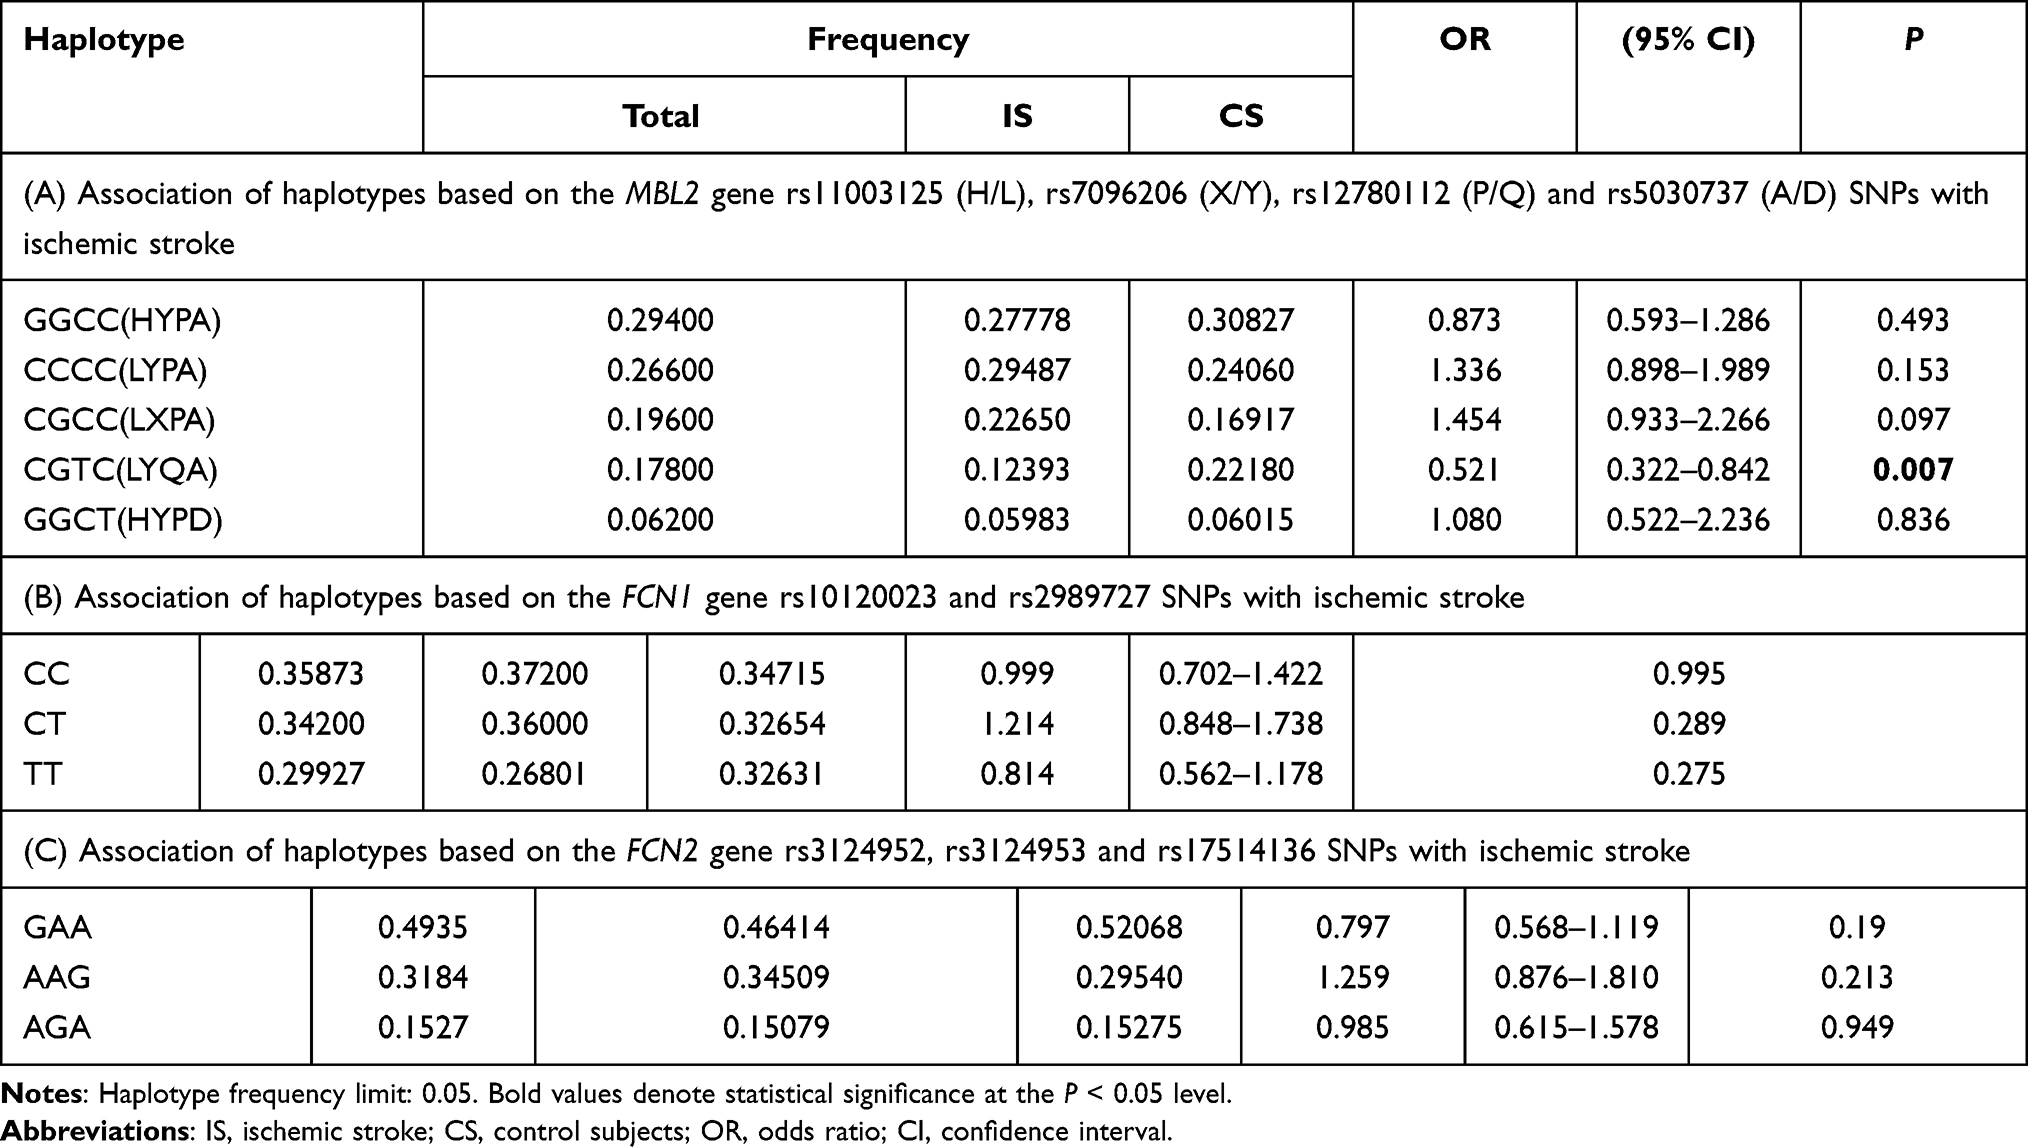 |
Table 4 Association of Haplotypes Based on (A) the MBL2 Gene rs11003125 (H/L), rs7096206 (X/Y), rs12780112 (P/Q) and rs5030737 (A/D) SNPs, (B) the FCN1 Gene rs10120023 and rs2989727 SNPs, and (C) the FCN2 Gene rs3124952, rs3124953 and rs17514136 SNPs with Ischemic Stroke |
The haplotype analysis of the studied SNPs in FCN1 and FCN2 genes revealed three common haplotypes with a frequency of >5% in FCN1 gene (Table 4B), and three haplotypes for SNPs in FCN2 gene (Table 4C). However, none of these defined haplotypes showed association with ischemic stroke.
Association of Revealed Haplotypes in MBL2 and FCN1 Genes with the Levels of MBL and M-Ficolin in Plasma in Ischemic Stroke Patients and Control Subjects
We analyzed the relation between observed GGCC (HYPA), CCCC (LYPA), CGCC (LXPA), CGTC (LYQA) and GGCT (HYPD) haplotypes between the rs11003125 (H/L), rs7096206 (X/Y), rs12780112 (P/Q) and rs5030737 (A/D) SNPs in MBL2 gene with MBL plasma levels in studied groups. The results show that carriers of CGTC (LYQA) haplotype in ischemic stroke group had significantly decreased MBL plasma levels compared with control carriers (Figure 7A), while the opposite trend was observed when comparing non-carriers (Figure 7B). Interestingly, in control subjects the carriage of this haplotype was associated with increased MBL plasma levels (Figure 7D), while no difference between carriers and non-carriers was observed within the ischemic stroke group (Figure 7C). No association of MBL plasma levels with other haplotypes were noted in both study groups (data are not presented).
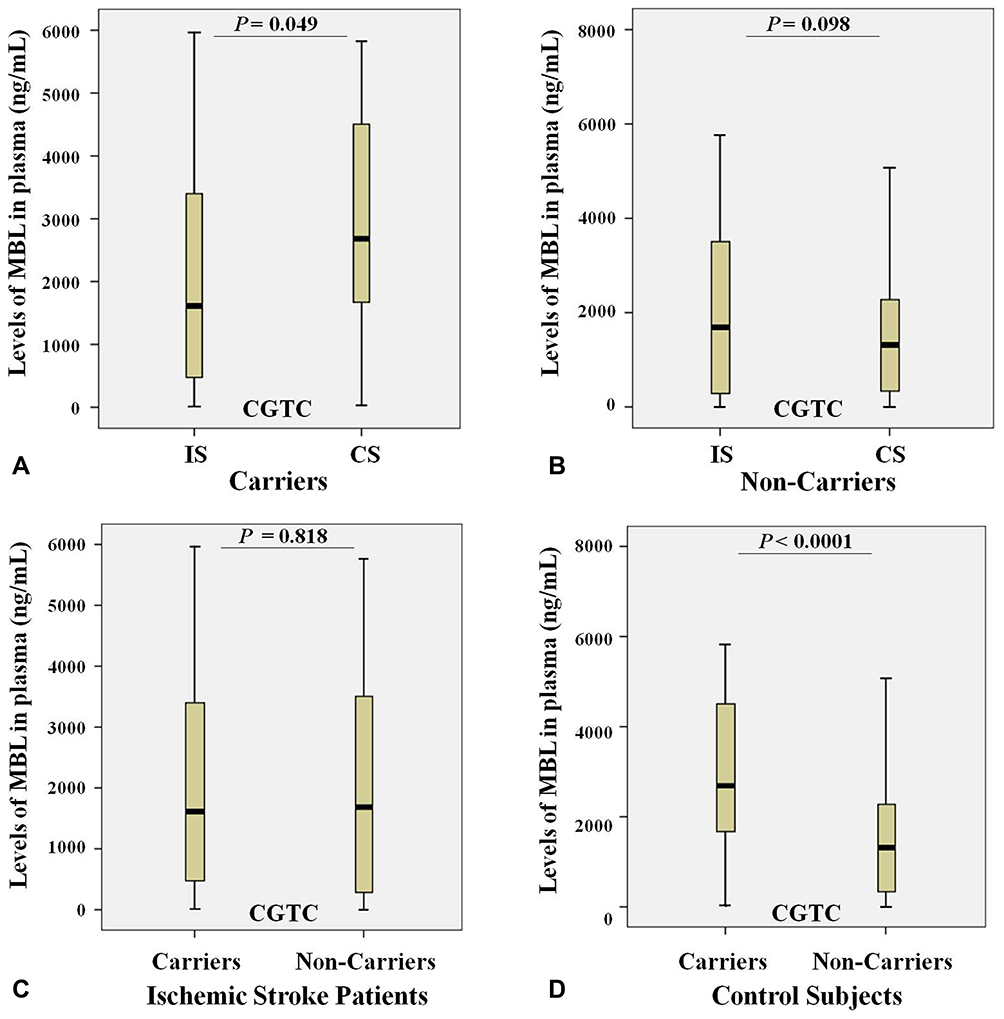 |
Figure 7 Levels of MBL (ng/mL) in plasma and the carriage rates of the CGTC (LYQA) haplotype in the MBL2 gene in ischemic stroke patients (n = 122) and control subjects (n = 150). (A) Levels of MBL in plasma of ischemic stroke patients (IS) and control subjects (CS) with the CGTC (LYQA) haplotype; (B) Levels of MBL in plasma of ischemic stroke patients (IS) and control subjects (CS) without the CGTC (LYQA) haplotype; (C) Levels of MBL in plasma of ischemic stroke patients (IS) both with and without the CGTC (LYQA) haplotype; (D) Levels of MBL in plasma of control subjects (CS) both with and without the CGTC (LYQA) haplotype. |
Discussion
The present study aimed at assessment of plasma levels changes of the LCP PRMs, MBL and M-ficolin in ischemic stroke, evaluation of possible association of the functional SNPs in the MBL2, FCN1 and FCN2 genes with the disease, as well as examining the effects of these SNPs on the corresponding protein levels in Armenians.
We observed a tendency of increase in the MBL plasma levels in ischemic stroke, but this difference was not statistically significant, which is in line with results reported by Zangari et al. on the delayed elevation of MBL levels at 3–5 days and one month after stroke onset.50 Similar observations on delayed MBL increase at 24–72 hours of admission were reported by Wang et al.51 Furthermore, it was shown that the MBL levels in the patients with MBL-low genotypes do not change on the 0, 1, 3 and 7 days after stroke onset, while MBL levels in those with MBL-sufficient genotypes decrease on day 1 with subsequent increase with the highest level at day 7.18
The genotyping of the MBL2 gene aimed to find a possible association of the functional genetic polymorphisms in this gene with ischemic stroke revealed that the rs11003125 (H/L) and rs12780112 (P/Q) SNPs in MBL2 gene, as well as the rs12780112*T(Q) minor allele are negatively associated with the risk of ischemic stroke, suggesting their protective role for the development of this disease.
Further, we aimed to examine if the levels of MBL in plasma are genetically determined in ischemic stroke by the very same SNPs as determined by previous investigations. We found that in ischemic stroke patients the rs11003125 (H/L) SNP and the carriage of its minor C allele gene markedly increase the MBL level, while the rs1800450 (A/B) and the carriage of its minor A allele in the same gene significantly decrease the plasma MBL levels. In contrast, in control subjects the rs11003125 (H/L) SNP in MBL2 gene and the carriage of its minor C allele, as well as rs12780112 (P/Q) SNP and the carriage of its minor T allele significantly increase the MBL level, while rs5030737 (A/D) and the carriage of its minor T allele, the rs1800450 (A/B) SNP and the carriage of its minor A allele, as well as the carriage of the minor G allele of the rs7096206 (X/Y) SNP and the carriage of the minor A allele of the rs1800451 (A/C) SNP significantly decrease the plasma MBL levels. And finally, in the entire study population MBL2 rs11003125 (H/L) SNP and the carriage of its minor C allele, as well as rs12780112 (P/Q) SNP and the carriage of its minor T allele significantly increase, while rs5030737 (A/D) SNP and the carriage of its minor T allele, as well as rs1800450 (A/B) and rs1800451 (A/C) SNPs and their minor allele carriage rates markedly decrease the plasma MBL levels.
From the six investigated SNPs in MBL2 gene, rs11003125 (H/L), rs7096206 (X/Y) and rs12780112 (P/Q), located at positions −550 bp, −221 bp and +4 bp, and giving rise to the MBL2* H/L, X/Y and P/Q alleles (Figure 8A),21–23 respectively, have been shown to affect the MBL serum levels.21,24–26 Particularly, rs7096206 was found to decrease the levels of fully functional MBL proteins,21,27,28 which is in line with our findings.
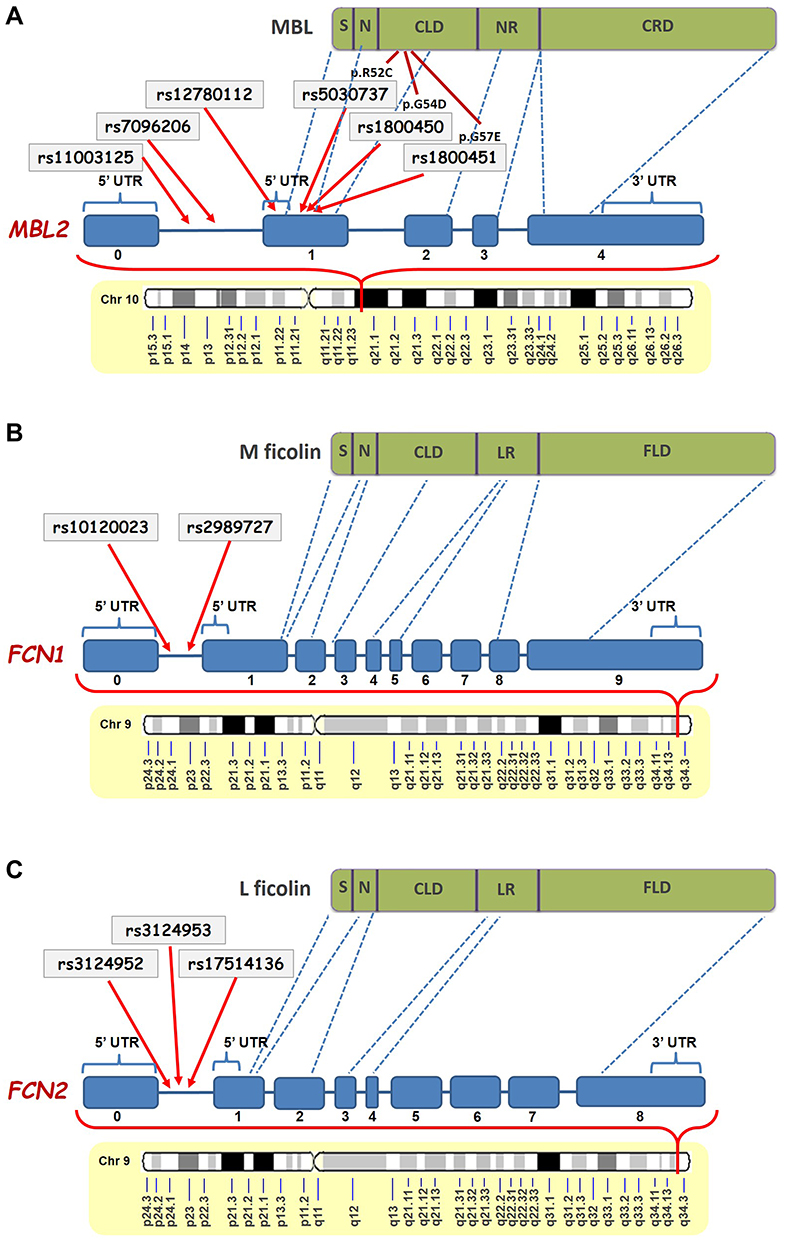 |
Figure 8 Schematic representation of the positions of the studied SNPs in MBL2 (A),FCN1 (B) and FCN2 (C) genes and their corresponding locations in the MBL, M-ficolin and L-ficolin proteins, respectively (modified from Beltrame et al.20 and Mason and Tarr61). Abbreviations: S, Signal Peptide; N, N-Terminal Region; CLD, Collagen-Like Domain; NR, Neck Region; CRD, carbohydrate-recognition domain; UTR, Untranslated Region; LR, Linker Region; FLD, Fibrinogen-Like Domain. |
The rs5030737 (A/D), rs1800450 (A/B) and rs1800451 (A/C) structural non-synonymous SNPs giving rise to the MBL2* A/D, A/B and A/C alleles in codons 52, 54 and 57 have been shown to affect the tertiary structure of the collagenous region of the protein and reduce the circulating MBL levels.16,19,21,24,25,29–34,52 The rs5030737 (A/D) SNP causes the substitution of arginine to cysteine at position 52 (p.R52C), the rs1800450 (A/B) causes the substitution of glycine to aspartic acid at position 54 (p.G54D), and the rs1800451 (A/C) SNP causes the substitution of glycine for glutamic acid at position 57 (p.G57E), altering the secondary structure of the collagenous triple helix of MBL molecule and decreasing the serum MBL level.20,27,28 According to data available in the UniProt database (http://www.uniprot.org/uniprot/P11226) there is an association between low levels of MBL and defective opsonization, which could affect the opsonophagocytic capacity of the immune system to remove damaged or apoptotic neuronal cells, thereby triggering the formation of penumbra and development of ischemic stroke.53,54 It should be noted that these differences in associations between the ischemic stroke and the control cohort have been seen for the first time and presently are unexplained.
The further analysis of the LD pattern between the studied SNPs in MBL2 gene found a strong linkage between the MBL2 gene rs11003125 (H/L), rs7096206 (X/Y), rs12780112 (P/Q) and rs5030737 (A/D) SNPs giving rise to a common one-block structure in both ischemic stroke patients and control subjects groups. Consequently, we revealed that these SNPs give rise to five common haplotypes, GGCC, CCCC, CGCC, CGTC and GGCT, which refer to HYPA, LXPA, LYPA, LYQA and HYPD, respectively. Accordingly, CGTC or LYQA was found to be negatively associated with ischemic stroke suggesting its protective role for the development of this pathology.
It has been shown that four MBL2 haplotypes, YB, YC, YD and XA, are associated with low levels of MBL.35 Moreover, the H and L variants have been found to be in LD with X and Y variants giving rise to haplotypes HY, LY and LX. Particularly, HY was found to be associated with increased MBL levels, LY – with middle MBL levels, and LX – with decreased MBL levels.29 Moreover, the frequencies of HYPA, HXPA, LYPA, LYQA, LXPA, LYPB, LYQC and HYPD haplotypes have been found to differ between different populations.26,34,55,56
It should be noted that from the five haplotypes revealed in our study, HYPA, LYPA and LYQA have been shown to be associated with the elevated MBL levels, while LXPA and HYPD have been found to be associated with MBL deficiency.56 This is in line with our findings showing that the MBL levels in LYQA carriers are higher in the control group. However, we ended up with an interesting and previously not described finding that in ischemic stroke the carriage of LYQA haplotype is associated with low MBL levels compared with control carriers, which, in principle, is expected as PRMs have been shown to play a crucial role in the vascular processes.57–59
Further, in a study involving a North Chinese Han population, a strong LD was found between the rs1800450 (A/B) and rs11003125 (H/L) SNPs showing the haplotype consisting of rs1800450*G and rs11003125*C alleles to be associated with type 2 diabetes mellitus. Moreover, GG (from GG, GA, AA) and CC (from GG, GC, CC) genotypes of the rs1800450 (A/B) and rs11003125 (H/L) SNPs, respectively, have been found to be associated with high serum levels in the same population, and the GG and GA genotypes of rs1800450 (A/B) SNP were found to be associated with type 2 diabetes mellitus. In contrast, the GC genotype of the rs11003125 SNP demonstrated protective effect for the risk of type 2 diabetes mellitus.60
Ficolins are another PRMs of the LCP, which preferably bind to acetylated ligands, unlike MBL mainly targeting carbohydrates.61 Similar to MBL, ficolins are also composed of three identical polypeptides having a signal peptide, N-terminal region, collagen-like domain, linker region and fibrinogen-like domain in their structure (Figure 8B and C).19,21,62 In our study, we found significantly higher levels of M-ficolin in plasma of ischemic stroke patients compared with control subjects. It should be noted that in the case of M-ficolin the frequency distribution was relatively compact, and there were no patients with M-ficolin plasma levels less than 100 ng/mL. These results are in contrast to the results of Zangari et al. reporting a decrease in M-ficolin levels in patients at 6 hours and increase at 48 hours after stroke onset.50 However, it must be pointed out that in our study the M-ficolin levels were measured up to 12 hours after stroke onset, which could indicate the intermediate continuous elevation.
The genotyping of the FCN1 and FCN2 genes aimed to find possible association of the functional genetic polymorphisms in these genes with ischemic stroke demonstrated that the T minor allele of the rs10120023 SNP in FCN1 gene is negatively associated with the risk of ischemic stroke, suggesting its protective role for the development of this disease. Further, the analysis aimed to identify whether the levels of M-ficolin in plasma are genetically determined in ischemic stroke, showed that the rs2989727 SNP and the carriage of the minor T allele of the rs10120023 SNP in FCN1 gene markedly decreases the plasma M-ficolin levels in ischemic stroke, while the rs10120023 SNP significantly increases and the carriage of the minor T allele of the rs2989727 SNP markedly decreases those levels in control subjects. And consequently, rs2989727 SNP and the carriage of its minor T allele significantly decrease, while rs10120023 SNP and the carriage of its minor T allele significantly increase these levels in entire study population.
Both investigated SNPs in FCN1 gene, rs10120023 and rs2989727, have been shown to affect the M-ficolin circulating levels.36,37 Particularly, rs10120023 was found to increase the levels of fully functional M-ficolin proteins.36,37 The in silico analysis of this SNP shown that the minor T allele is located at the YY1 transcription-factor-binding site, which was found also in the promoter to the gene encoding granulocyte-macrophage colony stimulating factor (GM-CSF) and enhanced gene expression.37,63 On the other hand, GM-CSF is a proinflammatory cytokine possessing neuroprotective and angiogenic capacities in neural cells,63,64 confirming our finding of the protective role of this SNP. Thus, Vander Cruyssen et al. found rs2989727 SNP to be associated with the susceptibility for rheumatoid arthritis,65 in contrast to Addobbati et al. reporting no association between rs2989727 and this disease.66 Another study by Ammitzbøll et al. also did not find any association between this SNP and M-ficolin levels.36 Moreover, there is no association between this SNP and diseases such as systemic lupus erythematosus, type 1 diabetes mellitus, celiac disease and autoimmune thyroiditis.66,67 It was revealed also that rs2989727 do not affect the expression of FCN1 in monocytes.37
All the three investigated SNPs in FCN2 gene, rs3124952, rs3124953 and rs17514136, have been shown to affect the L-ficolin levels and/or binding capacity.38 Particularly, rs3124952 has been found to decrease, while rs3124953 and rs17514136 have been found to increase L-ficolin levels39 in a gene dose-dependent manner in healthy individuals. Moreover, these SNPs have been reported to be associated with respiratory infections in children, rheumatic fever, rheumatic heart disease, leprosy, malaria,68–72 hepatitis B,73 cutaneous leishmaniasis and pulmonary tuberculosis.39,74–76 However, similar to our study, no association was found between these SNPs and dental caries in Polish children.77
The further analysis of the LD pattern between the studied SNPs in FCN1 and FCN2 genes in ischemic stroke patients and control subjects found one LD block in FCN1 gene, consisting of rs10120023 and rs2989727 SNPs, and another LD block in FCN2 gene, consisting of rs3124952, rs3124953, rs17514136 SNPs. Consequently, we found that these SNPs give rise to three common haplotypes in each gene, CT, CC and TC in FCN1 gene, and GAA, AAG and AGA. However, none of these defined haplotypes showed association with ischemic stroke.
LCP PRMs possess proinflammatory, procoagulant and prothrombotic features, which, on the other hand, are events taking place in vascular processes and clot formation.57,78,79 The domain in their structure responsible for fibrinogen recognition allows these PRMs to bind with fibrinogen, thereby not only inducing the activation of the LCP but also triggering coagulation processes.57,78,79
It should be emphasized that in contrast to these diverse effects of the genotypes and carriages of the minor alleles of the certain SNPs on the levels of MBL and M-ficolin in plasma, they all have the same profile in all studied groups, i.e. ischemic stroke patients, control subjects and the entire study population, even in cases where no significant differences were found. Unexpectedly, no statistically significant differences were seen on the potential influence of the found alterations on the ischemic lesion volume and functional outcomes (the data are not presented). Despite the important findings in this and several other studies on the involvement of the certain SNPs in MBL2, FCN1 and FCN2 genes in the risk of the development of ischemic stroke, further proteomic and genomic analyses are required to unravel the pathophysiological role of LCP PRMs in the development, severity and outcome of ischemic stroke pathology. To our knowledge, there have been no studies investigating these studied 11 SNPs in ischemic stroke. Moreover, this is the first study to investigate the possible association of 11 SNPs in MBL2, FCN1 and FCN2 genes in Armenians.
The potential limitations of this study include the small cohort size that, however, is relevant due to the small general population of Armenia, only up to 3 million people.80 Another limitation is that we did not study the levels of L-ficolin in this study, which made it impossible to analyze the statistical significance of the genetic impact of the studied SNPs and identified haplotypes in FCN2 gene on the L-ficolin plasma levels. And finally, we did not measure the levels of MBL and M-ficolin in plasma in dynamics which made it impossible to study their effect on the severity and outcome of ischemic stroke.
Conclusions
In conclusion, our study emphasizes the important contribution of alterations of LCP PRMs on genomic and proteomic levels to the pathomechanisms of ischemic stroke, at least in the Armenian population. Our results suggest that PRMs of LCP, MBL and M-ficolin may be associated with ischemic stroke development risk and also may participate in pathological events leading to post-ischemic brain damage. Furthermore, rs11003125 (H/L) and rs12780112 (P/Q) SNPs and CGTC (LYQA) haplotype in MBL2 gene, as well as rs10120023 SNP in FCN1 gene are strongly associated with ischemic stroke, and the rs12780112*T and rs10120023*T minor alleles of these polymorphisms, as well as CGTC (LYQA) haplotype may be considered as protective factors for ischemic stroke at least in the Armenian population. However, further studies are needed to confirm our data on other populations and to reveal the etiopathophysiological mechanisms of the alterations of MBL and M-ficolin levels in ischemic stroke. Thus, it is necessary to study the potential therapeutic effect of PRMs and/or their targets to increase the effectiveness of the therapeutic strategies in ischemic stroke treatment and recovery, as well as prevention from the perspective of genomics and individualized medicine.
Abbreviations
CI, confidence interval; CLD, collagen-like domain; CL-LK, heteromeric complex of CL-L1 (collectin liver 1) and CL-K1 (collectin kidney 1); CRD, carbohydrate-recognition domain; CS, control subjects; DALYs, disability-adjusted life years; EDTA, ethylenediaminetetraacetic acid; FLD, fibrinogen-like domain; GM-CSF, granulocyte-macrophage colony stimulating factor; HWE, Hardy–Weinberg equilibrium; IS, ischemic stroke patients; LCP, lectin complement pathway; LD, linkage disequilibrium; LR, linker region; MAF, minor allele frequency; MAp19, MBL-associated protein of 19 kDa; MASP, MBL-associated serine protease; MBL, mannan-binding lectin; MGB, minor-groove-binder; NIHSS, National Institutes of Health Stroke Scale; NR, neck region; OR, odds ratio; PBS, phosphate-buffered saline; PCR, polymerase chain reaction; PRM, pattern recognition molecule; RT-PCR, real-time polymerase chain reaction; SD, standard deviation; SIFT, Sorting Intolerant from Tolerant (algorithm predicting the effect of coding variants on protein function); SNP, single nucleotide polymorphism; TBS, tris-buffered saline; TRIFMA, time-resolved immunofluorometric assay; UTR, untranslated region.
Ethics Approval and Informed Consent
This study was carried out in accordance with the recommendations of “US FDA regulations at 21 CFR parts 50 and 56, International Ethical Guidelines for Biomedical Research Involving Human Subjects, ICH-GCP, Schedule Y and ICMR guidelines and other applicable regulation, Ethical Committee of the Institute of Molecular Biology NAS RA (IRB #00004079)” with written informed consent from all subjects. All subjects gave written informed consent in accordance with the Declaration of Helsinki. The protocol was approved by the “Ethical Committee of the Institute of Molecular Biology NAS RA (IRB #00004079)”.
Acknowledgments
The authors would like to acknowledge Annette Gudman, Lisbeth Jensen for excellent technical assistance, Prof. Steffen Thiel for discussion of the data, Dr. Anne Troldborg for revising the manuscript, as well as all the patients and healthy volunteers for their readiness to kindly contribute to this study.
Funding
This work was supported by the Augustinus Foundation, Denmark, as well as the State Committee of Science of the Ministry of Education and Science of the Republic of Armenia in the frames of 19YR-1F045 and 20TTCG-1F003 research projects.
Disclosure
The authors report no conflicts of interest in this work.
References
1. Mackay J, Mensah GA The atlas of heart disease and stroke. World health organization and center for disease control and prevention; 2015. Available from: http://www.who.int/cardiovascular_diseases/resources/atlas/en/.
2. Koton S, Schneider AL, Rosamond WD, et al. Stroke incidence and mortality trends in US communities, 1987 to 2011. JAMA. 2014;312(3):259–268. doi:10.1001/jama.2014.7692
3. Feigin VL, Krishnamurthi R. Stroke prevention in the developing world. Stroke. 2011;42(12):3655–3658. doi:10.1161/STROKEAHA.110.596858
4. Strong K, Mathers C, Bonita R. Preventing stroke: saving lives around the world. Lancet Neurol. 2007;6:182–187. doi:10.1016/S1474-4422(07)70031-5
5. Andreasyan D, Bazarchyan A, Matevosyan M, et al. “Health and Health Care” Yearbook Republic of Armenia 2020. Yerevan: National Institute of Health after named after academician S. Avdalbekyan MoH; 2020.
6. Lucas SM, Rothwell NJ, Gibson RM. The role of inflammation in CNS injury and disease. Br J Pharmacol. 2006;147(Suppl 1):S232–S240. doi:10.1038/sj.bjp.0706400
7. Mollnes TE, Song WC, Lambris JD. Complement in inflammatory tissue damage and disease. Trends Immunol. 2002;23(2):61–64. doi:10.1016/S1471-4906(01)02129-9
8. Fujita T. Evolution of the lectin-complement pathway and its role in innate immunity. Nat Rev Immunol. 2002;2(5):346–353. doi:10.1038/nri800
9. Liu Y, Endo Y, Iwaki D, et al. Human M-ficolin is a secretory protein that activates the lectin complement pathway. J Immunol. 2005;175(5):3150–3156. doi:10.4049/jimmunol.175.5.3150
10. Hansen S, Selman L, Palaniyar N, et al. Collectin 11 (CL-11, CL-K1) is a MASP-1/3-associated plasma collectin with microbial-binding activity. J Immunol. 2010;185(10):6096–6104. doi:10.4049/jimmunol.1002185
11. Boyajyan AS, Tsakanova GV, Zhamgaryan LG, et al. Involvement of the complement lectin pathway in postischemic inflammatory response. Cytokines Inflammation. 2010;9(3):35–39.
12. Thiel S, Gadjeva M. Humoral pattern recognition molecules: mannan-binding lectin and ficolins. Adv Exp Med Biol. 2009;653:58–73.
13. Holmskov U, Thiel S, Jensenius JC. Collectins and ficolins: humoral lectins of the innate immune defense. Annu Rev Immunol. 2003;21:547–578. doi:10.1146/annurev.immunol.21.120601.140954
14. Tsakanova G, Stepanyan A, Nahapetyan K, et al. Serine proteases of the complement lectin pathway and their genetic variations in ischaemic stroke. J Clin Pathol. 2018;71(2):141–147. doi:10.1136/jclinpath-2017-204403
15. Degn SE, Jensenius JC, Bjerre M. The lectin pathway and its implications in coagulation, infections and auto-immunity. Curr Opin Organ Transplant. 2011;16(1):21–27. doi:10.1097/MOT.0b013e32834253df
16. Petersen SV, Thiel S, Jensenius JC. The mannan-binding lectin pathway of complement activation: biology and disease association. Mol Immunol. 2001;38(2–3):133–149. doi:10.1016/S0161-5890(01)00038-4
17. Møller-Kristensen M, Wang W, Ruseva M, et al. Mannan-binding lectin recognizes structures on ischaemic reperfused mouse kidneys and is implicated in tissue injury. Scand J Immunol. 2005;61(5):426–434. doi:10.1111/j.1365-3083.2005.01591.x
18. Cervera A, Planas AM, Justicia C, et al. Genetically-defined deficiency of mannose-binding lectin is associated with protection after experimental stroke in mice and outcome in human stroke. PLoS One. 2010;5(2):e8433. doi:10.1371/journal.pone.0008433
19. Larsen F, Madsen HO, Sim RB, et al. Disease-associated mutations in human mannose-binding lectin compromise oligomerization and activity of the final protein. J Biol Chem. 2004;279(20):21302–21311. doi:10.1074/jbc.M400520200
20. Garred P, Thiel S, Madsen HO, et al. Gene frequency and partial protein characterization of an allelic variant of mannan binding protein associated with low serum concentrations. Clin Exp Immunol. 1992;90(3):517–521. doi:10.1111/j.1365-2249.1992.tb05876.x
21. Beltrame MH, Catarino SJ, Goeldner I, et al. The lectin pathway of complement and rheumatic heart disease. Front Pediatr. 2015;2:148. doi:10.3389/fped.2014.00148
22. Sastry K, Herman GA, Day L, et al. The human mannose-binding protein gene. Exon structure reveals its evolutionary relationship to a human pulmonary surfactant gene and localization to chromosome 10. J Exp Med. 1989;170(4):1175–1189. doi:10.1084/jem.170.4.1175
23. Taylor ME, Brickell PM, Craig RK, et al. Structure and evolutionary origin of the gene encoding a human serum mannose-binding protein. Biochem J. 1989;262(3):763–771. doi:10.1042/bj2620763
24. Sjöberg AP, Manderson GA, Mörgelin M, et al. Short leucine-rich glycoproteins of the extracellular matrix display diverse patterns of complement interaction and activation. Mol Immunol. 2009;46(5):830–839. doi:10.1016/j.molimm.2008.09.018
25. Swingler TE, Waters JG, Davidson RK, et al. Degradome expression profiling in human articular cartilage. Arthritis Res Ther. 2009;11(3):R96. doi:10.1186/ar2741
26. Turner MW. The role of mannose-binding lectin in health and disease. Mol Immunol. 2003;40:423–429. doi:10.1016/S0161-5890(03)00155-X
27. Turner MW, Hamvas RM. Mannose-binding lectin: structure, function, genetics and disease associations. Rev Immunogenet. 2000;2(3):305–322.
28. Turner MW. Mannose-binding lectin: the pluripotent molecule of the innate immune system. Immunol Today. 1996;17(11):532–540. doi:10.1016/S0167-5699(96)80908-X
29. Madsen HO, Garred P, Thiel S, et al. Interplay between promoter and structural gene variants control basal serum level of mannan-binding protein. J Immunol. 1995;155(6):3013–3020.
30. Madsen HO, Satz ML, Hogh B, et al. Different molecular events result in low protein levels of mannan-binding lectin in populations from southeast Africa and South America. J Immunol. 1998;161(6):3169–31675.
31. Wallis R. Structural and functional aspects of complement activation by mannose-binding protein. Immunobiology. 2002;205(4–5):433–445. doi:10.1078/0171-2985-00144
32. Wallis R, Drickamer K. Molecular determinants of oligomer formation and complement fixation in mannose-binding proteins. J Biol Chem. 1999;274(6):3580–3589. doi:10.1074/jbc.274.6.3580
33. Matsushita M, Ezekowitz RA, Fujita T. The Gly-54-Asp allelic form of human mannose-binding protein (MBP) fails to bind MBP-associated serine protease. Biochem J. 1995;311(Pt 3):1021–1023. doi:10.1042/bj3111021
34. Steffensen R, Thiel S, Varming K, et al. Detection of structural gene mutations and promoter polymorphisms in the mannan-binding lectin (MBL) gene by polymerase chain reaction with sequence-specific primers. J Immunol Methods. 2000;241(1–2):33–42. doi:10.1016/S0022-1759(00)00198-8
35. Lipscombe RJ, Sumiya M, Summerfield JA, et al. Distinct physicochemical characteristics of human mannose binding protein expressed by individuals of differing genotype. Immunology. 1995;85(4):660–667.
36. Ammitzbøll CG, Kjær TR, Steffensen R, et al. Non-synonymous polymorphisms in the FCN1 gene determine ligand-binding ability and serum levels of M-ficolin. PLoS One. 2012;7(11):e50585. doi:10.1371/journal.pone.0050585
37. Munthe-Fog L, Hummelshoj T, Honoré C, et al. Variation in FCN1 affects biosynthesis of ficolin-1 and is associated with outcome of systemic inflammation. Genes Immun. 2012;13(7):515–522. doi:10.1038/gene.2012.27
38. Garred P, Honore C, Ma YJ, et al. The genetics of ficolins. J Innate Immun. 2010;2(1):3–16. doi:10.1159/000242419
39. Hummelshoj T, Munthe-Fog L, Madsen HO, et al. Polymorphisms in the FCN2 gene determine serum variation and function of Ficolin-2. Hum Mol Genet. 2005;14(12):1651–1658. doi:10.1093/hmg/ddi173
40. Adams HP
41. Sambrook J, Russell DW. Molecular Cloning: A Laboratory Manual.
42. Thiel S, Møller-Kristensen M, Jensen L, et al. Assays for the functional activity of the mannan-binding lectin pathway of complement activation. Immunobiology. 2002;205(4–5):446–454. doi:10.1078/0171-2985-00145
43. Wittenborn T, Thiel S, Jensen L, et al. Characteristics and biological variations of M-ficolin, a pattern recognition molecule, in plasma. J Innate Immun. 2010;2(2):167–180. doi:10.1159/000218324
44. Henckaerts L, Nielsen KR, Steffensen R, et al. Polymorphisms in innate immunity genes predispose to bacteremia and death in the medical intensive care unit. Crit Care Med. 2009;37(1):
45. Mølle I, Steffensen R, Thiel S, et al. Chemotherapy-related infections in patients with multiple myeloma: associations with mannan-binding lectin genotypes. Eur J Haematol. 2006;77(1):19–26. doi:10.1111/j.1600-0609.2006.00669.x
46. Mandal J, Malla B, Steffensen R, et al. Mannose-binding lectin protein and its association to clinical outcomes in COPD: a longitudinal study. Respir Res. 2015;16:150. doi:10.1186/s12931-015-0306-3
47. Boldt AB, Sanchez MI, Stahlke ER, et al. Susceptibility to leprosy is associated with M-ficolin polymorphisms. J Clin Immunol. 2013;33(1):210–219. doi:10.1007/s10875-012-9770-4
48. Yoo J, Lee Y, Kim Y, et al. SNPAnalyzer 2.0: a web-based integrated workbench for linkage disequilibrium analysis and association analysis. BMC Bioinform. 2008;9:290. doi:10.1186/1471-2105-9-290
49. Gabriel SB, Schaffner SF, Nguyen H, et al. The structure of haplotype blocks in the human genome. Science. 2002;296(5576):2225–2229. doi:10.1126/science.1069424
50. Zangari R, Zanier ER, Torgano G, et al. Early ficolin-1 is a sensitive prognostic marker for functional outcome in ischemic stroke. J Neuroinflammation. 2016;13(1):16. doi:10.1186/s12974-016-0481-2
51. Wang ZY, Sun ZR, Zhang LM. The relationship between serum mannose-binding lectin levels and acute ischemic stroke risk. Neurochem Res. 2004;39(2):248–253. doi:10.1007/s11064-013-1214-x
52. Wallis R, Cheng JY. Molecular defects in variant forms of mannose-binding protein associated with immunodeficiency. J Immunol. 1999;163(9):4953–4959.
53. Brouwer N, Dolman KM, van Zwieten R, et al. Mannan-binding lectin (MBL)-mediated opsonization is enhanced by the alternative pathway amplification loop. Mol Immunol. 2006;43(13):2051–2060. doi:10.1016/j.molimm.2006.01.003
54. Nauta AJ, Castellano G, Xu W, et al. Opsonization with C1q and mannose-binding lectin targets apoptotic cells to dendritic cells. J Immunol. 2004;173(5):3044–3050. doi:10.4049/jimmunol.173.5.3044
55. Dommett RM, Klein N, Turner MW. Mannose-binding lectin in innate immunity: past, present and future. Tissue Antigens. 2006;68(3):193–209. doi:10.1111/j.1399-0039.2006.00649.x
56. de Messias-reason IJ, Boldt AB, Moraes Braga AC, et al. The association between mannan-binding lectin gene polymorphism and clinical leprosy: new insight into an old paradigm. J Infect Dis. 2007;196(9):1379–1385. doi:10.1086/521627
57. Fumagalli S, De Simoni MG. Lectin complement pathway and its bloody interactions in brain ischemia. Stroke. 2016;47(12):3067–3073. doi:10.1161/STROKEAHA.116.012407
58. Endo Y, Matsushita M, Fujita T. The role of ficolins in the lectin pathway of innate immunity. Int J Biochem Cell Biol. 2011;43(5):705–712. doi:10.1016/j.biocel.2011.02.003
59. Endo Y, Nakazawa N, Iwaki D, Takahashi M, Matsushita M, Fujita T. Interactions of ficolin and mannose-binding lectin with fibrinogen/fibrin augment the lectin complement pathway. J Innate Immun. 2010;2(1):33–42. doi:10.1159/000227805
60. Zhang N, Zhuang M, Ma A, et al. Association of levels of mannose-binding lectin and the MBL2 gene with type 2 diabetes and diabetic nephropathy. PLoS One. 2013;8(12):e83059. doi:10.1371/journal.pone.0083059
61. Krarup A, Thiel S, Hansen A, et al. L-ficolin is a pattern recognition molecule specific for acetyl groups. J Biol Chem. 2004;279(46):47513–47519. doi:10.1074/jbc.M407161200
62. Mason CP, Tarr AW. Human lectins and their roles in viral infections. Molecules. 2015;20(2):2229–2271. doi:10.3390/molecules20022229
63. Theoret JK, Jadavji NM, Zhang M, et al. Granulocyte macrophage colony-stimulating factor treatment results in recovery of motor function after white matter damage in mice. Eur J Neurosci. 2016;43(1):17–24. doi:10.1111/ejn.13105
64. Navarro-Sobrino M, Rosell A, Penalba A, et al. Role of endogenous granulocyte-macrophage colony stimulating factor following stroke and relationship to neurological outcome. Curr Neurovasc Res. 2009;6(4):246–251. doi:10.2174/156720209789630366
65. Vander Cruyssen B, Nuytinck L, Boullart L, et al. Polymorphisms in the ficolin 1 gene (FCN1) are associated with susceptibility to the development of rheumatoid arthritis. Rheumatology. 2007;46(12):1792–1795. doi:10.1093/rheumatology/kem266
66. Addobbati C, de Azevêdo Silva J, Tavares NA, et al. Ficolin gene polymorphisms in systemic lupus erythematosus and rheumatoid arthritis. Ann Hum Genet. 2016;80(1):1–6. doi:10.1111/ahg.12129
67. Anjosa ZP, Santos MM, Rodrigues NJ, et al. Polymorphism in ficolin-1 (FCN1) gene is associated with an earlier onset of type 1 diabetes mellitus in children and adolescents from northeast Brazil. J Genet. 2016;95(4):1031–1034. doi:10.1007/s12041-016-0719-x
68. Chen X, Katoh Y, Nakamura K, et al. Single nucleotide polymorphisms of Ficolin 2 gene in Behcet’s disease. J Dermatol Sci. 2006;43(3):201–205. doi:10.1016/j.jdermsci.2006.05.010
69. de Messias-reason I, Kremsner PG, Kun JF. Functional haplotypes that produce normal ficolin-2 levels protect against clinical leprosy. J Infect Dis. 2009;199(6):801–804. doi:10.1086/597070
70. Faik I, Oyedeji SI, Idris Z, et al. Ficolin-2 levels and genetic polymorphisms of FCN2 in malaria. Hum Immunol. 2011;72(1):74–79. doi:10.1016/j.humimm.2010.10.003
71. Messias-Reason IJ, Schafranski MD, Kremsner PG, et al. Ficolin 2 (FCN2) functional polymorphisms and the risk of rheumatic fever and rheumatic heart disease. Clin Exp Immunol. 2009;157(3):395–399. doi:10.1111/j.1365-2249.2009.03975.x
72. Ruskamp JM, Hoekstra MO, Postma DS, et al. Exploring the role of polymorphisms in ficolin genes in respiratory tract infections in children. Clin Exp Immunol. 2009;155(3):433–440. doi:10.1111/j.1365-2249.2008.03844.x
73. Hoang TV, Toan NL, Song LH, et al. Ficolin-2 levels and FCN2 haplotypes influence hepatitis B infection outcome in Vietnamese patients. PLoS One. 2011;6(11):e28113. doi:10.1371/journal.pone.0028113
74. Ojurongbe O, Ouf EA, Van Tong H, et al. Reliable and rapid characterization of functional FCN2 gene variants reveals diverse geographical patterns. BMC Med Genet. 2012;13:37. doi:10.1186/1471-2350-13-37
75. Assaf A, Hoang TV, Faik I, et al. Genetic evidence of functional ficolin-2 haplotype as susceptibility factor in cutaneous leishmaniasis. PLoS One. 2012;7(3):e34113. doi:10.1371/journal.pone.0034113
76. Xu DD, Wang C, Jiang F, et al. Association of the FCN2 gene single nucleotide polymorphisms with susceptibility to pulmonary tuberculosis. PLoS One. 2015;10(9):e0138356. doi:10.1371/journal.pone.0138356
77. Olszowski T, Milona M, Janiszewska-Olszowska J, et al. The lack of association between FCN2 gene promoter region polymorphisms and dental caries in Polish children. Caries Res. 2017;51(1):79–84. doi:10.1159/000455054
78. Fumagalli S, Ortolano F, De Simoni MG. A close look at brain dynamics: cells and vessels seen by in vivo two-photon microscopy. Prog Neurobiol. 2014;121:36–54. doi:10.1016/j.pneurobio.2014.06.005
79. Del Zoppo GJ, Mabuchi T. Cerebral microvessel responses to focal ischemia. J Cereb Blood Flow Metab. 2003;23(8):879–894. doi:10.1097/01.WCB.0000078322.96027.78
80. United Nations Report. Human development report 2016. Human development for everyone. United Nations Development Programme; 2017. New York: One Unite Nations Plaza. Available from: http://hdr.undp.org/sites/default/files/2016_human_development_report.pdf.
81. Kumar P, Henikoff S, Ng PC. Predicting the effects of coding non-synonymous variants on protein function using the SIFT algorithm. Nat Protoc. 2009;4(7):1073–1081. doi:10.1038/nprot.2009.86
 © 2021 The Author(s). This work is published and licensed by Dove Medical Press Limited. The full terms of this license are available at https://www.dovepress.com/terms.php and incorporate the Creative Commons Attribution - Non Commercial (unported, v3.0) License.
By accessing the work you hereby accept the Terms. Non-commercial uses of the work are permitted without any further permission from Dove Medical Press Limited, provided the work is properly attributed. For permission for commercial use of this work, please see paragraphs 4.2 and 5 of our Terms.
© 2021 The Author(s). This work is published and licensed by Dove Medical Press Limited. The full terms of this license are available at https://www.dovepress.com/terms.php and incorporate the Creative Commons Attribution - Non Commercial (unported, v3.0) License.
By accessing the work you hereby accept the Terms. Non-commercial uses of the work are permitted without any further permission from Dove Medical Press Limited, provided the work is properly attributed. For permission for commercial use of this work, please see paragraphs 4.2 and 5 of our Terms.