")
Back to Journals » Diabetes, Metabolic Syndrome and Obesity » Volume 12
Pattern of Obesity Among Patients with Type 2 Diabetes at a Tertiary Healthcare Center in Northern Nigeria
Authors Gezawa ID, Uloko AE , Gwaram BA, Ibrahim DA, Ugwu ET , Mohammed IY
Received 11 August 2019
Accepted for publication 19 November 2019
Published 30 December 2019 Volume 2019:12 Pages 2785—2790
DOI https://doi.org/10.2147/DMSO.S226054
Checked for plagiarism Yes
Review by Single anonymous peer review
Peer reviewer comments 2
Editor who approved publication: Prof. Dr. Antonio Brunetti
Ibrahim D Gezawa,1 Andrew E Uloko,1 Baffa A Gwaram,1 Daiyabu A Ibrahim,1 Ejiofor T Ugwu,2 Idris Y Mohammed3
1Department of Medicine, Aminu Kano Teaching Hospital, Kano, Nigeria; 2Department of Medicine, Enugu State University of Science and Technology, Enugu, Enugu State, Nigeria; 3Department of Chemical Pathology, Aminu Kano Teaching Hospital, Kano, Nigeria
Correspondence: Ibrahim D Gezawa
Department of Medicine, Aminu Kano Teaching Hospital, Kano, Kano State 700001, Nigeria
Tel +234 803 22150 92
Email [email protected]
Purpose: Type 2 diabetes poses a major global health threat both in the developed and developing countries. Factors responsible for the soaring epidemic of T2DM in the developing countries include urbanization, ageing population, physical inactivity and increasing obesity rates. Our aim was to determine the pattern of obesity among patients with T2DM at the Aminu Kano Teaching Hospital (AKTH), Kano, Northwestern Nigeria.
Patients and methods: We consecutively recruited 220 patients with type 2 diabetes attending the diabetes clinic of AKTH for the study. Patients with Type 1 diabetes, patients who could not stand or are wheelchair bound and pregnant women were excluded from the study. A pretested questionnaire was used to collect data on socio-demographic characteristics, treatment history for diabetes and history of hypertension from each participant.
Results: Of the 220 patients recruited for this study, 97(44.1%) were men, while 123(55.9%) were women. The prevalence of generalized obesity among the study participants was 27.4% (women −30.9% vs men- 22.7%, X2=4.76, p=0.190). Grades I. II and III obesity were found in 17.3%, 5.9% and 3.2% of the study participants, respectively. All the participants with grade III obesity were women. Central obesity defined by WC was detected in 111(50.5%) [20(20.6%) men and 91(73.9%) women, X2=1.93, p=0.001]. Obesity defined by WHR was recorded in 182(82.7%) participants [80(43.9%) men and 102(56.0%) women, X2= 1.97, 0.001]. Using a cut-off of ≥0.5, abnormal WhtR was detected in 179(81.4%) [72(40.2%) men and 107(59.8%) women, X2= 5.82, p=0.01], while using a cut-off of ≥0.6, abnormal WhtR was detected in 84(38.2%) participants [29 (34.5%) men and 55(65.5%) women, X2=6.38, p=0.09]. Hypertension was detected in 103(46.8%) participants, with a higher prevalence among women compared with men [46.3. % vs 47.4%, X2= 1.03 p=0.87].
Conclusion: The prevalence of obesity in our cohort of patients with type 2 diabetes was high. The predominant form of obesity was central obesity, which was most prevalent when indexed by WHR. The WhtR was as good as the WHR, but fared better than WC in detecting central obesity in our patients.
Keywords: type 2 diabetes, obesity, central obesity, prevalence, Nigerians
Introduction
According to the International Diabetes Federation, 463 million people are currently living with diabetes mellitus (DM) with a projected increase to 700 million by 2045.1 The developing countries are expected to be worst hit by the epidemic with an anticipated 170% increase in DM prevalence. Type 2 diabetes (T2DM) constitutes a major global health threat.1 Several factors are responsible for the soaring epidemic of T2DM in the developing countries. These include urbanization, older age, sedentary living and rising rates of obesity.1–3 Migration from rural to urban areas is associated with changes in lifestyle characterized by unhealthy eating habits (consumption of fat-laden and energy-dense foods) coupled with reduced physical activity due to the availability of alternative modes of transportation. Thus, urban living promotes the development of obesity. Obesity increases the risk of DM 7-fold compared to normal-weight individuals.4 Traditionally, obesity is classified into generalized obesity, as measured by body mass index (BMI) and central obesity or adiposity, defined by abnormal waist circumference (WC), waist-to-hip ratio (WHR) or waist-to-height ratio (WhtR). Diabetes has a stronger association with central obesity than with generalized obesity.5 The prevalence of generalized obesity among patients with type 2 diabetes across Nigeria ranges from 5.0% in Zaria,6 in the Northwest to 40% in Lagos7 in the Southwestern part of the country. Similarly, the rates for central adiposity ranged between 72%, using WC in Uyo,8 South-South Nigeria to 95% using WHR in Zaria, Northwestern Nigeria.6 However, none of the studies cited utilized WhtR as a measure of central obesity. We therefore set out to determine the pattern of obesity, using established anthropometric indices, including WhtR among patients with type 2 diabetes at the diabetes clinic of Aminu Kano Teaching Hospital (AKTH), Kano, Northwestern Nigeria.
Patients and Methods
We consecutively recruited 220 patients with type 2 diabetes (T2DM) attending the diabetes clinic of AKTH for the study. Patients with type 1 diabetes, patients who could not stand or are wheelchair bound and pregnant women were excluded from the study. A pretested questionnaire was used to collect data on socio-demographic characteristics, treatment history for diabetes and history of hypertension from each participant. All participants provided written informed consent and the study was conducted in accordance with the Declaration of Helsinki. The ethics committee of AKTH approved the study.
Physical Measurements
We measured and recorded weight, height, waist and hip circumferences on each subject. Weight was measured in kilograms (to the nearest 0.5kg) using a calibrated bathroom scale (Soehnle-Waagen GmbH & Co. KG, Wilhelm-Soehnle-Straße 2, D-71540 Murrhardt/Germany) positioned on a firm horizontal surface, with the subject in light clothing and without shoes. Using a stadiometer (Seca GmbH & Co. KG, Germany), height was measured (in metres) to the nearest 0.1cm. Participants stood erect, without shoes and headgears, on a flat surface with the heels and occiput in contact with the stadiometer. We calculated BMI by dividing the weight (kg) by the square of the height in metres (m2). Waist circumference was measured to the nearest 0.1cm (with a non-stretchable dressmaker’s tape) at a point mid-way between the margin of the lowest rib and the iliac crest. Waist-to-height ratio was calculated by dividing WC (cm) by the height (cm).
Hip circumference (HC) was measured at the horizontal level of maximum circumference around the buttocks (posteriorly) and the pubic symphysis (anteriorly) to the nearest 0.1cm. Waist-to-hip ratio (WHR) was derived by dividing the WC (cm) by the HC (cm). Blood pressure (BP) in millimeter of mercury (mmHg) was measured to the nearest 2 mmHg, on the right arm with subjects seated quietly after 5 mins of rest with the arm and back supported, using a standard mercury sphygmomanometer with an appropriate sized arm cuff. We recorded Systolic BP (SBP) at Korotkoff Phase 1, while diastolic BP (DBP) was recorded at Phase 5.
Definition of Operational Terms
- Body mass index (BMI) – was expressed in kg/m2. Subjects with BMI <18.5 were classified as underweight and those with BMI of 18.5–24.9 were classified as having normal weight. Those with BMI of 25.0–29.9 and ≥30.0 were classified as overweight and obese, respectively.9
- Generalized obesity – obesity based on BMI ≥30.0 kg/m2. Obesity was further subdivided into grade I (BMI=30.0 −34.9), grade II (BMI=35.0–39.9) and grade III (BMI≥40) respectively.
- Waist circumference (WC) – waist circumference ≥102 cm in men and ≥88 cm in women were considered abnormal.9 These cut-off points identify patients with the highest risk of cardiovascular disease.
- Waist to hip ratio (WHR) – waist-to-hip ratio of ≥0.90 in men and ≥0.85 in women were considered abnormal.9
- Waist-to-height ratio (WhtR) – waist-to-height ratio of ≥0.5 in both genders was considered abnormal.9 A WhtR cut-off point of ≥0.6 has been shown to be effective in predicting cardiovascular disease risk in a population of patients with type 2 diabetes.12 This cut-off was also used in this study.
- Central obesity (adiposity) – obesity based on abnormal cut-off values for WC, WHR, and WhtR.
- Hypertension – hypertension was defined as SBP≥140mmHg or DBP≥90mmHg or treatment for hypertension.13
Laboratory Methods
Blood samples (3mL) were collected from each participant following an overnight fast of 8–12 hrs in fluoride oxalate bottles for the estimation of fasting plasma glucose (FPG) using glucose-oxidase method.14 A second blood sample was taken 2 hr after meals for 2 hr postprandial glucose (2-HPPG) estimation.
Statistical Analyses
The data collected were analyzed using SPSS for Windows version 16.0 (SPSS Inc., Chicago, Illinois, USA) statistical software package. Normally distributed continuous variables were expressed as mean (SD), while non-normally distributed continuous variables were expressed as median (Q1; Q3). Distribution was assessed using the Shapiro–Wilk test. Categorical variables were expressed as proportions. Independent student’s t-test was used to compare means. Skewed continuous variables were compared using the non-parametric Mann–Whitney test. Chi-square test was used to compare proportions. Pearson’s correlation was used to determine the inter-relationship between indices of obesity. A P value of ≤0.05 was considered statistically significant.
Results
Out of the 220 patients recruited for this study, 97(44.1%) were men, while 123(55.9%) were women. The median (Q1; Q3) age of the participants was 53.0(18.0) years with a range of 19–94 years. The men were older with a median (Q1; Q3) age of 53.0(17.0) years compared with a median (Q1; Q3) age of 52.0(20.0) years for the women (p=0.94). The mean (SD) duration of DM was 6.1(5.9) years and was longer among men compared with women [6.9(7.3) years vs 5.3(4.5) years, p=0.04]. Table 1 shows the socio-demographic and clinical characteristics of the study subjects. Majority of our patients, 61(60.4%) was on combination therapy with Metformin and Glibenclamide, 6.0(5.9%) patients were on Pioglitazone combined with either Glibenclamide or Glimepiride, while 10(9.9%) patients were on a combination of Metformin and Glimepiride.
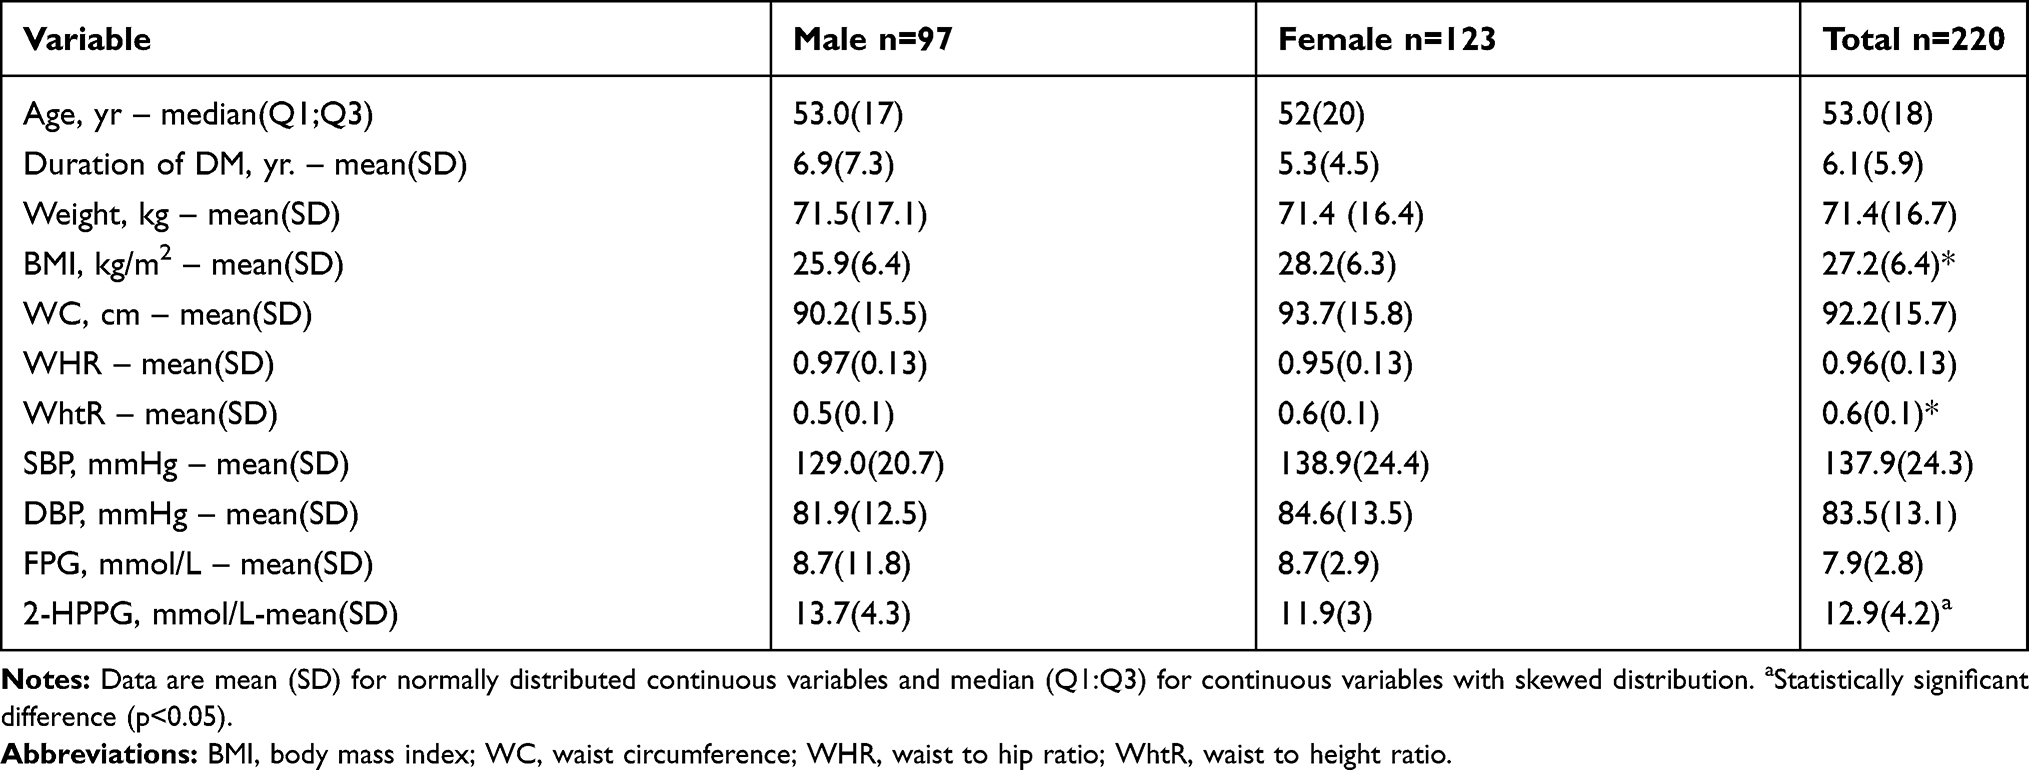 |
Table 1 Sociodemographic and Clinical Characteristics of the Study Participants by Gender |
Prevalence and Pattern of Obesity Among the Study Subjects
Table 2 shows the distribution of the participants based on BMI categories. The prevalence of generalized obesity among the study participants was 27.4% and was higher among women compared with men (30.9% vs 22.7%, X2=4.76, p=0.19), but the difference was not statistically significant. The BMI correlated positively and significantly with WC (r=0.56, p=0.001) and WhtR (r=0.59, p=0.001). The correlation between BMI and WHR (r=0.03, p=0.696) was, however, weak and insignificant. Central obesity defined by the various indices employed in this study is shown in Figure 1.
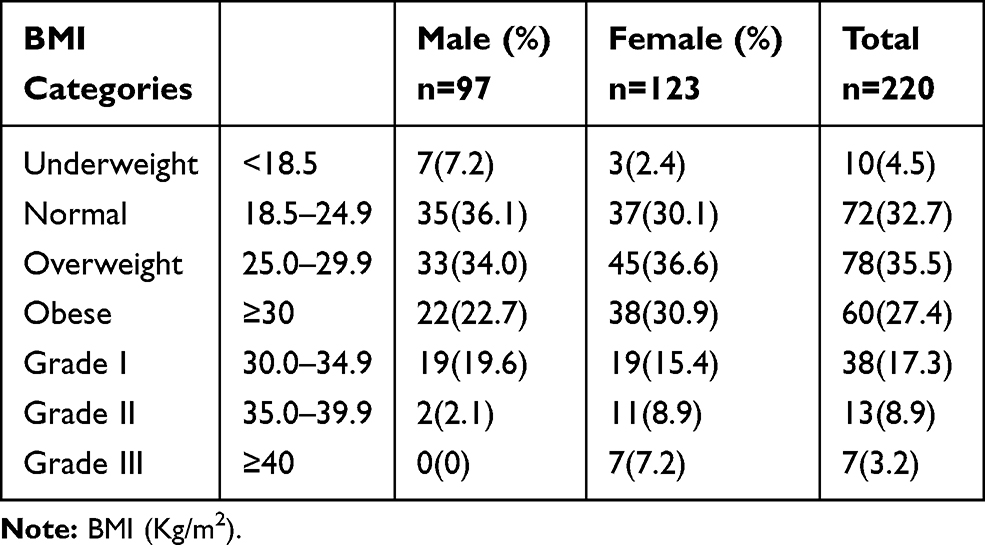 |
Table 2 Distribution of Participants by BMI Categories and Gender |
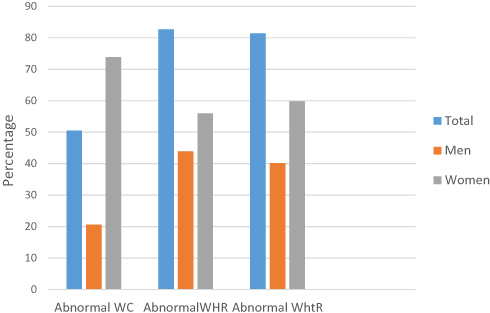 |
Figure 1 Central adiposity among patients with T2DM by gender. Abbreviations: BMI, body mass index; WC, waist circumference; WHR, waist to hip ratio; WhtR, waist to height ratio. |
Prevalence of Hypertension and Its Relationship with Indices of Obesity
The mean (SD) values of SBP and DBP of the study participants were 137.9(24.3) mmHg and 83.5(13.1) mmHg, respectively. Both SBP and DBP were higher in women than in men [138.9(24.4) vs 129.0(20.7), p=0.49 and 84.6(13.5) vs 81.9(12.5), p=0.13), respectively], but the differences were not statistically significant. Hypertension was detected in 103(46.8%) participants, with a higher prevalence among men compared with women [47.4% vs 46.3%, X2= 0.02 p=0.87]. While the SBP correlated positively and significantly with all the indices of obesity viz. BMI (r=0.15, p=0.02), WC (r=0.20, p=0.02), WHR (r=0.13, p=0.04) and WhtR (r=0.21, p=0.01), the DBP had positive and significant correlation only with BMI (r=0.22, p=0.01), WC (r=0.18, p=0.01) and WhtR (r=0.20, p=0.01). Further analysis revealed no significant difference in the mean values of the indices of obesity between those with and without hypertension.
Relationship Between Plasma Glucose Levels and Indices of Obesity
The mean (SD) FPG of the study subjects was 7.9(2.8) mmol/L with a range of 3.6–17.5mmol/L [men − 8.7(11.8) mmol/L, women – 8.7(2.9) mmol/L, p=0.99]. The mean (SD) 2-HPPG of the participants was 12.9(4.2) mmol/L with a range of 5.2–25.0 mmol/L with the women having higher levels compared with the men (11.9 (3.9) vs 13.7(4.3) mmol/L, p=0.03). Both FPG and 2HPPG had no statistically significant correlation with the indices of obesity even after adjusting for age and duration of DM.
Discussion
In the present study, we determined the phenotypic pattern of obesity in a cohort of patients with type 2 diabetes attending the Diabetes clinic of Aminu Kano Teaching Hospital, Kano, Northwestern Nigeria. There were more females than males in our studied sample, a finding that is in tandem with the observation by Ogbera et al15 in Lagos, Southwest Nigeria. However, Isezuo and Ezunu16 from Sokoto in the Northwestern part of the country reported a preponderance of males in their study. More women than men in our setting seek medical attention. Other studies have, however, reported higher proportion of males than females among their patients with type 2 diabetes.16,17
Generalized obesity, as measured by BMI, has been established as an independent risk factor for type 2 diabetes.18 In this study, we found the prevalence of generalized obesity to be 27.4% which is higher than the corresponding figure reported by Bakari and Onyemelukwe6 in a study among patients with type 2 diabetes in Zaria, Northwestern Nigeria and the 24.5% reported from a study in Sudan.33 The prevalence rates of overweight in the index study (35.5%) and the study from Zaria (35.0%) were however similar. Obesity in our study was more prevalent among women compared with men. Other studies, in patients with and without diabetes, have reported similar gender disparity in the prevalence of obesity.6,19,20 The higher obesity rate among females is attributed to short intervals between pregnancies, hormonal imbalance related to menopause, use of oral contraceptive pills, dietary habit and sedentary lifestyle.19
We found the mean values of WC and WhtR to be significantly higher among patients with generalized obesity compared with non-obese patients in this study. The positive and significant correlation between BMI and both WC and WhtR may explain this observation. We detected central obesity (defined by WC) in 50.9% of our study participants. This is lower than the 91.7% reported by Fasanmade and Okubadejo21 from Lagos Southwestern Nigeria, and the 72% reported by Unadike et al8 from Uyo, in the South-South geopolitical zone of the country. These findings reflect regional differences in obesity rates across Nigeria.22 Possible reasons for these differences include the slender and taller stature of the northerners, occupational differences, as well as cultural attitudes to affluence and desire for weight gain, especially among women for marital purposes.22,23
The prevalence of central obesity defined by WHR in our study is higher than that reported by Olebu et al19 from Enugu, Southeastern Nigeria, but lower than the rate reported from the northwestern city of Zaria.6 The mean WHR in the latter study was higher than in our study. In addition, the study from Zaria had more men than women, which is in contrast with the index study. WHR derives from two body circumferences (WC and HC), the presence of larger mean HC in women than men in our study may be responsible for the lower mean WHR among our study participants and by extension the lower prevalence of central obesity defined by WHR.
WC is increasingly being accepted as the best anthropometric indicator of abdominal adiposity and cardio-metabolic risk.24,25 Other studies have, however, proved that WhtR is a better predictor of cardiovascular risk than any other anthropometric measurement including WC, WHR, BMI and skin-fold thickness.26,27 Yet few studies have used WhtR to assess central obesity among patients with type 2 diabetes. The prevalence of central obesity, measured by WhtR in this study (81.4%), is higher than the 52% found in a study among Bangladeshi adults with type 2 diabetes.28 The mean WhtR in our study is higher than that of the study from Bangladesh,28 which may explain the higher prevalence in the index study. There were more females with central obesity (using WhtR) than males in our study. Sousa et al29 reported similar findings among healthy Brazilian adults.
The prevalence of hypertension in this study (27%) is higher than the 19% reported by Mogre et al30 among patients with type 2 diabetes in Tamale, Ghana, but lower than the 54.2% among patients with diabetes from Benin City, Nigeria.31 Studies from Cameroon10 and Kenya11 also reported higher prevalence of hypertension at 66.4% and 50%, respectively. Differences in the prevalence of hypertension may be due to variations in definitions of hypertension, population characteristics and ethnicity.32 The limitations of our study include its cross-sectional design and the relatively small sample size employed. The latter makes generalization of our findings difficult.
Conclusion
The prevalence of obesity in our cohort of patients with type 2 diabetes is high. The predominant form of obesity among our patients was central obesity, which was most prevalent when indexed by WHR. The WhtR was as good as the WHR, but fared better than WC in detecting central obesity in our patients.
Acknowledgment
We thank the Clinical Assistants at the Diabetes clinic of Aminu Kano Teaching Hospital, Kano, for ensuring orderliness during data collection.
Disclosure
The authors report no conflicts of interest in this work.
References
1. International Diabetes Federation, Diabetes Atlas.
2. Wild S, Roglic G, Green A, Sicree R, King H. Global prevalence of diabetes: estimates for the year 2000 and projections for 2030. Diabetes Care. 2004;27:1047–1053. doi:10.2337/diacare.27.5.1047
3. Godfrey R, Julien M. Urbanization and health. Clin Med. 2005;5:137–141. doi:10.7861/clinmedicine.5-2-137
4. Abdullah A, Peeters A, de Courten M, et al. The magnitude of association between overweight and obesity and the risk of diabetes: a metaanalysis of prospective cohort studies. Diabetes Res Clin Pract. 2010;89(3):309–319. doi:10.1016/j.diabres.2010.04.012
5. Kaur N, Sidhu S. Prevalence of obesity and hypertension in newly diagnosed Type 2 Diabetes Mellitus (T2dm) patients of Amritsar. J Exercise Sci Physiother. 2012;8(2):113–118.
6. Bakari AG, Onyemelukwe GC. Indices of obesity among type-2 diabetic Hausa-Fulani Nigerians. Int J Diabetes Metab. 2005;13:28–29. doi:10.1159/000497571
7. Udenze IC, Azinge EC, Arikawe AP, et al. The prevalence of metabolic syndrome in persons with type 2 diabetes at the Lagos University Teaching Hospital, Lagos, Nigeria. West Afr J Med. 2013;32(2):126–132.
8. Unadike BC, Akpan NA, Peters EJ, et al. Prevalence of the metabolic syndrome among patients with type 2 diabetes mellitus in Uyo, Nigeria. Afr J Endocrinol Metab. 2009;8(1):7–9.
9. National Institutes of Health (NIH) National Heart, Lung, and Blood Institute’s (NHLBI) North American Association for the Study of Obesity (NAASO). The Practical Guide: Identification, Evaluation, and Treatment of Overweight and Obesity in Adults. Rockville, MD:National Institutes of Health; 2000. (Publication no. 00-4084).
10. Ducorps M, Bauduceau B, Mayaudon H, et al. Prevalence of hypertension in a Black African diabetic population. Arch Mal Coeur Vaiss. 1996;89(8):1069–1073.
11. Otieno CF, Vaghela V, Mwendwa FW, et al. Cardiovascular risk factors in patients with type 2 diabetes mellitus in Kenya: levels of control attained at the outpatient diabetic Clinic of Kenyatta National Hospital, Nairobi. East Afr Med J. 2005;82(14):S184–S190. doi:10.4314/eamj.v82i12.9380
12. Rådholm K, Chalmers J, Ohkuma T, et al. Use of the waist-to-height ratio to predict cardiovascular risk in patients with diabetes: results from the ADVANCE-ON study. Diabetes Obes Metab. 2018;20(8):1903–1910. doi:10.1111/dom.13311
13. National High Blood Pressure Education Program. The seventh report of the Joint National Committee on prevention, detection, evaluation and treatment of high blood pressure. JAMA. 2003;289:2560–2572. doi:10.1001/jama.289.19.2560
14. Socks DB. Carbohydrate. In: Tietz Fundamentals of Clinical Chemistry. Fifth Edition. Carl A Burtis and Edward R Ashwood eds.Philadelphia: WB Saunders 2001:444–448.
15. Ogbera AO. Prevalence and gender distribution of the metabolic syndrome. Diabetol Metab Syndr. 2010;2:1. doi:10.1186/1758-5996-2-1
16. Isezuo SA, Ezunu E. Demographic and clinical correlates of metabolic syndrome in native African Type 2 diabetes patients. J Natl Med Assoc. 2005;97:557–563.
17. Alebiosu OC, Odusan BO. Metabolic syndrome in subjects with type 2 diabetes mellitus. J Natl Med Assoc. 2004;96(6):817–821.
18. Kyrou I, Kumar S. Weight management in overweight and obese patients with type 2 diabetes mellitus. Br J Diabetes Vasc Dis. 2010;10:274. doi:10.1177/1474651410388976
19. Olebu J, Ajaebili NA, Maduforo AN. Assessment of prevalence of obesity among newly diagnosed Type 2 diabetic patients in diabetic out patient clinic, of University of Nigeria Teaching Hospital (UNTH), Ituku/ Ozalla, Enugu State, Nigeria. Adv Life Sci Technol. 2014;24:60–64.
20. Gezawa ID, Puepet FH, Mubi BM, et al. Prevalence of overweight and obesity in Maiduguri, Northeastern Nigeria. Niger J Med. 2013;22(3):171–174.
21. Fasanmade OA, Okubadejo NU. Magnitude and gender distribution of obesity and abdominal adiposity in Nigerians with type 2 diabetes. Niger J Clin Pract. 2007;10(1):52–57.
22. Okafor CI, Gezawa ID, Sabir AA, et al. Obesity, overweight, and underweight among urban Nigerians. Niger J Clin Pract. 2014;17:743–749. doi:10.4103/1119-3077.144389
23. Brink PJ. The fattening room among the Annang of Nigeria. Med Anthropol. 1989;12:131–143. doi:10.1080/01459740.1989.9966016
24. Vazquez G, Duval S, Jacobs DR
25. Ashwell M, Gunn P, Gibson S. Waist-to-height ratio is a better screening tool than waist circumference and BMI for adult cardiometabolic risk factors: systematic review and meta-analysis. Obes Rev. 2012;13:275–286. doi:10.1111/j.1467-789X.2011.00952.x
26. Hsieh SD, Muto T. Metabolic syndrome in Japanese men and women with special reference to the anthropometric criteria for the assessment of obesity: proposal to use the waist-to-height ratio. Prev Med. 2006;42:135–139. doi:10.1016/j.ypmed.2005.08.007
27. Sayeed MA, Mahtab H, Latif ZA, et al. Waist-to-height ratio is a better obesity index than body mass index and waist-to-hip ratio for predicting diabetes, hypertension and lipidemia. Bangladesh Med Res Counc Bull. 2003;29:1–10.
28. Flora MS, Mascie-Taylor CGN, Rahman M. Waist-to-height ratio and socio-demographic characteristics of Bangladeshi adults. Ibrahim Med Coll J. 2010;4(2):49–58. doi:10.3329/imcj.v4i2.6496
29. Sousa TF, Naha MV, Silva DAS, et al. Factors associated with central obesity in adults from Florianópolis, Santa Catarina: a population based-study. Rev Bras Epidemiol. 2011;14(2):296–309. doi:10.1590/S1415-790X2011000200011
30. Mogre V, Abedandi R, Salifu ZS. Correlates and predictors of increasing waist circumference in patients with Type 2 diabetes mellitus: a cross-sectional study. Int Sch Res Notices. 2014;2014:318569.
31. Unadike BC, Eregie A, Ohwovoriole AE. Prevalence of hypertension amongst persons with diabetes mellitus in Benin City, Nigeria. Niger J Clin Pract. 2011;14(3):300–302. doi:10.4103/1119-3077.86772
32. Baskar V, Kamalakannan D, Holland MR, Singh BM. Does ethnic origin have an independent impact on hypertension and diabetic complications? Diabetes, Obes Metab. 2006;8(2):214–219. doi:10.1111/dom.2006.8.issue-2
33. Ali YA, Almobarak AO, Awadalla H, Elmadhoun WM, Ahmed MH. Obesity among Sudanese adults with diabetes: a population based survey. Ann Transl Med. 2017;5(12):252. doi:10.21037/atm
 © 2019 The Author(s). This work is published and licensed by Dove Medical Press Limited. The full terms of this license are available at https://www.dovepress.com/terms.php and incorporate the Creative Commons Attribution - Non Commercial (unported, v3.0) License.
By accessing the work you hereby accept the Terms. Non-commercial uses of the work are permitted without any further permission from Dove Medical Press Limited, provided the work is properly attributed. For permission for commercial use of this work, please see paragraphs 4.2 and 5 of our Terms.
© 2019 The Author(s). This work is published and licensed by Dove Medical Press Limited. The full terms of this license are available at https://www.dovepress.com/terms.php and incorporate the Creative Commons Attribution - Non Commercial (unported, v3.0) License.
By accessing the work you hereby accept the Terms. Non-commercial uses of the work are permitted without any further permission from Dove Medical Press Limited, provided the work is properly attributed. For permission for commercial use of this work, please see paragraphs 4.2 and 5 of our Terms.